emission estimate methodology for maritime navigation · pdf filefactors (see 1. obtain fuel...
TRANSCRIPT

Emission estimate methodology for maritime navigation
Carlo Trozzi Techne Consulting srl, Via Gregorio Ricci Curbastro, 3 - I00153 Roma, Italy
Co-leader of the Combustion & Industry Expert Panel - Task Force on Emission Inventories and
Projections, under the Convention on Long-range Transboundary Air Pollution.
ABSTRACT
The paper reports about the methodology for estimate emissions from navigation, recently updated in the frame of maintenance of the EMEP/EEA air pollutant emission inventory guidebook1 (the Guidebook). Emissions can be estimated at different levels of complexity. In the Guidebook these are expressed in three tiers of increasing complexity (in similar way with the 2006 IPCC Intergovernmental Panel on Climate Change Guidelines for National Greenhouse Gas Inventories). The paper briefly introduces the different tiers and describes in detail the most complete methodology (tier 3) for estimate emission in cruise (open sea), manoeuvring (approaching harbours) and hotelling (at the dock in port). The methodology uses both installed capacity and fuel consumption as alternative for the emissions estimates and take into account both the main and auxiliary engines. Where fuel consumptions are know the emissions can be computed with fuel related emission factors for the different navigation phases (cruise, hotelling, manoeuvring). Where fuel consumptions are not know, a specific methodology is proposed for computing emissions based on installed power. Finally, when installed power is not know specific functions are proposed to evaluate installed power from gross tonnage. The functions are derived, for different ship types, using data on about 100.000 ships from Lloyd s register database. Finally simplified methodologies are introduced for use when detailed information is not available.
INTRODUCTION
A complete methodology for the estimate of air pollutant emissions from ships, in port environment and in navigation, has been developed for the first in the framework of MEET Project (Methodologies for estimating air pollutant emissions from transport) under the transport RTD program of the European Commission fourth framework program2. The methodology was reviewed and updated in 20063.
In the last ten years, the general approach adopted by the MEET project was discussed and used with additions and corrections in different contexts4,5,6,7.
Actually the EMEP/EEA air pollutant emission inventory guidebook (Guidebook) and more precisely in Chapter 1.A.3.d Navigation (Navigation chapter), can be considered as a reference for emission estimate at international level. The Guidebook is designed to facilitate reporting of emission inventories by countries to the UNECE Convention on Long-range Transboundary Air Pollution and the EU National Emission Ceilings Directive. It is also recommended by IPCC Guidelines as a source of air pollution emission factors for the indirect greenhouse gases that Parties report under UNFCCC. The Task Force on Emission Inventories and Projections (TFEIP) is responsible for the on-going maintenance and improvement of the Guidebook's technical content.
Emissions from Navigation can be estimated at different levels of complexity. Within the 2006 IPCC (Intergovernmental Panel on Climate Change) Guidelines for National Greenhouse Gas Inventories (IPCC Guidelines) and adopted by the Guidebook, these are expressed in three tiers of increasing complexity.
The Tier 1 method is a simple method using default emission factors only. To upgrade a Tier 1 to a Tier 2 method, the default emission factors should be replaced by country-specific or technology-specific emission factors. This might also require a further split of the activity data over a range of different technologies, implicitly aggregated in the Tier 1 method. A Tier 3 method could be regarded as
a method that uses the latest scientific knowledge in more sophisticated approaches and models; more detailed definitions follow.
The paper, after recalling the international regulations, reports and discusses the estimate methods (tiers) for the navigation of the Guidebook and related information: literature review of the emissions estimates methodology and emission factors and statistical analysis of Lloyd s database (years 1997 and 2010) for world fleet characterization regarding fuel consumption and others parameters.
INTERNATIONAL REGULATIONS
The Marine Environment Protection Committee (MEPC) of International Marine Organization (IMO) has approved amendments to Marpol (short for marine pollution , International Convention for the Prevention of Pollution from Ships) Annex VI in October 2008 in order to strengthen the emission standards for NOx and the sulphur contents of heavy fuel oil used by ship engines.
The current Marpol 73/78 Annex VI legislation on NOx emissions, formulated by IMO is relevant for diesel engines with a power output higher than 130 kW, which are installed on a ship constructed on or after 1 January 2000 and diesel engines with a power output higher than 130 kW which undergo major conversion on or after 1 January 2000.
The Marpol Annex VI, as amended by IMO in October 2008, considers a three tiered approach as:
Tier I: diesel engines (> 130 kW) installed on a ship constructed on or after 1 January 2000 and prior to 1 January 2011;
Tier II: diesel engines (> 130 kW) installed on a ship constructed on or after 1 January 2011;
Tier III: diesel engines (> 130 kW) installed on a ship constructed on or after 1 January 2016.
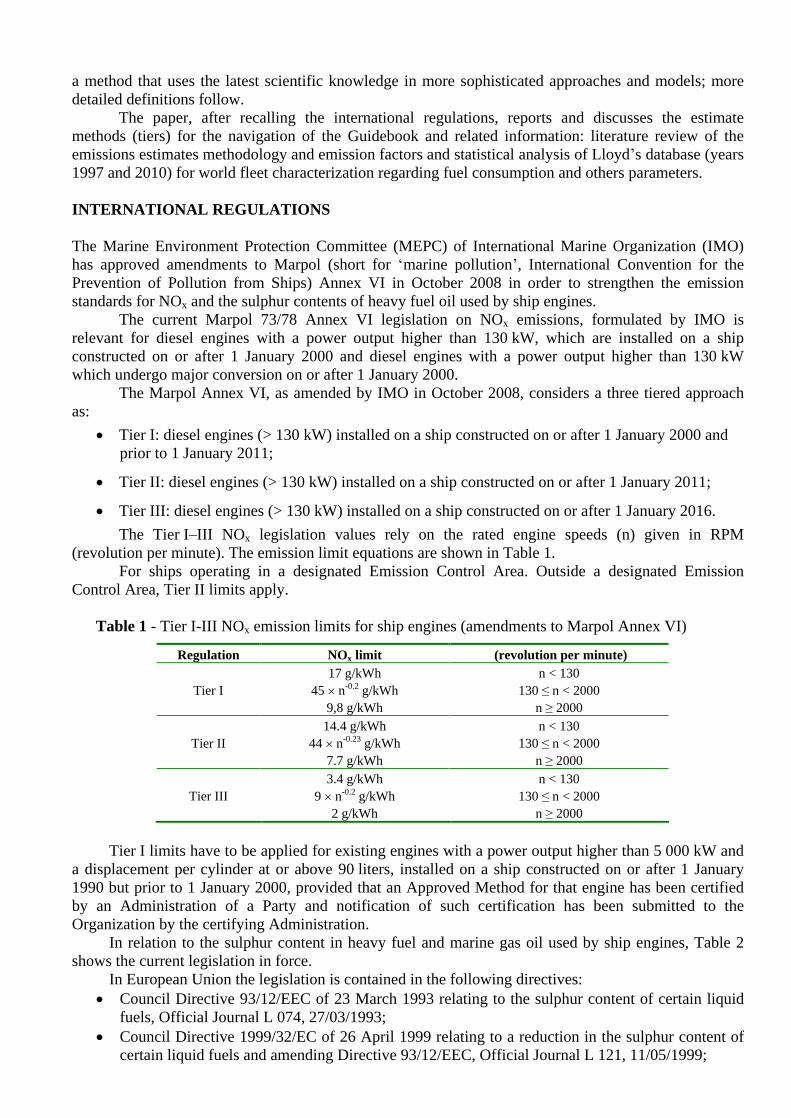
The Tier I III NOx legislation values rely on the rated engine speeds (n) given in RPM (revolution per minute). The emission limit equations are shown in Table 1.
For ships operating in a designated Emission Control Area. Outside a designated Emission Control Area, Tier II limits apply.
Table 1 - Tier I-III NOx emission limits for ship engines (amendments to Marpol Annex VI)
Tier I limits have to be applied for existing engines with a power output higher than 5 000 kW and a displacement per cylinder at or above 90 liters, installed on a ship constructed on or after 1 January 1990 but prior to 1 January 2000, provided that an Approved Method for that engine has been certified by an Administration of a Party and notification of such certification has been submitted to the Organization by the certifying Administration.
In relation to the sulphur content in heavy fuel and marine gas oil used by ship engines, Table 2 shows the current legislation in force.
In European Union the legislation is contained in the following directives:
Council Directive 93/12/EEC of 23 March 1993 relating to the sulphur content of certain liquid fuels, Official Journal L 074, 27/03/1993;
Council Directive 1999/32/EC of 26 April 1999 relating to a reduction in the sulphur content of certain liquid fuels and amending Directive 93/12/EEC, Official Journal L 121, 11/05/1999;
Regulation NOx limit (revolution per minute)
Tier I 17 g/kWh
45 n-0.2 g/kWh 9,8 g/kWh
n < 130 130 n < 2000
n 2000
Tier II 14.4 g/kWh
44 n-0.23 g/kWh 7.7 g/kWh
n < 130 130 n < 2000
n 2000
Tier III 3.4 g/kWh
9 n-0.2 g/kWh 2 g/kWh
n < 130 130 n < 2000
n 2000

Directive 2005/33/EC of the European Parliament and of the Council of 6 July 2005 amending Directive 1999/32/EC, Official Journal L 191 , 22/07/2005.
Table 2 - Current regulation in relation to marine fuel quality
Heavy fuel oil Gas oil Legislation Region S-% Impl. date S-% Impl. Date
SECA Baltic sea 1.5 19.05.2006 SECA North sea 1.5 21.11.2007 Marpol Annex VI Outside SECA 4.5 19.05.2006 SECA 1 01.03.2010 SECA 0.1 01.01.2015
3.5 01.01.2012 Marpol Annex VI amendments
Outside SECA 0.5 01.01.20202
EU-Directive 1993/12 None 0.21 1.10.1994 EU-Directive 1999/32 None 0.2 1.1.2000
SECA Baltic sea 1.5 11.08.2006 0.1 1.1.2008 SECA North sea 1.5 11.08.2007 0.1 1.1.2008 EU-Directive 2005/33 Outside SECA s None 0.1 1.1.2008
Notes 1. Sulphur content limit for fuel sold inside EU. 2. Subject to a feasibility review to be completed no later than 2018, to determine the availability of fuel oil to comply with the fuel oil
standard set forth in the Amendment. If the conclusion of such a review becomes negative the effective date would default 1 January 2025.
DETAILED EMISSION ESTIMATES PROCEDURES
In the following a detailed ship movement methodology is described (the methodology is quoted as Tier 3 in EMEP/EEA air pollutant emission inventory guidebook). This methodology must be used
when detailed ship movement data as well as technical information on the ships (e.g. engine size and technology, power installed or fuel use, hours in different activities) are available.
For commercial vessels, the methodology calculates the emissions from navigation by summing the emissions on a trip by trip basis. For a single trip the emissions can be expressed as:
CruisinggManouverinHotellingTrip EEEE
The total inventory is the sum over all trips of all vessels during the year. In practice it may be that data is collected for a representative sample of vessels over trips over a representative period of the year. In this case the summed emissions should be scaled up to give the total for all trips and vessels over the whole year.
Two different procedures can be used to estimate emission: starting with fuel consumptions or engines power.
When fuel consumptions for each phase is known, then emissions of pollutant i can be computed for a complete trip by:
ppm,j,i,
EFpm,j,
FCE mj,i,Trip,
where: ETrip = emission over a complete trip (tonnes), FC = fuel consumption (tonnes), EF = emission factor (kg/tonne), i = pollutant. j = engine type (slow-, medium-, and high-speed diesel, gas turbine and steam turbine). m = fuel type (bunker fuel oil, marine diesel oil/marine gas oil (MDO/MGO), gasoline), p = the different phase of trip (cruise, hotelling, manoeuvring).
The following steps are required to estimate emissions from fuel consumptions. This procedure is applicable only where detailed information about fuel consumptions for each ship/engine type combination in the different navigation phases is available; otherwise use the engine power based procedure below.

1. Obtain fuel consumption for each individual ship, engine type/fuel class and ship activity. This may
be done for the whole year or a representative sample of the year, for all ships or for a representative sample of the ships for each ship category and engine type/fuel class. This choice will depend on the resources available and the required accuracy of the study.
2. Calculate emissions for each ship category and engine type/fuel class multiplying by the emission factors (see Table 3).
When fuel consumption per trip phase is not known, then a different methodology is proposed for computing emissions, based on installed power and time spent in the different navigation phases. Emissions can be calculated from a detailed knowledge of the installed main and auxiliary engine power, load factor and total time spent, in hours, for each phase using the following equation.
p e p,m,j,i,eEF
eLF
eP
PT
m,j,i,TripE
where: ETrip = emission over a complete trip (tonnes), EF = emission factor (kg/kW), LF = engine load factor (%), P = engine nominal power (kW), T = time (hours), e = engine category (main, auxiliary), i = pollutant (NOx, NMVOC, PM), j = engine type (slow-, medium-, and high-speed diesel, gas turbine and steam turbine). m = fuel type (bunker fuel oil, marine diesel oil/marine gas oil, gasoline), p = the different phase of trip (cruise, hotelling, manoeuvring).
The cruise time, if unknown, can be calculated as:
(km/hr)Speed Cruising Average
(km)Cruised DistanceCruising )hours(T
The following steps are required to estimate emissions from engine power. 1. Obtain ship movement data: place of departure, place of arrival, time of departure and time of arrival
for each individual ship. This may be done for the whole year or a representative sample of the year, for all ships or for a representative sample of the ships. This choice will depend on the resources available and the required accuracy of the study.
2. Determine the sailing routes and distances between ports. This may be done individually or fitted into the main shipping lanes. A GIS (Geographical Information System) is useful, but not necessary, for this task. If a GIS is not available, there are standard distance tables for distances between main ports
3. Characterize each ship by category (as in Table 6) and engine type/fuel class (if unknown use Table 7) and record the installed main or auxiliary engine power. A ships register, giving the size and engine type of individual ships, is useful for this. Such a register of the national fleet should be available in most countries but usually only covering national ships. Lloyds Register s Register of Ships will provide details of national and international shipping greater than 100 GT. If engine power is unknown, and only gross tonnage (GT) is available, installed main engine power can be obtained from Table 8 (with reference to 1997 world fleet, 2010 world fleet and 2006 Mediterranean Sea fleet) and then installed auxiliary engine power from Table 9 (with reference to 2010 world fleet and 2006 Mediterranean Sea fleet while 1997 world fleet data are not available).
4. Determine the total sailing time for each ship category and engine type/fuel class, either based on the distance and average cruise speed (Table 10) or time of departure and arrival. The choice should be based on an assessment of the quality of the data.
5. Determine total hotelling and manoeuvring time for each ship category and engine type/fuel class by port survey or on the basis of average time spent values reported in Table 10.
6. Calculate emissions for each ship category and engine type/fuel class multiplying total time spent in each phases as determined in previous steps 4 and 5 by the installed main and auxiliary engine
power, for each ship category, calculated as determined in step 3, load factors (and for main engine % time of operation) from Table 11 and emission factors from Table 4.
EMISSION FACTORS
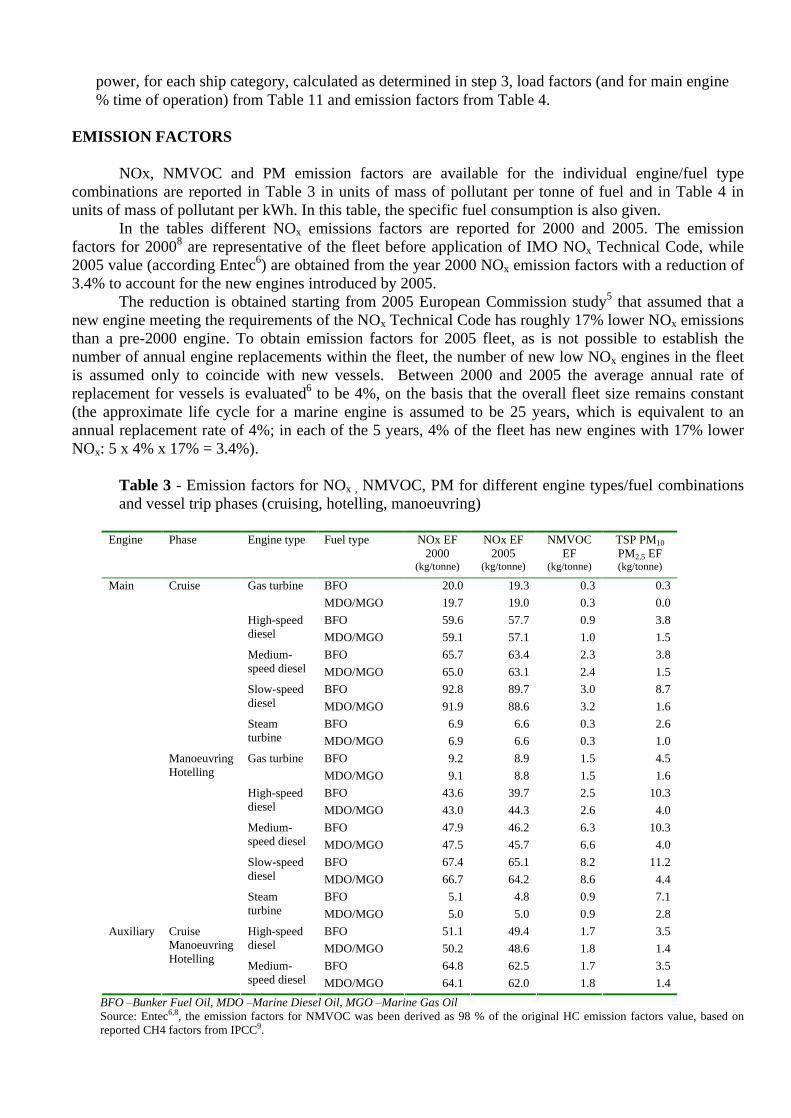
NOx, NMVOC and PM emission factors are available for the individual engine/fuel type combinations are reported in Table 3 in units of mass of pollutant per tonne of fuel and in Table 4 in units of mass of pollutant per kWh. In this table, the specific fuel consumption is also given.
In the tables different NOx emissions factors are reported for 2000 and 2005. The emission factors for 20008 are representative of the fleet before application of IMO NOx Technical Code, while 2005 value (according Entec6) are obtained from the year 2000 NOx emission factors with a reduction of 3.4% to account for the new engines introduced by 2005.
The reduction is obtained starting from 2005 European Commission study5 that assumed that a new engine meeting the requirements of the NOx Technical Code has roughly 17% lower NOx emissions than a pre-2000 engine. To obtain emission factors for 2005 fleet, as is not possible to establish the number of annual engine replacements within the fleet, the number of new low NOx engines in the fleet is assumed only to coincide with new vessels. Between 2000 and 2005 the average annual rate of replacement for vessels is evaluated6 to be 4%, on the basis that the overall fleet size remains constant (the approximate life cycle for a marine engine is assumed to be 25 years, which is equivalent to an annual replacement rate of 4%; in each of the 5 years, 4% of the fleet has new engines with 17% lower NOx: 5 x 4% x 17% = 3.4%).
Table 3 - Emission factors for NOx , NMVOC, PM for different engine types/fuel combinations and vessel trip phases (cruising, hotelling, manoeuvring)
Engine Phase Engine type Fuel type NOx EF 2000
NOx EF 2005
NMVOC EF
TSP PM10
PM2,5 EF
(kg/tonne) (kg/tonne) (kg/tonne) (kg/tonne)
BFO 20.0
19.3
0.3
0.3
Gas turbine MDO/MGO 19.7
19.0
0.3
0.0
BFO 59.6
57.7
0.9
3.8
High-speed diesel MDO/MGO 59.1
57.1
1.0
1.5
BFO 65.7
63.4
2.3
3.8
Medium-speed diesel MDO/MGO 65.0
63.1
2.4
1.5
BFO 92.8
89.7
3.0
8.7
Slow-speed diesel MDO/MGO 91.9
88.6
3.2
1.6
BFO 6.9
6.6
0.3
2.6
Cruise
Steam turbine MDO/MGO 6.9
6.6
0.3
1.0
BFO 9.2
8.9
1.5
4.5
Gas turbine MDO/MGO 9.1
8.8
1.5
1.6
BFO 43.6
39.7
2.5
10.3
High-speed diesel MDO/MGO 43.0
44.3
2.6
4.0
BFO 47.9
46.2
6.3
10.3
Medium-speed diesel MDO/MGO 47.5
45.7
6.6
4.0
BFO 67.4
65.1
8.2
11.2
Slow-speed diesel MDO/MGO 66.7
64.2
8.6
4.4
BFO 5.1
4.8
0.9
7.1
Main
Manoeuvring
Hotelling
Steam turbine MDO/MGO 5.0
5.0
0.9
2.8
BFO 51.1
49.4
1.7
3.5
High-speed diesel MDO/MGO 50.2
48.6
1.8
1.4
BFO 64.8
62.5
1.7
3.5
Auxiliary
Cruise Manoeuvring
Hotelling Medium-speed diesel MDO/MGO 64.1
62.0
1.8
1.4
BFO Bunker Fuel Oil, MDO Marine Diesel Oil, MGO Marine Gas Oil Source: Entec6,8, the emission factors for NMVOC was been derived as 98 % of the original HC emission factors value, based on reported CH4 factors from IPCC9.

Table 4 - Emission factors for NOx , NMVOC, PM and Specific Fuel Consumption for different
engine types/fuel combinations and vessel trip phases (cruising, hotelling, manoeuvring) in g/kWh
Engine Phase Engine type Fuel type NOx EF 2000
NOx EF 2005
NMVOC EF
TSP PM10
PM2,5 EF Specific fuel consumption
(g/kWh) (g/kWh) (g/kWh) (g/kWh) (g fuel/kWh)
BFO 6.1
5.9
0.1
0.1
305.0
Gas turbine
MDO/MGO 5.7
5.5
0.1
0.0
290.0
BFO 12.7
12.3
0.2
0.8
213.0
High-speed diesel MDO/MGO 12.0
11.6
0.2
0.3
203.0
BFO 14.0
13.5
0.5
0.8
213.0
Medium-speed diesel MDO/MGO 13.2
12.8
0.5
0.3
203.0
BFO 18.1
17.5
0.6
1.7
195.0
Slow-speed diesel MDO/MGO 17.0
16.4
0.6
0.3
185.0
BFO 2.1
2.0
0.1
0.8
305.0
Cruise
Steam turbine MDO/MGO 2.0
1.9
0.1
0.3
290.0
BFO 3.1
3.0
0.5
1.5
336.0
Gas turbine MDO/MGO 2.9
2.8
0.5
0.5
319.0
BFO 10.2
9.3
0.6
2.4
234.0
High-speed diesel MDO/MGO 9.6
9.9
0.6
0.9
223.0
BFO 11.2
10.8
1.5
2.4
234.0
Medium-speed diesel MDO/MGO 10.6
10.2
1.5
0.9
223.0
BFO 14.5
14.0
1.8
2.4
215.0
Slow-speed diesel MDO/MGO 13.6
13.1
1.8
0.9
204.0
BFO 1.7
1.6
0.3
2.4
336.0
Main
Manoeuvring Hotelling
Steam turbine MDO/MGO 1.6
1.6
0.3
0.9
319.0
BFO 11.6
11.2
0.4
0.8
227.0
High-speed diesel MDO/MGO 10.9
10.5
0.4
0.3
217.0
BFO 14.7
14.2
0.4
0.8
227.0
Auxiliary Cruise Manoeuvring Hotelling
Medium-speed diesel MDO/MGO 13.9
13.5
0.4
0.3
217.0
BFO Bunker Fuel Oil, MDO Marine Diesel Oil, MGO Marine Gas Oil Source: Entec6,8, the emission factors for NMVOC was been derived as 98 % of the original HC emission factors value, based on reported CH4 factors from IPCC9.
For the other pollutants, emission factors are available only related to fuel without engine of phase specification (Table 5); to utilize emission factors with methodology based on installed power, use specific fuel consumption from Table 4.
Table 5 - Emission factors for pollutants other than NOx , NMVOC, PM
Pollutant BFO MDO/MGO Unit Reference CO 7.4 7.4 kg/tonne fuel Lloyd s Register10
SOx 20 * S (1) 20 * S (1) kg/tonne fuel Lloyd s Register10
Pb 0.18 0.13 g/tonne fuel Lloyd s Register10 and Cooper and Gustafsson11 (average value) Cd 0.02 0.01 g/tonne fuel Lloyd s Register10 and Cooper and Gustafsson11 (average value) Hg 0.02 0.03 g/tonne fuel Lloyd s Register10 and Cooper and Gustafsson11 (average value) As 0.68 0.04 g/tonne fuel Lloyd s Register10 and Cooper and Gustafsson11 (average value) Cr 0.72 0.05 g/tonne fuel Lloyd s Register10 and Cooper and Gustafsson11 (average value) Cu 1.25 0.88 g/tonne fuel Lloyd s Register10 and Cooper and Gustafsson11 (average value) Ni 32 1 g/tonne fuel Lloyd s Register10 and Cooper and Gustafsson11 (average value) Se 0.21 0.10 g/tonne fuel Lloyd s Register10 and Cooper and Gustafsson11 (average value) Zn 1.20 1.2 g/tonne fuel Lloyd s Register10 and Cooper and Gustafsson11 (average value) PCDD/F 0.47 0.13 TEQmg/tonne Cooper12
HCB 0.14 0.08 mg/tonne Cooper12
PCB 0.57 0.38 mg/tonne Cooper12
Notes 1. S = percentage sulphur content in fuel
WORLD FLEET CHARACTERIZATION
The world fleet characterization is based on an analysis of the available literature on the subject and on statistical analysis of Lloyd s database for 1999 and 2010. The Lloyd database for 1999 was first analyzed in the frame of MEET project2 while the 2010 fleet was analyzed in the frame of a special project13 to update EMEP/EEA Guidebook1.
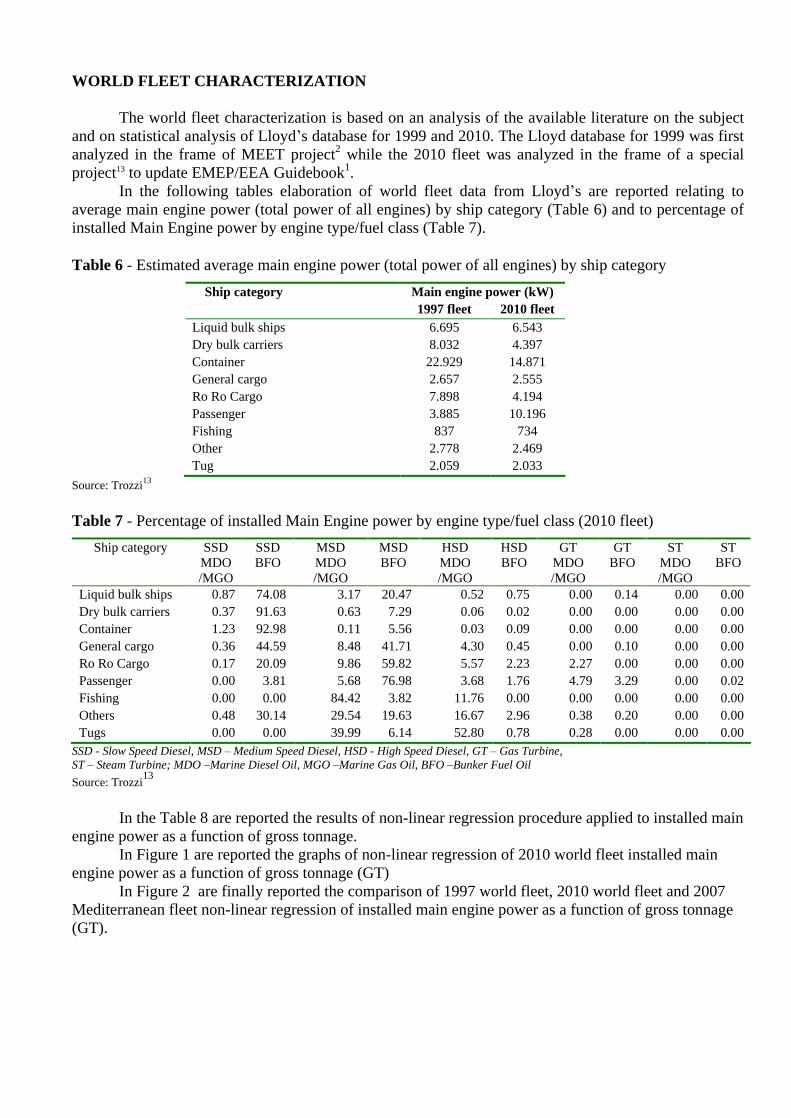
In the following tables elaboration of world fleet data from Lloyd s are reported relating to average main engine power (total power of all engines) by ship category (Table 6) and to percentage of installed Main Engine power by engine type/fuel class (Table 7).
Table 6 - Estimated average main engine power (total power of all engines) by ship category
Source: Trozzi13
Table 7 - Percentage of installed Main Engine power by engine type/fuel class (2010 fleet)
Ship category SSD MDO /MGO
SSD BFO
MSD MDO /MGO
MSD BFO
HSD MDO /MGO
HSD BFO
GT MDO /MGO
GT BFO
ST MDO /MGO
ST BFO
Liquid bulk ships 0.87 74.08 3.17 20.47 0.52 0.75 0.00 0.14 0.00 0.00 Dry bulk carriers 0.37 91.63 0.63 7.29 0.06 0.02 0.00 0.00 0.00 0.00 Container 1.23 92.98 0.11 5.56 0.03 0.09 0.00 0.00 0.00 0.00 General cargo 0.36 44.59 8.48 41.71 4.30 0.45 0.00 0.10 0.00 0.00 Ro Ro Cargo 0.17 20.09 9.86 59.82 5.57 2.23 2.27 0.00 0.00 0.00 Passenger 0.00 3.81 5.68 76.98 3.68 1.76 4.79 3.29 0.00 0.02 Fishing 0.00 0.00 84.42 3.82 11.76 0.00 0.00 0.00 0.00 0.00 Others 0.48 30.14 29.54 19.63 16.67 2.96 0.38 0.20 0.00 0.00 Tugs 0.00 0.00 39.99 6.14 52.80 0.78 0.28 0.00 0.00 0.00
SSD - Slow Speed Diesel, MSD Medium Speed Diesel, HSD - High Speed Diesel, GT Gas Turbine, ST Steam Turbine; MDO Marine Diesel Oil, MGO Marine Gas Oil, BFO Bunker Fuel Oil
Source: Trozzi13
In the Table 8 are reported the results of non-linear regression procedure applied to installed main engine power as a function of gross tonnage.
In Figure 1 are reported the graphs of non-linear regression of 2010 world fleet installed main engine power as a function of gross tonnage (GT)
In Figure 2 are finally reported the comparison of 1997 world fleet, 2010 world fleet and 2007 Mediterranean fleet non-linear regression of installed main engine power as a function of gross tonnage (GT).
Main engine power (kW) Ship category 1997 fleet 2010 fleet
Liquid bulk ships 6.695 6.543 Dry bulk carriers 8.032 4.397 Container 22.929 14.871 General cargo 2.657 2.555 Ro Ro Cargo 7.898 4.194 Passenger 3.885 10.196 Fishing 837 734 Other 2.778 2.469 Tug 2.059 2.033

Table 8 - Installed main engine power as a function of gross tonnage (GT)
Ship categories 2010 World fleet 1997 World fleet Mediterranean Sea fleet (2006)
Liquid bulk ships 14.755*GT0.6082 29.821*GT0.5552 14.602*GT0.6278
Dry bulk carriers 35.912*GT0.5276 89.571*GT0.4446 47.115*GT0.504
Container 2.9165*GT0.8719 1.3284*GT0.9303 1.0839*GT0.9617
General Cargo 5.56482*GT0.7425 10.539*GT0.6760 1.2763*GT0.9154
Ro Ro Cargo 164.578*GT0.4350 35.93*GT0.5885 45.7*GT0.5237
Passenger 9.55078*GT0.7570 1.39129*GT0.9222 42.966*GT0.6035
Fishing 9.75891*GT0.7527 10.259*GT0.6919 24.222*GT0.5916
Other 59.049*GT0.5485 44.324*GT0.5300 183.18*GT0.4028
Tugs 54.2171*GT0.6420 27.303*GT0.7014
Source: Trozzi13 for 2010 and 1997 world fleets, Entec6, for 2006 Mediterranean Sea fleet (for 1997 fleet was used the conversion 1 GT = 1.875 GRT)
Figure 1- Non-linear regression of 2010 world fleet installed main engine power as a function of gross tonnage (GT)
World Fleet 2010Liquid bulk ships
FC=(17,7549)*GT^(,608209)
020.000
40.00060.000
80.000100.000
120.000140.000
160.000180.000
200.000220.000
240.000260.000
GT
0
10.000
20.000
30.000
40.000
50.000
60.000
70.000
80.000
90.000
kW
World Fleet 2010Dry bulk carriers
FC=(35,9116)*GT^(,527557)
020.000
40.00060.000
80.000100.000
120.000140.000
160.000180.000
200.000
GT
0
5.000
10.000
15.000
20.000
25.000
30.000
kW
World Fleet 2010General cargo
FC=(5,56482)*GT^(,742519)
0 10.000 20.000 30.000 40.000 50.000 60.000 70.000
GT
0
5.000
10.000
15.000
20.000
25.000
30.000
35.000
40.000
45.000
kW
World Fleet 2010Containers
FC=(2,91654)*GT^(,87189)
020.000
40.00060.000
80.000100.000
120.000140.000
160.000180.000
GT
0
20.000
40.000
60.000
80.000
100.000
120.000
kW
World Fleet 2010Ro Ro Cargo
FC=(164,578)*GT^(,435036)
0 10.000 20.000 30.000 40.000 50.000 60.000 70.000 80.000
GT
0
10.000
20.000
30.000
40.000
50.000
60.000
70.000
80.000
90.000
kW
World Fleet 2010Passenger
FC=(9,55077)*GT^(,757035)
020.000
40.00060.000
80.000100.000
120.000140.000
160.000180.000
200.000220.000
240.000
GT
0
20.000
40.000
60.000
80.000
100.000
120.000
140.000
kW
Source: Trozzi13

Figure 2 - Comparison of 1997 world fleet, 2010 world fleet and 2007 Mediterranean fleet non-linear regression of installed main engine power as a function of gross tonnage (GT)
Liquid Bulk Carrier (Tanker)
0
5.000
10.000
15.000
20.000
25.000
30.000
35.000
40.000
07.
000
14.0
0021
.000
28.0
0035
.000
42.0
0049
.000
56.0
0063
.000
70.0
0077
.000
84.0
0091
.000
98.0
0010
5.00
011
2.00
011
9.00
012
6.00
013
3.00
014
0.00
014
7.00
015
4.00
016
1.00
016
8.00
017
5.00
018
2.00
018
9.00
019
6.00
020
3.00
021
0.00
021
7.00
022
4.00
023
1.00
023
8.00
024
5.00
0
Gross tonage
Tot
al M
ain
Eng
ine
Pow
er (
kw)
1997 World fleet
2010 World fleet
Mediterranean sea 2007
Dry Bulk Carriers
0
5.000
10.000
15.000
20.000
25.000
06.
000
12.0
0018
.000
24.0
0030
.000
36.0
0042
.000
48.0
0054
.000
60.0
0066
.000
72.0
0078
.000
84.0
0090
.000
96.0
0010
2.00
010
8.00
011
4.00
012
0.00
012
6.00
013
2.00
013
8.00
014
4.00
015
0.00
015
6.00
016
2.00
016
8.00
017
4.00
018
0.00
018
6.00
019
2.00
019
8.00
0
Gross tonage
Tot
al M
ain
Eng
ine
Pow
er (
kw)
1997 World fleet
2010 World fleet
Mediterranean sea 2007
Containers
0
20.000
40.000
60.000
80.000
100.000
120.000
140.000
05.
000
10.0
0015
.000
20.0
0025
.000
30.0
0035
.000
40.0
0045
.000
50.0
0055
.000
60.0
0065
.000
70.0
0075
.000
80.0
0085
.000
90.0
0095
.000
100.
000
105.
000
110.
000
115.
000
120.
000
125.
000
130.
000
135.
000
140.
000
145.
000
150.
000
155.
000
160.
000
165.
000
170.
000
175.
000
180.
000
Gross tonage
Tot
al M
ain
Eng
ine
Pow
er (
kw)
1997 World fleet
2010 World fleet
Mediterranean sea 2007
General Cargo
0
5.000
10.000
15.000
20.000
25.000
30.000
35.000
40.000
02.
000
4.00
06.
000
8.00
010
.000
12.0
0014
.000
16.0
0018
.000
20.0
0022
.000
24.0
0026
.000
28.0
0030
.000
32.0
0034
.000
36.0
0038
.000
40.0
0042
.000
44.0
0046
.000
48.0
0050
.000
52.0
0054
.000
56.0
0058
.000
60.0
0062
.000
64.0
0066
.000
68.0
0070
.000
Gross tonage
Tot
al M
ain
Eng
ine
Pow
er (
kw)
1997 World fleet
2010 World fleet
Mediterranean sea 2007
Ro Ro Cargo
0
5.000
10.000
15.000
20.000
25.000
30.000
02.
000
4.00
06.
000
8.00
010
.000
12.0
0014
.000
16.0
0018
.000
20.0
0022
.000
24.0
0026
.000
28.0
0030
.000
32.0
0034
.000
36.0
0038
.000
40.0
0042
.000
44.0
0046
.000
48.0
0050
.000
52.0
0054
.000
56.0
0058
.000
60.0
0062
.000
64.0
0066
.000
68.0
0070
.000
Gross tonage
Tot
al M
ain
Eng
ine
Pow
er (
kw)
World fleet 1997
World fleet 2010
Mediterranean sea 2007
Passenger
0
5.000
10.000
15.000
20.000
25.000
30.000
35.000
40.000
45.000
50.000
02.
000
4.00
06.
000
8.00
010
.000
12.0
0014
.000
16.0
0018
.000
20.0
0022
.000
24.0
0026
.000
28.0
0030
.000
32.0
0034
.000
36.0
0038
.000
40.0
0042
.000
44.0
0046
.000
48.0
0050
.000
52.0
0054
.000
56.0
0058
.000
60.0
0062
.000
64.0
0066
.000
68.0
0070
.000
Gross tonage
Tot
al M
ain
Eng
ine
Pow
er (
kw)
1997 World fleet
2010 World fleet
Mediterranean sea 2007
Source: Trozzi13
Finally in Table 9 is reported the estimated average vessel ratio of Auxiliary Engines / Main Engines by ship type, in Table 10 the estimated average cruise speed and average duration of in-port activities and in Table 11 the estimated % load of MCR (Maximum Continuous Rating) of Main and Auxiliary Engine for different ship activity.
Table 9 - Estimated average vessel ratio of Auxiliary Engines / Main Engines by ship type
Ship categories 2010 World fleet Mediterranean Sea fleet (2006)
Liquid bulk ships 0.30 0.35 Dry bulk carriers 0.30 0.39 Container 0.25 0.27 General Cargo 0.23 0.35 Ro Ro Cargo 0.24 0.39 Passenger 0.16 0.27 Fishing 0.39 0.47 Other 0.35 0.18 Tugs 0.10
Source: Trozzi13 for 2010 world feet Entec6 for 2006 Mediterranean Sea fleet
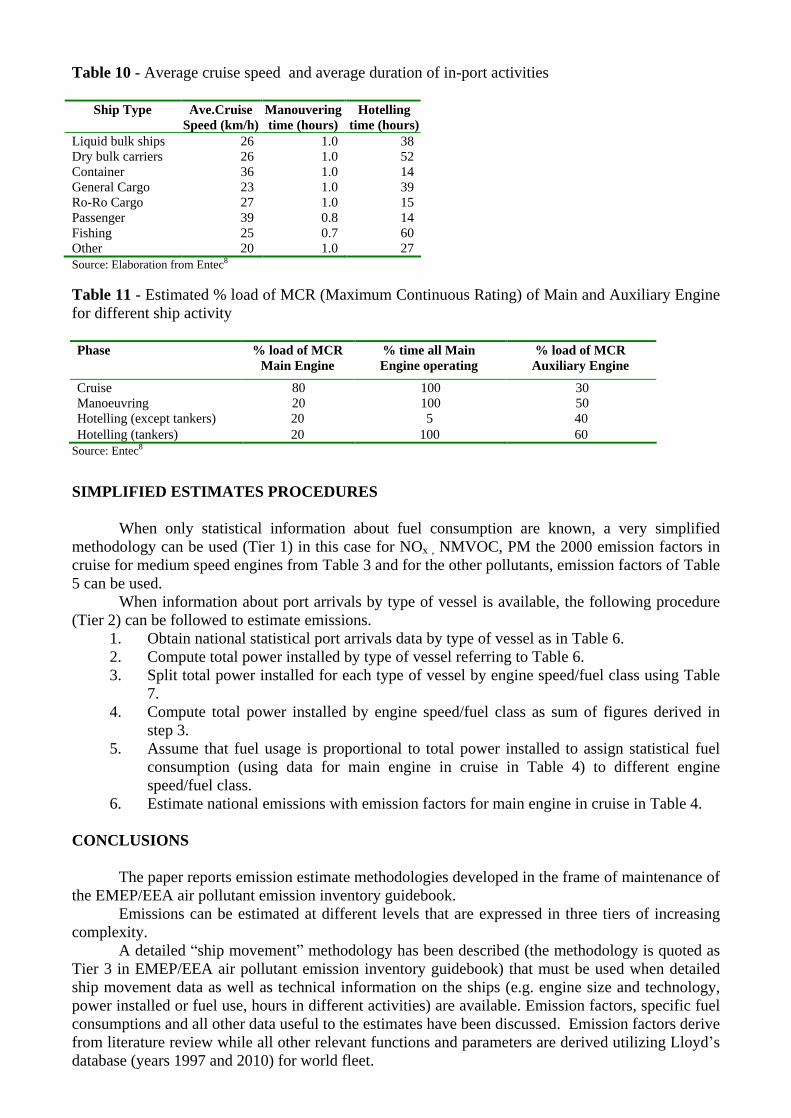
Table 10 - Average cruise speed and average duration of in-port activities
Ship Type Ave.Cruise Speed (km/h)
Manouvering
time (hours)
Hotelling
time (hours)
Liquid bulk ships 26
1.0
38
Dry bulk carriers 26
1.0
52
Container 36
1.0
14
General Cargo 23
1.0
39
Ro-Ro Cargo 27
1.0
15
Passenger 39
0.8
14
Fishing 25
0.7
60
Other 20 1.0
27
Source: Elaboration from Entec8
Table 11 - Estimated % load of MCR (Maximum Continuous Rating) of Main and Auxiliary Engine for different ship activity
Phase % load of MCR Main Engine
% time all Main Engine operating
% load of MCR Auxiliary Engine
Cruise 80 100 30 Manoeuvring 20 100 50 Hotelling (except tankers) 20 5 40 Hotelling (tankers) 20 100 60
Source: Entec8
SIMPLIFIED ESTIMATES PROCEDURES
When only statistical information about fuel consumption are known, a very simplified methodology can be used (Tier 1) in this case for NOx , NMVOC, PM the 2000 emission factors in cruise for medium speed engines from Table 3 and for the other pollutants, emission factors of Table 5 can be used.
When information about port arrivals by type of vessel is available, the following procedure (Tier 2) can be followed to estimate emissions.
1. Obtain national statistical port arrivals data by type of vessel as in Table 6. 2. Compute total power installed by type of vessel referring to Table 6. 3. Split total power installed for each type of vessel by engine speed/fuel class using Table
7. 4. Compute total power installed by engine speed/fuel class as sum of figures derived in
step 3. 5. Assume that fuel usage is proportional to total power installed to assign statistical fuel
consumption (using data for main engine in cruise in Table 4) to different engine speed/fuel class.
6. Estimate national emissions with emission factors for main engine in cruise in Table 4.
CONCLUSIONS
The paper reports emission estimate methodologies developed in the frame of maintenance of the EMEP/EEA air pollutant emission inventory guidebook.
Emissions can be estimated at different levels that are expressed in three tiers of increasing complexity.
A detailed ship movement methodology has been described (the methodology is quoted as Tier 3 in EMEP/EEA air pollutant emission inventory guidebook) that must be used when detailed ship movement data as well as technical information on the ships (e.g. engine size and technology, power installed or fuel use, hours in different activities) are available. Emission factors, specific fuel consumptions and all other data useful to the estimates have been discussed. Emission factors derive from literature review while all other relevant functions and parameters are derived utilizing Lloyd s database (years 1997 and 2010) for world fleet.
Simplified methodologies has been introduce to use when only statistical information about
fuel consumption are known (Tier 1) or when also information about port arrivals by type of vessel are available (Tier 2).
REFERENCES
1. EMEP/EEA air pollutant emission inventory guidebook 2009, Published by EEA (European Environment Agency), Technical report No 9/2009
2. Trozzi C., Vaccaro R. (1999), Ships transport , in: European Commission, Transport Research fourth framework programme strategic research DG VII
99, Meet, Methodologies for calculating transport emissions and energy consumption, European Communities 1999
3. Trozzi C., Vaccaro R. (2006), Methodologies for estimating air pollutant emissions from ships: a 2006 update , Environment & Transport 2nd International Scientific Symposium (including 15th conference Transport and Air Pollution), Reims, France : 12-14 June 2006
4. International Maritime Organization, Study of Greenhouse Gas Emissions from Ships, Issue no. 2 - 31 March 2000
5. Entec (2005), European Commission, Directorate General Environment Service Contract on Ship Emissions: Assignment, Abatement and Market-based Instruments, Task 1 - Preliminary Assignment of Ship Emissions to European Countries , Final Report, August 2005
6. Entec UK Limited (2007), Ship Emissions Inventory
Mediterranean Sea , Final Report for Concawe, April 2007
7. U.S. Environmental Protection Agency (2009), Current Methodologies in Preparing Mobile Source Port-Related Emission Inventories, Final Report Prepared for U.S. Environmental Protection Agency by ICF International, April 2009
8. Entec UK Limited (2002), Quantification of emissions from ships associated with ship movements between ports in the European Community , European Commission Final Report, July 2002
9. IPCC Intergovernmental Panel on Climate Change (1997), Revised 1996 Guidelines for National Greenhouse Gas Inventories, 1997
10. Lloyd s Register (1995), Marine Exhaust Emissions Research Programme, Lloyd s Register Engineering Services, London, 1995
11. Cooper D.A., Gustafsson T. (2004), Methodology for calculating emissions from ships: 1. Update of emission factors , Swedish Methodology for Environmental Data, assignment for Swedish Environmental Protection Agency, 2004
12. Cooper D.A. (2005), HCB, PCB, PCDD and PCDF emissions from ships, Atmospheric Environment 39,4901 (2005)
13. Trozzi C. (2010). Update of Emission Estimate Methodology for Maritime Navigation , Techne Consulting report ETC.EF.10 DD, May 2010

KEYWORD Emission, Emission inventory, Navigation, Ships, Cruise, Manoeuvring, Hotelling, Port, Harbours, Dock, Emission factors, Fuel consumptions, Air pollutants, MEET, LRTAP, UNECE, EMEP