shear capacity assessment of unreinforced masonry · pdf file3 purpose of this research,...
TRANSCRIPT
1
13th World Conference on Earthquake Engineering Vancouver, B.C., Canada
August 1-6, 2004 Paper No. 1698
Shear Capacity Assessment of Unreinforced Masonry Wall
Waon-Ho Yi1, Sang-Hoon Oh2, And Jung-Han Lee3
SUMMARY The objectives of this study are 1) to find out the shear behavior of unreinforced masonry (URM) wall and the variables that affect the shear capacity of URM wall such as the aspect ratio and the thickness of masonry wall, 2) to propose the equation of the shear capacity of URM wall by regression analysis using the test data including the previous research and considering four kinds of failure modes, namely, rocking failure, sliding shear failure, toe crushing failure, and diagonal tension failure, and 3) to propose an ultimate average shear stress of masonry walls for the seismic performance evaluation of unreinforced masonry wall structures. The main variables are the vertical axial stress, the thickness, and the aspect ratio of URM walls. The test results show that the specimens, except the slender wall, are governed by rocking failure mode. The relationship of the shear stress and vertical axial stress is proportionate to each other in square root. The relationship of the shear stress and aspect ratio is linearly proportional. A comparison of the results obtained by FEMA 273 equation and the proposed equation to the test data indicates that the proposed equation is compatible with the test results. As a final result, the ultimate shear stress of the URM walls in Korea is figured to be 2kgf/cm2.
INTRODUCTION In Korea, countermeasures against earthquake disasters such as the seismic capacity evaluation of masonry buildings have not been fully performed, because Korea had not experienced many destructive earthquakes in the past. However, with more than four hundred earthquakes with medium intensity that centered on off-coastal and inland areas of Korea during the past 25 years, and due to the great earthquakes which occurred recently in neighboring countries, the importance of the future earthquake preparedness measures in Korea is highly recognized. More than 80 percent of residential buildings are constructed with URM buildings in Seoul. In general, an URM building does not have enough strength against the lateral force. Moreover, low rise buildings have not adopted seismic designs, and for that reason a critical damage is expected with an earthquake. The primary purpose of this investigation is to find out the shear behavior of URM wall and the variables that affect the shear capacity of URM wall such as material property, boundary condition, aspect ratio, 1 Dept. of Architectural Eng. Kwangwoon Univ., 447-1 Wolgye-dong, Nowon-ku, Seoul, 139-701, Korea 2 Steel Structure Research Laboratory, Research Institute of Industrial Science and Technology, 79-5 Youngcheon, Dongtan, Hwasung, Kyungki-Do, 445-813, Korea 3 Dept. of Architectural Eng. Kwangwoon Univ., 447-1 Wolgye-dong, Nowon-ku, Seoul, 139-701, Korea
2
direction, and degree of force, and to propose the equation of the shear capacity of URM wall by analytical study and regression analysis using the previous tests.
SHEAR BEHAVIOR MODE OF URM WALLS There have been continuous researches on the seismic performance of URM buildings. The shear behavior of URM walls is classified from the previous researches and provisions of several countries. However, the differences in building materials such as masonry units, and mortar types, construction techniques, and other circumstances limit application of the shear behavior mode and the equation of shear strength of URM walls. In general, the shear behavior mode of URM wall expresses four types of modes such as rocking failure, sliding shear failure, toe crushing failure, and diagonal tension failure. These behavior modes are affected by the compressive strength of masonry unit, aspect ratio, and vertical axial stress. From the behavior mode, strength acceptance criteria are suggested by the equations shown below. In FEMA 273, it is shown that the expected lateral strength of URM walls or pier components shall be based on expected bed-joint sliding shear strength or expected rocking strength, in accordance with Equation (1)~(2), respectively. In addition, the lower bound lateral strength of existing URM walls or pier components shall be limited by diagonal tension stress or toe compressive stress, in accordance with Equation (3)~(4), respectively. The lateral strength of URM walls or piers shall be lesser than CLQ values
given by these four equations.
a) Rocking strength: ⎟⎠
⎞⎜⎝
⎛==h
lPVQ rCL α9.0 (1)
b) Sliding shear strength: nmesCL AvVQ == (2)
If the aspect ratio (h/l) is larger than 1.00 and less than 1.5,
c) Diagonal tension strength: dt
andtdtCL f
f
h
lAfVQ +⎟
⎠
⎞⎜⎝
⎛== 1 (3)
d) Toe crushing strength: ⎟⎟⎠
⎞⎜⎜⎝
⎛−⎟
⎠
⎞⎜⎝
⎛=='7.0
1m
atcCL f
f
h
lPVQ α (4)
Where, mev : Expected bed-joint sliding shear strength
P : Expected vertical axial compressive force per load combinations α : Factor equal to 0.5 for fixed-free cantilever wall, or equal to 1.0 for fixed-fixed pier
'mf : Lower bound of masonry compressive strength
dtf : Lower bound of masonry diagonal tension strength ( '05.0 mf )
af : Upper bound of vertical axial compressive stress ( )(1.1 SLD QQQ ++ )
From the comparison of each equation according to the behavior modes, the failure modes based on the aspect ratio and vertical axial stress, which are primary variables in URM walls can be expected. For the
3
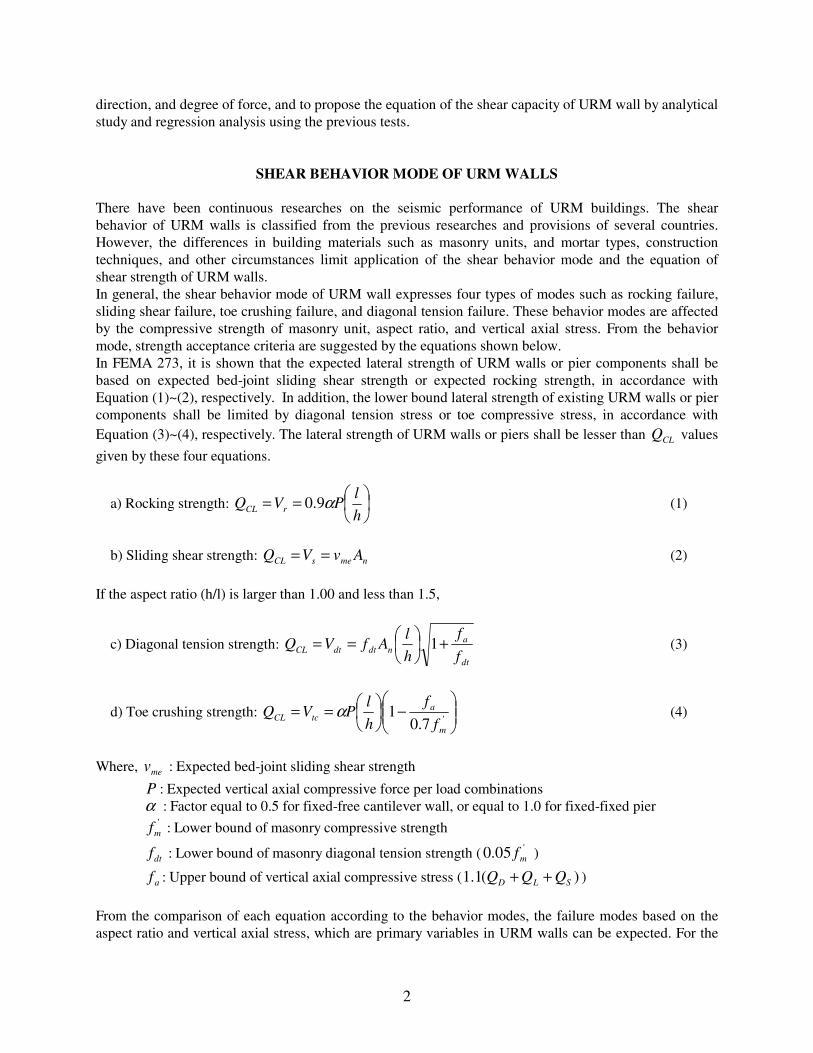
purpose of this research, 90kgf/cm2 is applied as the masonry compressive strength based on material test result First, observing the shear behavior mode according to the vertical axial stress with 1.0 aspect ratio, in case of lower bound 7kgf/cm2 of vertical axial stress, rocking failure or toe crushing failure mode governs, and in case of upper bound 7kgf/cm2 of vertical axial stress, toe crushing mode governs. Second, observing the shear behavior mode according to the aspect ratio with 2.56kgf/cm2 vertical axial stress, in case of lower bound 0.75 of aspect ratio, sliding failure mode governs, and in case of upper bound 0.75 of aspect ratio, rocking failure or toe crushing mode governs. At the same time, when vertical axial stress is 25.6kgf/cm2, in case of lower bound 0.65 of aspect ratio, sliding failure mode governs, and in case of upper bound 0.65 of aspect ratio, toe crushing failure mode governs. As mentioned above, the behavior mode of URM wall expresses four kinds of modes; rocking failure, sliding shear failure, toe crushing failure, and diagonal tension failure. These behavior modes are affected by the compressive strength of masonry unit, aspect ratio, and vertical axial stress. With this analysis, the strength acceptance criteria can be defined with previously. The failure mode of URM walls according to the variables can be regulated as follows: ․ Sliding failure mode: Lower aspect ratio, lower vertical axial stress. ․ Rocking failure mode: Higher aspect ratio, lower vertical axial stress. ․ Toe crushing failure mode: Higher aspect ratio, higher vertical axial stress. ․ Diagonal tension failure mode: Lower aspect ratio, higher vertical axial stress.
Toe Crushing Rocking
Diaginal TensionToe Crushing
DiagonalTension
Sliding
Rocking
0
5
10
15
20
0 10 20 30
Axial Strength (kgf/cm2)
Shea
r S
tren
gth
(kg
f/cm
2) )
H/L=1
H/L=2
DiaginalTension
Toe Crushing
Rocking
Sliding
Rocking
Sliding
DiagonalTension
Toe Crushing
0
5
10
15
20
0 0.5 1 1.5 2 2.5 3
Aspect Ratio (H/L)
Shear
Str
eng
th (
kg
f/cm
2
Axial Load 2.56kgf/cm̂ 2
Axial Load 25.6kgf/cm̂ 2
Fig. 1 Axial strength and shear stress relationship Fig. 2 Aspect ratio and shear stress relationship
CURRENT STATUS OF URM BUILDINGS IN KOREA To evaluate the general URM walls in Korea, 63 plans of representative URM buildings are analyzed respect to the aspect ratio and vertical axial stress.
4
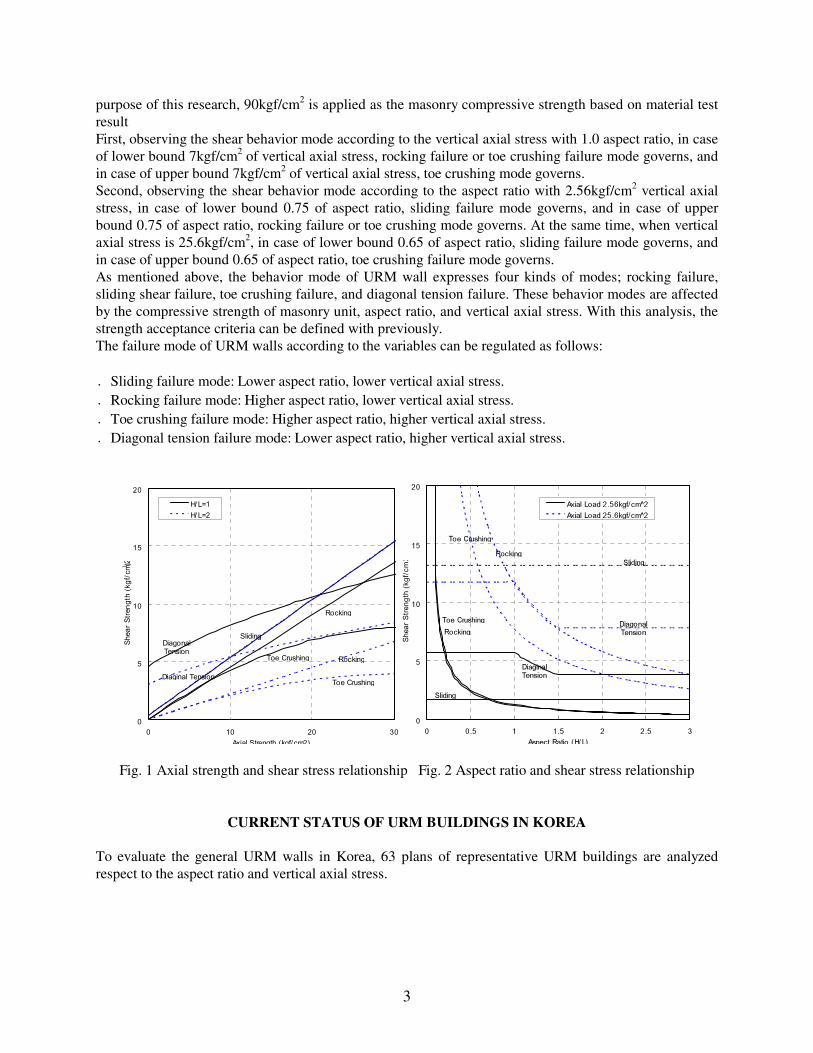
Typical Length of URM Walls Length and number of URM walls with no openings and 1.0B of thickness are surveyed as shown at Fig. 3 and Fig.4. From the data in Fig. 4, lengths of 1.0m, 1.2m, 2.4m, and 3.6m can represent the typical size of URM walls.
Fig. 3 Typical plan of URM Fig. 4 Distribution of URM walls without opening
Vertical Axial Load Table 1 shows vertical axial stress of each floor according to the each type of plan divided by floor area. In case of 2-story URM buildings, the second floor wall and the first floor wall is loaded vertically 8.76tf/m2 and 25.40tf/m2, respectively. Table 1. Vertical axial load applied to URM wall
Vertical axial load (tf) Vertical axial stress (tf/m2) Type
Gross area of wall(m2)
Floor area (m2)
Self weight of wall (tf) Roof level 1st level
Wall of 2nd floor
Wall of 1st floor
A 4.34 38.83 27.03 26.02 28.35 6.69 20.87
B 5.51 52.89 32.16 33.48 36.48 7.22 21.57
C 6.38 69.88 35.27 46.82 51.01 11.08 30.76
D 6.75 80.54 39.93 53.96 58.79 10.05 28.42
Ave. 8.76 25.40
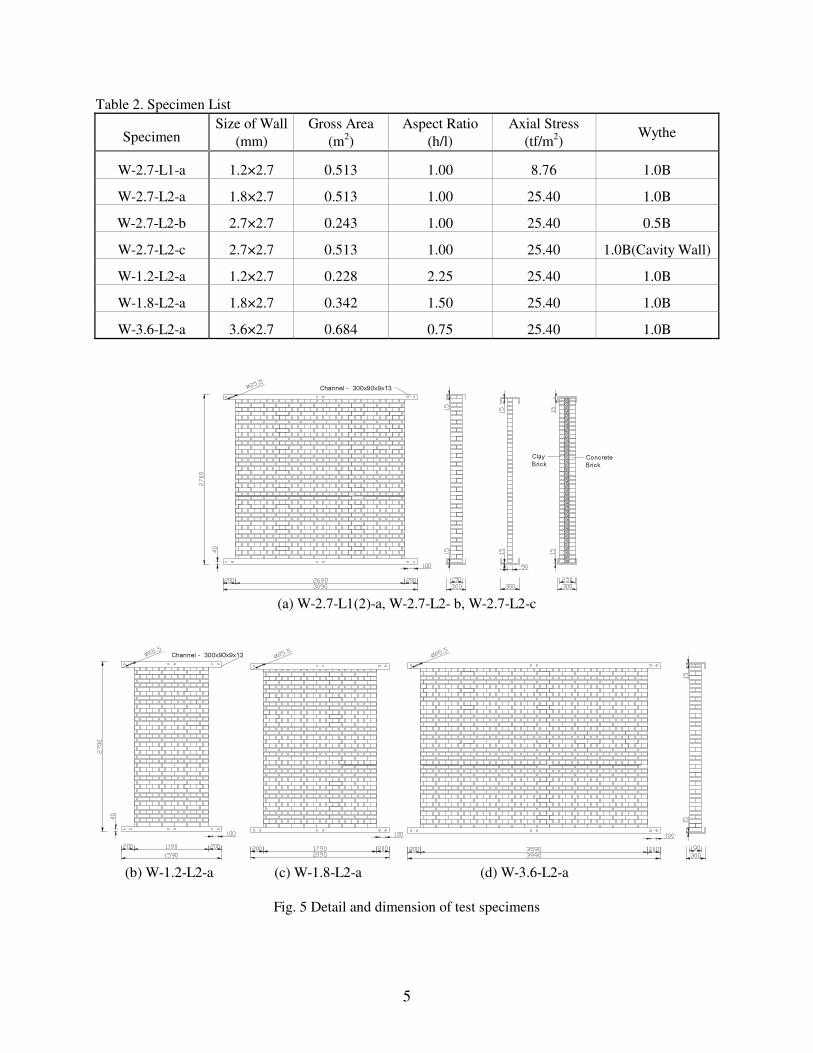
EXPERIMENT INVESTIGATION Description of Test Specimen Seven URM walls according to the variables such as the aspect ratio, vertical axial stress, thickness of URM walls are manufactured full scale and tested in the laboratory unit. Test specimens with different length and thickness of URM wall are shown in Table 2 and Fig. 5 with their constructional aspects.
1000 1200
2400 3600
0
5
10
15
20
25
30
600 1000 1400 1800 2200 2600 3000 3400 3800 4300 4700 Length of URM walls
Number
5
Table 2. Specimen List
Specimen Size of Wall
(mm) Gross Area
(m2) Aspect Ratio
(h/l) Axial Stress
(tf/m2) Wythe
W-2.7-L1-a 1.2×2.7 0.513 1.00 8.76 1.0B
W-2.7-L2-a 1.8×2.7 0.513 1.00 25.40 1.0B
W-2.7-L2-b 2.7×2.7 0.243 1.00 25.40 0.5B
W-2.7-L2-c 2.7×2.7 0.513 1.00 25.40 1.0B(Cavity Wall)
W-1.2-L2-a 1.2×2.7 0.228 2.25 25.40 1.0B
W-1.8-L2-a 1.8×2.7 0.342 1.50 25.40 1.0B
W-3.6-L2-a 3.6×2.7 0.684 0.75 25.40 1.0B
Channel - 300x90x9x13
Concrete
Brick
Clay
Brick
(a) W-2.7-L1(2)-a, W-2.7-L2- b, W-2.7-L2-c
Channel - 300x90x9x13
(b) W-1.2-L2-a (c) W-1.8-L2-a (d) W-3.6-L2-a
Fig. 5 Detail and dimension of test specimens
6
Materials To evaluate the material properties, four kinds of tests are carried out and the test results of material properties are as follows: Table 3. Compressive strength of brick Table 4. Compressive strength of mortar
Type of brick Dimension
(mm) Compressive strength
(kgf/cm2)
Concrete brick 190×90×57 157
Clay brick 190×90×57 425
Table 5. Compressive strength of prism Table 6. Shear strength of diagonally loaded masonry
Mortar* Compressive strength
(kgf/cm2) Em
(kgf/cm2) 1:3 91.0 7563
1:4.8 66.1 5863
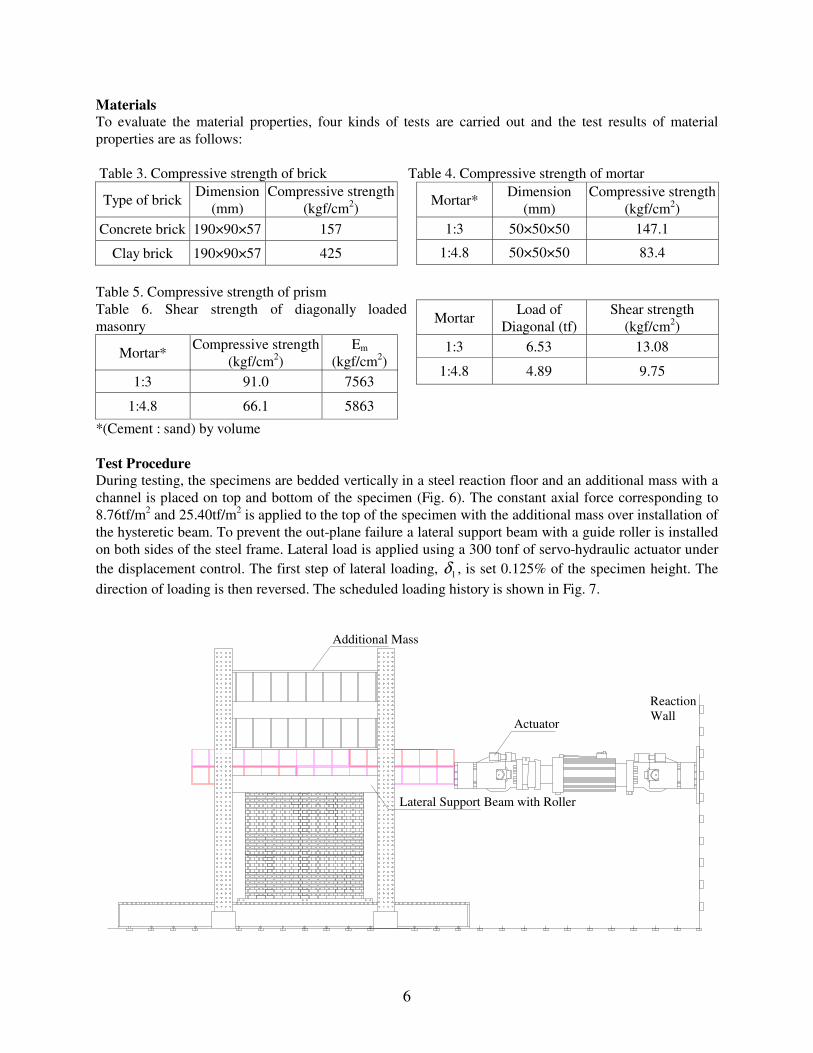
*(Cement : sand) by volume Test Procedure During testing, the specimens are bedded vertically in a steel reaction floor and an additional mass with a channel is placed on top and bottom of the specimen (Fig. 6). The constant axial force corresponding to 8.76tf/m2 and 25.40tf/m2 is applied to the top of the specimen with the additional mass over installation of the hysteretic beam. To prevent the out-plane failure a lateral support beam with a guide roller is installed on both sides of the steel frame. Lateral load is applied using a 300 tonf of servo-hydraulic actuator under the displacement control. The first step of lateral loading, 1δ , is set 0.125% of the specimen height. The direction of loading is then reversed. The scheduled loading history is shown in Fig. 7.
Actuator
Lateral Support Beam with Roller
Additional Mass
ReactionWall
Mortar* Dimension
(mm) Compressive strength
(kgf/cm2) 1:3 50×50×50 147.1
1:4.8 50×50×50 83.4
Mortar Load of
Diagonal (tf) Shear strength
(kgf/cm2) 1:3 6.53 13.08
1:4.8 4.89 9.75
7
Fig. 6 Schematic drawing of the testing frame
-100
-80
-60
-40
-20
0
20
40
60
80
100
Cycle
Dis
plac
emen
t(m
m
1 2 3 4 5 6 7 8 9 10 11 12 13 14 15 16 17 18 19 20 21 22 23 24
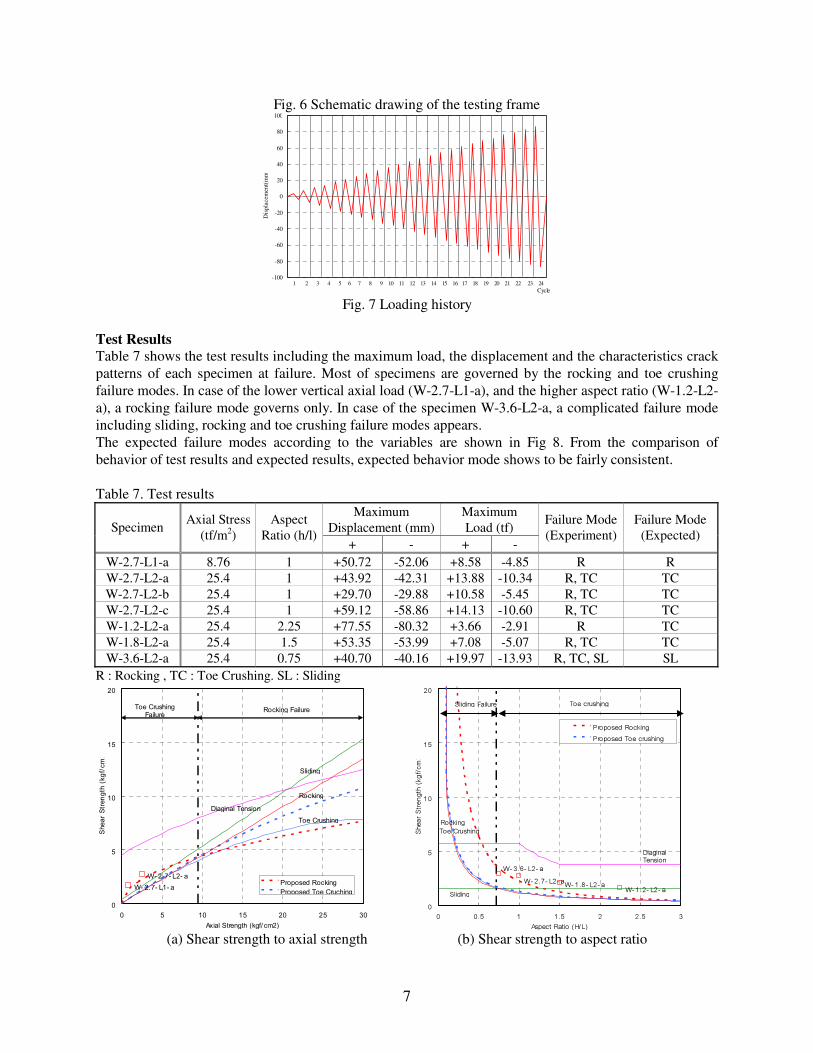
Fig. 7 Loading history
Test Results Table 7 shows the test results including the maximum load, the displacement and the characteristics crack patterns of each specimen at failure. Most of specimens are governed by the rocking and toe crushing failure modes. In case of the lower vertical axial load (W-2.7-L1-a), and the higher aspect ratio (W-1.2-L2-a), a rocking failure mode governs only. In case of the specimen W-3.6-L2-a, a complicated failure mode including sliding, rocking and toe crushing failure modes appears. The expected failure modes according to the variables are shown in Fig 8. From the comparison of behavior of test results and expected results, expected behavior mode shows to be fairly consistent. Table 7. Test results
Maximum Displacement (mm)
Maximum Load (tf) Specimen
Axial Stress (tf/m2)
Aspect Ratio (h/l)
+ - + -
Failure Mode (Experiment)
Failure Mode (Expected)
W-2.7-L1-a 8.76 1 +50.72 -52.06 +8.58 -4.85 R R W-2.7-L2-a 25.4 1 +43.92 -42.31 +13.88 -10.34 R, TC TC W-2.7-L2-b 25.4 1 +29.70 -29.88 +10.58 -5.45 R, TC TC W-2.7-L2-c 25.4 1 +59.12 -58.86 +14.13 -10.60 R, TC TC W-1.2-L2-a 25.4 2.25 +77.55 -80.32 +3.66 -2.91 R TC W-1.8-L2-a 25.4 1.5 +53.35 -53.99 +7.08 -5.07 R, TC TC W-3.6-L2-a 25.4 0.75 +40.70 -40.16 +19.97 -13.93 R, TC, SL SL
R : Rocking , TC : Toe Crushing. SL : Sliding
Diaginal Tension
Toe Crushing
Rocking
Sliding
W- 2.7- L2- a
W- 2.7- L1- a
Rocking FailureToe CrushingFailure
0
5
10
15
20
0 5 10 15 20 25 30
Axial Strength (kgf/ cm2)
Shea
r S
tren
gth
(kg
f/cm
2
Proposed Rocking
Proposed Toe Cruching
Sliding
Rocking
Toe Crushing
DiaginalTension
Toe crushingSliding Failure
W- 1.2- L2- aW- 1.8- L2- a
W- 2.7- L2- a
W- 3.6- L2- a
0
5
10
15
20
0 0.5 1 1.5 2 2.5 3
Aspect Ratio (H/L)
Shea
r S
tren
gth
(kg
f/c
m2
Proposed Rocking
Proposed Toe crushing
(a) Shear strength to axial strength (b) Shear strength to aspect ratio
8
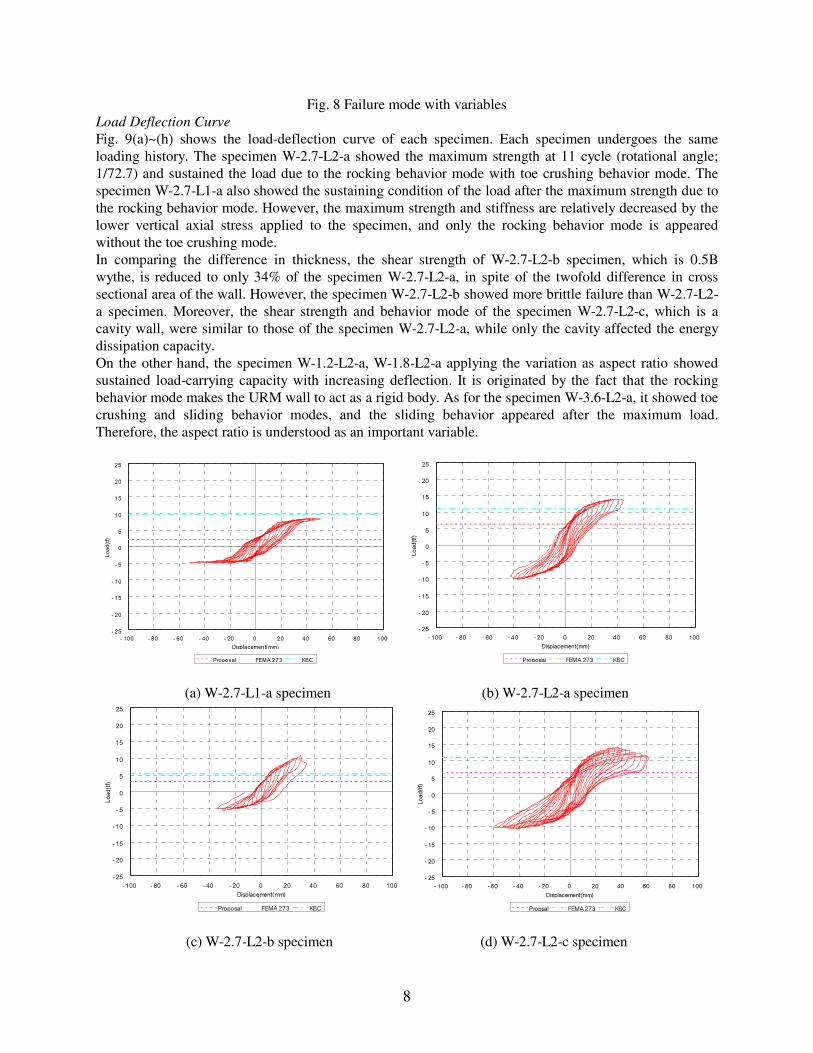
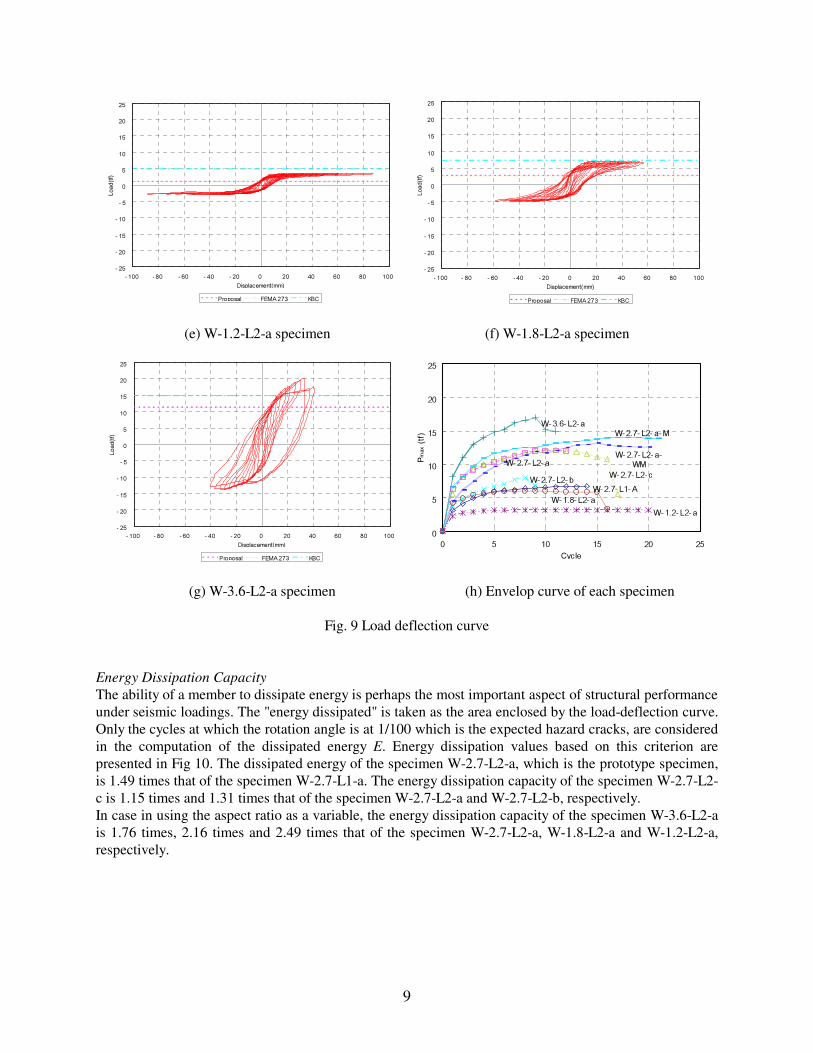
Fig. 8 Failure mode with variables Load Deflection Curve Fig. 9(a)~(h) shows the load-deflection curve of each specimen. Each specimen undergoes the same loading history. The specimen W-2.7-L2-a showed the maximum strength at 11 cycle (rotational angle; 1/72.7) and sustained the load due to the rocking behavior mode with toe crushing behavior mode. The specimen W-2.7-L1-a also showed the sustaining condition of the load after the maximum strength due to the rocking behavior mode. However, the maximum strength and stiffness are relatively decreased by the lower vertical axial stress applied to the specimen, and only the rocking behavior mode is appeared without the toe crushing mode. In comparing the difference in thickness, the shear strength of W-2.7-L2-b specimen, which is 0.5B wythe, is reduced to only 34% of the specimen W-2.7-L2-a, in spite of the twofold difference in cross sectional area of the wall. However, the specimen W-2.7-L2-b showed more brittle failure than W-2.7-L2-a specimen. Moreover, the shear strength and behavior mode of the specimen W-2.7-L2-c, which is a cavity wall, were similar to those of the specimen W-2.7-L2-a, while only the cavity affected the energy dissipation capacity. On the other hand, the specimen W-1.2-L2-a, W-1.8-L2-a applying the variation as aspect ratio showed sustained load-carrying capacity with increasing deflection. It is originated by the fact that the rocking behavior mode makes the URM wall to act as a rigid body. As for the specimen W-3.6-L2-a, it showed toe crushing and sliding behavior modes, and the sliding behavior appeared after the maximum load. Therefore, the aspect ratio is understood as an important variable.
- 25
- 20
- 15
- 10
- 5
0
5
10
15
20
25
- 100 - 80 - 60 - 40 - 20 0 20 40 60 80 100
Displacement(mm)
Load(tf)
Proposal FEMA 273 KBC
- 25
- 20
- 15
- 10
- 5
0
5
10
15
20
25
- 100 - 80 - 60 - 40 - 20 0 20 40 60 80 100
Displacement(mm)
Load(tf)
Proposal FEMA 273 KBC
(a) W-2.7-L1-a specimen (b) W-2.7-L2-a specimen
- 25
- 20
- 15
- 10
- 5
0
5
10
15
20
25
- 100 - 80 - 60 - 40 - 20 0 20 40 60 80 100
Displacement(mm)
Load(tf)
Proposal FEMA 273 KBC
- 25
- 20
- 15
- 10
- 5
0
5
10
15
20
25
- 100 - 80 - 60 - 40 - 20 0 20 40 60 80 100
Displacement(mm)
Load(tf)
Propsal FEMA 273 KBC
(c) W-2.7-L2-b specimen (d) W-2.7-L2-c specimen
9
- 25
- 20
- 15
- 10
- 5
0
5
10
15
20
25
- 100 - 80 - 60 - 40 - 20 0 20 40 60 80 100
Displacement(mm)
Load(tf)
Proposal FEMA 273 KBC
- 25
- 20
- 15
- 10
- 5
0
5
10
15
20
25
- 100 - 80 - 60 - 40 - 20 0 20 40 60 80 100
Displacement(mm)
Load(tf)
Proposal FEMA 273 KBC
(e) W-1.2-L2-a specimen (f) W-1.8-L2-a specimen
- 25
- 20
- 15
- 10
- 5
0
5
10
15
20
25
- 100 - 80 - 60 - 40 - 20 0 20 40 60 80 100
Displacement(mm)
Load(tf)
Proposal FEMA 273 KBC
W-2.7- L2- b
W- 1.2- L2- a
W- 2.7- L1- A
W- 2.7- L2- a
W- 2.7- L2- c
W- 1.8- L2- a
W- 3.6- L2- a
W- 2.7- L2- a-M
W- 2.7- L2- a-
WM
0
5
10
15
20
25
0 5 10 15 20 25
Cycle
Pmax (
tf)
(g) W-3.6-L2-a specimen (h) Envelop curve of each specimen
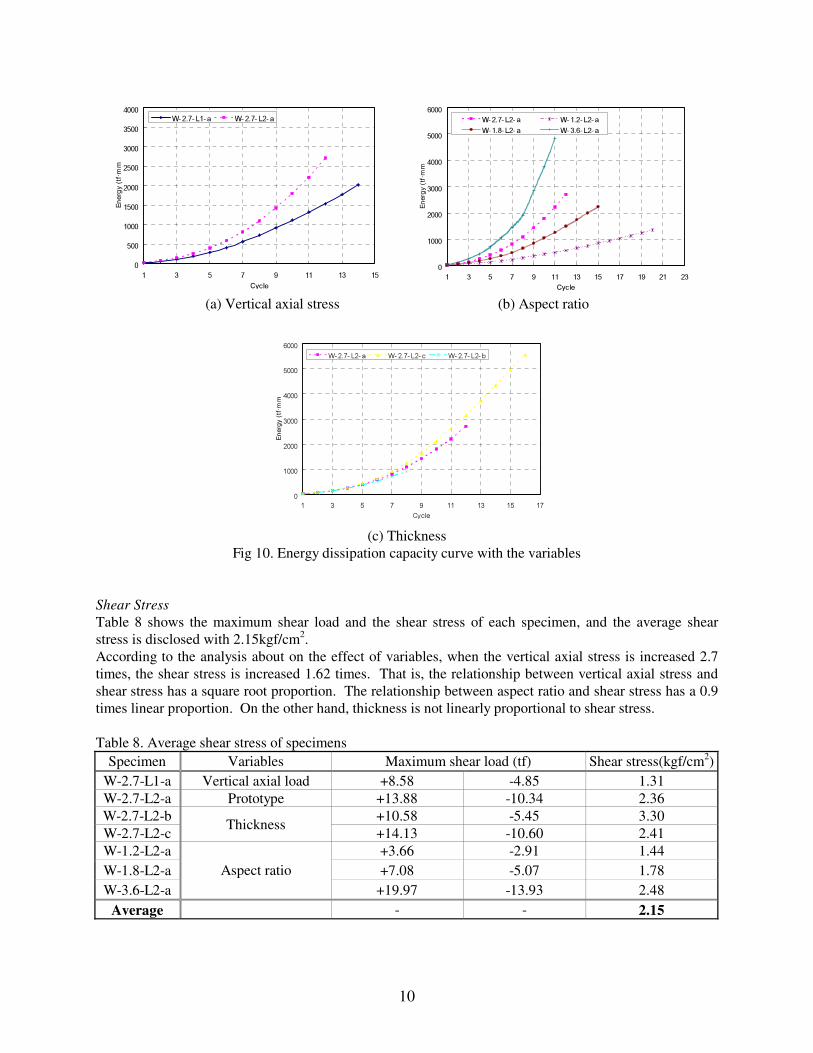
Fig. 9 Load deflection curve Energy Dissipation Capacity The ability of a member to dissipate energy is perhaps the most important aspect of structural performance under seismic loadings. The "energy dissipated" is taken as the area enclosed by the load-deflection curve. Only the cycles at which the rotation angle is at 1/100 which is the expected hazard cracks, are considered in the computation of the dissipated energy E. Energy dissipation values based on this criterion are presented in Fig 10. The dissipated energy of the specimen W-2.7-L2-a, which is the prototype specimen, is 1.49 times that of the specimen W-2.7-L1-a. The energy dissipation capacity of the specimen W-2.7-L2-c is 1.15 times and 1.31 times that of the specimen W-2.7-L2-a and W-2.7-L2-b, respectively. In case in using the aspect ratio as a variable, the energy dissipation capacity of the specimen W-3.6-L2-a is 1.76 times, 2.16 times and 2.49 times that of the specimen W-2.7-L2-a, W-1.8-L2-a and W-1.2-L2-a, respectively.
10
0
500
1000
1500
2000
2500
3000
3500
4000
1 3 5 7 9 11 13 15
Cycle
En
erg
y (t
f·m
mW-2.7- L1- a W- 2.7- L2- a
0
1000
2000
3000
4000
5000
6000
1 3 5 7 9 11 13 15 17 19 21 23
Cycle
En
erg
y (t
f·m
m
W-2.7- L2- a W- 1.2- L2- a
W- 1.8- L2- a W- 3.6- L2- a
(a) Vertical axial stress (b) Aspect ratio
0
1000
2000
3000
4000
5000
6000
1 3 5 7 9 11 13 15 17
Cycle
Energ
y (
tf·m
m
W-2.7- L2- a W- 2.7-L2- c W- 2.7- L2- b
(c) Thickness
Fig 10. Energy dissipation capacity curve with the variables Shear Stress Table 8 shows the maximum shear load and the shear stress of each specimen, and the average shear stress is disclosed with 2.15kgf/cm2. According to the analysis about on the effect of variables, when the vertical axial stress is increased 2.7 times, the shear stress is increased 1.62 times. That is, the relationship between vertical axial stress and shear stress has a square root proportion. The relationship between aspect ratio and shear stress has a 0.9 times linear proportion. On the other hand, thickness is not linearly proportional to shear stress. Table 8. Average shear stress of specimens
Specimen Variables Maximum shear load (tf) Shear stress(kgf/cm2) W-2.7-L1-a Vertical axial load +8.58 -4.85 1.31 W-2.7-L2-a Prototype +13.88 -10.34 2.36 W-2.7-L2-b +10.58 -5.45 3.30 W-2.7-L2-c
Thickness +14.13 -10.60 2.41
W-1.2-L2-a +3.66 -2.91 1.44 W-1.8-L2-a +7.08 -5.07 1.78 W-3.6-L2-a
Aspect ratio +19.97 -13.93 2.48
Average - - 2.15
11
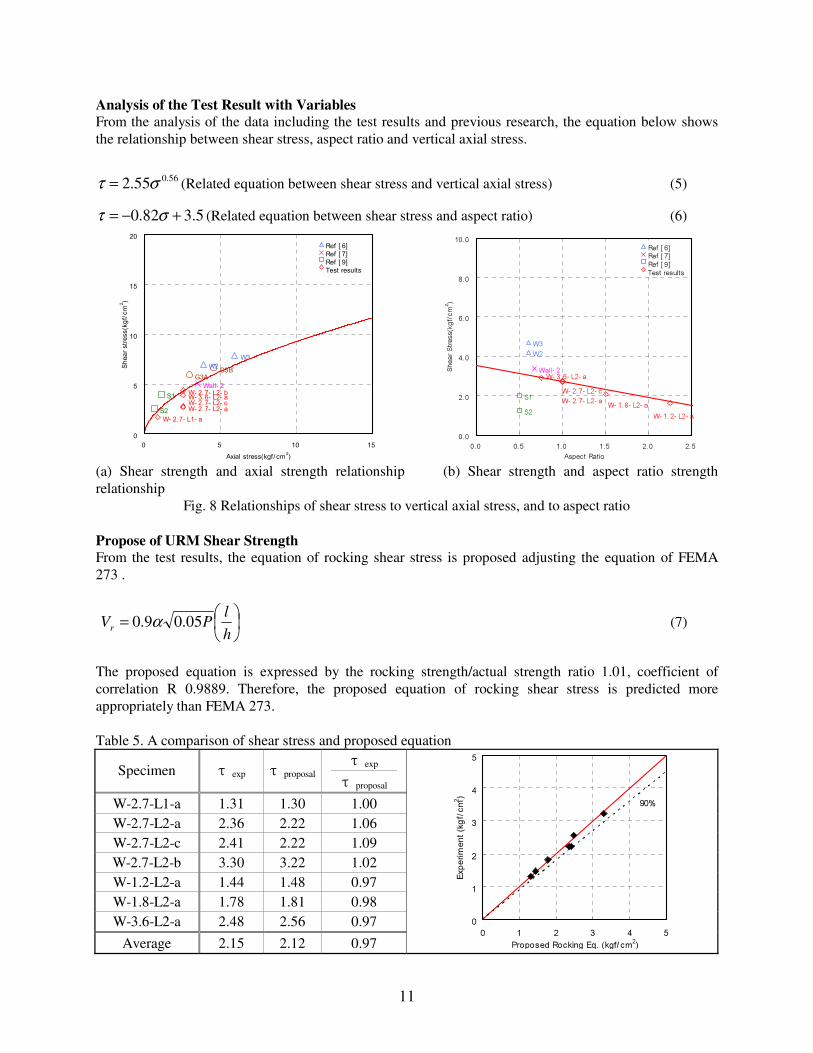
Analysis of the Test Result with Variables From the analysis of the data including the test results and previous research, the equation below shows the relationship between shear stress, aspect ratio and vertical axial stress.
56.055.2 στ = (Related equation between shear stress and vertical axial stress) (5)
5.382.0 +−= στ (Related equation between shear stress and aspect ratio) (6)
W3
W2
Wall- 2
S2
S1
G3BG3A
W- 2.7- L1- a
W- 2.7- L2- aW- 2.7- L2- cW- 3.6- L2- aW- 2.7- L2- b
0
5
10
15
20
0 5 10 15
Axial stress(kgf/ cm2)
Shea
r str
ess(k
gf/
cm
2
)
ManzouriAbrams권기혁광운대
Ref [ 6]Ref [ 7]Ref [ 9]Test results
W3
W2
Wall- 2
S1
S2
W- 3.6- L2- a
W- 2.7- L2- c
W- 2.7- L2- aW- 1.8- L2- a
W- 1.2- L2- a
0.0
2.0
4.0
6.0
8.0
10.0
0.0 0.5 1.0 1.5 2.0 2.5
Aspect RatioS
he
ar
Str
ess(k
gf/
cm
2)
ManzouriAbrams권기혁광운대
Ref [ 6]Ref [ 7]Ref [ 9]Test results
(a) Shear strength and axial strength relationship (b) Shear strength and aspect ratio strength relationship
Fig. 8 Relationships of shear stress to vertical axial stress, and to aspect ratio
Propose of URM Shear Strength From the test results, the equation of rocking shear stress is proposed adjusting the equation of FEMA 273 .
⎟⎠
⎞⎜⎝
⎛=h
lPVr 05.09.0 α (7)
The proposed equation is expressed by the rocking strength/actual strength ratio 1.01, coefficient of correlation R 0.9889. Therefore, the proposed equation of rocking shear stress is predicted more appropriately than FEMA 273. Table 5. A comparison of shear stress and proposed equation
τ exp Specimen τ exp τ proposal
τ proposal
W-2.7-L1-a 1.31 1.30 1.00 W-2.7-L2-a 2.36 2.22 1.06 W-2.7-L2-c 2.41 2.22 1.09 W-2.7-L2-b 3.30 3.22 1.02 W-1.2-L2-a 1.44 1.48 0.97 W-1.8-L2-a 1.78 1.81 0.98 W-3.6-L2-a 2.48 2.56 0.97
Average 2.15 2.12 0.97
90%
0
1
2
3
4
5
0 1 2 3 4 5
Proposed Rocking Eq. (kgf/ cm2)
Exp
eri
me
nt
(kg
f/cm2)
12
CONCLUSION Seven unreinforced masonry wall specimens were constructed and tested to study the shear behavior and capacity. Based on the results of these tests, the following conclusions can be drawn: 1) Most test walls show the primary influence by rocking mode. Because of the load concentration in toe portion due to the rotation of the wall body, the crushing occurred at the toe portion. In case of the slender wall W-3.6-L2-a, sliding due to the bed-joint crack occurs. 2) The relationship between shear stress and vertical axial stress is proportionate in square root pattern. The relationship between shear stress and aspect ratio shows the linear pattern. Shear stress and cross sectional area are not proportional. 3) The proposed rocking strength/actual strength ratio of 1.03, and coefficient of correlation R 0.9889 are proved to be more appropriately than FEMA 273 rocking strength formulas. 4) The ultimate average shear stress of the URM walls is figured to be at 2kgf/cm2.
ACKNOWLEDGEMENT The reported research was supported by the Small and Medium Business Administration under Grant No. 2003-13, and the Research Grant of Kwangwoon University in 2003. This support is greatly acknowledged.
REFERENCES [1] FEMA 273, NEHRP Guidelines for the Seismic Rehabilitation of Buildings, Washington, D.C., October 1997 [2] FEMA 306, “Evaluation of Earthquake Damaged Concrete and Masonry Wall Buildings”, Washington, D.C., May 1999 [3] F. J. Crisafulli, A. J. Carr, and R. Park, “Shear Strength of Unreinforced Masonry Panels”, Pacific Conference on Earthquake Engineering, Australia, November 1995, pp.77-86 [4] G. M. Calvi, G. R. Kingsley, and G. Magenes, “Testing of Masonry Structures for Seismic Assessment”, Earthquake Spectra, Vol. 12, No.1, February 1996, pp145-162 [5] T. Paulay, M. J. N. Priestley, “Seismic Design of Reinforced Concrete and Masonry Buildings”, 1992 [6] T. Manzouri, M. P. Schuller, P. B. Shing, and B. Amadei, “Repair and Retrofit of Unreinforced Masonry Structures”, Earthquake Spectra, Vol 12, No.4, November 1996, pp.903-922 [7] D. P. Abrams, “Strength and Behavior of Unreinforced Masonry Elements”, 10 WCEE, Madrid, pp.3460-3474 [8] Architectural Institute of Korea, “Korean Building Code(Draft)”, 2001. 6 [9] K. H. Kwon, “Development of retrofitting method of unreinforced masonry structures”, University of Seoul, 2001. 6