(she bzpladee (esgt
TRANSCRIPT

Relationships Between Sprint Performance,
Power Output and Fatigue
by
James Shorten
Thesis Submitted To The Faculty Of
Virginia Polytechnic Institute And State University
In Partial Fulfillment Of The Requirements For The Degree Of
Masters Of Science In Education
In
Exercise Physiology
APPROVED: f |
Dr. Jay H. Williams, Chairman
(She Bzpladee (esgt Dr. Don R. Sebolt Dr. Reed H. Humphrey
July 1991
Blacksburg, Virginia

LD
Pf ed ~
V Ar 2 U7
rN, f
, Wy
* Ui
>.
x
C tT

Relationships Between Sprint Performance,
Power Output, and Fatigue
by
James Shorten
(ABSTRACT )
This investigation used a constant-load cycle ergometer
as a way of examining relationships between the cycle
ergometer and sprint performance. Twenty-five college-aged
males were used for this investigation. Following a three
minute warm-up, each subject performed a 15 sec. maximal bout
on the cycle ergometer. The resistance load on the ergometer
was set at 0.12kg/kg of bodyweight. Peak power (PP), average
power (AP), time to peak power (TTPP), power fatigue rate
(PFR), and power fatigue index (PFI) were computed using a
microcomputer system. In addition, PP,AP, and PFR were
adjusted for total bodyweight (PP/kg, AP/kg, PFR/kg). Ona
separate day each subject performed six sprints two each at
50m, 100m, and 200m. Each sprint was electronically timed
uSing an infra-red motion detector and starting blocks were
used. Initially low correlations were found between the
ergometer parameters and the sprint times (r=.07-.55).
However upon closer evaluation stronger relationships appeared
to exist for the faster subjects. Therefore, subject
subgroups of faster subjects were formed. Subject subgroups
for the 5 Om (T<7.5sec.), 100m (T<l4sec.)}, and 200m
(T<26.6sec.) showed higher correlations (r=.06-.70). Further
analysis revealed that high inter-variable correlations
existed between many of the ergometer variables. Based on
these correlations the parameters were separated into four
groups. Group I contained variables of absolute power
(PP,AP), group II were variables of relative power (PP/kg,
AP/kg), group III contained variables of fatigue (PFR, PFI,
PFR/kg), and group IV consisted of the acceleration varable
(TTPP). Equations for predicting sprint performance were
developed using one to four variables with only one variable
from each group being used. The best equation was considered
to be the one that yielded the highest r* value while also
yielding the lowest Akakai Information Criteria value and MSE.
Variables from the relative power group (PP/kg, AP/kg) and
fatigue group (PFR, PFI, PFR/kg) were the best indicators of
performance. These results suggest that the cycle ergometer
used in this investigation can be used for evaluating the
components of sprint performance in untrained males, and that
this test is best when compared to the 200 m dash.
Acknowledgements
I would like to thank the following individuals for their
contributions toward helping complete this research project.
Dr. dav H. Williams, chairman of my committee, for his
Suidance and encouragement throughout this research project.
Dr. Don R. Sebolt and Dr. Reed H. Humphrey, for serving on my
committee. |
T would also like to thank Chris Ward and Kim Lukin for
their valued assistance with my data collection. Coach Russ
Whiteneck for his cooperation and loaning of equipment.
Finally I would like to thank my girlfriend Suzanne
Kobernick whose neverending support helped me make it through
graduate school, and my family especially my parents Marcia
and Jim Shorten whose guidance and support throughout my life
made all of this possible.
1v
Table of Contents
Acknowledgements.......000.8. sew ee eee
List of Tables
List of Figure
Chapter 1f In
S$ oo 8 © @ @ @ @ @ © © © © 8 & eo. 8 © © @& @ @ @
troduction... cece ee eee
Statement of the Problem.
Significance of the Study
* 8 © @ © © © # © © © © oO 8
eo 8 8 © © 8 © © © © © # 6 &
Research Hyvpothesis.... : rn
DelimitationS.....ee00- vee ees tee ‘
Limitations... cree evesevers se :
Basic ASSUMPTIONS. ..crceveves rn
Definitions and Symbols... eee en eeves
SuMMary....eee Lee ee ee ee weer eens . .
Chapter II Review of Literature..... seas oe se
Anaerobic Power....... Cee ee ee ee eee . .
Reliability... cee evees cee eee .
Validity... cece eer ee eee seer ees eanvens .
Predicting Performance.......-6.6. se os
ConcluSionS.....seeees rr ces oe
Chapter III Journal Manuscript.......ceees see .
AbStract.cccssvecvvvevecre : . ve
Introduction. cee eer e eet vvens see
Methods... c verve ccevees cee eee tees
SuBjJeEctS.. cree eevee everves an
Power TestS.cvcreevseveveens rn
Sprint Testing... ccc eevee eve seve vvene
StatisSticS. cr. cere vv veers vvrvesveseeves
Results. ...se00- See ee eee ee ee eee ees
DISCUSSION. . cee v eee eevee veee set eee
ReferenceS...seeeveeee rr rr
Figure CaptionS... cee veers vvece oe
Chapter IV S
References....
UMMATYV . «ee se oe se @ © © 2» @ & es +. ££ © © &
Results. e e e 6 ° * 6 ef s s 8 * £# 6 ¢
Power Output.........-
DiSCUSSLON. cccevevsvvseces
Applicability..........6.
Suggestions For Further
* ¢@ @ © @¢ © @€ © © © @ @
of © 2 © @ € @ @ © @
Research. cee ee
Appendix A: Methodology..... been eas ran arr
Appendix B: Regression Results For All Subjects
and Subject SubgroupS....cceeecevveas .
Appendix C: Raw Data... ccc creeveee tee te ew ee eee .
“ATO
DNS
MH
16 19 20 24
26 26 28 30 30 30 31 32 32 35 39 41
56 57 58
59 62 62
64
69
BO Ol

Appendix D: Data Collection and Analysis
Computer ProgramsS.....ss.seseeee bene ee we ee
Appendix E: Informed Consent... ccc ceevvvas sete eee ees
Appendix F: Data Sheet... weer cern cern cance Cee ee eee
Appendix G: Ergometer Diagram........+.. cee eee ee bee
VITA. cc ccc ee eww ee ees ws rn . os vee
87 95 98 100
102
Table
10
11
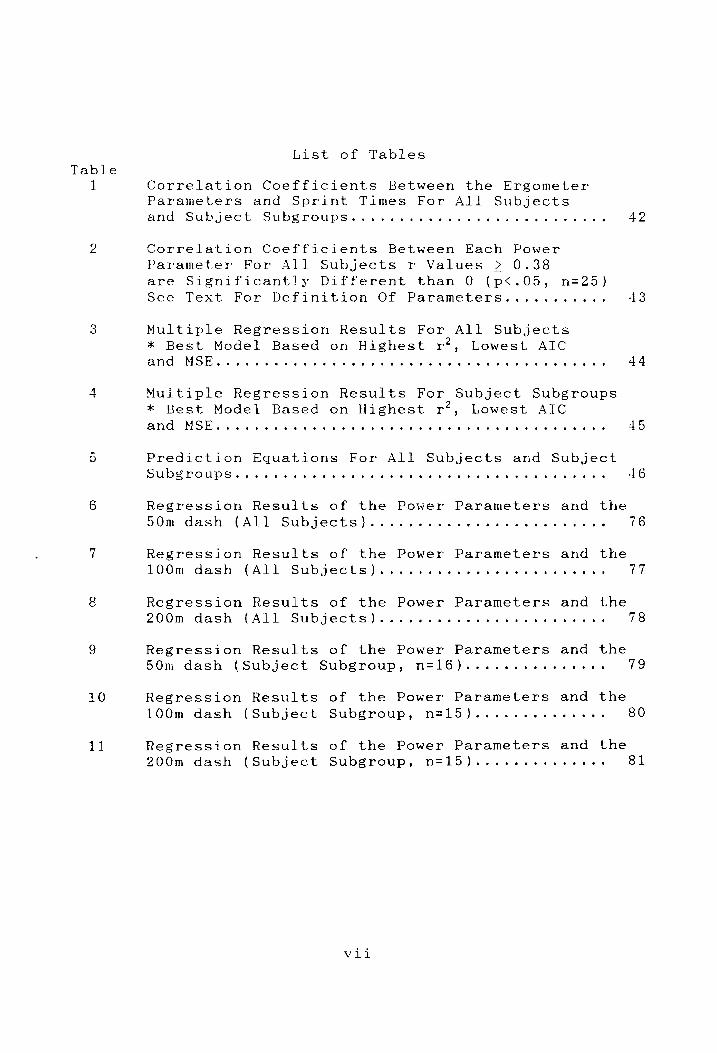
List of Tables
Correlation Coefficients Between the Ergometer
Parameters and Sprint Times For All Subjects
and Subject Subgroups....... Se eee tee ee tweens 42
Correlation Coefficients Between Each Power
Parameter For All Subjects r Values > 0.38 are Significantly Different than 0 (p<.05, n=25)
See Text For Definition Of Parameters..........+ +43
Multiple Regression Results For All Subjects
* Best Model Based on Highest r*, Lowest AIC
ANd MSE. we ee ee ee ee we wee ete eee ee eee tweet tee eee eee 44
Multiple Regression Results For Subject Subgroups
* Best Model Based on Highest r*, Lowest AIC
and MSE ° . t oy ° ° * e e . a a a e e . eof 8+ 2@ @ & 6 ° a ° e s . a s . . ° a ° * e c 7 7 e 45
Prediction Equations For All Subjects and Subject
Subgroups. . e e e * e a ° e . eo e . . tJ e e e a @ e * 6 e e e * ° e e e . s 7 e e e e +6
Regression Results of the Power Parameters and the
50m dash (All Subjects)... ccc ccc e eet eee eee teens 76
Regression Results of the Power Parameters and the
100m dash (All Subjects)....... rn 77
Regression Results of the Power Parameters and the
200m dash (All Subjects)... er cece werner nv ev reves 78
Regression Results of the Power Parameters and the
50m dash (Subject Subgroup, n=16)...-.....25620+2- 79
Regression Results of the Power Parameters and the
100m dash (Subject Subgroup, n=15)...... Cte eee 80
Regression Results of the Power Parameters and the
200m dash (Subject Subgroup, n=15)........5652066- 81
Vil

Figure
10
List of Figures
Individual Variable Plots VS. the
Individual Variable Plots VS. the
Individual Variable Plots VS. the
Residuals For All Subjects In The
Residuals For All Subjects In The
Residuals For All Subjects In The
Residuals For Subject Subgroups
In The 50m Sprint... .. cece eeveees
Residuals For Subject Subgroups In The 100m Sprint... cece eee cree eevee eerervsvnres
Residuals For Subject Subgroups
In The 200m Sprint..... Pa
Ergometer Diagram........6. coe eee
Vili
50m Sprint....
100m Sprint...
200m Sprint...
50m Sprint....
100m Sprint...
200m Sprint.
> 6* @ © © @€ © © © © ee 6
> 2 &© @© © @ @ @ © © o 8 & &
AZ
48
49
o1
52
23
54
Chapter I
Introduction
Many daily activities as well as many athletic events
involve short intense or sprint-type activities (Williams,
Barnes, and Signorile, 1988). Such activities typically
involve dynamic muscular contractions in which the muscle
contracts with some velocity and with some force. Producing
muscular power is the product of the force and velocity that
is produced by the contracting muscles. The relationship
between force and velocity is hyperbolic for human muscle.
Therefore as muscle velocity increases, muscle force decreases
(Harrison, 1970; Sargeant, Hoinville, and Young, 1981). There
have been many methods developed to measure anaerobic power
output. Some of these methods are; the verticle jump used by
Sargeant (1921), stair-climbing used in the Margaria power
test, sprints of varying distances, high speed treadmill
running, and cycle ergometry tests (Bar-Or, Dotan, and Inbar,
1977; Cheetham, Boobis, Brooks, and Williams,1986; Margaria,
Aghemo, and Rovelli, 1966; Tharp, Newhouse, Uffelman,
Thorland, and Johnson, 1985; Vandewalle, Peres, and Monod,
1987).
Possibly the most commonly used laboratory method of
determining anaerobic power output is the cycle ergometer.
This is probably due to the high reliability and the relative
1

2
ease of which force and velocity measurements can be taken
(Bar-Or, 1987; Williams et al., 1988). A test for anaerobic
power output using a stationary cycle ergometer was developed
by Bar-Or et al. in 1977. This test is known as the Wingate
Anaerobic Test (WAnT). This test measures power during an all
out cycling bout that lasts for thirty seconds. This test was
also shown to have high reliability coefficients of r=0.95-
0.97 (Bar-Or et al., 1977). Since that time many researchers
have shown high reliability values with different test
protocols and with different populations (Bar-Or, 1987;
Reilly, and Bayley, 1988). Cycle ergometer tests have also
been compared to other methods of evaluating anaerobic power.
The cycle ergometer compares favorably with the Margaria stair
climbing test and with the verticle jump test. Cycle ergometry
has also been compared with sprints of various distances with
mixed results (Henrich, and Riley, 1988; Patton, and Duggan,
1987; Tharp et al.,1985).
Statement Of The Problem
The rate of oxygen consumption, ventilatory threshold,
and running economy are thought to be important factors that
affect performance in prolonged low-to-moderate intensity
activities. It has been shown that these laboratory
parameters are related to performance in endurance events
(Conley, and Krahenbuhl, 1980; LaFontaine, Londeree, and
Spath, 1981; Powers, Dodd, Deason, Byrd, and McKnight, 1983).
3
Since these occurrences may be important indications of an
athletes training and performance, it is obvious why so much
time and effort has been spent studying this area.
Conversely, little work has been done studying the
factors which might affect short, intense or sprint-type
activities. This is unfortunate because sprinting or short
explosive bouts of activity occur more commonly in the daily
world than do endurance activities. More study in this area
might take place if there were better laboratory measures of
physiologic variables that relate to sprinting such as maximal
power and fatigue. Recently a constant load cycle ergometer
system for determining power output during short term high
intensity exercise was described (Williams et al., 1988).
With this system the researcher can closely examine the rapid
changes in power output during a 15 second power output test.
Early results indicate that during a 15 second test power
output reaches a peak in the first 3-5 seconds. Following
this, a slow decline in power output takes place until the end
of the test (Williams et al., 1988; Williams, Signorile,
Barnes, and Henrich, 1988). Thus, this system can determine
the peak power output achieved (PP), the time to peak power
(TTPP), the rate and magnitude of short-term fatigue (power
fatigue rate, PFR, and power fatigue index, PFI), and finally
the total work accomplished (TW). Low correlation
coefficients between each parameter indicate that these

4
variables act independently of each other (Williams et al.,
1988). This indicates that each of these parameters describes
a different aspect of short term exercise performance.
Ikai showed a relationship between speed and time for the
100m dash that is qualitatively similar to the power curves
obtained by Williams et al., (1988). He also showed that
there is an inter-individual variation dependent upon training
histories (Ikai, 1967). Undoubtably there are many factors
that contribute to sprint performance and measurements of PP
and TW alone may not explain all of these factors. For this
reason this cycle ergometer test can be useful in evaluating
and predicting sprint performance.
Significance Of The Study
Anaerobic power is a primary factor in athletic
performance, most commonly displayed as short explosive
sprints. Despite this, little research has been directed at
identifying the physiological variables that are associated
with sprint performance. This investigation evaluated and
modeled sprint performance using selected physiological
variables. There are numerous factors involved in sprinting.
Because of this, subjects with similar sprint times may
exhibit very different power curves. For example, subject A
may have a relatively slow acceleration phase, but exhibit a
small amount of fatigue. Conversely, subject B may show a
rapid acceleration phase, but also show a greater amount of

5
fatigue. Even though these subjects show obvious differences
in their respective power curves, there might be only a small
difference in their 100m times. The information collected by
the ergometer test identified variables that could contribute
to sprint performance (PP, TTPP, PFR, PFI, AP). This
information could help pin-point an individuals performance
weaknesses. For example, if subject A had a slow TTPP and PFR
then he might want to change his training program to work on
his acceleration. On the other hand, if subject B showed a
high PFR then he might want to work on his’ short term
endurance. This provides the athlete, coach, or trainer with
a quantitative analysis of performance which could then be
used to develop training programs to correct these weaknesses.
This system is superior to field observations, because
not only is it highly reliable, but it also provides an
objective basis for adjusting an athletes training program
(Williams et al.,1988). This removes the subjective bias that
may be included in subjective observations. The
inexpensiveness of this system and the ease with which it can
be operated may persuade many training facilities to
incorporate it into their programs.
Research Hypothesis
The following null hypotheses were developed to define
the objectives of the present study.
Ho,: There were no individual relationships between the
6
parameters taken from the power curve (PP, TTFP,
PFR, PFI, TW), and the sprint times (50m, 100n,
200m).
Ho,: There were no relationships between the sub-groups
of power variables [(PP, AP), (PP/kg, AP/kg), (PFR,
PFI, PFR/kg), (TTPP)] and the sprint times.
Delimitations
The following delimitations were incorporated into the
study by the investigator;
1. The investigation was delimited to 23 untrained male
subjects and 2 sprinters from the Virginia Tech track
team.
2. Sprint distances were set at 50m, 100m, and 200m.
3. Resistance of the ergometer was set at 0.12 kg/kg of body
weight.
4. PP, TTPP, PFR, PFI, and TW were the indices measured from
the cycling test.
Limitations
The investigator recognized the following limitations;
1. There may be some variation in the magnitude and direction
of force application in the muscle groups used between
the sprint test and the cycle test.
Basic Assumtions
The following assumptions were made prior to the start
of the investigation;

7
1. The subjects complied with pretest instructions not to
engage in strenuous physical activity for 12 hours prior
to each test.
2. The subjects gave a maximal effort during the cycle test
and during all of the sprint tests.
Definitions and Symbols
Anaerobic power - a term referring to the ability of an
individual to produce force and velocity during short-term,
high-intensity exercise.
Average power (AP) - an average of the total power attained
every half pedal revolution during each bout, measured in
watts.
Peak power (PP) - the highest power output achieved during a
one-half pedal revolution within each bout, measured in watts.
Power fatigue index (PFI) - the percent decline in power from
peak power to the end of the exercise bout.
Power fatigue rate (PFR) - the rate of power decline from peak
power to the end of a bout, measured in watts/second.
Time to peak power (TTPP) - the time from the onset of the
exercise bout until peak power is attained.
cummary
The information taken from the ergometer power test may
contribute to the evaluation and modelling of sprint
performance. Due to the many and varied physiological and
mechanical factors contributing to both of these events, a

8
single measure of PP or TW may not be an adequate indicator
of performance. Therefore, there is a need to determine what
physiological factors and to what degree these parameters are
associated with the performance in each sprint event. The
natural assumption is that individuals who produce high levels
of PP and TW on the ergometer test will also perform well in
the sprints. However, other factors such as acceleration and
fatigue can also influence performance. The extent to which
each of these factors affect performance is not yet completely
understood.
Chapter II
Review Of Literature
Introduction
This review focuses on power tests used to measure
anaerobic power, the reliability and validity of these tests,
and finally laboratory measures for predicting athletic
performance. The section on anaerobic power includes power
tests that were not used for this investigation. The section
on performance prediction also reviews methods that were not
used for this investigation. However, the information
provided in these sections may help explain the rationale
behind using a cycle ergometer power test as a method of
predicting sprint performance.
Anaerobic Power
Intense, anaerobic, sprint-type activity usually lasts
for less than 40 seconds (Evans, and Quinney, 1981).
Developing muscular power in such a short period of time
depends on the force and velocity that is produced by the
contracting muscle(s). As the velocity of concentric
contracting muscles increases the amount of force they are
able to produce decreases (Harrison, 1970; Sargeant et al.,
1981).
There have been many methods developed to measure
anaerobic power output. Some of these methods are; the
9

10
verticle jump used by Sargeant (1921), Stair-climbing used in
the Margaria power test, sprints of varying distances, high
speed treadmill running, and cycle ergometry tests (Bar-Or et
al., 1977; Cheetham et al., 1986; Margaria et al., 1966; Tharp
et al., 1985; Vandewalle et al., 1987).
The verticle jump test was introduced as a measurement
of muscular power in 1921 by L.W. Sargeant. In order to
estimate power from the height of a jump you must calculate
work and estimate the time required to do this work. This is
typically based on the acceleration due to gravity (9.8
m/sec). Verticle jump tests can easily be administered as a
field test (jump and reach) or a lab test. In the lab, a
force platform can be used. This enables the researcher to
measure instantaneous power by first calculating the
acceleration of the centre of mass, subtracting bodyweight
from the force exerted on the force platform and then dividing
the result by body mass. The instantaneous velocity of the
center of mass is calculated using the acceleration-time
equation. Instantaneous power is then equal to the product
of the force exerted on the force platform and the velocity
of the subjects centre of mass (Vanderwalle et al., 1987).
This test is relatively simple to administer and height is
easily measured. Also a high correlation (r=0.92) has been
found between the height of a jump and the power output
calculated by the force platform. This test has also been

11
shown to have a test-retest reliability of greater than 0.92
(Vandewalle et al.,1987). This test however is not without
fault. The height of a verticle jump has the dimension of
work not power. The height of a jump also depends on the test
protocol. For example is the subject allowed to swing his
arms or bend his knees past 90 degrees? A counter movement
such as squatting down right before jumping will usually
improve a subjects performance (Enoka, 1988). However some
power equations do not take into account the work that is
performed by lifting the body from a squatted position. Other
equations assume that the acceleration of the legs from the
squatted position is constant, even though data from force
platform experiments show that acceleration is not constant
(Vanderwalle et al., 1987).
In 1966 Margaria, Aghemo and Rovelli proposed a method
of measuring maximal power by calculating power output during
stairclimbing at maximal speed. Originally the subjects were
given a short run (2m) on a flat surface up to the stairs.
Stair height was standardized at 17.5 cm. The subject would
then bound up the stairs two at a time. Speed from the fourth
to the sixth step was calculated using photocells attached to
an electronic clock. This test assumes that the external work
is provided by actual lifting of the body. This test also
assumes that factors such as speed changes with each step are
inconsequential. The reason the test keeps an even number of
12
steps between photocells is to insure that the subject will
be in the same body position at each photocell. This test is
also highly reliable with test-retest correlation coefficients
between.0.85 and 0.90 (Margaria et al.,1966; Vandewalle et
al., 1987). A drawback of the stair-climbing test is that
bodyweight is not the optimal load to produce the best power
output results. Adding an additional 40% of the subjects
bodyweight results in 16% power output increase (Caiozzo, and
Kyle, 1980).
Power tests using cycle ergometers have recently become
very common in most laboratories. Originally these tests
looked at not only peak power output but also anaerobic power
capacity (Katch, and Weltman, 1979). Over time, different
protocols as well as different cycling apparatuses have been
developed. Some of these cycles used standard braking forces
while others used braking forces related to body weight
(Dotan, and Bar-Or, 1983; Katch et al., 1979). Given the fact
that maximal power output is a function of optimal force and
velocity, tests were done assessing only maximal power
output. These tests only lasted 5-7 seconds and were
performed against many different braking forces. The best
value for peak power was used (Crielaard, and Pirnay, 1981).
Much interest has been directed toward studying the
force-velocity relationship on a cycle ergometer. These
studies produced linear force-velocity relationships) and
13
parabolic power-velocity relationships. Most of these studies
used either friction loaded ergometers or isokinetic cycle
ergometers (Dotan, and Sargeant, 1984; McCartney,
Heigenhauser, and Jones, 1983; Nadeau, Brassard, and Cuerrier,
1983; Sargeant et al., 1981; and Too, 1990). The classical
hyperbolic force-velocity relationship is not as evident in
cycle ergometer tests. This is possibly due to the fact that
cycle ergometer protocols are very different from individual
muscle studies. Therefore the results of a cycle ergometers
force-velocity test are dependent on the protocol used. For
example; maximal power output was found to be 15% higher when
a subject is allowed to use a standing protocol as compared
to a sitting protocol (Vanderwalle et al., 1987).
Of all the cycle ergometer tests for anaerobic power
perhaps the best Known is the Wingate anaerobic power test
{WAnT). The WAnT was first introduced in 1974, and consisted
of a 30 second all out cycle test. This simple test was
designed aS a non-invasive method of measuring muscle
performance. Furthermore this test works on the assumption
that anaerobic power production is a local rather than a
systemic process. Therefore this test can be performed on
both the legs and the arms. The WAnt was developed to measure
three variables. Peak power which is the highest average
power during any 3-5 second period, mean power is the average
power sustained throughout the test and the rate of fatigue,

14
the degree to which power dropped during the test (Bar-Or,
1987). So far most research has focused on the indices of
peak power, and mean power while the fatigue rate has received
relatively little attention (Bar-Or, 1987).
Another type of ergometer test involves an isokinetic
dynamometer. This type of ergometer has an electronic motor
attached to it. This motor drives the cranks through a
variable speed gearbox. This allows the investigator to
control the pedaling frequency. The subject is instructed to
exert a maximal effort in an attempt to increase the pedaling
speed. While strain gauges that are attached to the cranks
monitor force production (Sargeant et al., 1981). Power
values for this type of test tend to show a parabolic
relationship with velocity. Peak power values are usually
found at approximately 110 rev/min with power output
decreasing at higher and lower velocities (Sargeant et al.,
1981).
The cycle ergometer system used in this investigation
was developed by Williams et al., (1988). This system has
been validated using a 40 yard dash. The study used a 15
second cycling protocol and concluded that the 40 yard dash
was a valid estimate of anaerobic power production ability as
predicted by the cycle ergometer test (Henrich et al., 1988).
This cycle ergometer test measures six power indices, PP,
TTPP, PFI, PFR, AP, and TW. Unlike the WAnT this test
15
measured PP as the highest power output value for one-half
pedal stroke (Williams et al., 1988). It has been suggested
that this system may provide insight into physiological and
mechanical factors which contribute to performance (Williams
et al., 1988; Williams, Barnes, and Signoile, 1990). The more
precise measure of PP that this system provides makes this
system preferable to other cycle ergometer systems that have
previously been used.
Anaerobic power tests are a valuable tool for assessing
human performance. All of the tests discussed have proven to
be very valuable to researchers. However, these tests are not
completely flawless. Many times the peak power measured in
these tests may not equal true maximal anaerobic power. Power
output can be influenced by a number of factors. One such
factor is motivation. If the subject is not motivated then
he will not exert a maximal effort and true PP will not be
achieved. Optimal loading is another factor that can affect
power output. For example, bodyweight is not the optimal load
for the Margaria stair climbing test. Increasing bodyweight
can improve power output by up to 16% (Caiozzo et al., 1980).
Another problem is that some tests determine a peak power
value by averaging power over a short period of time, usually
3-5 seconds (Vanderwalle et al.,1987). The cycle ergometer
system used in this investigation alleviates many of these
problems. Verbal encouragement was given to the subjects in
16
an effort to help motivate them. The optimal loading study
that was used for this investigation, Davy, Williams, Ward,
Smith, and Franke, (1990), was performed on the same ergometer
that was used for this investigation. This system also does
not determine peak power by averaging power values over a 3-
5 second period.
Reliability
The reliability of high-intensity short-term cycle
ergometry was investigated by Bar-Or et al. in 1977 while
developing the WAnT. They reported test-retest correlations
between 0.95 and 0.97. Other investigators have also shown
high reliability correlations using different protocols and
subject populations.
The WAnT has been shown to have a high day to day
correlations for PP (r= 0.93), AP (r= 0.93), and the PFR (r=
0.74) (Patton, Murphy, and Frederick, 1985). This test used
a resistance of 4.41 joules/rev/kgBW (Patton et al., 1985).
Another investigation used a five second all out cycling
protocol at a resistance from 9.8 to 63.6 N and _ showed
significant test-retest reliability. This study went on to
show that it is possible to take reliable measurements of
power for both men and women while varying the resistance
settings (Nadeau et al., 1983). Isokinetic cycle ergometers
have also shown high test-retest reliability for a range of

17
resistance settings. These correlation coefficients have been
as high as 0.99 (McCartney, Heigenhauser, and Jones, 1983).
It is important to establish reliability at different
resistance settings, but an important factor that must not be
overlooked is optimal loading. Properly loading a cycle
ergometer allows investigators to changes in performance and
increases reliability. Many different loads have been
suggested over the years. Initially for the WAnT a load of
0.075kg/kgBW was considered optimal. These tests however used
manly adolescent males as subjects (Vandewalle et al., 1987).
Later studies demonstrated that peak power was achieved
when the cycle ergometer was loaded at higher levels ranging
from 0.09 to 0.15 kg/kg of bodyweight. When assigning an
optimal load a researcher should take gender, age, and
anaerobic fitness level into account (Bar-Or, 1987; Davy et
al., 1990; Dotan et al., 1983; Patton et al., 1985). Recently
a study was performed on the constant load cycle ergometer
used in this study (Davy et al., 1990). This study concluded
that the optimal load for this ergometer was not the same as
the optimal load for the WAnT. This study concluded that
Significantly higher values for PP were achieved when loads
between 0.12 and 0.15 kg/kg of bodyweight were used (Davy et
al., 1990).
An investigation using a constant load cycle ergometer,
and an all out cycling protocol with varying durations was
18
done by Burke, Wojcieszak, Puchow, and Michael (1985). The
protocol consisted of four cycling trials (15, 30, 60, and
120 seconds). Each trial used a load of 5 kp. The
investigation showed intra-class correlations for AP (watts),
TW (kj), and TTPP (sec) of 0.86, 0.79, and 0.97. These
correlations indicate that these parameters are stable across
the different time durations. However, as test duration
increased, peak power decreased from 710 W for a 15 second
test to 620 W for a 120 second test (Burke et al., 1985).
This phenomena is believed to be related to subject
motivation. It is believed that when facing a longer power
test the subjects were less inclined to give a maximal effort
at the onset of the test in an effort to conserve energy for
the longer test duration (Burke et al., 1985). A more recent
study found high intraclass correlations ranging form 0.91 to
0.97 for different power indices during a 15 second maximal
cycling bout on a constant load cycle ergometer (Williams et
al., 1988). A third study used a five second protocol and
again found high reliability (Nadeau et al., 1983). These
studies suggest that reliable power data can be obtained using
protocols of various duration.
A major factor in increasing the reliability of power
measurements has been the introduction of microcomputer data
collection systems (Harman, Knuttgen, and Frykman, 1987;
Williams et al., 1988). The cycle ergometer design, the
19
microcomputer system, and the data collection programs used
for these investigation were based on the equipment used by
Williams et al. (1988).
Validity
A major concern in any investigation is whether or not
the study is actually measuring the variables it claims to be
measuring. The presence of blood lactic acid, a byproduct of
glycolysis, is an indirect indicator that anaerobic metabolism
is taking place in the skeletal muscle. This method of
validating anaerobic power tests has been successfully used
in other investigations (Jacobs, Bar-Or, Dotan, Karlsson, and
Tesch, 1983; Margaria, Cerretelli, and Mangili, 1964;
McCartney et al., 1983; McCartney, Spriet, Heigenhauser,
Kowalchuk, Sutton, and Jones, 1986). Normally resting blood
lactic acid values range from 1.0 to 2.5 mmol/l (McArdle,
Katch, and Katch, 1986). However after a 30 second all out
cycle ergometer trial, blood lactic acid values increase
significantly to 61 mm/kg of body weight (Jacobs et al.,1983).
Other investigations have reported similar changes in blood
lactic acid level after all-out cycle ergometer tests of
varying durations and using a variety of populations (Bar-
Or, 1987; Vanderwalle et al., 1987). Significant increases
in blood lactic acid were also found for cycling tests of
varying duration (Burke et al., 1985).

20
Blood lactic acid is not the only direct measurement of
anaerobic metabolism. Intramuscular lactic acid levels can
also be measured using muscle biopsy techniques. Research
has shown that muscle lactic acid levels can significantly
increase after only 10 seconds of maximal exercise (Hiroven,
Rehunen, Rusko, and Harkonen, 1987; Jacobs et al., 1983).
Blood and muscle lactic acid levels during intermittent
maximal treadmill or cycling were compared. These tests
showed that blood lactic acid increased continuously while
muscle lactic acid increased during exercise and recovered
slightly during the rest intervals but eventually plateued
(Hermansen, and Osnes, 1972). These results suggest that
blood lactic acid may not directly indicate changes in
intramuscular pH (Roberts, and Smith, 1989). These studies
show that there has been a lot of research validating
different anaerobic power test protocols using blood and
muscle lactic acid tests. These results show that high
intensity exercise lasting at least 10 seconds in duration
definitely uses anaerobic metabolic pathways.
Predicting Performance
Researchers have been using laboratory measures as a
means of predicting athletic performance for many years.
Throughout this time the most widely used physiological
variable for predicting running performance has been maximum
21
oxygen uptake (VO, max). In fact many athletes believe that
this one variable alone can accurately predict their athletic
performance (Noakes, 1988). More recent research however has
shown that VO, max may not be the best predictor of running
performance (Noakes, Myburgh, and Schall, 1990). This
investigation found that peak treadmill running velocity was
the best predictor of running performance. This investigation
went on to show that when peak treadmill running velocity was
combined with other laboratory measures such as VO, max and
lactate turnpoint that their combined ability to predict
performance was greater than any one single measure. Multiple
linear regression techniques were used _ to show this
relationship.
VO, max measurements have also been used in testing
sprint athletes. The VO, max values were lower for elite
sprinters than is normally found for elite endurance athletes.
This is expected and reflects the fact that endurance events
are largely aerobic while sprinting is mainly anaerobic. The
different results may be attributed to the different training
regimens that these athletes use or simply natural selection.
While athletes with a higher aerobic capacity, and VO, max
compete in distance events, those with a lower VO, max may be
more apt to compete in sprinting events (Barnes, 1981).
Whether or not cycle ergometer tests are valid predictors
of performance outside of the lab is a question that has not
22
been sufficiently answered. There are conflicting opinions
in the literature as to whether or not cycle ergometer
performance is related to sprint performance. Some research
has shown that the WAnT can be used to predict sprinting
ability (Bar-Or, and Inbar, 1978). This investigation showed
Significant correlations between the WAnT and times for the
40m, 300m, and 600m runs. Another study compared not only the
WAnT and sprint times (50yd, and 600yd) but also the verticle
jump and the long jump (Tharp et al., 1985). This study found
that the WAnT was only a moderate predictor of sprint
performance. However, the values did increase when power
output was expressed relative to body weight. Another
question that needs to be answered is whether or not cycle
ergometer tests are specific to sprint performance. Tharp,
Johnson, and Thorland (1984) confirmed this question when he
found that the WAnT was able to differentiate between sprint
and endurance runners. Sprinters developed a greater amount
of anaerobic power and had a larger anaerobic capacity than
the distance runners (Tharp et al., 1984). It is interesting
to note that in each of the previously mentioned studies the
correlations between cycle ergometry and sprint performance
increased when power values were expressed relative to body
weight.
Muscular power is another important factor in human
performance. The relationship between muscular power and
23
swimming performance has been looked at by a number of
investigators (Reilly et al., 1988; Sharp, Troup, and Costill,
1982). These investigations showed a high correlation between
power output and swimming velocities. Although these
correlations fell as swim distance increased. Both of these
investigations used a swimbench to measure muscular power
values. One of the investigations also used arm and leg cycle
ergometers (Reilly et al., 1988). This study showed strong
relationships between the ergometer values and the swim speeds
at shorter distances. This study went on to show that PP
values were a better indicator of performance than AP values.
The results from these studies clearly show that training
programs designed to improve arm and leg power can improve
short distance swimming performance.
Like swimming, power tests have also been used as
performance indicators for sprinters. Investigations using
cycle ergometer tests as predictors of sprint performance have
yielded conflicting results. Studies have concluded that the
WAnT is not a strong predictor of sprint performance, another
study has shown that the WAnT is a fair predictor of sprint
performance while a third study has shown that a 15 second
cycle ergometer test is significantly related to sprint
performance (Henrich et al., 1988; Tharp et al., 1984; Tharp
et al., 1985). However two of these investigations used
adolescent males and females as subjects. Therefore, the
24
results may be different for an adult population. Obviously
running speed varies as a function of time and the speed-
distance relationship is dependent on the age and gender of
the subject. Another facto that must be considered is the
training level of the subject. Tkai (1967) found that the
propelling force, calculated from the speed curve, was greater
in trained sprinters than in untrained sprinters of equal
muscle strength. This suggests that the isometric muscle
strength that is used at the start of a sprint can be more
efficiently transformed into dynamic propelling force by
trained sprinters than by untrained sprinters. Another study
went on to show that even though sprint times were shown to
be highly reproducible, there are significant differences
between experienced and beginning sprinters, with respect to
maximal attained speed, the time needed to reach this speed,
and reaction time to the start of the sprint (Volkov, and
Lapin, 1979). The same study by Volkov, and Lapin (1979),
went on to conclude that the energy supply to muscles during
sprinting comes from the cleaving of intramuscular reserves
of ATP and creatine Phosphate. Therefore, maximal speed in
sprint running may be considered the equivalent of the maximal
rate of energy liberation in the lactic
anaerobic process.
Conclusions
25
As this review shows, anaerobic power tests have proven
to be highly reliable and valid. The previous research done
in this area is encouraging but many of the tests use modes
of action that are not commonly found in sport, such as stair-
climbing and broad jumping. Cycle ergometer tests use most
of the same muscle groups as sprinting. However a more
precise measure of power output is needed to predict
performance outside the lab. This investigation used a
computer integrated cycle ergometer system to measure power
output. The results of these power output tests were then
correlated to sprint times of varying distances, in an effort
to develop a method of using a laboratory measure to predict
performance.
Chapter III
Journal Manuscript
Relationships Between Sprint Performance,
Power Output, and Fatigue
Abstract
James Shorten
This investigation used a constant-load cycle ergometer
as a way of examining relationships between the cycle
ergometer and sprint performance. Twenty-five college-aged
males were used for this investigation. Following a three
minute warm-up, each subject performed a 15 sec. maximal bout
on the cycle ergometer. The resistance load on the ergometer
was set at 0.12kg/kg of bodyweight. Peak power (PP), average
power (AP), time to peak power (TTPP), power fatigue rate
(PFR), and power fatigue index (PFI) were computed using a
microcomputer system. In addition, PP,AP, and PFR were
adjusted for total bodyweight (PP/kg, AP/kg, PFR/kg). Ona
separate day each subject performed six sprints two each at
50m, 100m, and 200m. Each sprint was electronically timed and
starting blocks were used. Initially low correlations were
found between the ergometer parameters and the sprint times
(r=.07-.55). However upon closer evaluation stronger
relationships appeared to exist for the faster subjects.
Subject subgroups for the 50m (T<7.5sec.), 100m (T<1l4sec.),
26

27
and 200m (T<26.6sec.) showed higher correlations (r=.06-.70).
Further analysis revealed that high inter-variable
correlations existed between many of the ergometer variables.
Based on these observations the parameters were separated into
four groups. Group I contained variables of absolute power
(PP,AP), group II were variables of relative power (PP/kg,
AP/kg), group III contained variables of fatigue (PFR, PFI,
PFR/kg), and group IV consisted of (TTPP), the only variable
of acceleration. Equations for predicting sprint performance
were developed using one to four variables with only one
variable from each group being used. The best equation was
considered to be the one that yielded the highest r* value
while also yielding the lowest Akakai Information Criteria
value and MSE. Variables from the relative power group and
fatigue group were the best predictors of performance. These
results suggest that the cycle ergometer used in this
investigation can be used for evaluating the components of
sprint performance in untrained males, and that this test is
best when compared to the 200 m dash.
28
Introduction
Many daily activities as well as numerous athletic events
involve short-term intense or sprint-type efforts. Compared
to prolonged aerobic activities, little effort has been
directed towards the study of short, intense, anaerobic
activities. Such activities typically involve dynamic
muscular contractions in which the muscle contracts with some
velocity and with some force. As muscular contraction
velocity increases, force decreases. The product of these
parameters is power which reaches a peak at moderate force
and velocity (Harrison, 1970; Sargeant et al., 1981).
A number of methods have been developed to measure
anaerobic power output. Some of these methods are; the
verticle jump, stair-climbing, sprints of varying distances,
high speed treadmill running, and cycle ergometry tests (Bar-
Or et al., 1977; Cheetham et al., 1986; Margaria et al., 1966;
Tharp et al., 1985; and Vanderwalle et al., 1987). Possibly
the most commonly used laboratory method for assessing
anaerobic power output is the cycle ergometer. This may be
due to the high reliability and the relative ease of which
force and velocity measurements can be taken (Bar-Or, 1987;
Williams et al., 1988). A test for anaerobic power output
using a stationary constant load cycle ergometer which allows
for the close examination of the rapid changes in power was
recently developed by Williams et al., 1988. Early results
29
indicate that during a 15 second effort, power output reaches
peak power in 3-5 seconds. Following this, a slow decline in
power output takes place until the end of the test (Williams
et al., 1988; Williams et al., 1988). Thus, this system can
determine the peak power output achieved, the acceleration to
peak power, the rate and magnitude of short term fatigue. Low
correlation coefficients between each parameter indicates that
these variables are independent of each other (Williams et
al., 1988). Indicating that each describes a different aspect
of short term exercise performance.
A relationship between speed and time for the 100m dash
that is qualitatively similar to the power curves obtained by
Williams et al. (1988) was shown by Ikai in 1967. Undoubtably
there are many factors that contribute to sprint performance
such as acceleration and resistance to short term fatigue.
Thus, a single measurement of PP alone may not fully account
for sprint performance (Williams et al., 1990). For example,
one sprinter may have a slow TTPP but a low PFR while another
sprinter may have a fast TTPP but a high PFR. Even though the
sprint styles of these two sprinters are very different they
may still have similar sprint times. For this reason this
constant-load cycle ergometer test may be useful in evaluating
and predicting sprint performance. The purpose of this study
was to determine the individual relationships between sprint
performance and each of the power test parameters, and to
‘30
determine the best subset of parameters to predict performance
in each of the sprint events.
Methods
Subjects
Subjects were 25 college-aged males. All subjects were
physically active but were not engaged in an organized
training program. Each subject was required to read and sign
an informed consent form that explained participation
procedures, risks, and benefits before the onset of the study.
Each subject completed one anaerobic power test on the
cycle ergometer and 6 sprints, 2 each of 50m, 100m, and 200m.
The power test and the sprints were administered on separate
days. In addition, the subjects were instructed to abstain
from exercise for at least twelve hours prior to any of the
tests.
Power Tests
A modified 818 front loading Monark cycle ergometer was
used in conjunction with a microcomputer to collect and record
the power output data from each subject. The ergometer
design, computer software, data collection procedures, and
cycling protocol were modeled after those used by Williams et
al., (1988). This system determines power output for each
one-half peddle revolution and also calculates from the
temporal changes in power peak power (PP), time to peak power
31
(TTPP), power fatigue rate (PFR), power fatigue index (PFI),
and average power (AP). Values of PP, AP, and PFR were also
adjusted for total bodyweight (PP/kg, AP/kg, and PFR/kg).
The cycle ergometer protocol consisted of a 3 minute
warm-up at 50 rpm. This was followed by a 15 second maximal
cycling effort. The resistance load was set at 0.12 kg/kg of
bodyweight (Davy et al., 1990). The test began with the
pedals in a static horizonal position with the subjects
preferred foot forward. Toe clips were also worn. Previous
work using this ergometer system has shown very high test-
retest correlation coefficients (r= 0.90-0.95). Thus, only
one cycle ergometer bout was required for each subject
(Williams et al., 1988).
Sprint Testing
Sprint performance was based on the finish time for each
sprint. Each sprint was timed electronically and was
performed individually. All sprints took place on an outdoor
track uSing starting blocks and an auditory starting signal.
Since the sprints took place on a outdoor track care was given
to avoid adverse conditions such as high winds or a wet track.
The subjects were allowed to stretch, jog, practice
accelerating out of the blocks, familiarize themselves with
starting positions and otherwise warm up for the sprints.
When the subject was ready, the starter depressed a switch.
This simultaneously started an electronic timer and sounded

32
an auditory tone. At the sound of the tone the subject began
sprinting. At the finish line was placed a infra-red motion
detector. The beam, emitted by the infra-red unit, bounced
off of a reflector placed on the opposite side of the running
lane and was detected by the unit that emitted it. The infra-
red unit was also connected to the electronic timer. Once the
timer was started it ran freely as long as the infra-red beam
was intact. Once the beam was broken by the subject the timer
stopped. The time was then noted by the investigator.
Statistics
Multiple linear regression was used to determine which
individual variables and which combination of variables had
the highest correlations with the sprint times. The Akaiki
Information Criteria (AIC) was also used to determine the best
combination of variables for predicting performance. The
group of variables with the lowest AIC value and mean squared
error (MSE) was considered to be the best. Significance was
established at p<.0Q5.
Results
The subjects displayed a wide range of sprinting ability.
Ranging from 6.55-8.27 sec. in the 50m, 12.16-15.92 sec. in
the 100m, and 22.7-30.75 sec. in the 200m. However, these
times were highly reproducible. Correlations between the
first and second sprints were r=0.98 for the 50m, r=0.86 for
the 100m, and r=0.88 for the 200m. When each subjects best

33
time for each sprint was compared to the parameters taken from
the ergometer test (PP,TTPP,PFR,PFI,AP) and the relative
parameters (PP/kg, AP/kg, and PFR/kg) low correlations were
found (r= 0.07-0.55) (table 1). After plotting the ergometer
and relative parameters versus the sprint times, stronger
relationships appeared to exist for the faster subjects. In
fact for subjects whose 50m sprint times were below 7.5
sec.{(n=16), 100m times below 14 sec. (n=15), and 200m times
below 26.7 sec. (n=15) somewhat higher correlations were found
(r= 0.06-0.70) (table 1).
Further analysis of the data revealed that high inter-—
variable correlations (r >.88) existed between several of the
ergometer variables (table 2). Based on these correlations,
the variables were separated into four groups. Group I
contained variables of absolute power (PP,AP), group II were
variables of relative power (PP/kg, AP/kg), group III
consisted of variables of fatigue (PFR, PFI, PFR/kg), and
finally group IV contained the only variable of acceleration
(TTPP).
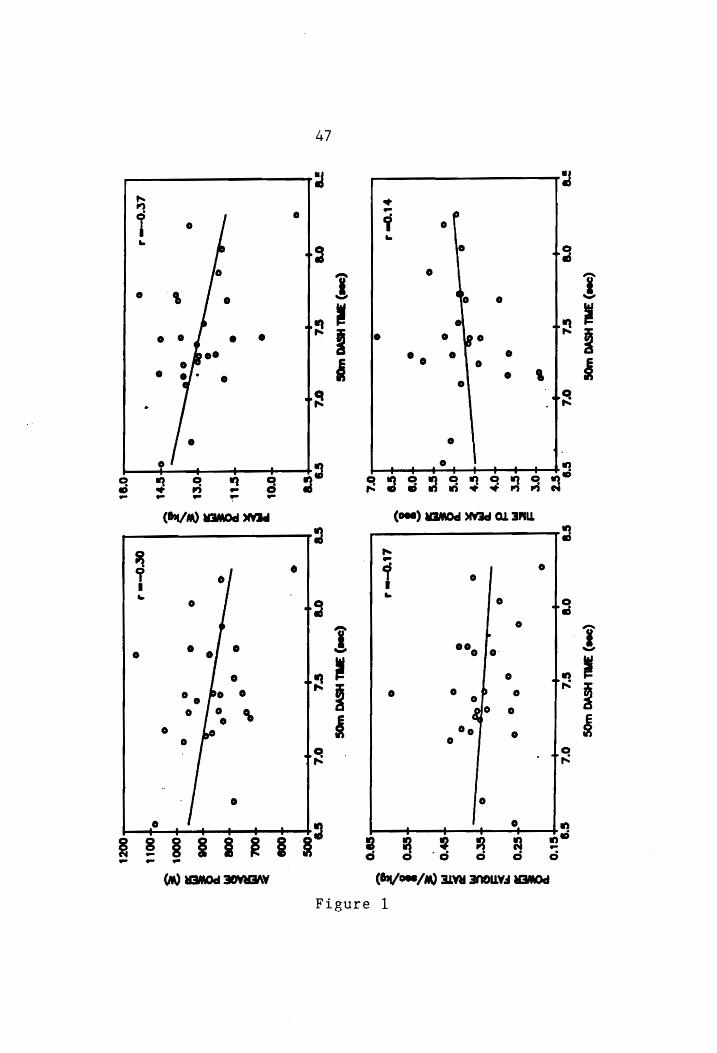
When the best variable from each of the four groups was
compared to the sprint times, as expected negative
correlations were found with the variable from the absolute
power, relative power and fatigue groups, while a positive
correlation was found with the acceleration variable (figures
1,2,and 3). Although the magnitude of these correlations were
34
low the directionss were as expected. For example, as PP/kg
increased sprint time decreased.
Equations for predicting sprint performance were
developed using a combination of one to four variables with
only one variable from each group being used. Multiple
regression was performed on all possible variable combinations
and the best equation was considered to be the one that
yielded the highest r? value while also yielding the lowest
AIC value and MSE. These procedures were performed on the
entire subject group and on the subgroups of more accomplished
subjects (Tables 3 and 4). In the more accomplished group the
best model for each distance contained two variables, one from
the relative power group and one from the fatigue group (Table
4A). This was somewhat surprising because acceleration was
initially thought to be a large factor in the 50m sprint. As
expected fatigue was a major factor in the 200m sprint.
The data obtained from these correlations was then used
to develop equations for predicting sprint performance. These
equations are presented in table 5. When the predicted sprint
times were compared with the actual sprint times, it was
noticed that these equations tended to predict even faster
times for the faster subjects and slower times for the slower
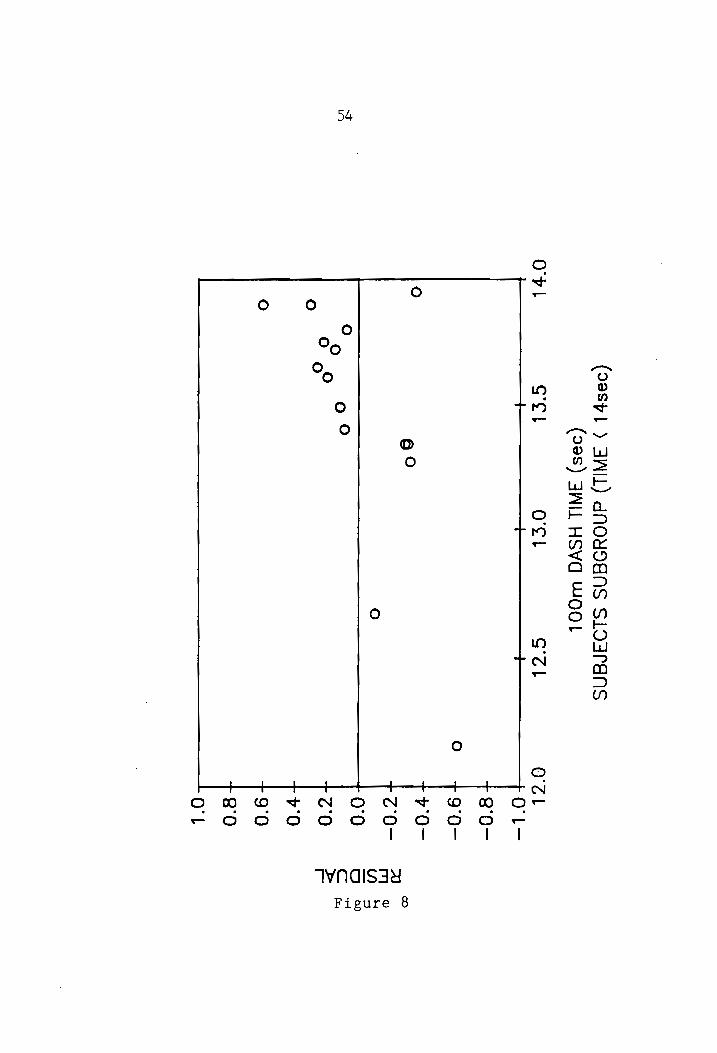
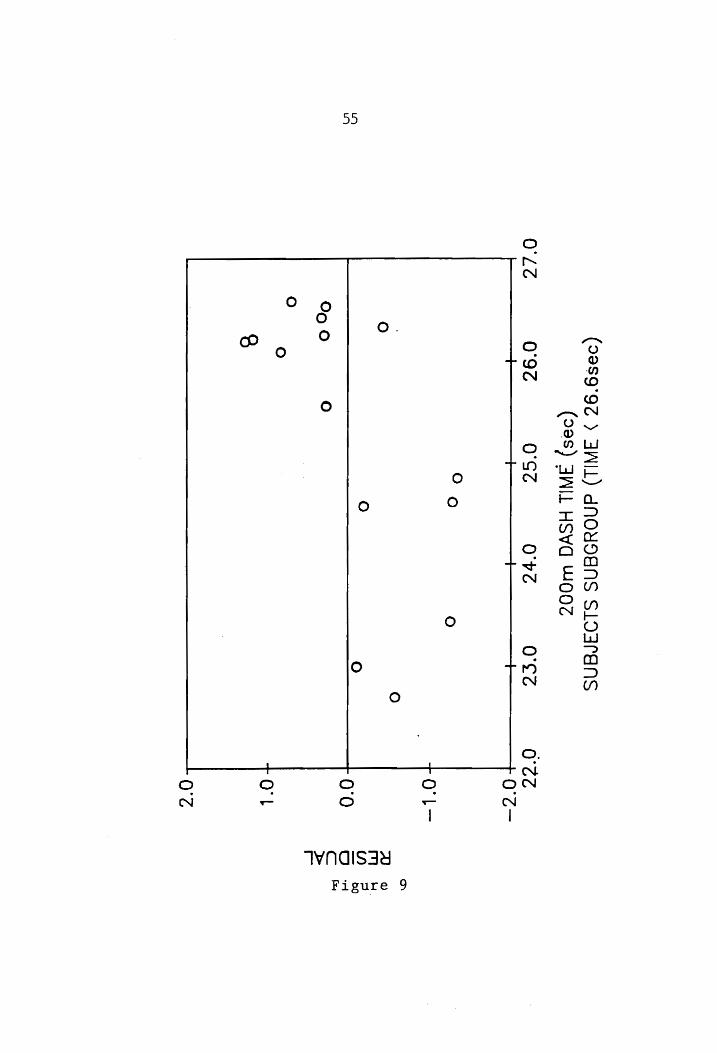
subjects (figures 4, 5, and 6). The subjects were then
divided into subgroups, as described earlier. A separate set
of prediction equations were derived from these data subsets.
35
These equations are presented in table 6. For most of the
subjects in these subgroups the equations predicted slower
sprint times than were actually the case. However, the faster
subjects still had faster predicted times and the slower
subjects had slower predicted times (figures 7, 8, and 9).
Discussion
These results show that performance on this cycle
ergometer test can account for a significant amount of the
variability in performance for the 50m, 100m, and 200m dashes
of untrained male subjects. This investigation also
demonstrated that the cycle ergometer test used in this
investigation is a better predictor of performance for a group
of faster subjects than for a large heterogeneous group.
Furthermore, this cycle ergometer showed a better ability to
predict performance for the 200m sprint than for the 50m
sprint.
The most indicative parameters of performance were the
relative power and fatigue variables. Surprisingly,
especially for the 50m sprint, of the four parameter groups
that were used, acceleration, namely TTPP, was the poorest
indicator of performance. Initially TTPP was thought to play
a large part in short sprint performance. However, these
results suggest that either TTPP, as determined by cycle
ergometry, is not a sensitive measure of acceleration during
a sprint, and/or acceleration contributes little Lo

36
performance in this subject group.
As established earlier, the cycle ergometer can account
for a significant portion of the variability associated with
sprint performance. However it cannot account for all of the
variability. There are a number of factors which might
account for this unexplained variance. First is the extent
to which upper body arm movement contributes to sprint
performance. The arms and shoulders contribute to sprint
performance mainly as compensatory movements. For example,
if you viewed a sprinter from above you would notice that as
the lower body (hips and legs) rotates clockwise the upper
body (arms and shoulders) rotates counter-clockwise. Also as
the left leg comes forward the right arm goes back and vice
versa (Tricker, and Tricker, 1967). Another factor may be
that these were untrained subjects. This conclusion is
supported by the fact that there was a stronger correlation
between the power output values and sprint performance of the
group of faster subjects. Also these subjects were untrained
in using starting blocks. It has been suggested that trained
sprinters are better able to convert the isometric forces
exerted on the starting blocks into propelling force for
sprinting (Ikai, 1967). This may also explain why TTPP was
a poor indicator of performance. Another possibility is the
difference in exercise duration between the cycle ergometer
and sprint efforts. Tt took longer to run the 200m than it
37
did to complete the power test. However longer cycle
ergometer tests have been associated with a decrease in peak
power output. This has been attributed mostly to motivational
factors (Burke et al., 1985). Finally there are differences
between cycling and running. As discussed earlier cycling
does not utilize the upper body. When the subject is cycling
his feet travel in a circular path. Although the path of a
sprinters feet does not move ina perfectly circular path, it
does follow the motion of a point on the circumference of a
wheel surprisingly closely (Tricker et al., 1967). For the
most part the same major muscle groups are used for both
actions, but the application of forces from these muscles
differs somewhat.
These data suggest that the cycle ergometer test used in
this investigation can be used for evaluating the components
of sprint performance in untrained males. They also suggest
that this test is best when it is compared to the 200m dash.
It remains to be seen if this test is applicable to trained
or elite calibre athletes and females, and if specific
training programs improve specific aspects) of sprint
performance. The results from this study suggest that the
ergometer test may yield better results with trained
sprinters. This raises the possibility that this test could
be used to design training program targeted at specific
sprinting deficiencies, and then used to evaluate these
38
programs. For example, a sprinter who displays high PP/kg but
a lower PP compared to other sprinters may want to work on
other aspects of his performance instead of trying to generate
a higher PP. Also a sprinter with a high PFR/kg may want to
work on his short term endurance in order to improve his
performance. A coach, trainer, or athlete could then use this
information to construct a specific training program. The
ergometer test could then be used to gauge progress and
quantify resulting changes in performance. Further study in
this area is needed to confirm these speculations.
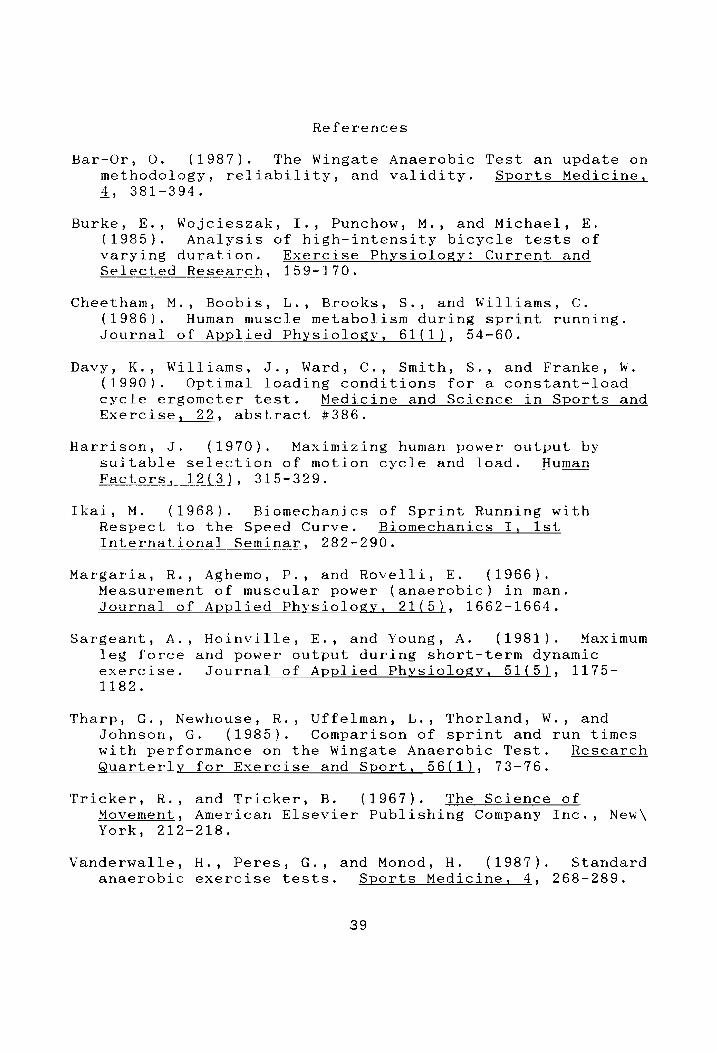
References
Bar-Or, O. (1987). The Wingate Anaerobic Test an update on
methodology, reliability, and validity. Sports Medicine,
4, 381-394.
Burke, E., Wojcieszak, I., Punchow, M., and Michael, E.
(1985). Analysis of high-intensity bicycle tests of
varying duration. Exercise Physiology: Current and
Selected Research, 159-170.
Cheetham, M., Boobis, L., Brooks, S., and Williams, C.
(1986). Human muscle metabolism during sprint running.
Journal of Applied Physiology, 61(1), 54-60.
Davy, K., Williams, J., Ward, C., Smith, S., and Franke, W.
(1990). Optimal loading conditions for a constant-load
cycle ergometer test. Medicine and Science in Sports and
Exercise, 22, abstract #386.
Harrison, J. (1970). Maximizing human power output by suitable selection of motion cycle and load. Human
Factors, 12(3), 315-329.
Ikai, M. (1968). Biomechanics of Sprint Running with
Respect to the Speed Curve. Biomechanics JI, Ist
International Seminar, 282-290.
Margaria, R., Aghemo, P., and Rovelli, E. (1966). Measurement of muscular power (anaerobic) in man. Journal of Applied Physiology, 21(5), 1662-1664.
Sargeant, A., Hoinville, E., and Young, A. (1981). Maximum leg force and power output during short-term dynamic
exercise. Journal of Applied Physiology, 51(5), 1175-
1182.
Tharp, G., Newhouse, R., Uffelman, L., Thorland, W., and
Johnson, G. (1985). Comparison of sprint and run times
with performance on the Wingate Anaerobic Test. Research
Quarterly for Exercise and Sport, 56(1), 73-76.
Tricker, R., and Tricker, B. (1967). The Science of Movement, American Elsevier Publishing Company Inc., New\
York, 212-218.
Vanderwalle, H., Peres, G., and Monod, H. (1987). Standard anaerobic exercise tests. Sports Medicine, 4, 268-289.
39

40
Williams, J., Barnes, W., and Signorile, J. (1988). A
constant-load ergometer for measuring peak power and
fatigue. Journal of Applied Physiology, 65(5), 2343- 2348.
Williams, J., Barnes, W., and Signoile, J. (1990).
Temporal changes in power output during brief, high-
intensity dynamic exercise. Exercise Physiology: Current
and Selected Research, 123-132.
Williams, J., Signorile, J., Barnes, W., and Henrich, T. (1988). Caffeine, maximal power output and fatigue.
British Journal of Sports Medicine, 22(4), 132-134.
41
Figure Captions
Figure
1 Individual Variable Plots For The
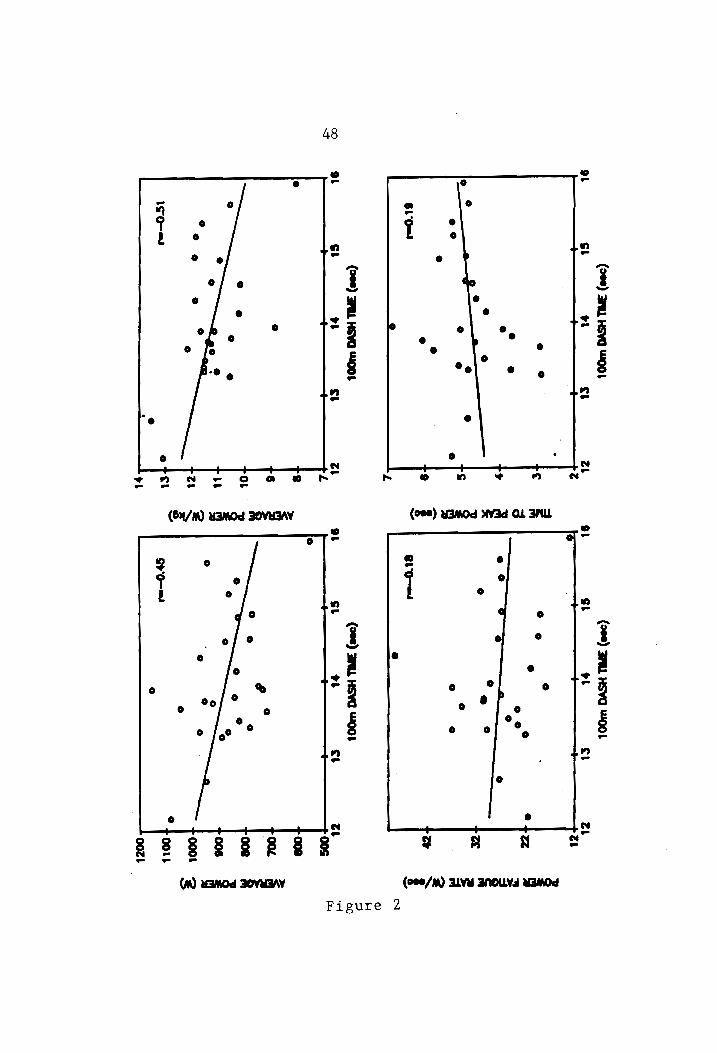
2 Individual Variable Plots For The
3 Individual Variable Plots For The
4 Residuals For All Subjects In The
5 Residuals For All Subjects In The
6 Residuals For All Subjects In The
7 Residuals For Subject Subgroup In
8 Residuals For Subject Subgroup In
9 Residuals For Subject Subgroup In
50m Sprint
100m Sprint
200m Sprint
50m Sprint
100m Sprint
200m Sprint
The 50m Sprint
The 100m Sprint
The 200m Sprint
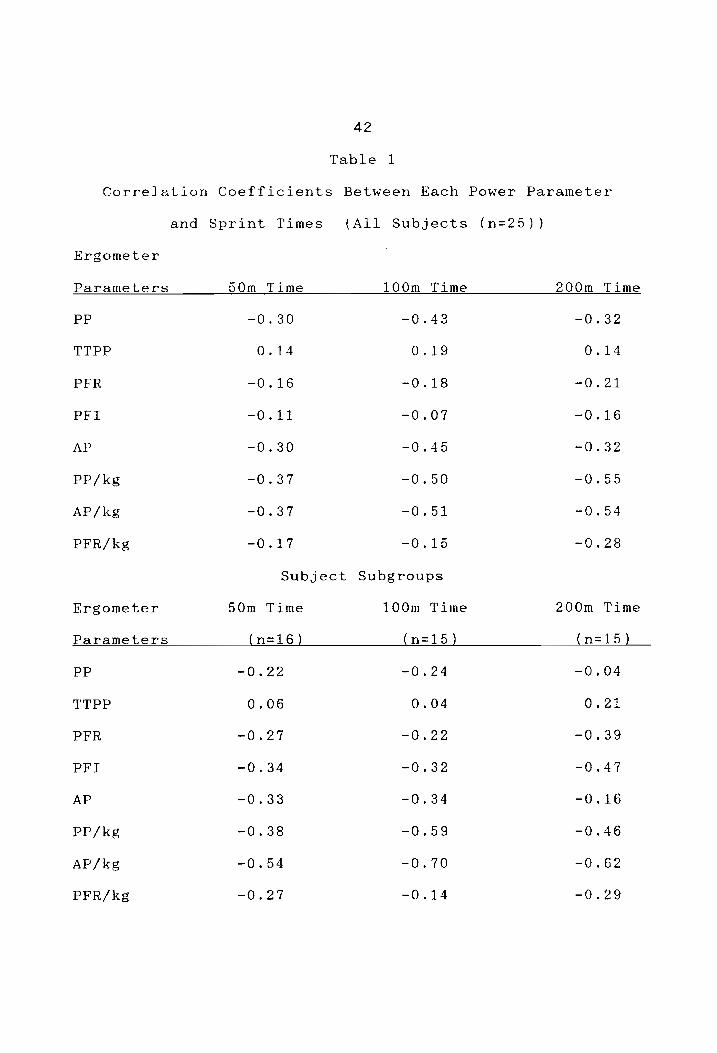
42
Table 1
Correlation Coefficients Between Each Power Parameter
and Sprint Times (All Subjects (n=25) )
Ergometer
Parameters 20m Time 100m Time 200m Time
PP -0.30 ~0.43 -0.32
TTPP 0.14 0.19 0.14
PFR -0.16 -0.18 -0.21
PFI -O.11 -0.07 -0.16
AP -0.30 ~0.45 -0.32
PP/kg -0.37 -0.50 -0.55
AP/kg -0.37 -0.51 -0.54
PFR/kg -0.17 -0.15 -0.28
Subject Subgroups
Ergometer 50m Time 100m Time 200m Time
Parameters (n=16 ) (n=15 ) (n=15)
PP -0.22 -0.24 -0.04
TTPP 0.06 0.04 0.21
PFR -0.27 -0.22 -0.39
PFI -~0.34 -0.32 -0.47
AP -0.33 -0.34 -0.16
PP/Kg -0.38 -0.59 -0.46
AP/kg -0.54 -0.70 -0.62
PFR/kg -0.27 -0.14 -0.29
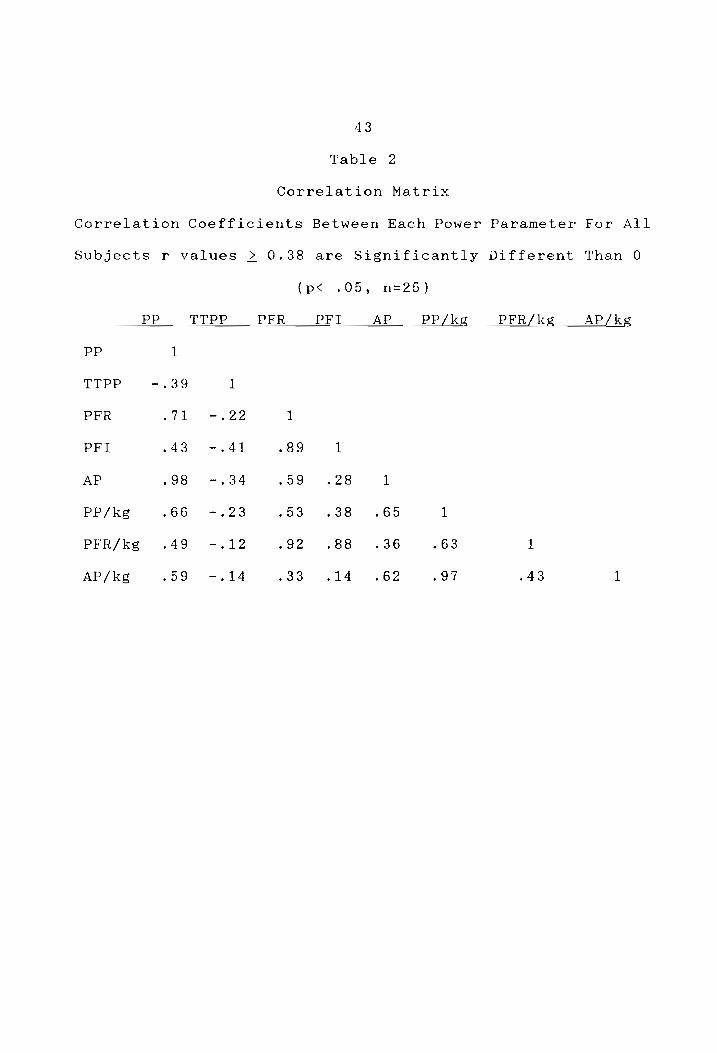
43
Table 2
Correlation Matrix
Correlation Coefficients Between Each Power Parameter For All
Subjects r values > 0.38 are Significantly Different Than 0
(p< .05, n=25)
PP TTPP PFR PFI AP PP/kg PFR/kg AP/kg
PP 1
TTPP -.39 1
PFR ~71 #-.22 1
PFI 43 -.41 89 1
AP -98 -.34 59 .28 1
PP/kg -66 -.23 -53 .38 #.65 1
PFR/kg .49 -.12 92 .88 .36 -63 1
AP/kg 59 -.14 33 .14 .62 ~97 43 1

44
Table 3
Reduced 4 Variable Models
All Subjects (n=25)
Multiple Regression Results
Best Model Based on Highest r’, Lowest AIC, and MSE
* Designates the Best Model
r* > 0.145 is significant
Sprint Distance Parameters Used MSE AIC
50m * PP/kg 14 0.15 -45.90
PP/kg, PFR/kg ~15 0.15 ~44.11
PP,PFR,PP/kg -15 0.16 -42.29
TTPP,PFR,AP,PP/kg ~15 0.17 -40.32
100m * AP/kg ~ 26 0.63 -9.48
AP,AP/kg ~29 0.64 -8.48
PP,PP/kg,PFR/kg 31 0.64 -7.34
PP,TTPP,PP/kg,PFR/kg 31 0.68 -5.35
200m * PP/kg 30 3.80 35.30
PFR,PP/kg »31 3.93 36.99
TTPP,PFR,PP/kg ~31 4.11 38.97
PP,TTPP,PFR,PP/kg ~31 4.31 40.96

45
Table 4
Reduced 4 Variable Models
Multiple Regression Results
Best Model Based on Highest r’*, Lowest AIC, and MSE
Subject Subgroups
* Designates the Best Model
2
Sprint Distance Parameters Used r MSE AIC
50m (n=16) AP/kg 0.29 0.05 -46.49
(T < 7.5sec) * AP/kg,PFR/kg 0.44 0.04 -48.36
(r? > 0.232 PP,PFR,AP/kg 0.45 0.04 -46.47
is significant) TTPP,PFR,AP,PP/kg 0.45 0.05 -44,69
100m (n=15) AP/kg 0.50 0.13 -28.71
(T < 14.0sec) * PFR,AP/kg 0.53 0.13 -27.88
(r? > 0.247 PFR,AP,AP/kg 0.54 0.14 -26.03
is significant) TTPP,PFR,AP,AP/kg 0.54 0.15 -~24.18
200m (n=15) AP/kg 0.39 1.20 4.62
(T < 26.6sec) * PFR,AP/kg 0.63 0.79 0.99
(r* > 0.247 PP,PP/kg,pfr/kg 0.64 0.85 0.82
is significant) TTPP,AP,PP/kg,PFR/kg 0.64 0.93 2.80

46
Table 5
Prediction Equations
Reduced 4 Variable Model
All Subjects
50m time = 8.87 - 0.110 (PP/kg)
100m time 18.58 - 0.405 (AP/kg)
200m time 38.49 - 0.906 (PP/kg)
Subjects Subgroups
50m time= 8.69 - 0.168 (AP/kg bod. wt.) + 1.093 (PFR/kg)
100m time 16.62 + 0.015 (PFR) - 0.314 (AP/kg)
200m time iT) 34.96 + 0.124 (PFR) - 0.992 (PP/kg)
4/7
a
¢ =—0.37
73
SOm DASH
TIME (
sec)
1 6.0
75
50m DASH
TIME
(se
c)
3
g - 11
004,
SEh 8 ES (A) 8aMOd J0vUaAV
r=O.14
75
8.0
50m
DASH
TIM
E: (sec)
7.0
r =—O.17
3 d
Figure l
°
oo,
e
° of °
eo 68
od ©
6
. +
6
toe z 2 a:
°o So oe So
(6 /o0e/m) SLY SNOLLYS WaMOd
7.8
50m DASH
TIME
(sec)
é
8.3
8.0
48
16
r=—0.51
16
15
14
100m DASH TIME (sec)
e
ra0.
19
14
100m DASH TIME (sec)
ra —0.45
ns oe
833382 8 & -rff .
(A) waMOd 30vUaAY
Figure 2
-2 +n
“ } N - s ” a
(006) WaMOd NV3d OL SAU. o ©
= ao”
2 | °
6
in p e oo om ~~
i |» | 3 e
a ° a ¢ oT
6 e e
e °
g o ° ° g L" +” -
°
°
x + +———+- = $ 8 8 %
(000/M) BV SNOWY Wad

Ov st
3
Go
+¢
° 0
° +Y
°
0,
ee
° °
oe °
e rs
° ° °
+9
vlom
2. L
(908) SFL HSVO
WOOZ
ico ee
ee
ee
e +T6
e 7°
Thi.
TZ
Tel
Toi
TS1
9}
(000) WaMOd NV3d O1 INL (84%/m) Lad V3d
te ore
(906) 3HLL HSVO WO0Z ez
4% 9
SZ ot
CZ
(84/m) SLVe 3NOUVS UIMOd (A) UEMOd 30vaAV
Figure 3

50
0°6
SLOSPENS TV
(98S) SIWIL
HSV
WOS
1 '
0°9
G’8 0°8
GL OL
'G°g
o O
OlL—
0'0
O'l
STWNQISSY Figure 4

51
SLOArENS Tv
(998) 3WIL
HSVG WOO!
O'SL OSL
Ort
Oe
l O'?1
+ +—
t GC L-
0 O
Otol
O
© 60
O 7S
0- oO
6 &
O
U
—8
0°O
Oo O
oO 7s
0
Oo
+0'l Oo
TS'L
STIWNAISSY Figure 5

52 SLOAPENS
T1V
(98S) ANIL
HSV
WO0Z
O1g
OOS
O62
OBC
OL2
O'9% OGS
OPS
OLS
OZ
Pp
r “+
4” |
O oO
@
O o'¢-
O'S
-O'l[—-
00
rO'L
r OS™?
FO’
-O"
STWNGIS3Y
Figure 6

53
(98SG°Z ) AWIL)
dnOYNSENS SLOarans
(988) SWLL
HSVG WOS
S/ ¢vL
24 tL
VL OL
69 B99
49 99
§'9
OU D
A
q r
Oo
q S'0-
. +> O-
Loge 7-9 Lo-
@
md, 0°0 £0
-Z0 -£°0 -7°0
S*O
TWNdISsa
Figure 7
54 (28S¢1
) AWIL)
dNONOENS
SLOAPANS
(29S) AWIL
HSVG WOOL
Ov Gel
Orel Gcl
{ i
T t
}-
WNISSY
Figure 8
55
OLE
(998992 ) AWIL)
dNOYOENS SLOAraNs
0°92
(29s) SWIL
HSVG WOOZ
j |
O'S? O'"C
O'S? 0°22
I +
t O°o-
0°0
O°?
WNGISSY
Figure 9

Chapter IV
Summary
Little work has been done studying the factors which
might affect short-term, intense, sprint-type activities.
This is unfortunate because short explosive bouts of activity
are very common in our daily activities. More study in this
area might take place if better laboratory measures of
physiologic variables that relate to sprinting such as maximal
power and fatigue were available. The present study compared
sprint times in the 50m, 100m, and 200m with a high intensity
cycle test. Twenty-five untrained college males performed a
cycle ergometer test and performed the sprint tests. The
cycling protocol consisted of a three minute warm-up followed
by a 15 second maximal effort. The ergometer was preloaded
with 0.12 kg/kg of hydrated bodyweight and was connected to
a micro-computer for data collection. Peak power (PP), time
to peak power (TTPP), average power (AP), power fatigue rate
(PFR), and power fatigue index (PFI) were determined by the
micro-computer. The sprint protocol consisted of at least a
five minute warm-up of stretching jogging and very short
sprints and sprint starts followed by 6 sprints, 2 at 50m, 2
at 100m, and 2 at 200m. A minimum of 15 minutes rest was
given between each sprint. Further details on the methodology
of the current study are presented in Appendix A.
56
57
Results
The subjects displayed a wide range of sprinting ability.
Ranging from 6.55-8.27 seconds in the 50m, 12.16-15.92 seconds
in the 100m and 22.7-30.75 seconds in the 200m. However, the
sprint times were highly reproducible. Correlations between
the first and second sprints were r=0.98 for the 50m, r=0.86
for the 100m, and r=0.88 for the 200m. When each subjects
best time for each event was compared to the parameters taken
from the ergometer test and relative parameters (PP/kg,
PFR/kg, AP/kg) low correlations were found (r= 0.07-0.55).
After plotting the relative parameters and those taken from
the ergometer versus sprint times natural breaks in the data
were observed. 50m sprint times below 7.5 seconds, 100m times
below 14 seconds, and 200m times below 26.7 seconds showed
higher correlations (r= 0.04-0.70).
Further analysis of the data revealed that high inter-
variable correlations existed between many of the relative and
ergometer variables. Judging from these correlations, the
variables were seperated into four groups. Group I contained
variables of absolute power (AP, PP), group II were variables
of relative power (PP/kg of bodyweight, AP/kg of bodyweight),
group III were variables of fatigue (PFR, PFI, PFR/kg of
bodyweight), finally group IV contained the only variable of
acceleration (TTPP).
Equations for predicting sprint performance were

58
developed using a combination of 1 to 4 variables with one
variable from each group used. The best equation was
considered to be the one that yeilded the highest r* value
while also yeilding the lowest Akaiki Information Criteria
(AIC) value and Mean Square Error (MSE). For each sprint
distance the best model contained two variables, one from the
relative power group and one from the fatigue group. This was
somewhat suprising because acceleration was initially thought
to be a large factor in the 50m sprint. AS expected fatigue
was a major factor in the 200m sprint.
Power Output
When the best variable from each of the 4 groups was
compared to sprint times, as expected negative correlations
were found with the variable from the absoulute power,
relative power, and fatigue groups, while a positive
correlation was found with the acceleration variable.
Although these correlations are quite low, the general trends
of the data were as expected. At each distance the variable
representing the relative power group had the highest
correlation with sprint time.
The data obtained from these correlations was then used
to develop equations for predicting sprint performance. These
equations are presented in table 5. When predicted sprint
times were compared with the actual sprint times, it was
noticed that these equations tended to predict even faster
59
times for the faster subjects and slower times for the slower
subjects. The subjects were then divided into subgroups, as
described earlier. Different prediction equations were derived
from these data subsets. These equations are presented in
table 5. For most of the subjects in these subgroups the
equations predicted slower sprint times than were actually the
case. However, as with the full subject group, the faster
subjects had faster predicted times and the slower subjects
had slower pedicted times.
Discussion
These results show that performance on this cycle
ergometer test can account for a significant amount of the
variability in performance for the 50m, 100m, and 200m dashes
of untrained subjects. These results also show that this
cycle ergometer is a better method of predicting performance
for a group of faster subjects than for a large heterogenious
group. The cycle ergometer also showed a better ability to
predict for the 200m sprint than for the 50m sprint. This is
somewhat suprising because the cycle ergometer test did not
last as long as the 200m sprint did.
Relative power and fatigue were the most indicative
parameters of sprint performance. This was expected for a
longer sprint such as the 200m, but was unexpected for a short
sprint like the 50m. Suprisingly of the four parameter groups
that were used acceleration, namely TTPP, was the poorest
60
indicator of performance. In the 50m sprint especially this
parameter was thought to play a large role in performance.
Initially TTPP was thought to play a large part in short
sprint performance because initially little fatigue takes
place in the first few seconds after a subject reaches PP.
Therefore, the logical asumption is that the faster a sprinter
reaches PP then he will run a greater portion of this short
sprint at or near PP. This should result ina faster sprint
performance. These results suggest that either TTPP as
determined by cycle ergometry is not a sensitive measure of
acceleration during a sprint and/or acceleration contributes
little to performance in this group of subjects.
As stated earlier the cycle ergometer test can account
for a significant portion of the variability associated with
sprint performance. However it cannot account for all of the
variability. One factor that contributes to this variability
is to what extent upper body arm movement contributes to
sprint performance. The upper body, namely the arms and
shoulders, contribute to sprint performance mainly as
compensatory movements. For example, if you viewed a sprinter
from above you would notice that as his left leg comes
forward, his right leg drops back. This results in a
clockwise rotation of the lower body, namely the legs and
hips. In order for this to happen, a clockwise angular
momentum must be generated. This is done partially through
6 1
contact with the ground but mainly through the use of the
abdominal muscles. Using the abdominal muscles to acheive
this clockwise angular momentum also results in an equal
counter-clockwise angular momentum in the upper body. Put
simply, as the legs and hips rotate clockwise the arms and
shoulders rotate counter-clockwise. As the left leg comes
forward the left arm goes back and vice versa (Tricker et al.,
1967). The question arises that if the legs are longer and
have more mass than the arms then how can the arms possibly
compensate for the angular momentum of the legs. Since the
feet come in contact with the ground and the arms do not,
complete compensation may not be necessary. However, the
moment of inertia of the arms can be increased by holding them
away from the body (Tricker et al., 1967).
Another factor may be that these were untrained subjects.
This conclusion is supported by the fact that there was a
stronger correlation between the power output values and the
sprint performance of the group of faster subjects. Also
these subjects were untrained in using starting blocks. It
has been suggeted that trained sprinters are better able to
convert the isometric forces exerted on the starting blocks
into propelling force for sprinting (Ikai, 1967). This could
explain why TTPP was a poor indicator of performance. Another
possibility is the difference in exercise duration between the
cycle ergometer and sprint efforts. It took longer to run the
62
200m than it did to complete the power test. However, longer
cycle ergometer tests have been associated with a decrease in
peak power output. This has been attributed mostly to
motivational factors (Burke et al., 1985). Finally there are
differences between cycling and running. As discussed earlier
cycling does not utilize the upper body. When the subject is
cycling his feet travel in a cicular path. Although the path
of a sprinters feet does not move in a perfectly circular
path, it does follow the motion of a point on the circumfrence
of a wheel suprisingly closely (Tricker et al., 1967). For
the most part the same major muscle groups are used for both
actions, but the magnitude and direction of force application
by these muscles may differ somewhat.
Applicability
These data suggest that the cycle ergometer test used in
this investigation can be used for evaluating the components
of sprint performance in untrained males. They suggest that
this test is best when it is compared to the 200m sprint. It
remains to be seen if this test is applicable to trained or
elite calibre athletes and females.
Suggestions For Further Research
Further research with this ergometer test should focus
on whether or not using trained sprinters yeilds different
results. Also this test should be done with elite sprinters.
The results of the present investigation suggest that if more

highly trained subjects are used then more sprinting
variablility can he accounted for. Females have not been
studied using this power test this is another obvious avenue
for further research. Future projects could use more motion
detectors and timers perhaps placing one every ten meters.
This would generate a speed curve similar to the one found by
Akai (1967). Specific comparisons could then be made between
the speed curve and the power curve. Another project could
involve a sprint training program. Measurements could be
taken before and after the training program. After completing
the program, the subjects should have faster sprint times and
this should be reflected by changes in the power values from
the ergometer. Another investigation might compare the cycle
ergometer test to sprint cycling.

References
Barnes, W. (1981). Selected physiological characteristics
of elite male sprint athletes. Journal of Sports Medicine,
21, 49-54.
Bar-Or, O. (1987). The Wingate Anaerobic Test an update on
methodology, reliability, and validity. Sports Medicine,
4, 381-394.
Bar-Or, O., Dotan, R., and Inbar, O. (1977). <A 30-second all-out ergometric test: its reliability and validity for
anaerobic capacity. Isreal Journal of Medical Sciences,
13(3), 126- 127.
Bar-Or, O., Inbar, O. (1978). Relationships among anaerobic
capacity, sprint and middle distance running of school
children. Shepard and LaVallee (Eds) Physical Fitness
Assesment, Charles C. Thomas, Springfield, 142-147.
Burke, E., Wojcieszak, I., Punchow, M., and Michael, E.
(1985). Analysis of high-intensity bicycle tests of
varying duration. Exercise Physiology: Current and
Selected Research, 159-170.
Caiozzo, V., and Kyle, C. (1980). The effect of external
loading upon power output in stair climbing. European
Journal of Applied Physiology, 44, 217-222.
Cheetham, M., Boobis, L., Brooks, S., and Williams, C.
(1986). Human muscle metabolism during sprint running.
Journal of Applied Physiology, 61(1), 54-60.
Conley, D., and Krahenbuhl, G. (1980). Running economy and
distance running performance of highly trained athletes.
Medicine and Science in Sports and Exercise, 12(5), 357-
358.
Crielaard, I., and Pirnay, F. (1981). Anaerobic and aerobic
power of top athletes. European Journal of Applied
Physiology, 47, 295-300.
Davy, K., Williams, J., Ward, C., Smith, S., and Franke, W.
(1990). Optimal loading conditions for a constant-load
cycle ergometer test. Medicine and Science in Sports and
Exercise, 22, abstract #386.
Dotan, P., and Sargeant, A. (1984). Maximal short-term
(anaerobic) power output following submaximal exercise.
64
65
International Journal of Sports Medicine, 5, 133-134.
Dotan, R., and Bar-Or, O. (1983). Load optimization for the Wingate Anaerobic Test. European Journal of Applied
Physiology, 51, 409-417.
Enoka, R. (1988). Neuromuscular Basis of Kinesiology, Human
Kinetics Books a Division of Human Kinetics Publishers
Inc., Champaign, IL., 200-206.
Evans, J., and Quinney, H. (1981). Determination of resistance settings for anaerobic power testing. Canadian
Journal of Applied Sports Science, 6(2), 53-56.
Harman, E., Knuttgen, H., and Frykman, P. (1987). Automated
data collection and processing for a cycle ergometer.
Journal of Applied Physiology, 62(2), 831-836.
Harrison, J. (1970). Maximizing human power output by suitable selection of motion cycle and load. Human
Factors, 12(3), 315-329.
Henrich, T., and Riley, J. (1988). Validation of a 15-
second bicycle ergometer power test. Abstracts of Research Papers 1988 AAHPERD Convention, 153.
Hermansen, L., and Osnes, J. (1972). Blood and muscle pH
after maximal exercise. Journal of Applied Physiology,
32(3), 304-308.
Hiroven, J., Rehunen, S., and Harkonen, M. (1987). Breakdown
of high-energy phosphate compounds and lactate accumulation during short supramaximal exercise. European Journal of
Applied Physiology, 56, 253-259.
Ikai, M. (1967). Biomechanics of Sprint Running with Respect
to the Speed Curve. Biomechanics JI, Ist International Seminar, 282-290,
Jacobs, I., Bar-Or, O., Dotan, R., Karlsson, J., and Tesch,
P. (1983). Changes in muscle ATP, CP, glycogen, and
lactate after performance of the Wingate Anaerobic Test.
Biochemestry of Exercise, 234-238.
Katch, V., and Weltman, A. (1979). Interrelationship between
anaerobic power output, anaerobic capacity and aerobic
power. Ergonomics, 22(3), 325-332.
LaFontaine, T., Londeree, B., and Spath, W. (1981). The
66
maximal steady state versus selected running events.
Medicine and Science in Sports and Exercise, 13(3), 190- 192.
Margaria, R., Aghemo, P., and Rovelli, E. (1966). Measurement of muscular power (anaerobic) in man. Journal of Applied
Physiology, 21(5), 1662-1664.
Margaria, R., Cerretelli, P., and Mangili, F. (1964).
Balance and kinetics of anaerobic energy release during
strenuous exercise inman. Journal of Applied Physiology,
19(4), 623-628.
McArdle, W., Katch, F., and Katch, U. (1986). Exercise
Physiology (2nd ed.}, Lea and Febiger, Philidelphia, 167-
168.
McCartney, N., Heigenhauser, G., and Jones, N. (1983). Power output and fatigue of human muscle in maximal cycling
exercise. Journal of Applied Physiology, 55(1), 218-224.
McCartney, N., Heigenhauser, G., and Jones, N. (1983).
Effects of pH on maximal power output and fatigue during
short-term dynamic exercise. Journal of Applied Pysiology,
o5(1), 225-229.
McCartney, N., Spriet, L., Heigenhauser, J., Kowalchuk, J.,
Sutton, R., and Jones, N. (1986). Muscle power and
metabolism in maximal intermittent exercise. Journal of
Applied Physiology, 60(4), 1164-1169.
Nadeau, M., Brassard, A., and Cuerrier, J. (1983). The bicycle ergometer for muscle power testing. Canadian
Journal of Applied Sport Science, 8(1), 41-46.
Noakes, T. (1988). Implications of exercise testing for prediction of athletic performance: a contemporary
perspective. Medicine and Science in Sports and Exercise,
20(4), 319-330.
Noakes, T., Myburgh, K., and Schall, R. (1990). Peak treadmill running velocity during the VO, max test predicts
running performance. Journal of Sports Sciences, 8, 35-
45.
Patton, J., and Duggan, A. (1987). An evaluation of tests
of anaerobic power. Aviation, Space, and Evironmental
Medicine, 58, 237-242.
67
Patton, J., Murphy, M., and Frederick, F. (1985). Maximal
power outputs during the Wingate Anaerobic Test.
International Journal of Sports Medicine, 6, 82-85.
Powers, S., Dodd, S., Deason, R., Byrd, R., and McKnight, T.
(1983). Ventilatory threshold, running economy, and
distance running performance of trained athletes. Research Quarterly for Exercise and Sport, 54(2), 179-182.
Reilly, T., and Bayley, K. (1988). The relation between
short-term power output and sprint performance of young
female swimmers. Journal of Human Movement Studies, 14,
19-29.
Roberts, D., and Smith, D. (1989). Biochemical aspects of
peripheral muscle fatigue; a review. Sports Medicine, 7,
125-138.
Sargeant, A., Hoinville, E., and Young, A. (1981). Maximum
leg force and power output during short-term dynamic
exercise. Journal of Applied Physiology, 51(5), 1175-
1182.
Sharp, R., Troup, J., and Costill, D. (1982). Relationship between power and sprint freestyle swimming. Medicine and Science in Sports and Exercise, 14(1), 53-56.
Tharp, G., Johnson, G., and Thorland, W. (1984). Measurement
of anaerobic power and capacity in elite young track
athletes using the Wingate Test. Journal of Sports
Medicine, 24, 100-105.
Tharp, G., Newhouse, R., Uffelman, L., Thorland, W., and
Johnson, G. (1985). Comparison of sprint and run times
with performance on the Wingate Anaerobic Test. Research
Quarterly for Exercise and Sport, 56(1), 73-76.
Too, D. (1990). Biomechanics of cycling and factors affecting performance. Sports Medicine, 10(5}, 286-302.
Tricker, R., and Tricker, B. (1967). The Science of
Movement, American Elsevier Publishing Company Inc., New
York, 212-218.
Vanderwalle, H., Peres, G., and Monod, H. (1987). Standard
anaerobic exercise tests. Sports Medicine, 4, 268-289.
Volkov, N., and Lapin, V. (1979). Analysis of the velocity
68
curve in sprint running. Medicine and Science in Sports
11(4), 332-337.
Williams, J., Barnes, W., and Signorile, J. (1988). A
constant-load ergometer for measuring peak power and
fatigue. Journal of Applied Physiology, 65(5), 2343-2348.
Williams, J., Barnes, W., and Signoile, J. (1990). Temporal
changes in power output during brief, high-intensity
dynamic exercise. Exercise Physiology: Current and
Selected Research, 123-132.
Williams, J., Signorile, J., Barnes, W., and Henrich, T.
(1988). Caffeine, maximal power output and fatigue.
British Journal of Sports Medicine, 22(4), 132-134.

Appendix A
METHODOLOGY
69

Methodology
Subjects
25 college age males (mean + SE age 20.56 + 1.41 years,
height 178.02 + 5.02 cm, and weight 77.8 + 8.85kg) were used
for this investigation. All of the subjects were physically
active but none were currently engaged in an organized
training program.
Each subject was required to read and sign an informed
consent form (appendix E). This form explained the risks and
benefits involved with high intensity cycle ergometer tests
and sprinting. The investigator then verbally reviewed the
form with the subject and answered any question the subject
had.
The subject was first oriented with the testing equipment
and testing procedures. He was then allowed to ride the
ergometer without a load on it. This allowed the subject to
get a feel for the apparatus. Upon completion of the
orientation, the subject scheduled his cycle test. Each
subject was instructed to abstain from exercise for at least
twelve hours prior to any of the tests. Finally the subjects
were told that they were not allowed to perform both the cycle
and the sprint tests on the same day.
Ergometer Testing
A modified 818 front loading Monark cycle ergometer was
70

71
used in conjunction with a microcomputer to collect and record
the power output data from each subject. Power output was
computed for each one-half pedal revolution. The ergometer’s
flywheel resistance strap was attached to an electronic load
cell (Genesco AVW-250), wrapped around the flywheel and over
a pulley so that calibrated weights could be attached. Two
small magnets were mounted on the pedal sprocket at 0 and 180
degrees, and a magnetic reed switch was mounted on the
ergometer frame near the top of the pedal sprocket. A 9-volt
power supply was connected to the reed switch so that when a
Magnet passed over the switch a square wave pulse was
generated. Thus two pulses were generated for each pedal
revolution. Signals from both the load cell and the reed
switch were amplified by an AMOD-x amplifier (3mv/3VDC),
sampled at 500Hz and digitized by a Metra Byte, 16-bit analog-
to-digital converter. These signals were then stored for
later analysis. Flyweel velocity was calculated for each one-
half revolution. This was done by dividing the distance
travelled by the flywheel (3m) by the time interval between
square wave pulses. The resistive load was calculated by
taking the difference between the load attached to the
resistance strap and the load registered by the load cell.
Power output was then calculated as the product of force and
velocity. Output from the computer consisted of a graph which
plotted power vs. time. The computer also calculated the

72
following indices; peak power (PP), time to peak power (TTPP),
average power (AP), power fatigue rate (PFR), and the power
fatigue index (PFI). In addition to these parameters peak
power, average power, and power fatigue rate were expressed
by bodyweight; peak power per kg of bodyweight (PP/kg),
average power per kg of bodyweight (AP/kg), and power fatigue
rate per kg of bodyweight (PFR/kg)}.
The protocol for the cycle ergometer consisted of a three
minute warm-up at 50 rpms . The resistance load for the
ergometer was then set at 0.12kg/kg of bodyweight (Davy et
al., 1990). The test began with the pedals in a static
horizontal position with the subject’s preferred foot forward.
Toe clips were also worn. At the sound of the tone from the
computer the subject began pedalling. The subject gave an all
out maximal cycling effort for 15 seconds. The preceding
cycle ergometer design, cycling protocol and data collection
programs were modeled after those used by Williams et al.,
(1988). Previous work using this ergometer system has shown
very high test-retest correlations coefficients {r=0.90-
0.95). For this reason only one cycle ergometer bout was
required for each subject (Williams et al., 1988).
Sprint Testing
Sprint performance was based on the finish time for each
sprint. Each sprint was performed individually and took place
73
on an outdoor track using starting blocks and an auditory
starting signal. Since the sprints took place on an outdoor
track care was given to avoid adverse conditions. To this end
no sprints were run on days when there was a lot of wind and
all sprints were run on a dry track.
The subjects were allowed to warm up until they felt
comfortable. This warm up consisted of light jogging,
stretching, and practicing sprint starts. All of the sprint
tests were done in the following order. Two trials at 50m
followed by two trials at 100m and finally two trials at 200m.
Each subject was given a minimum of 15 minutes of rest between
each trial. This helped to ensure that a maximal effort was
Biven on each trial. High test-retest correlations where
found between sprint trials at each distance (50m r=0.98, 100m
r=0.86, 200m r=0.88). Thus, although the subjectsS were not
specifically sprint trained their sprint times were still
highly reliable. The best time at each distance was used for
comparison with the cycle ergometer data.
When the subject was ready the starter depressed a
switch. This simultaneously started the electronic timer and
sounded an auditory tone. At the sound of the tone the
subject began sprinting. At the finish line was placed an
infra-red motion detector. Directly opposite the infra-red
unit on the other side of the sprinting lane was a reflector.
The beam, emitted by the infra-red unit, bounced off of the
74
reflector and was picked up again by the same unit that
emitted it. The infra-red unit was connected to the
electronic timer. Once the timer was started it ran freely
as long as the infra-red beam was intact. Once the beam was
broken the timer stopped. The time was then recorded by the
investigator.
Statistics
Multiple linear regression was used to determine which
variables and which combination of variables had the highest
correlations with the sprint times. The Akaiki Information
Criteria (AIC) was also used to determine the best combination
of variables for predicting sprint performance. The group of
variables with the highest r* value and the lowest AIC and MSE
values was considered to be the best. All of the statistical
procedures were performed by the Statistical Analysis System
(SAS). Significance was established at p< 0.05 for the MAXR
procedure that was used.
Appendix B
REGRESSION RESULTS
FOR ALL SUBJECTS
AND SUBJECT SUBGROUPS

76
Table 6
Regression Results of the Power Parameters and the 50m Dash
All Subjects (r* > 0.145 is significant)
Parameters Used r? MSE SSE AIC
PP/kg .14 ~15 3.40 -~48.06
PP/kg,PFR/kg ~15 ~15 3.32 -46.12
PFI,PP/kg,PFR/kg .16 -16 3.32 -44.50
TTPP,PF1I,PP/kg,PFR/kg ~22 »15 3.10 -44,43
TTPP,PFI,PP/kg,PFR/kg,AP/kg 29 16 2.79 -41.81
PP,PFR,AP,PP/kg,PFR/kg,AP/kg .29 .16 2.79 -42.81
PP,PFR,PFI,AP,PP/kg,PFR/kg,AP/kg .29 16 2.79 -40.87
PP,TTPP,PFR,PFI,AP,
PP/kg,PFR/kg,AP/kg ~32 17 z.68 -39.87
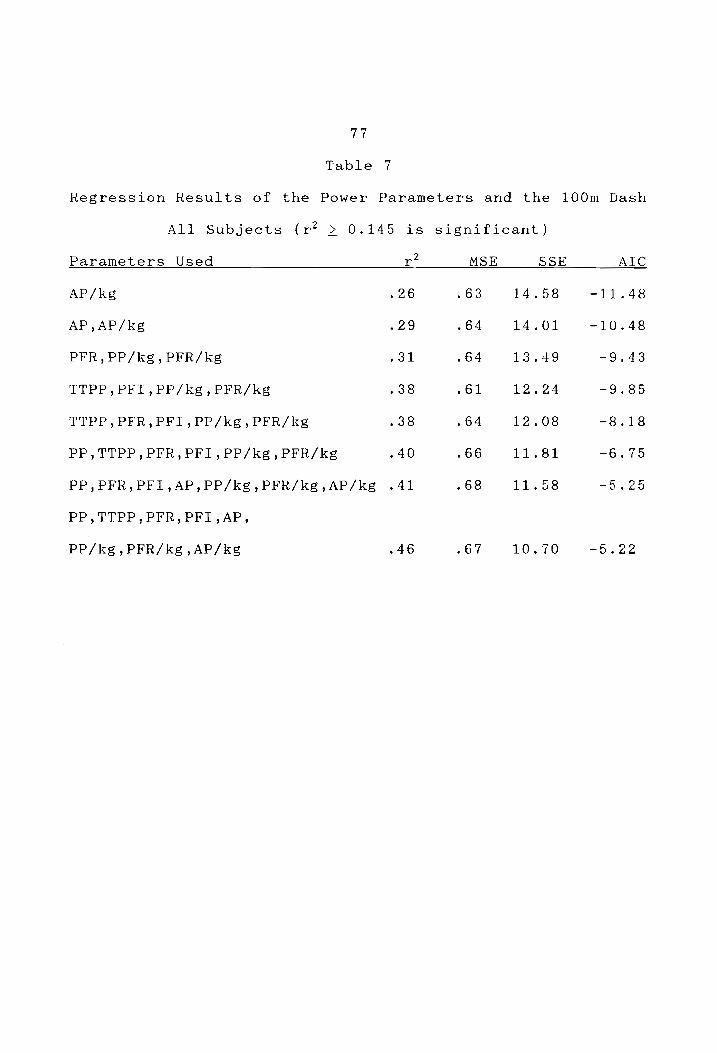
77
Table 7
Regression Results of the Power Parameters and the 100m Dash
All Subjects (r* > 0.145 is significant)
Parameters Used r? MSE SSE AIC
AP/kKg .26 .63 14.58 -11.48
AP,AP/kKg .29 .64 14.01 -10.48
PFR,PP/kg,PFR/kg 31 .64 13.49 -9,43
TTPP,PFI,PP/kg,PFR/kg 38 ~61 12.24 -9.85
TTPP,PFR,PFI,PP/kg,PFR/kg 38 64 12.08 ~8.18
PP,TTPP,PFR,PFI,PP/kg,PFR/kg -40 .66 11.81 -6.75
PP,PFR,PFI,AP,PP/kg,PFR/kg,AP/kg .41 .68 11.58 -5.25
PP,TTPP,PFR,PFI1,AP,
PP/kg,PFR/kg,AP/kg -46 67 10.70 -5.22
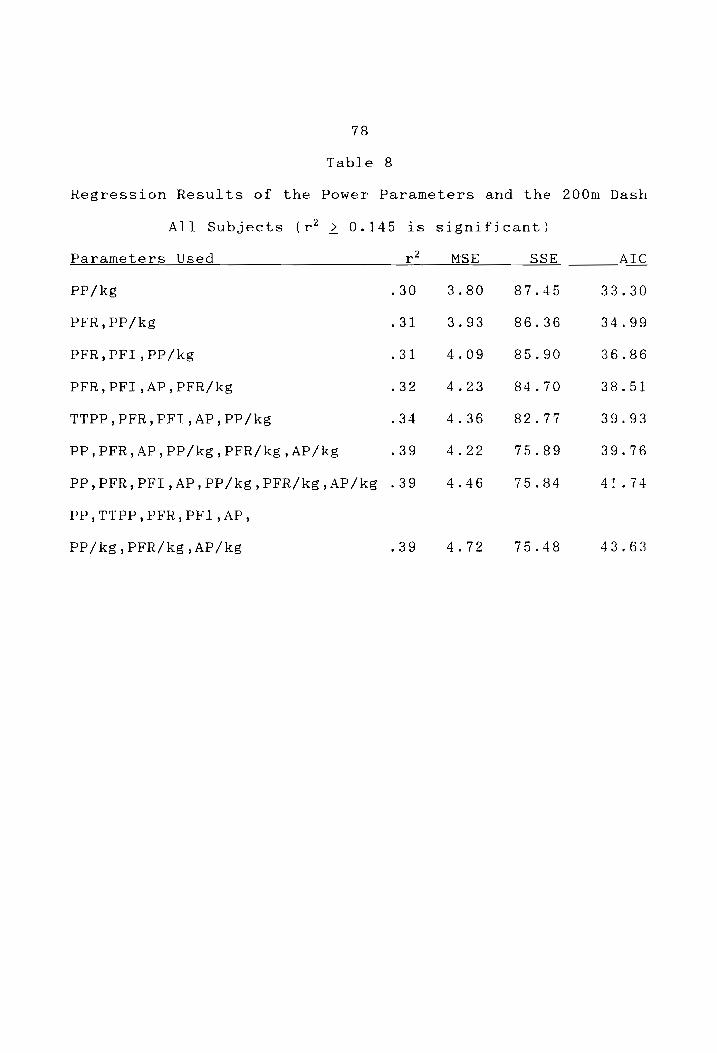
78
Table 8
Regression Results of the Power Parameters and the 200m Dash
All Subjects (r* > 0.145 is significant)
2
Parameters Used r MSE OSE AIC
PP/kg 30 3.80 87.45 33.30
PFR,PP/kKg 31 3.93 86.36 34.99
PFR,PFI,PP/kg 31 4.09 85.90 36.86
PFR,PFI,AP,PFR/kg 32 4.23 84.70 38.51
TTPP,PFR,PFI,AP,PP/kg 34 4.36 82.77 39.93
PP,PFR,AP,PP/kg,PFR/kg,AP/kg 39 4.22 75.89 39.76
PP,PFR,PFI,AP,PP/kg,PFR/kg,AP/kg .39 4.46 75.84 41.74
PP,TTPP,PFR,PFI,AP,
PP/kg,PFR/kg,AP/kg 39 4.72 75.48 43.63
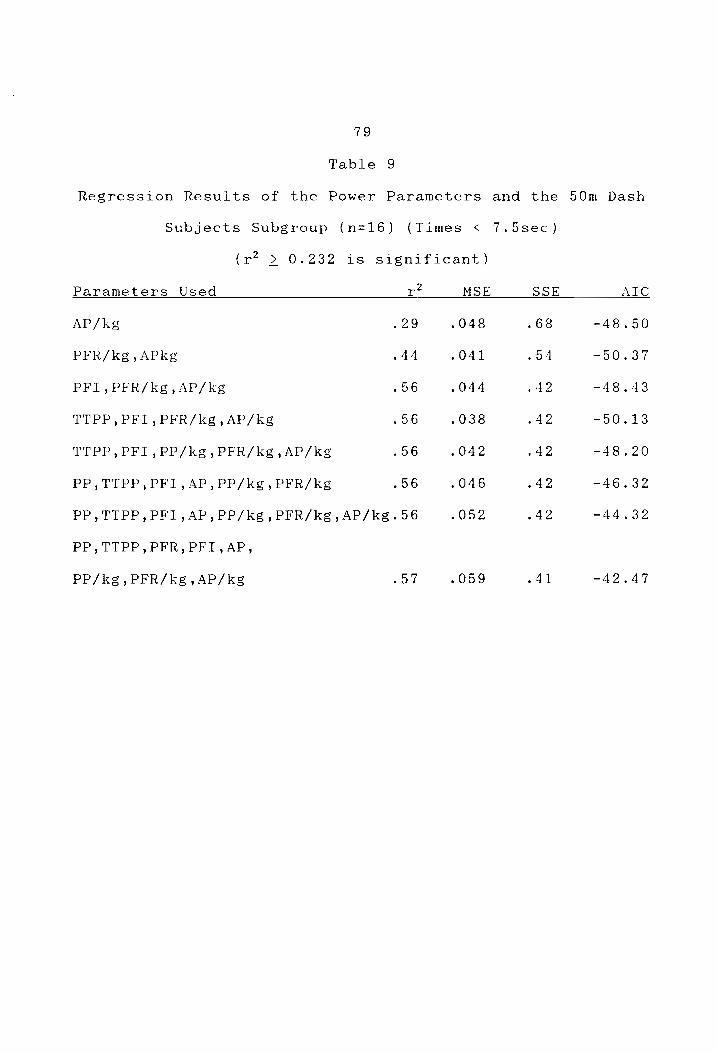
79
Table 9
Regression Results of the Power Parameters and the 50m Dash
Subjects Subgroup (n=16) (Times < 7.5sec)
(r* > 0.232 is significant)
2
Parameters Used r MSE SSE AIC
AP/kg 29 .048 .68 -48.50
PFR/kg,APkg ~44 ~O41 54 -50.37
PFI,PFR/kg,AP/kg -56 .044 ~42 -48.43
TTPP,PFI,PFR/kg,AP/kg ~56 .038 42 -50.13
TTPP,PFI,PP/kg,PFR/kg,AP/kg 56 ~042 -42 -~48.20
PP,TTPP,PFI,AP,PP/kg,PFR/kg 56 .046 ~42 -46.32
PP,TTPP,PFI,AP,PP/kg,PFR/kg,AP/kg.56 .052 »42 -44,32
PP,TTPP,PFR,PFI,AP,
PP/kg,PFR/kg,AP/kg .o7 059 41 -42.47
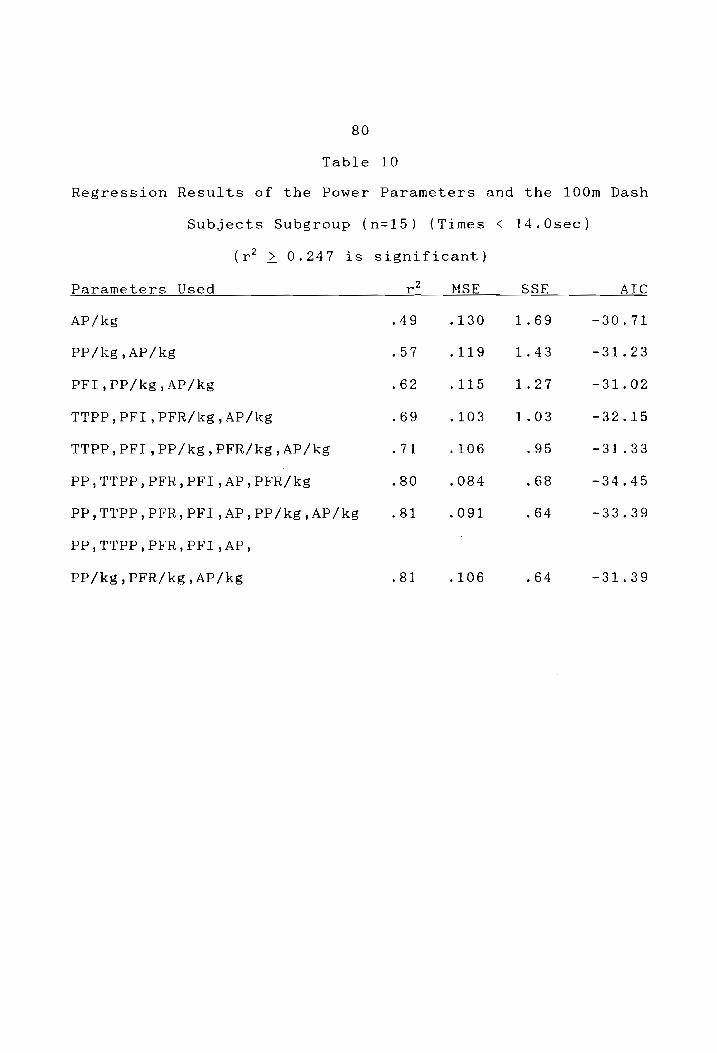
80
Table 10
Regression Results of the Power Parameters and the 100m Dash
Subjects Subgroup (n=15) (Times < 14.0sec)
(r* > 0.247 is significant)
Parameters Used r? MSE SSE AIC
AP/ke 49.130 1.69 = -30.71
PP/kg ,AP/kg 157.119 «1.43 31.23
PFI, PP/kg,AP/kg 62 .115 1.27 -31.02
TTPP, PFI, PFR/kg, AP/kg 69 .103 1.03 32.15
TTPP, PFI, PP/kg, PFR/kg , AP/kg .71 106 195 -31.33
PP, TTPP, PFR, PFI, AP, PFR/kg .80 .084 68 -34.45
PP,TTPP,PFR,PFI,AP,PP/kg,AP/kg .81 .091 64 -33.39
PP,TTPP,PFR,PFI,AP,
PP/kg,PFR/kg,AP/kg 81 . 106 -64 -31.39

81
Table 11
Regression Reéesylts of the Power Parameters and the 200m Dash
Subjects Subgroup (n=15) (Times < 26.6sec)
(r* > 0.247 is significant)
Parameters Used r? MSE SSE AIC
AP/kg 39 1.20 15.63 2.62
PFR,PP/kg ~63 _78 9.41 -2.99
PFR,PFI,PP/kg ~63 ~85 9,35 -1.09
PP,PFR,PP/kg,PFR/kg 64 91 9.06 -43
PP,TTPP,PFI,PP/kg,PFR/kg .69 87 7.83 25
PP,TTPP,PFR,PFI,PP/kg,PFR/kg ~72 88 7.02 61
PP,PFR,PFI,AP,PP/kg,PFR/kg,AP/kg .80 ~71 4.98 -2.54
PP,TTPP,PFR,PFI,AP,
PP/kg,PFR/kg ,AP/kg 84 69 4,16 -3.24

Appendix C
RAW DATA
82

83
Raw Data
Sprint times
SUBJECT SOMT1 SOMT2 1OOMT1 1O00MT2 200MT1 ZOOMT2
1 8.04 8.17 15.63 15.96 30.75 30.83
2 7.24 7.32 13.49 15.05 23.43 27.10
3 7.42 7.64 14.33 14.44 26.33 27.22
4 8.27 8.46 15.92 16.32 30.27 32.26
5 7.26 7.44 13.61 13.61 26.21 26.66
6 7.14 7.19 13.27 13.34 26.58 27.03
7 7.42 7.45 14.15 14.17 26.42 26.66
8 7.38 7.41 13.72 14.24 24.61 295.10
9 7.88 7.90 14.88 15.23 29.65 32.41
10 7.31 7.43 13.80 13.89 24.85 25.08
11 6.55 6.76 12.16 12.26 22.70 26.15
12 7.73 7.81 12.67 12.67 22.99 -----
13 7.16 7.20 13.34 13.56 26.09 27.80
14 7.43 7.43 15.20 15.99 25.56 25.75
15 7.10 7.11 13.34 15.57 26.53 28.08
16 8.20 8.26 15.38 15.70 30.46 32.36
17 7.30 7.33 13.75 13.81 26.25 -----
18 6.70 6.89 13.40 13.51 24.57 25.11
19 7.69 7.84 14.55 14.88 29.49 32.24

20
21
22
23
24
29
~73
30
253
43
.69
18
~)
~]
38
56
47
~87
29
14
13.
14.
13.
13.
13.
84
~92
90
58
95
90
65
15
14.
14.
14
14,
13.
~02
72
84
.O7
20
73
27
27.
29.
27.
26.
-44
69
36
10
68
19
27.
28.
29.
27.
27. 84
~32

85
Raw Data
Cycle Ergometer
SUBJECT PP TTPP PFR PFI AP PP/KG PFR/KG AP/KG
1 1076.41 4.82 27.12 25.66 941.84 12.04 . 30 10.53
2 973.16 4.40 25.43 27.71 822.16 13.59 36 11.48
3 1186.83 4.62 48.64 42.54 969.39 14.53 .60 11.87
4 620.25 4.95 12.97 21.02 554.40 9.02 19 8.06
5 835.29 5.76 23.69 26.22 720.17 13.01 37 11.22
6 1005.14 2.88 22.01 26.55 888.06 11.94 26 10.55
7 945.65 4.36 20.98 23.60 833.54 11.59 26 10.21
8 1069.94 4.65 30.55 29.54 922.49 13.05 ~37 11.25
9 920.47 5.61 19.03 19.41 826.42 12.18 25 10.93
10 982.63 3.66 26.97 31.12 839.67 12.28 34 10.50
11 1198.00 5.27 21.51 17.48 1082.36 14.49 26 13.09
12 1077.43 4.84 27.30 25.76 946.03 15.41 ~39 13.53
13 1063.57 3.69 29.85 42.38 863.88 13.58 38 11.03
14 994.98 5.23 31.10 30.54 860.44 13.70 43 11.85
15 1140.21 4.83 36.89 32.91 972.82 13.49 44 11.51
16 955.78 5.26 26.82 27.33 829.90 13.37 38 11.61
17 1086.94 6.06 30.45 25.03 953.82 12.96 36 11.37
18 898.93 5.08 23.55 25.99 781.99 13.26 ~35 11.53
19 1017.53 4.72 27.63 27.91 874.45 11.88 ~32 10.17
20 905.24 4.89 26.88 30.03 773.43 13.93 41 11.90

21
22
23
24
209
830.
887.
883.
1370.
1254
32
20
96
47
oO 04
90
87
90
~92
17.
19
29.
36.
34.
91
43
19
91
91
21.
22.
26
29.
33.
86
46
11
87
6
734.
749,
1154
1045
67
50
. 86
.08
12.
12.
10.
13.
14.
59
77
42
59
-27
~28
34
37
41
11.
11.
11.
12.
13
24
84
15

Appendix D
DATA COLLECTION
AND ANALYSIS
COMPUTER PROGRAMS
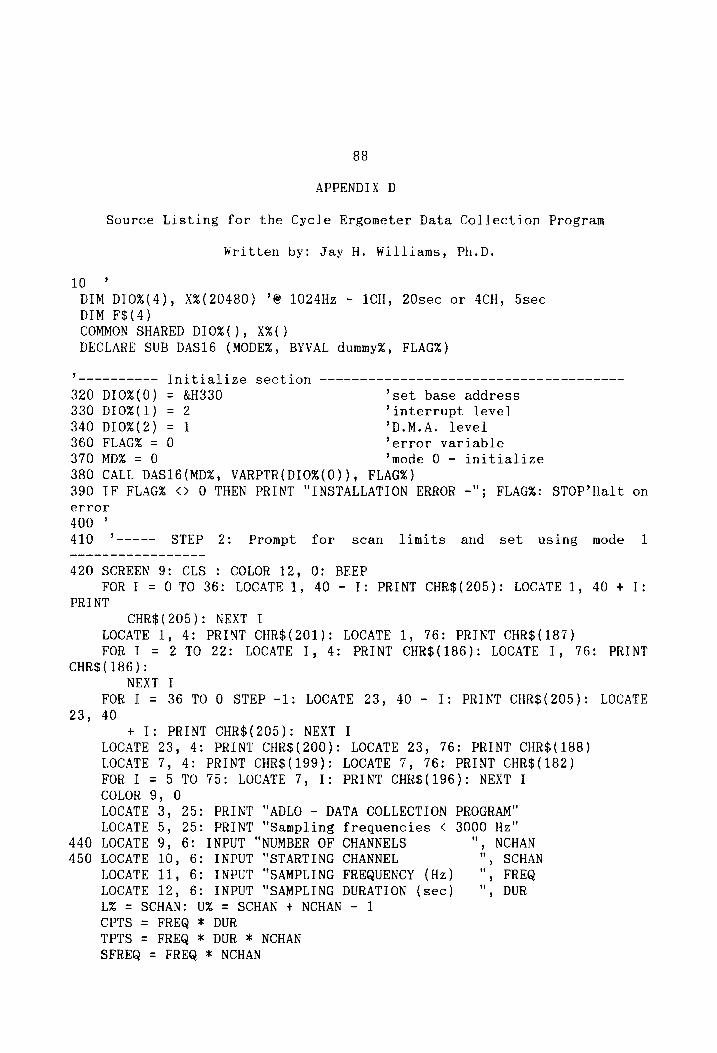
88
APPENDIX D
Source Listing for the Cycle Ergometer Data Collection Program
Written by: Jay H. Williams, Ph.D.
10’
DIM D10%(4), X%(20480) °@ 1024Hz - 1CH, 20sec or 4CH, 5sec
DIM F$(4)
COMMON SHARED DIO%(), X%()
DECLARE SUB DAS16 (MODE%, BYVAL dummy%, FLAG%)
mortar astra Initialize section --------------------- 5-5-9 neon 320 DIO%(0) = &H330 ’set base address 330 DIO%(1) = 2 -interrupt level
340 DIO%(2) = 1 "D.M.A. level 360 FLAG% = 0 error variable 370 MD% = 0 "mode 0 - initialize 380 CALL DAS16(MD%, VARPTR(DIO%(0)), FLAG%)
390 IF FLAG% <> O THEN PRINT "INSTALLATION ERROR -"; FLAG%: STOP’Halt on
error 400 ° 410 °----- STEP 2: Prompt for scan limits and set using mode 1
420 SCREEN 9: CLS : COLOR 12, 0: BEEP
FOR I = 0 TO 36: LOCATE 1, 40 - I: PRINT CHR$(205): LOCATE 1, 40 + I:
CHR$(205): NEXT I
LOCATE 1, 4: PRINT CHR$(201): LOCATE 1, 76: PRINT CHR$(187)
FOR I = 2 TO 22: LOCATE I, 4: PRINT CHR$(186): LOCATE 1, 76: PRINT
CHR$(186): NEXT I
FOR I = 36 TO 0 STEP -1: LOCATE 23, 40 - I: PRINT CHR$(205): LOCATE
23, 40
+ I: PRINT CHR$(205): NEXT I
LOCATE 23, 4: PRINT CHR$(200): LOCATE 23, 76: PRINT CHR$(188)
LOCATE 7, 4: PRINT CHR$(199): LOCATE 7, 76: PRINT CHR$(182)
FOR I = 5 TO 75: LOCATE 7, I: PRINT CHR$(196): NEXT I
COLOR 9, O
LOCATE 3, 25: PRINT "ADLO - DATA COLLECTION PROGRAM"
LOCATE 5, 25: PRINT "Sampling frequencies < 3000 Hz" 440 LOCATE 9, 6: INPUT "NUMBER OF CHANNELS ", NCHAN 450 LOCATE 10, 6: INPUT "STARTING CHANNEL ", SCHAN
LOCATE 11, 6: INPUT "SAMPLING FREQUENCY (Hz) ", FREQ LOCATE 12, 6: INPUT "SAMPLING DURATION (sec) ", DUR L% = SCHAN: U% = SCHAN + NCHAN - 1 CPTS = FREQ * DUR TPTS = FREQ * DUR * NCHAN SFREQ = FREQ * NCHAN
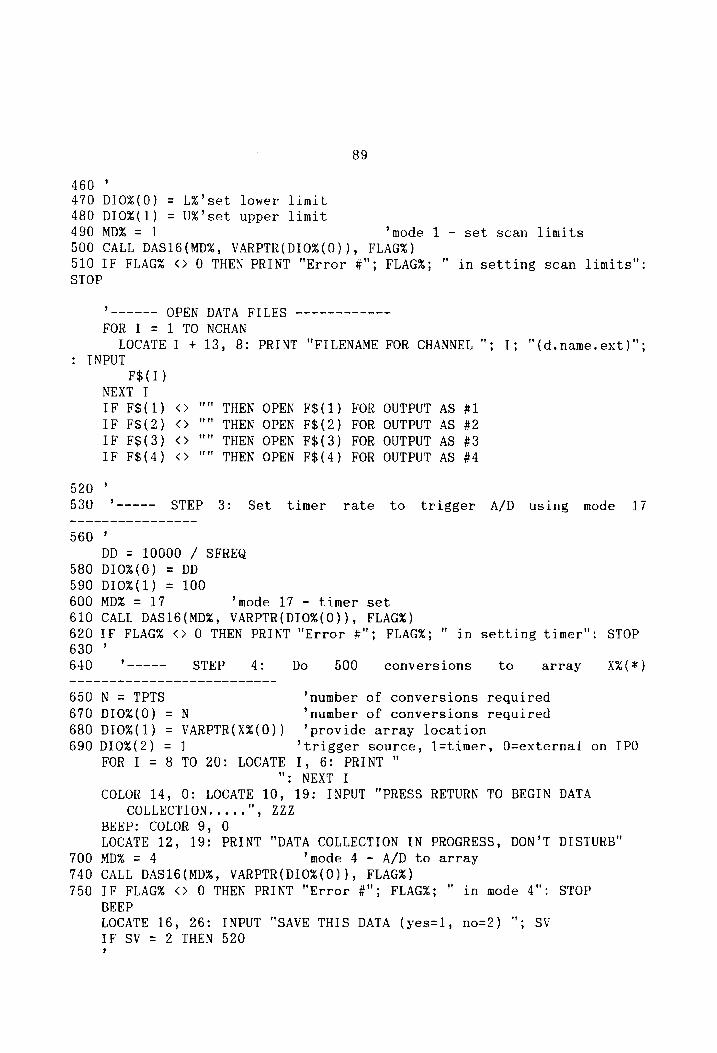
89
460 ° 470 DIO%(0) L%’set lower limit 480 DIO%(1) U%’ set upper limit 490 MD% = 1 *mode 1 - set scan limits 500 CALL DAS16(MD%, VARPTR(DIO%(0)), FLAG%)
510 IF FLAG% <> O THEN PRINT "Error #"; FLAG%; " in setting scan limits”: STOP
Hou
9 am OPEN DATA FILES ------------ FOR I = 1 TO NCHAN
LOCATE I + 13, 8: PRINT "FILENAME FOR CHANNEL "; I; "(d.name.ext)"; INPUT
F$(T) NEXT I IF F$(1) <> "" THEN OPEN F$(1) FOR OUTPUT AS #1 IF F$(2) <> "" THEN OPEN F$(2) FOR OUTPUT AS #2 IF F$(3) <> "" THEN OPEN F$(3) FOR OUTPUT AS #3 IF F$(4) <> "" THEN OPEN F$(4) FOR OUTPUT AS #4
530 %----- STEP 3: Set timer rate to trigger A/D using mode 17
DD = 10000 / SFREQ
580 DIOZ%(0) = DD
590 D10O%(1) = 100
600 MD% = 17 *mode 17 - timer set
610 CALL DAS16(MD%, VARPTR(DIO%(0)), FLAG%)
620 IF FLAG% <> 0 THEN PRINT "Error #"; FLAG%; " in setting timer": STOP 3 630
640 %~---—- STEP 4: Do 500 conversions to array X%(¥)
650 N = TPTS *number of conversions required
670 DIOZ(0) = N *number of conversions required
680 DIO%(1) = VARPTR(X%(0)) ‘provide array location 690 DIOx(2) = 1 *trigger source, l=timer, O=external on IPO
FOR I = 8 TO 20: LOCATE I, 6: PRINT " "; NEXT I
COLOR 14, 0: LOCATE 10, 19: INPUT "PRESS RETURN TO BEGIN DATA COLLECTION.....°, Z2ZZ
BEEP: COLOR 9, 0 LOCATE 12, 19: PRINT "DATA COLLECTION IN PROGRESS, DON’T DISTURB"
700 MD% = 4 *mode 4 - A/D to array 740 CALL DAS16(MD%, VARPTR(DIO%(0)), FLAG%)
750 IF FLAG% <> O THEN PRINT "Error #"; FLAG%; " in mode 4": STOP
BEEP
LOCATE 16, 26: INPUT "SAVE THIS DATA (yes=1, no=2) "; SV
IF SV = 2 THEN 520 3

90
760 ’----- STEP 5: STORE DATA TO DISK ----------------------------------- 770 BEEP
LOCATE 18, 22: PRINT "STORING DATA TO DISK, DON’T DISTURB” FOR I = 0 TO N - NCHAN STEP NCHAN
FOR J = 1 TO NCHAN IF J = 1 THEN PRINT #1, X%(I + J - 1) IF J = 2 THEN PRINT #2, X4(1 + J - 1) IF J = 3 THEN PRINT #3, X%(1 + J - 1) IF J = 4 THEN PRINT #4, XX¥(I + J - 1)
NEXT J NEXT I CLOSE : BEEP
800 LOCATE 20, 22: INPUT "MORE DATA COLLECTION (yes=1, no=2) "3; MR CLEAR IF MR = 1 THEN 10 IF MR = 2 THEN END
820 PRINT : PRINT : END

91
APPENDIX D
Source Listing for the Cycle Ergometer Data Analysis Program
Written by: Jay H. Williams, Ph.D.
10 BEEP: CLS : COLOR 14, 0
FOR I = 0 TO 39: LOCATE 1, 40 - I: PRINT CHR$(205): LOCATE 1, 40 + I:
CHR$(205): NEXT I
LOCATE 1, 1: PRINT CHR$(201): LOCATE 1, 80: PRINT CHR$(187)
FOR I = 2 TO 21: LOCATE I, 1: PRINT CHR$(186): LOCATE I, 80: PRINT
CHR$({186):
NEXT I
FOR I = 39 TO 0 STEP -1: LOCATE 22, 40 - I: PRINT CHR$(205): LOCATE 22,
40 + I:
PRINT CHR$(205): NEXT I
LOCATE 22, 1: PRINT CHR$(200): LOCATE 22, 80: PRINT CHR$(188)
FOR I = 0 TO 39: LOCATE 4, 40 - I: PRINT CHR$(196): LOCATE 4, 40 + I:
CHR$(196): NEXT I
LOCATE 4, 1: PRINT CHR$(199): LOCATE 4, 80: PRINT CHR$(182)
LOCATE 1, 25
COLOR 12, 0
PRINT “ CYCLE ERGOMETER POWER OUTPUT "
LOCATE 3, 20
PRINT "Power Output and Fatigue Analysis Program" COLOR 11, 0
LOCATE 6, 5: INPUT "Subject Name ", S$ LOCATE 7, 5: INPUT "Date of Testing ", D$ LOCATE 8, 5: INPUT "Experimental Conditions ", C$ LOCATE 10, 5: INPUT "Total Data Collection Time (sec) " DURATION LOCATE 11, 5: INPUT "Sampling frequency (Hz) ", SFREQ LOCATE 12, 5: INPUT "Number of Trials "| NTRIALS
LOCATE 13, 5: INPUT "Weight Applied to Flywheel (kg) " WEIGHT
LOCATE 14, 5: INPUT "Load Cell Calibration Slope (kg/v) ", LCSLOPE LOCATE 15, 5: INPUT "Load Cell Calibration Intercept (kg) ", LCINT LOCATE 17, 5: INPUT "Pulse DataFile Name (d:name.ext) ", P$ LOCATE 18, 5: INPUT "Force DataFile Name (d:name.ext) ", F$ FOR I = 6 TO 18: FOR J = 5 TO 70: LOCATE I,J: PRINT "": NEXT J: NEXT I
DIM PP(NTRIALS), TTPP(NTRIALS), PFR(NTRIALS), PFI(NTRIALS), TW(NTRIALS), AP(NTRIALS)
PLSPT = 1: FRCPT = 1 TPS = DURATION * SFREQ DIM PULSES(TPS), FORCES(TPS) DIM PDUR(150), RPM(150), PNUM(150), AFRC(150), POWER(150), PTIME(150)
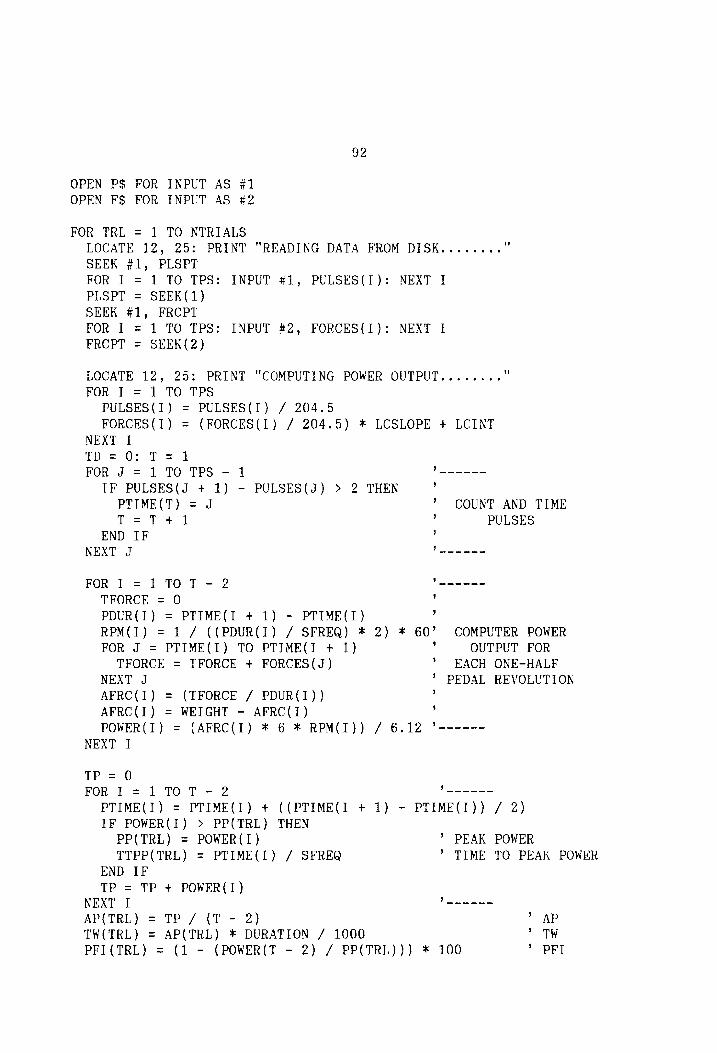
92
OPEN P$ FOR INPUT AS #1
OPEN F$ FOR INPUT AS #2
FOR TRL = 1 TO NTRIALS LOCATE 12, 25: PRINT "READING DATA FROM DISK........ " SEEK #1, PLSPT FOR I = 1 TO TPS: INPUT #1, PULSES(1I): NEXT I PLSPT = SEEK(1) SEEK #1, FRCPT FOR I 1 TO TPS: INPUT #2, FORCES(I): NEXT I FRCPT SEEK(2)
LOCATE 12, 25: PRINT "COMPUTING POWER OUTPUT........ "
FOR I = 1 TO TPS
PULSES(I) = PULSES(I) / 204.5 FORCES(1) = (FORCES(1) / 204.5) * LCSLOPE + LCINT
NEXT I TD = 0: T= 1
FOR J = 1 TO TPS - 1
IF PULSES(J + 1) - PULSES(J) > 2 THEN
?
PTIME(T) = J * COUNT AND TIME T=T +1 , PULSES
END IF , NEXT J too
FOR I = 1 TOT - 2 TFORCE = 0 PDUR(I) = PTIME(I + 1) - PTIME(I) RPM(I) = 1 / ((PDUR(I) / SFREQ) * 2) * 60 FOR J = PTIME(I) TO PTIME(I + 1)
TFORCE = TFORCE + FORCES(J)
COMPUTER POWER OUTPUT FOR
EACH ONE-HALF
7 Od
~
ry
~e
~~
“e
~“ _
“a
NEXT J PEDAL REVOLUTION AFRC(I) = (TFORCE / PDUR(I)) AFRC(I) = WEIGHT - AFRC(I) POWER(I) = (AFRC(I) * 6 * RPM(I)) / 6.12 ’------
NEXT I
TP = 0 FOR I = 1 TOT - 2 Pa
PTIME(I) = PTIME(I) + ((PTIME(I + 1) - PTIME(I)) / 2) IF POWER(I) > PP(TRL) THEN
PP(TRL} = POWER(I) > PEAK POWER TTPP(TRL) = PTIME(I) / SFREQ > TIME TO PEAK POWER
END IF TP = TP + POWER(I)
NEXT I 7 mn AP(TRL) = TP / (T - 2) > AP TW(TRL) = AP(TRL) * DURATION / 1000 > TW PFI(TRL) = (1 - (POWER(T - 2) / PP(TRL)))} * 100 > PFI
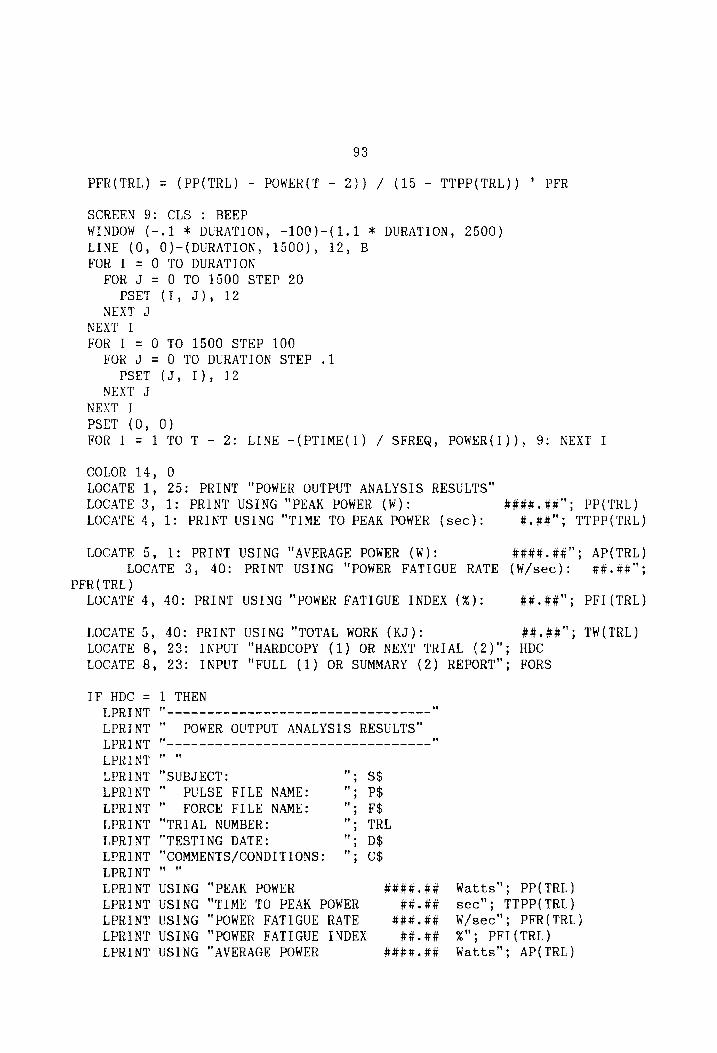
93
PFR(TRL) = (PP(TRL) - POWER(T - 2)) / (15 - TTPP(TRL)) ’° PFR
SCREEN 9: CLS : BEEP WINDOW (-.1 * DURATION, -100)-(1.1 * DURATION, 2500) LINE (0, 0)-(DURATION, 1500), 12, B FOR I = 0 TO DURATION
FOR J = 0 TO 1500 STEP 20 PSET (I, J), 12
NEXT J NEXT I FOR I = 0 TO 1500 STEP 100
FOR J = 0 TO DURATION STEP .1 PSET (J, I), 12
NEXT J NEXT I PSET (0, 0) FOR I = 1 TOT - 2: LINE -(PTIME(I) / SFREQ, POWER(I)), 9: NEXT I
COLOR 14, 0 LOCATE 1, 25: PRINT "POWER OUTPUT ANALYSIS RESULTS" LOCATE 3, 1: PRINT USING "PEAK POWER (W): H###. 4H"; PP( TRL) LOCATE 4, 1: PRINT USING "TIME TO PEAK POWER (sec): #.#4"5 TTPP(TRL)
LOCATE 5, 1: PRINT USING "AVERAGE POWER (¥W): Heese. ##"s AP(TRL) LOCATE 3, 40: PRINT USING "POWER FATIGUE RATE (W/sec): ##.##";
PFR(TRL) LOCATE 4, 40: PRINT USING "POWER FATIGUE INDEX (%): ##,##"; PFI(TRL)
LOCATE 5, 40: PRINT USING "TOTAL WORK (KJ): ##.##"; TW(TRL) LOCATE 8, 23: INPUT "HARDCOPY (1) OR NEXT TRIAL (2)"; HDC LOCATE 8, 23: INPUT "FULL (1) OR SUMMARY (2) REPORT"; FORS
IF HDC = 1 THEN
LPRINT "~-----~--~-----~----~---+---+------- " LPRINT " POWER OUTPUT ANALYSIS RESULTS" LPRINT "--------------------------------- " LPRINT " " LPRINT "SUBJECT: ". Sg LPRINT " PULSE FILE NAME: "s pg LPRINT " FORCE FILE NAME: ". FS LPRINT "TRIAL NUMBER: "; TRL LPRINT "TESTING DATE: "; D$ LPRINT "COMMENTS/CONDITIONS: "3; C$ LPRINT " " LPRINT USING "PEAK POWER ####.4# Watts"; PP(TRL) LPRINT USING "TIME TO PEAK POWER ##.## sec"; TTPP(TRL) LPRINT USING “POWER FATIGUE RATE ###.## W/sec"; PFR(TRL) LPRINT USING "POWER FATIGUE INDEX ##.## %"; PFI(TRL) LPRINT USING "AVERAGE POWER ####.¢# Watts"; AP(TRL)
94
LPRINT USING "TOTAL WORK ##.## = KJoules"; TW(TRL)
LPRINT
LPRINT
IF FORS = 1 THEN
LPRINT "TIME", "POWER", "VELOC."
LPRINT "(sec)", "(Watts)", "(rpm)" LPRINT via", Wee " , to "
FOR I = 1TOT - 2
LPRINT PTIME(I) / SFREQ, POWER(I), RPM(I)
NEXT I
END IF
END IF NEXT TRL CLOSE #1: CLOSE #2 END

Appendix E
INFORMED CONSENT
95

96
Human Performance Laboratory
Division of Health, Physical Education and Recreation
Virginia Polytechnic Institute and State University
Informed Consent
I, », do hereby voluntarily agree and consent
to participate in atesting program conducted by the personnel
of the Human Performance Laboratory of the Division of Health,
Physical Education and Recreation of Virginia Polytechnic
Institute and State University.
Title of the Study:
Relationships Between Sprint Performance, Power Output and Fatigue
Purposes of this experiment include:
The purpose of this research is to use information obtained
from a cycle ergometer power output test, namely peak power
output, power acceleration, and the rate and magnitude of
fatigue, to develop a means to evaluate and model sprint
performance. Specifically, these experiments are designed
to:
1) Determine the individual relationships between sprint
performance and each parameter of the power test.
2) Determine the best subset of variables to predict
performance in each of the selected sprint events.
I voluntarily agree to participate in this testing program.
It is my understanding that my participation will include:
performance of one test of power output consisting of a 15
sec bout of maximal intensity cycle ergometry exercise and
performance of track sprints consisting of all out sprints
of
55, 100 and 200m.
I understand that participation in this experiment may produce
certain discomforts and risks. These discomforts and risks
include:
1. Muscle soreness and fatigue due to power and sprint
testing.
2. Risk of injury including, but not limited to,
tendonitis, bursitis, strains, sprains, and even

97
the possibility of death. All attending staff will be
trained in CPR techniques.
Certain personal benefits may be expected from participation
in this experiment. These include:
1. Knowledge of ones ability to generate power and to
resist short-term fatigue and ones ability to perform
sprints.
2. Knowledge of the relationships between sprint
performance and power output.
Appropriate alternative procedures that might be advantageous
to you include:
1. Physical examination by a physician prior to exercise
participation.

Appendix F
DATA SHEET
98
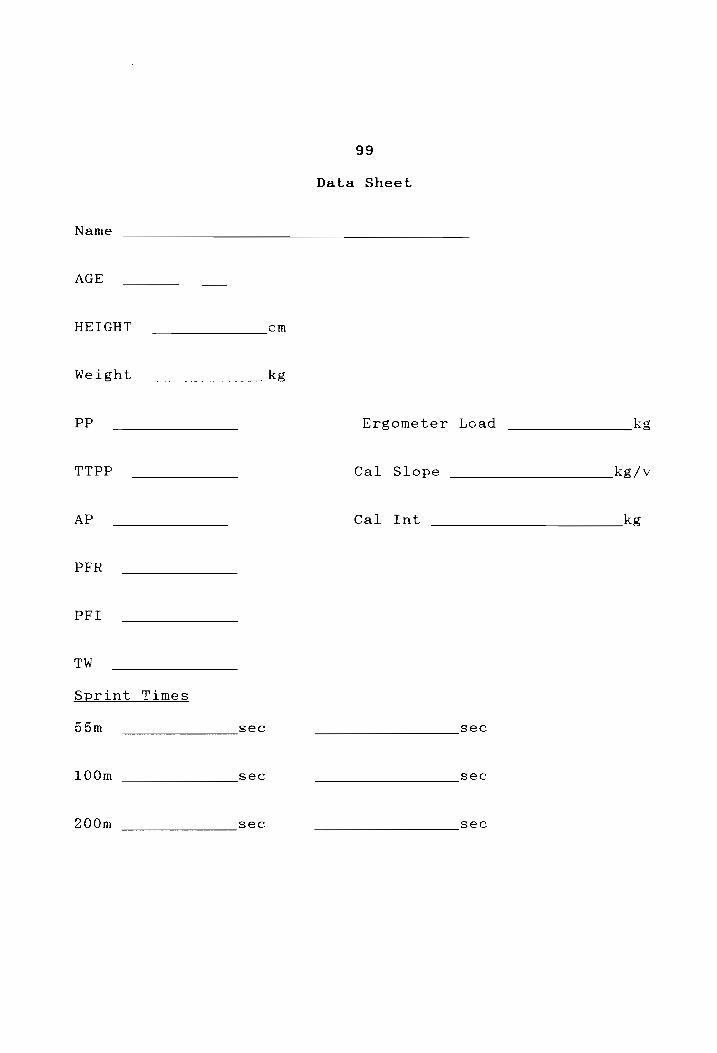
Name
99
Data Sheet
AGE
HEIGHT
Weight
PP
TTPP
AP
PFR
PFI
TW
Sprint Times
55m
100m
200m
cm
kg
Ergometer Load
Cal Slope
kg
Cal Int
kg/v
ke
sec sec
sec sec
sec sec

Appendix G
ERGOMETER DIAGRAM (Williams et al., 1988)
100

101
S 1 SNOWW
HOIOLIMS
139
dso)
Figure 10
VITA
James Shorten was born March 14, 1967 in Manassas
Virginia to Mrs. Marcia A. Shorten and Mr. James E. Shorten.
He has one older sister, Mary Ann Shorten, currently residing
in Virginia Beach. He has two younger brothers, Mike Shorten
who is beginning his final year at Radford University, and
Bill Shorten who will be a senior at Stonewall Jackson Senior
High School in Manassas VA. this fall. Jim grew up in
Manassas Va and graduated from Stonewall Jackson Senior High
School in 1985. Jim then attended Virginia Tech and graduated
with a B.S. in exercise science in August, 1989. In August
of that same year he started the masters of science in
exercise physiology program at Virginia Tech.
Jim was a Graduate Assistant Athletic Trainer for the
Virginia Tech Athletic Department this past vear where he was
involved in all aspects of athletic training. After
completing his masters degree Jim hopes to get his athletic
trainers certification and work in the area of sports
medicine. Jim hopes to continue his education and eventually
enter medical school. In his spare time Jim enjoys weight
training, running, fishing, and mountain biking.
102