sharon planning board 1 sharon economics discussion presentation to sharon board of selectmen e....
TRANSCRIPT
1Sharon Planning Board
Sharon Economics Discussion
Presentation to Sharon Board of Selectmen
E. Hauser, Vice-ChairSharon Planning Board
1 April 2006

2Sharon Planning Board
Agenda
• Review Sharon Tax Revenue– Average Tax v. State Averages– Sharon Business Valuation Discussion
• Review Sharon 10 Year OpEx Budget History– Budget Composition and Growth Rates– Massachusetts State School Budget Growth Rates Comparison
• Next Step Recommendations– Summary of Findings– Best-in-Class Comparisons– Revenue Enhancement Programs

3Sharon Planning Board
Sharon Tax Factoids
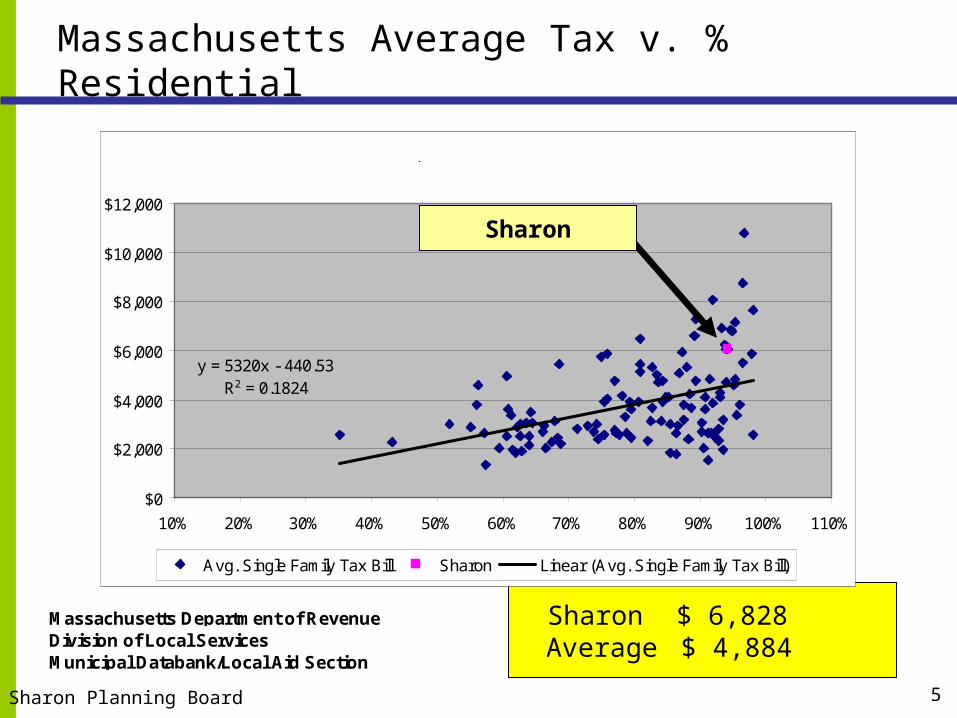
• Average tax per household = $6,828– Places us nicely into top 10% of MA Average Tax– Residential sources accounts for 94% of Sharon tax revenue– 10 year tax growth rate = 6.83% v. 5.81% average for MA
• Current commercial properties generate $1.72M in taxes– 87 parcels, 150 acres, are developed– 15 parcels, 38 acres available to be developed– 36 parcels, 138 acres, appear on paper to be undevelopable
Propose a “6% solution” in new tax revenue
Goal: $3 - $5M in new tax sources

4Sharon Planning Board
History of Passed by Commercial Developments
• S. Main Street Annual – $1,500,000 – $2,000,000– Spring 2004 138 acres
• Cobbs Corner Annual – $130,000 - $170,000– Spring 2004 6.1 acres
• Cannon Forge/Sharon Woods Annual – $3,000,000– Spring 1988 250 – 280 acres
• Sacred Heart Dormitory building One-time – $1,000,000
• Saw Mill land on Canton St. incl. Temple Sinai & Box Co. $100,000– 1966 6 acres
Annual $4.7M – 5.3M
5Sharon Planning Board
Massachusetts Average Tax v. % Residential
y = 5320x - 440.53R2 = 0.1824
$0
$2,000
$4,000
$6,000
$8,000
$10,000
$12,000
10% 20% 30% 40% 50% 60% 70% 80% 90% 100% 110%
Avg. Single Family Tax Bill Sharon Linear (Avg. Single Family Tax Bill)
Tow ns > $1B in valuation2003 massachusetts tax valuations and reports
Massachusetts Department of RevenueDivision of Local ServicesMunicipal Databank/Local Aid Section
$ 6,828 $ 4,884
SharonAverage
Sharon

6Sharon Planning Board
-5%
0%
5%
10%
15%
20%
1993 1995 1997 1999 2001 2003 2005
Sharon 10 Years of Y/Y Tax Growth Rate v. State
Sharon
25th percentile
Median
Average
75th percentile
90th percentile
6.83% CAG 5.68% CAG
SharonAverage
Massachusetts Department of RevenueDivision of Local Services
Municipal Databank/Local Aid Section
> 90% Residential Tax, > $1B in assets

7Sharon Planning Board
Sharon Commercial Inventory
• Current commercial properties generate $1.72M in taxes– 87 parcels, 150 acres, are developed– 15 parcels, 38 acres available to be developed– 36 parcels, 138 acres, appear on paper to be undevelopable
• Buildings < 10 years old generate 2x Building-Tax / Acre– Buildings < 10 years generate $12.5k / acre in Building-Tax revenue– Buildings > 10 years generate $6.5k / acre in Building-Tax revenue
• New developments can be estimated at $12.5k Tax / Acre– e.g. 20 acres might yield ~$250k in building tax revenue

8Sharon Planning Board
Parcels by Age
0
10
20
30
40
Not built or no agegiven
< 5 Years < 10 Years < 20 Years < 50 Years < 100 Years < 250 Years
0%
25%
50%
75%
100%
Majority of Commercial Facilities > 20 years
Developable Age No. Parcels Total Acres Total Tax Total Land Tax Total Building Tax
Yes Not built or no age given 10 13.3 78,154$ 43,580$ 34,574$
< 5 Years 1 10.0 157,303$ 27,019$ 130,285$
< 10 Years 5 4.9 86,139$ 24,126$ 62,013$
< 20 Years 4 16.6 179,048$ 60,125$ 118,924$
< 50 Years 35 88.6 853,432$ 315,443$ 537,989$
< 100 Years 12 10.5 127,184$ 57,184$ 70,000$
< 250 Years 20 7.5 105,125$ 56,616$ 48,509$
Y Total 87 151.5 1,586,386$ 584,093$ 1,002,292$
No Not built or no age given 36 138.5 101,460$ 101,460$ -$
N Total 36 138.5 101,460$ 101,460$ -$
Maybe Not built or no age given 5 24.4 34,720$ 34,720$ -$
M Total 5 24.4 34,720$ 34,720$ -$
Grand Total 128 314.4 1,722,566$ 720,273$ 1,002,292$

9Sharon Planning Board
Newer Facilities Generate $6k more / Acre
Developable Age No. Parcels Total Acres Total Tax Total Building Tax Building Tax per Acre
Yes Not built or no age given 10 13.3 78,154$ 34,574$ 2,597$
< 5 Years 1 10.0 157,303$ 130,285$ 12,983$
< 10 Years 5 4.9 86,139$ 62,013$ 12,563$
< 20 Years 4 16.6 179,048$ 118,924$ 7,161$
< 50 Years 35 88.6 853,432$ 537,989$ 6,069$
< 100 Years 12 10.5 127,184$ 70,000$ 6,638$
< 250 Years 20 7.5 105,125$ 48,509$ 6,497$
Y Total 87 151.5 1,586,386$ 1,002,292$ 6,614$
No Not built or no age given 36 138.5 101,460$ -$
N Total 36 138.5 101,460$ -$
Maybe Not built or no age given 5 24.4 34,720$ -$
M Total 5 24.4 34,720$ -$
Grand Total 128 314.4 1,722,566$ 1,002,292$ 3,188$
Building Tax per Acre by Age
$-
$2,000
$4,000
$6,000$8,000
$10,000
$12,000
$14,000
Not built or no agegiven
< 5 Years < 10 Years < 20 Years < 50 Years < 100 Years < 250 Years

10Sharon Planning Board
Implication for Aging Buildings
• Create economic redevelopment package– > 10 Years age
• Target participation range between 25% and 45%– Expected valuation - $200k - $300k in new tax revenue
Participation percentage
15% 25% 35% 45% 100%
< 5 Years -$ -$ -$ -$
< 10 Years -$ -$ -$ -$
< 20 Years 13,982$ 23,304$ 32,625$ 41,946$ 93,214$
< 50 Years 89,138$ 148,564$ 207,989$ 267,415$ 594,256$
< 100 Years 9,706$ 16,177$ 22,647$ 29,118$ 64,706$
< 250 Years 7,028$ 11,714$ 16,400$ 21,085$ 46,856$
Total 119,855$ 199,758$ 279,661$ 359,564$ 799,032$
Goal 3,500,000$ 3,500,000$ 3,500,000$ 3,500,000$ 3,500,000$
% of Goal 3% 6% 8% 10% 23%

11Sharon Planning Board
• Redevelopment of Existing Facilities– $200k - $300k in new tax revenue expected value
• Development of Zoned Parcels– $450k in new tax revenue – 15 parcels, 38 acres x $12.5k building-tax/acre incremental– 100% participation
• Potential Rezoning of S. Main Street Parcels– $250k to $500k based on 20 to 40 acres
Development Tax Revenue Opportunity
$900k to $1,250k

12Sharon Planning Board
Agenda
• Review Sharon Tax Revenue– Average Tax v. State Averages– Sharon Business Valuation Discussion
• Review Sharon 10 Year OpEx Budget History– Budget Composition and Growth Rates– Massachusetts State School Budget Growth Rates Comparison
• Next Step Recommendations– Summary of Findings– Best-in-Class Comparisons– Revenue Enhancement Programs

13Sharon Planning Board
Sharon Operating Budget by Year (1994-2005)
$0
$5,000,000
$10,000,000
$15,000,000
$20,000,000
$25,000,000
$30,000,000
$35,000,000
1994 1995 1996 1997 1998 1999 2000 2001 2002 2003 2004 2005
Fin Com Budget
School Department Budget
Selectmen's Budget
T.Above Above T.Type Operating T.Group (All)
Sum of Budget
Year
T.Group.2
Sharon OpEx Budget 1994 - 2005

14Sharon Planning Board
Sharon Operating Budget by Year (1994-2005)
$0
$5,000,000
$10,000,000
$15,000,000
$20,000,000
$25,000,000
$30,000,000
$35,000,000
1994 1995 1996 1997 1998 1999 2000 2001 2002 2003 2004 2005
Fin Com Budget
School Department Budget
Selectmen's Budget
T.Above Above T.Type Operating T.Group (All)
Sum of Budget
Year
T.Group.2
Sharon OpEx Budget 1994 - 2005
School2005
$29.3M
Selectmen2005
$8.3M
School1995
$14.5M
Selectmen1995
$5.0M
Budget
1995 2000 2005
School Budget 14,466,856$ 71% 22,114,993$ 73% 29,325,682$ 75%
Selectmen Budget 5,047,789$ 25% 6,989,371$ 23% 8,261,120$ 21%
Fin Com Budget 871,360$ 4% 1,183,532$ 4% 1,440,540$ 4%
OpEx Total 20,386,005$ 30,287,896$ 39,027,342$

15Sharon Planning Board
Annualized Growth Rates
Sharon Operating Budget by Year (1994-2005)
$0
$5,000,000
$10,000,000
$15,000,000
$20,000,000
$25,000,000
$30,000,000
$35,000,000
1994 1995 1996 1997 1998 1999 2000 2001 2002 2003 2004 2005
Fin Com Budget
School Department Budget
Selectmen's Budget
T.Above Above T.Type Operating T.Group (All)
Sum of Budget
Year
T.Group.2
School10 year
7.3%
Selectmen10 year
5.0%
Budget Average Growth
1995 2000 2005 10 Year 5 Year
School Budget 14,466,856$ 71% 22,114,993$ 73% 29,325,682$ 75% 7.3% 5.8%
Selectmen Budget 5,047,789$ 25% 6,989,371$ 23% 8,261,120$ 21% 5.0% 3.4%
Fin Com Budget 871,360$ 4% 1,183,532$ 4% 1,440,540$ 4% 5.2% 4.0%
OpEx Total 20,386,005$ 30,287,896$ 39,027,342$ 6.7% 5.2%

16Sharon Planning Board
Budget Composition Shift 1995 - 2005
1995
Selectmen Budget
25%School Budget
71%
Voc Ed0%
Fin Com Budget
4%
2005
Selectmen Budget
21%School Budget
75%
Voc Ed0%
Fin Com Budget
4%
School accounts for 75% of 2005 OpEx BudgetSchool accounts for 80% of $18.6M increase since 1995
Budget Change
1995 2000 2005 10 Year % of Change
School Budget 14,466,856$ 71% 22,114,993$ 73% 29,325,682$ 75% $14,858,826 80%
Selectmen Budget 5,047,789$ 25% 6,989,371$ 23% 8,261,120$ 21% $3,213,331 17%
Fin Com Budget 871,360$ 4% 1,183,532$ 4% 1,440,540$ 4% $569,180 3%
OpEx Total 20,386,005$ 30,287,896$ 39,027,342$ $18,641,337 100%

17Sharon Planning Board
Year / Year Operating Budget Growth Percentage
-5.0%
0.0%
5.0%
10.0%
15.0%
1994 1995 1996 1997 1998 1999 2000 2001 2002 2003 2004 2005
School Department Budget
Enrollment
Enrollment Change v. School Increase
Initial correlation apparent; Less correlation in last 4 years

18Sharon Planning Board
No Relationship between Budget and CPI
School BudgetSchool Department Budget v. CPI
0%
5%
10%
15%
0.0% 1.0% 2.0% 3.0% 4.0%
Selectmen's Budget v. CPI
0%
5%
10%
15%
0.0% 1.0% 2.0% 3.0% 4.0%
Fin Com Budget v. CPI
0%
5%
10%
15%
0.0% 1.0% 2.0% 3.0% 4.0%
Spend per Enrollment v. CPI
0%
5%
10%
15%
0.0% 1.0% 2.0% 3.0% 4.0%

19Sharon Planning Board
Average 10 Year Growth Rates, 1995 to 2005
• Total OpEx Growth– From $20.5M to $39.2M ~6.7% Growth / Year
• School Budget at $29M ~7.3%
• Selectmen Budget at $8.2M ~5.0%
• FinCom Budget at $1.4M ~5.2%
– School Budget accounts for 80% of Budget increase
• Enrollment– From 2,704 to 3,481 ~2.6% / Year
• Consumer Price Index– No correlation visible between CPI and Sharon Budgets

20Sharon Planning Board
Agenda
• Review Sharon Tax Revenue– Average Tax v. State Averages– Sharon Business Valuation Discussion
• Review Sharon 10 Year OpEx Budget History– Budget Composition and Growth Rates– Massachusetts State School Budget Growth Rates Comparison
• Next Step Recommendations– Summary of Findings– Best-in-Class Comparisons– Revenue Enhancement Programs

21Sharon Planning Board
Spend per Pupil
$0
$5,000
$10,000
$15,000
$20,000
$25,000
CA
NT
ON
DE
DH
AM
DO
VE
R
DU
XB
UR
Y
EA
ST
ON
HIN
GH
AM
HO
LLIS
TO
N
MA
NS
FIE
LD
ME
DF
IELD
NO
RF
OLK
NO
RW
OO
D
SH
AR
ON
SH
ER
BO
RN
ST
OU
GH
TO
N
SU
DB
UR
Y
WA
LPO
LE
WE
ST
ON
WE
ST
WO
OD
1994
1995
1996
1997
1998
1999
2000
2001
2002
2003
2004
Requested? Requested
Average of Cost per Enroll
Municipality
FY
Sharon
Massachusetts Department of RevenueDivision of Local ServicesMunicipal Databank/Local Aid Section
State Per Student Expenditure
22Sharon Planning Board
$0
$1,000
$2,000
$3,000
$4,000
$5,000
$6,000
$7,000
$8,000
$9,000
$10,000
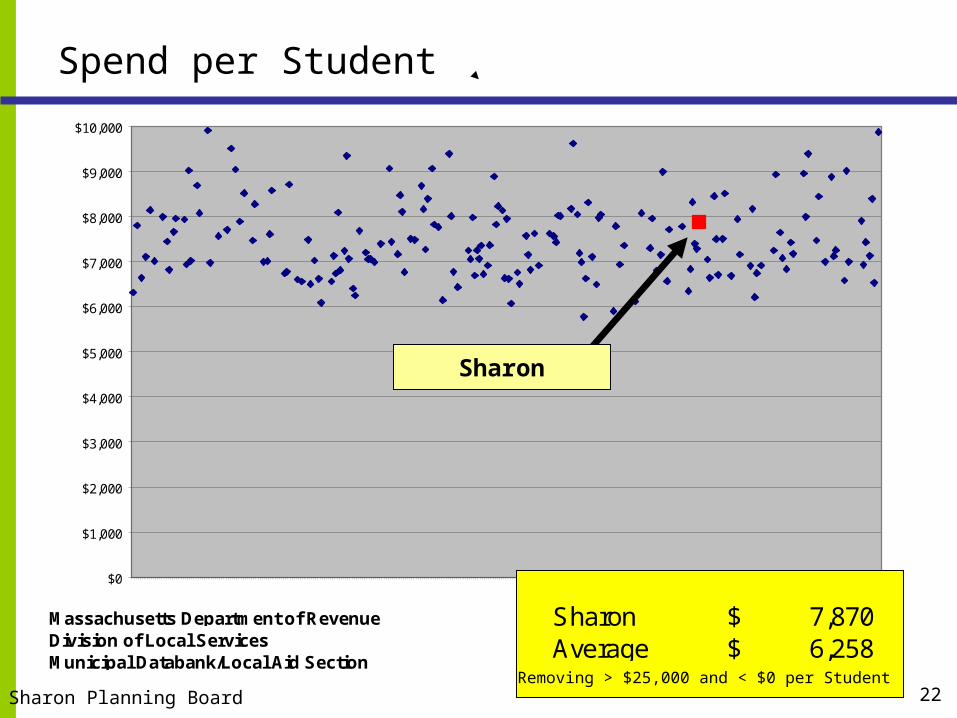
Spend per Student
Massachusetts Department of RevenueDivision of Local ServicesMunicipal Databank/Local Aid Section
Sharon
Removing > $25,000 and < $0 per Student
Sharon 7,870$ Average 6,258$

23Sharon Planning Board
0.0%
1.0%
2.0%
3.0%
4.0%
5.0%
6.0%
7.0%
8.0%
9.0%
10.0%
10 Year Growth Rate in Spend per Student
Sharon
Removing > 10% and < 0% Growth
Massachusetts Department of RevenueDivision of Local ServicesMunicipal Databank/Local Aid Section
Sharon 5.2%Average 4.7%

24Sharon Planning Board
Compared to State Performance
• Per Student spend at $7,870 – Above State Average– Within range of State Spend
• Growth in per Student spend at 5.2%– Above State Average– Within range of State Spend Growth
• School Budget seems to track to State averages
State Budget data does not match Sharon Budgets, leading to some general discrepancies.

25Sharon Planning Board
Agenda
• Review Sharon Tax Revenue– Average Tax v. State Averages– Sharon Business Valuation Discussion
• Review Sharon 10 Year OpEx Budget History– Budget Composition and Growth Rates– State School Budget Growth Rates
• Next Step Recommendations– Summary of Findings– Best-in-Class Comparisons– Revenue Enhancement Programs

26Sharon Planning Board
• Sharon per Household Tax is among top of State– $6,828 per Household– 94% of Tax Revenue is from Residential Household– CAG growth = 6.83%; 1% higher than peer average rate of 5.68%
• Business Tax Revenue– Increased valuation for newer buildings– $12,500 per acre is benchmark for newer buildings– 38 business acres remain to be developed
• School budget– ~7.3% average over last 10 years; $2.2+M per year– Accounts for 75% of OpEx– Growth seems consistent with State averages
Summary of Findings

27Sharon Planning Board
• Reduce growth of School OpEx $600 – $800k– Target near term 5.5%
– Conduct Best-in-Class studies w/ comparable academic quality
– At 7.2%, we will be at $40M within 5 years, $10M over today
• On-deck developments $750 – $950k
• Increase business tax revenue $950 – $1,500k– Development Funds ($250 - $500k)
• Update buildings > 20 years old w/ low interest redevelopment funds
– New Business ($700 - $1,000k)• Attract development to empty parcels; create new smaller zones
– New Sources ($ yyy)• Wind Turbine; Town WiFi; GreenFuel; Cell Tower
Multi-Tiered Approach: $2.2 to $3.0M
$2.2 to $3.0M

28Sharon Planning Board
Economic Development and Commercialization Committee
Dev Loans New Business New Revenue
Alan Lurie
Seth Ruskin
Rob Maidman
Ben Pinkowitz
David Spiegel
Keevan Gellor
Jeff Seul
Mike Bossin
Eli Hauser Chair
Bill Heitin Chair
Tam Ly

29Sharon Planning Board
Pipeline Valuations
• Avalon– 156 2 br apartments $80k per @$15.11 $ 190,000
• Simpson– 198 2 br apartments $80k per @$15.11 $ 240,000
• Brickstone– 100 2 br assisted living $100k per @15.11 $ 150,000
• Lexus– 12.5 Acres $12.5k / Acre $100k to $150k
• Redevelopment– Fund renovate existing facilities (25%-45% participation)$ 200k to $ 300k
• New Business– Attract development to 38 acres of empty parcels (10 yrs) $ 450k– Assess 20-40 acres rezoning on S. Main $ 250k to $ 500k
• New Sources– Wind Turbine; Town WiFi; GreenFuel; Cell Tower $ yyy

30Sharon Planning Board
Sharon Land Use
• Residential Zoned– Developed 6,200 Acres36%– Undeveloped 2,550 Acres8,75020% 55%
• Business Zoned– Developed 2251.3%– Undeveloped 111336 0.7% 2%
• Conservation– Audubon Land 1,966 Acres12%– Conservation Land 1,805 Acres 11%– State Land 1,173 Acres7%– Open Water 626 Acres4%– Trustees of Reservations 345 Acres5,914 2% 37%
• Town– Town Properties 848 Acres848 5% 5%
• 15,848