sharing sasse results in your institution jillian kinzie nsse institute indiana university center...
TRANSCRIPT

Sharing SASSE Results in Your Institution
Jillian KinzieNSSE Institute
Indiana University Center for Postsecondary Research
Thinking about Sharing Results
Considerations for sharing results should be influenced by…– the purposes for doing SASSE – the audience– compelling interest of the group– format for sharing (written
report, oral presentation etc.)

Session Outline
Topics to consider for sharing results…Survey BasicsAdministrationSharing ResultsSummaryCautions & Virtues
Begin with SASSE Basics
Begin with Basics
National Survey of Student Engagement(pronounced “nessie”)
College student survey that assesses the extent to which students engage in educational practices associated with high levels of learning and development
Basics: Introduce Purpose
“Learning that lasts” requires effective educational processes and outcomes – what evidence do we have about institutional performance?
Institutions must take a deep, comprehensive look at themselves and assessment and improvement activities like SASSE can help!
Basics: Compelling Argument
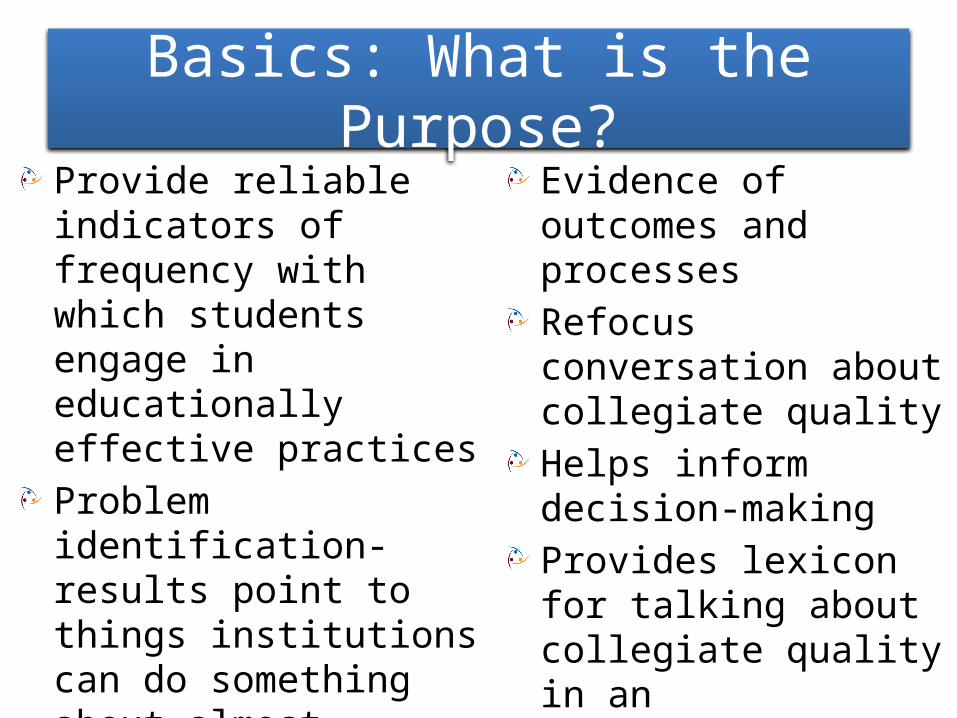
Basics: What is the Purpose?Provide reliable indicators of frequency with which students engage in educationally effective practicesProblem identification-results point to things institutions can do something about—almost immediatelyContext setting—paint a picture of the institution
Evidence of outcomes and processesRefocus conversation about collegiate qualityHelps inform decision-makingProvides lexicon for talking about collegiate quality in an understandable, meaningful wayMobilize action
Basics: The Survey
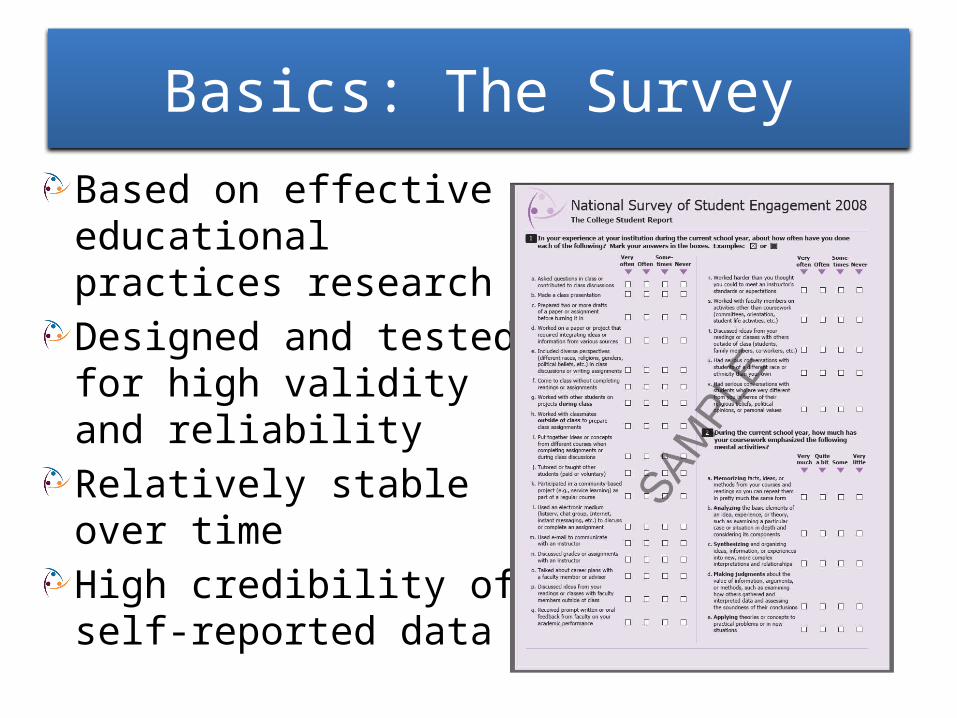
Based on effective educational practices researchDesigned and tested for high validity and reliabilityRelatively stable over timeHigh credibility of self-reported data

Basics: Self-Reported Data
Self-reported data is valid if five conditions are met:1. Information is known to respondents2. Questions are phrased clearly & unambiguously3. Questions refer to recent activities4. Respondents think the questions merit a
serious & thoughtful response5. Answering the questions does not threaten or
embarrass students, violate their privacy, or encourage them to respond in socially-desirable ways
NSSE was intentionally designed to satisfy these five conditions

Using NSSE, FSSE, BCSSE: What Kinds of Questions Can be Explored?
• “Thermometer” Questions How many (or what %) students/faculty...?
• “How Do We Compare” Questions Do we score above or below institutions like us?
• “Comparing Groups” Questions Do X and Y do certain things differently on our campus?
• “Relationship” Questions Are those who x more likely to y?
• “Multiple Data Source” Questions What do faculty and students say about...?
Basics: Questions to Explore with Results

Share information about the Administration
Administration: Timeline & Representativeness
How was survey administered and when?How were students contacted?Were incentives used to promote participationWhat is the response rate?To what extent is the sample representative of the population?What is the sample error?
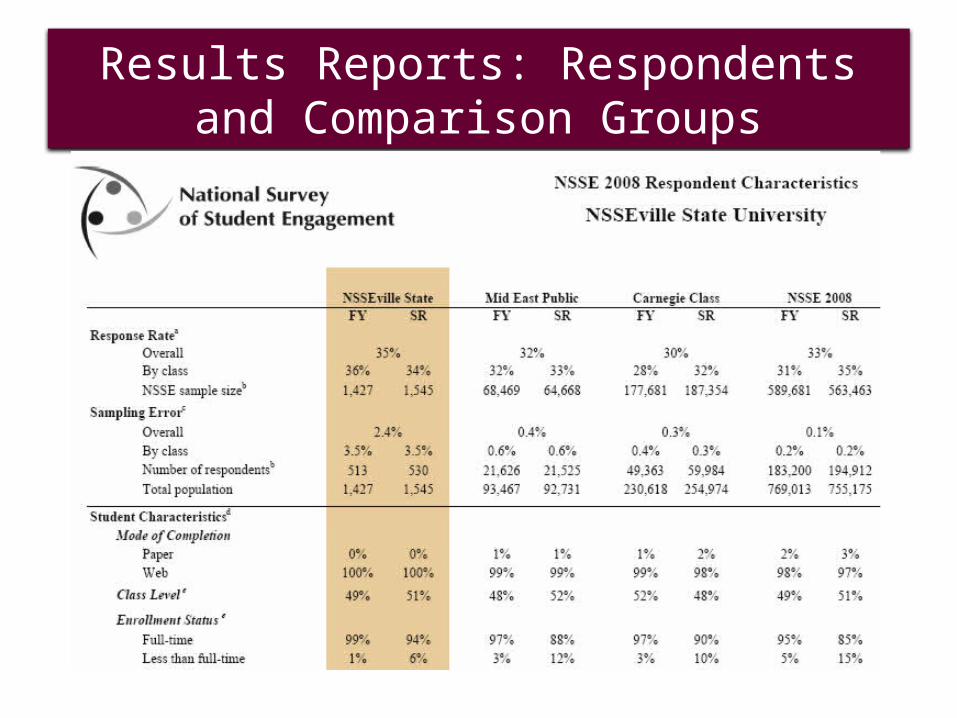
Results Reports: Respondents and Comparison Groups

Sharing Your Results
•Diagnostic purpose - to help institution measure students’ participation in activities that research shows leads to learning and development
•Help pinpoint aspects not in line with mission, or what institution expects
• Identify weaknesses and strengths in educational program
•Help institutions know what to focus on to improve student learning and success
Sharing Results: Return to Purpose

NSSE Results: Where do I start?
1. Start with want you want to know, then go to the dataa. What burning questions do you have about your
students? b. What are the hot topics on your campus? c. How can these data feed you with information on
those topics?2. Scan the results, noting trends or results you
may not have anticipated. How are you stacking up in terms of educational practices of interest to your campus?
Results Reports: Benchmarks
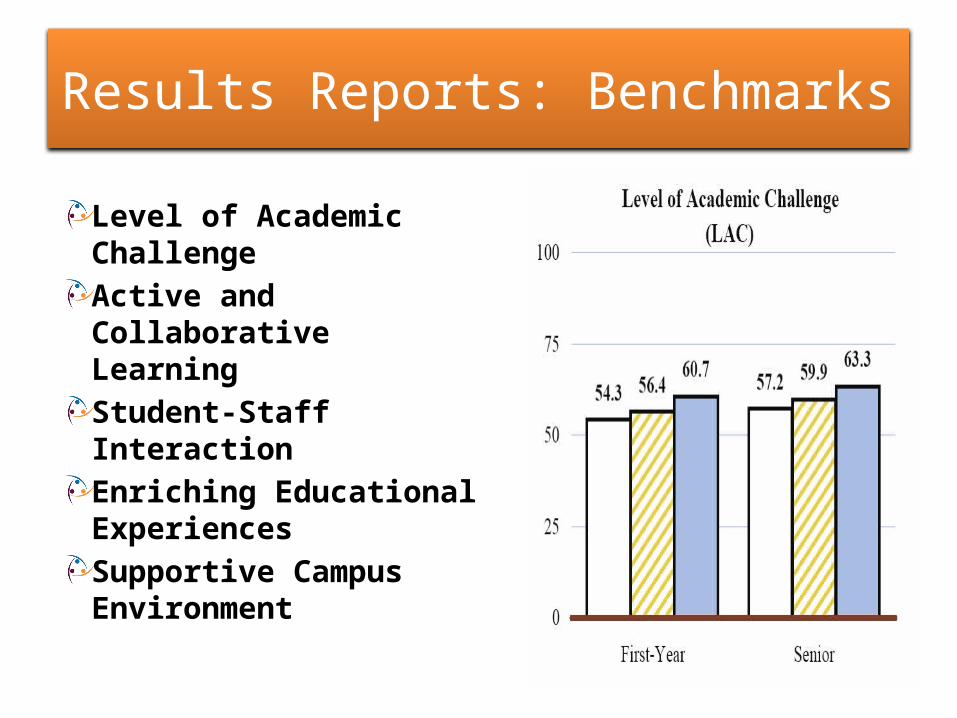
Level of Academic ChallengeActive and Collaborative LearningStudent-Staff InteractionEnriching Educational ExperiencesSupportive Campus Environment

Benchmarks as a Broad Overview
Benchmarks provide a broad overview to resultsIntroduce as conceptual category, a way of grouping related items
Results: Frequencies
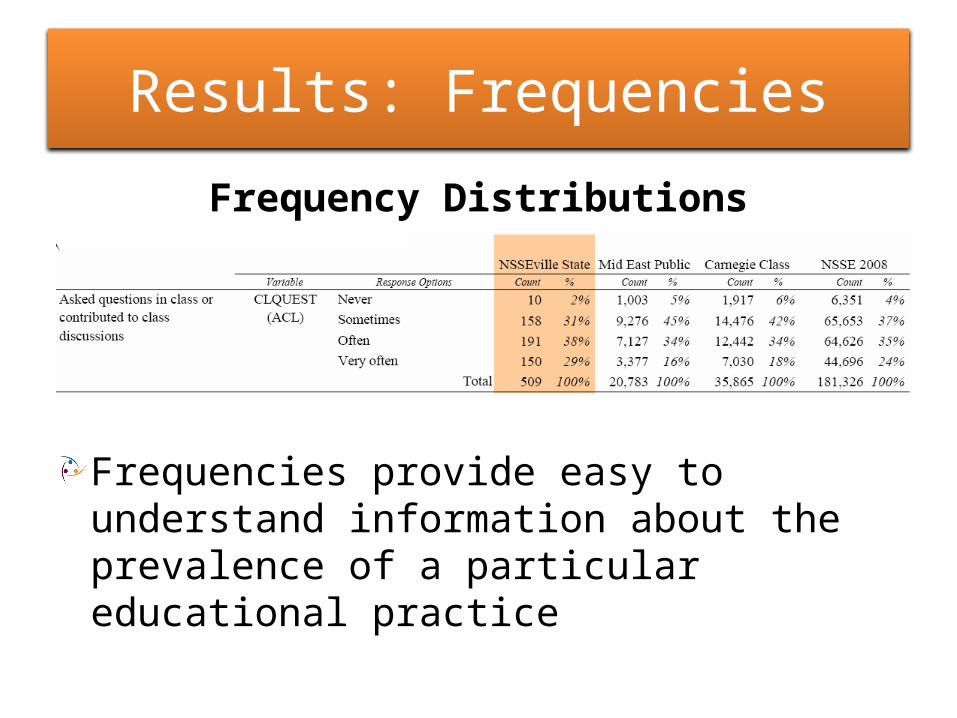
Frequency Distributions
Frequencies provide easy to understand information about the prevalence of a particular educational practice
Frequency Distributions - for a focused look at your students (% that experienced activity)
Invite staff to predict % (good for exposing assumptions and discussion) Look at the “never” responses. What percentages are too high? Do these make sense? Which “nevers” might you focus on reducing or eliminating? Identify items with “positive percents” in which the majority of students report that they “very often” or “often” engage in this activity – are these the result of intentional efforts?
Digging Deeper into Items: Frequencies
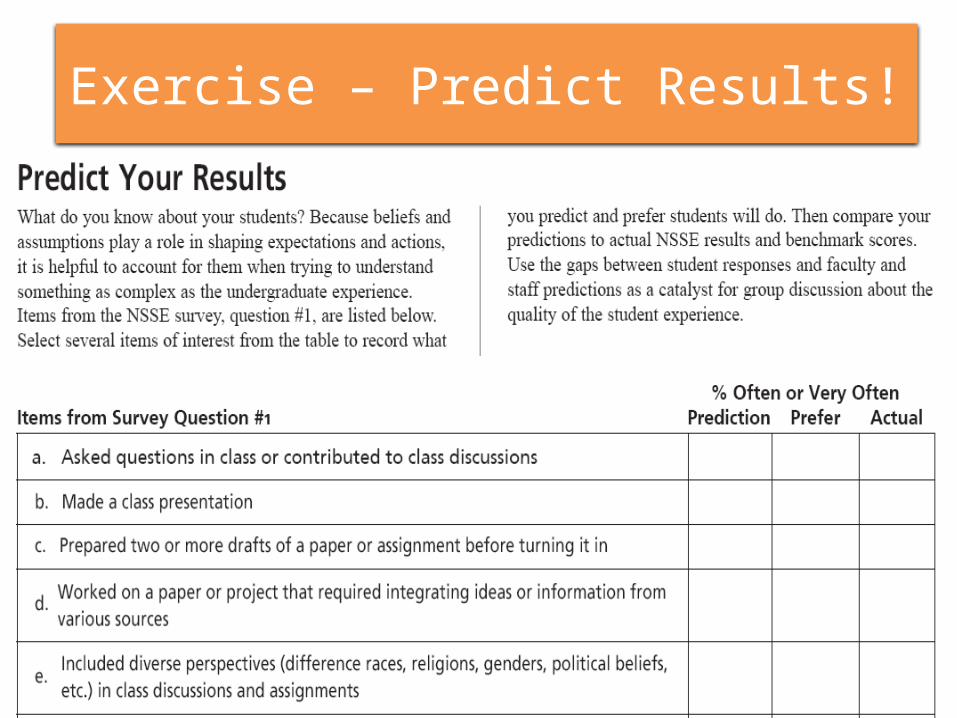
Exercise – Predict Results!
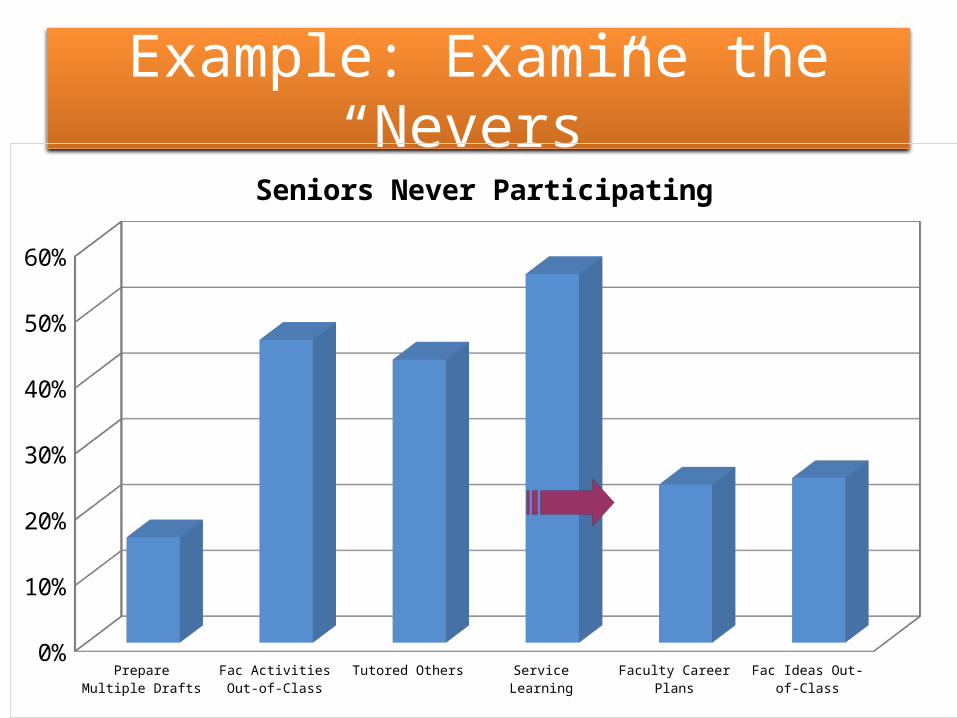
Example: Examine the “Nevers”
Prepare Multiple Drafts Fac Activities Out-of-Class
Tutored Others Service Learning Faculty Career Plans Fac Ideas Out-of-Class0%
10%
20%
30%
40%
50%
60%
Seniors Never Participating
23
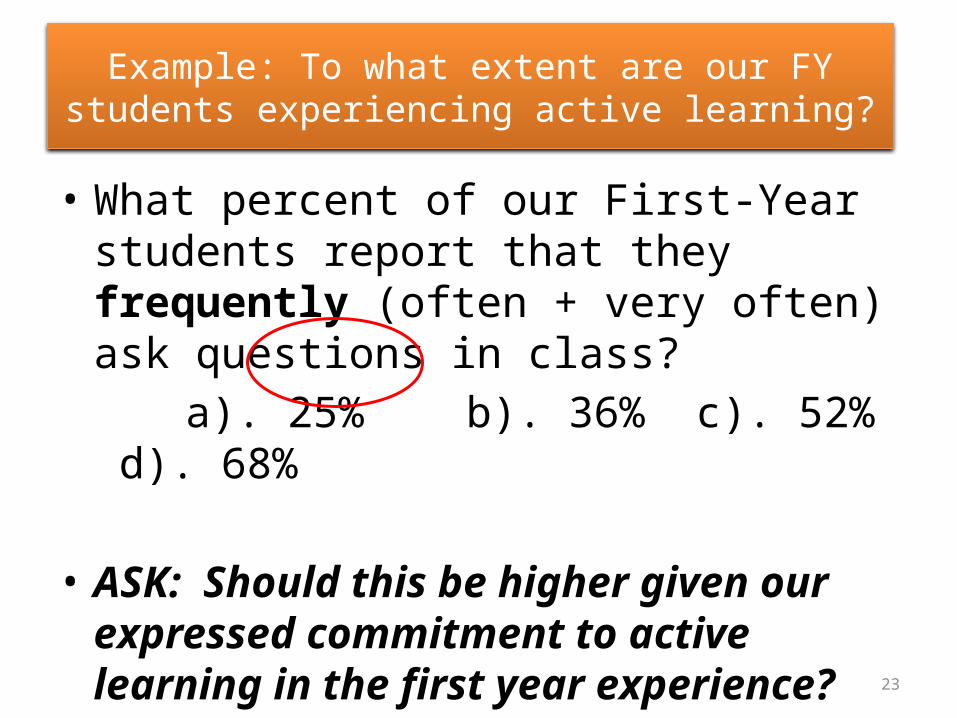
• What percent of our First-Year students report that they frequently (often + very often) ask questions in class?
a). 25% b). 36% c). 52% d). 68%
• ASK: Should this be higher given our expressed commitment to active learning in the first year experience?
Example: To what extent are our FY students experiencing active learning?

Example: Highlight Positive Percents Collaborative Learning By Faculties
% SR frequently (very often+ often) worked with classmates outside of class to prepare What is
happening in Engineering to get these results?

Results Reports: Means
Mean Comparisons
Mean scores provide an average and allow institution to examine how students compare across institutions or to the normEffect size can be calculated to examine magnitude of the difference

About how often have you done the following:Worked with classmates outside of class to prepare class assignments?
ASK: Compared to other institutions, do these data suggest attention is warranted in the First Year at our institution?
Digging Deeper into Items: Means

1. Identify practices most important to faculty, advisors, or to lecturers and staff
2. Benchmarking a. Criterion referenced – at what level do we want our students
to be engaged?b. Norm referenced – comparison to peers, national reference
groups
3. Gap analysis - between what students expect and what they experience, or between what lecturers say they do and what students experience
Using Results: Approaches to Establish Engagement Priorities
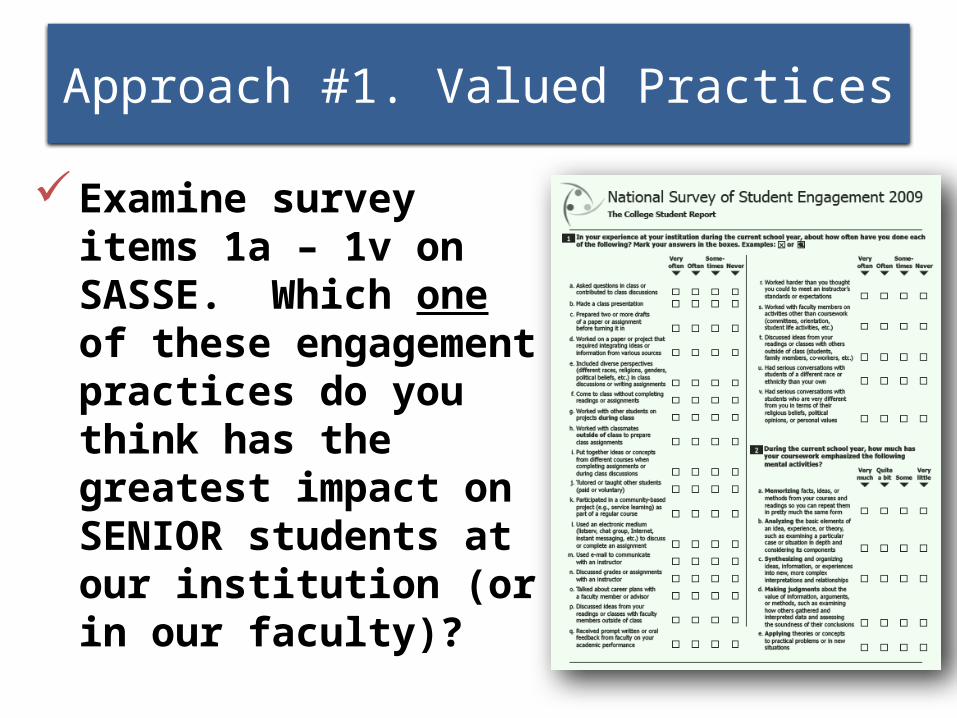
Examine survey items 1a – 1v on SASSE. Which one of these engagement practices do you think has the greatest impact on SENIOR students at our institution (or in our faculty)?
Approach #1. Valued Practices
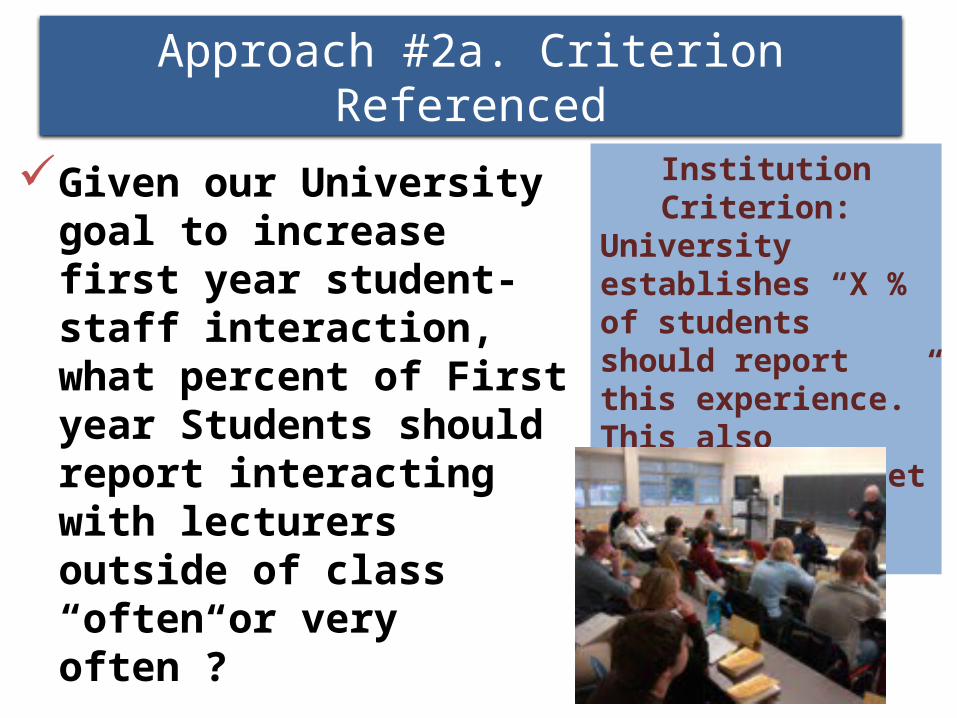
Given our University goal to increase first year student-staff interaction, what percent of First year Students should report interacting with lecturers outside of class “often or very often”?
Approach #2a. Criterion Referenced
Institution Criterion: University establishes “X % of students should report this experience.” This also provides a target for subsequent administrations
• How do our senior students compare to the SASSE norms?
Approach #2b – Norm Referenced

31
• What percent of FY students report they “never” did service-learning?
a). 36% b). 48% c). 55% d). 65%• Faculty Survey of Student Engagement (FSSE)
results show 75% faculty teaching FY think “community service” is “important” but only 32% do this in their FY courses.
• If this is valued by educators should how can we support the practice?
Approach #3. Gap Analysis

Summary of Sharing Results

Student Engagement Results: Internal Campus Uses
Institutional Improvement
PeerComparison
StudentAffairs
AcademicAdvising
Faculty Development
AcademicAffairs
1st Year & Senior Experience
LearningCommunities
InstitutionalResearch
Enrollment Management
LearningAssessment

Use Results for Institutional Improvement
• SASSE results provide opportunity for reflection on institutional performance.
• Are we doing as well as we claim?
• How are we doing in comparison to our peer institutions?
• How do our results align with current institutional concerns and plans?
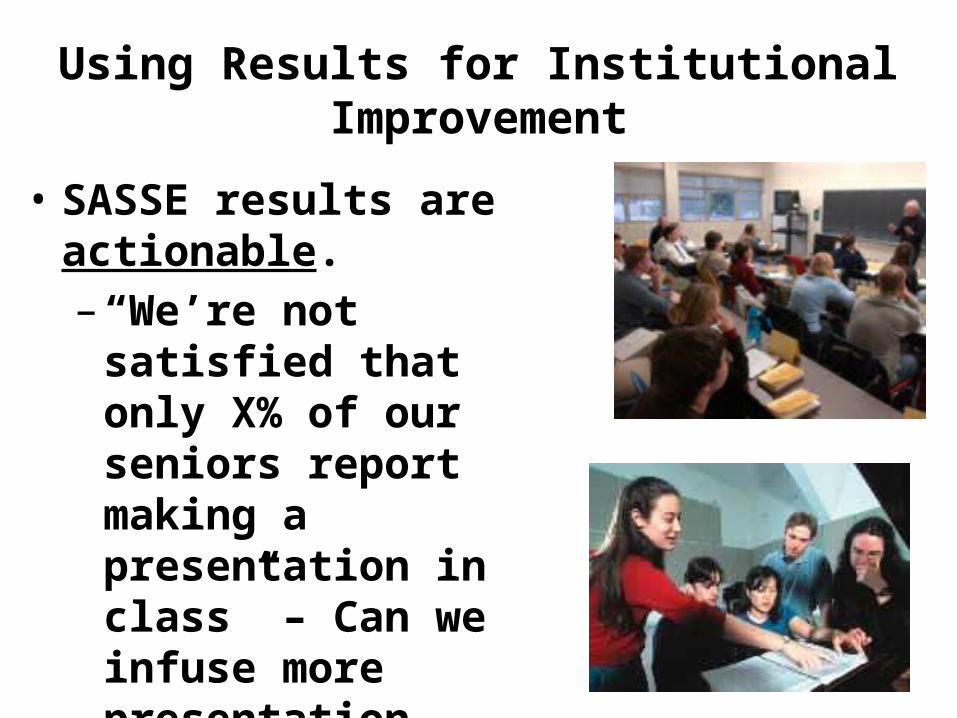
Using Results for Institutional Improvement
• SASSE results are actionable. – “We’re not satisfied that
only X% of our seniors report making a presentation in class” – Can we infuse more presentation experiences in senior courses?
35

The Assessment Loop• Assessment loop: systematic process of (1) setting goals or asking
questions, (2) gathering evidence, (3) interpreting it, and (4) using it to improve
Leskes, A. & Wright, B. (2005). The Art and Science of Assessing General Education Outcomes: A Practical Guide
SASSE Survey

Student Engagement Results: External Campus Uses
Public Accountability
ProspectiveStudents
AlumniState Policy Makers
AccreditingBodies
FundRaising
PerformanceIndicators
Focus onRight Things
Media
GoverningBoardsParents

Executive summary of scores prepared for president and vice-presidents
Report aligning NSSE survey items with long-range strategic plan sent to Board of Trustees, presented to full-faculty, and posted on campus Web site
Student learning report examining student writing experiences based on NSSE scores presented to faculty, included in general assessment report, included in accreditation report, and posted on Web site.
Sharing data for Public Accountability

Questions to stimulate action…
What concerns do you have about your SASSE administration and results?What opportunities do you see for using your SASSE data? What obstacles do you anticipate?Who might you want to involve in your next conversation about SASSE?What might you do within the week after returning from this meeting?

NSSE Cautions
• Only one source of information about student experience
• Not everyone will jump on the student engagement bandwagon
• Managing denial when confronted with less-than-desirable results
• Be sure results are thoroughly vetted• Data don’t speak for themselves• Link results to other data

NSSE Virtues
Survey has compelling face validity
Concept of engagement is accessible
Window into the areas that all colleges and universities espouse to be important
Points to areas where improvement is possible
Benchmark data reveal national picture
Responsible Use of Surveys for Assessment, Improvement & Accountability
• Educate public about what higher education does, as well as about how well it does those things
• Focus on meaningful indicators of quality that allow institutions to illustrate mission
• Foster responsible use of statistics, comparison groups
• Eschew rankings• Encourage “positive restlessness” and institutional
collaboration to improve

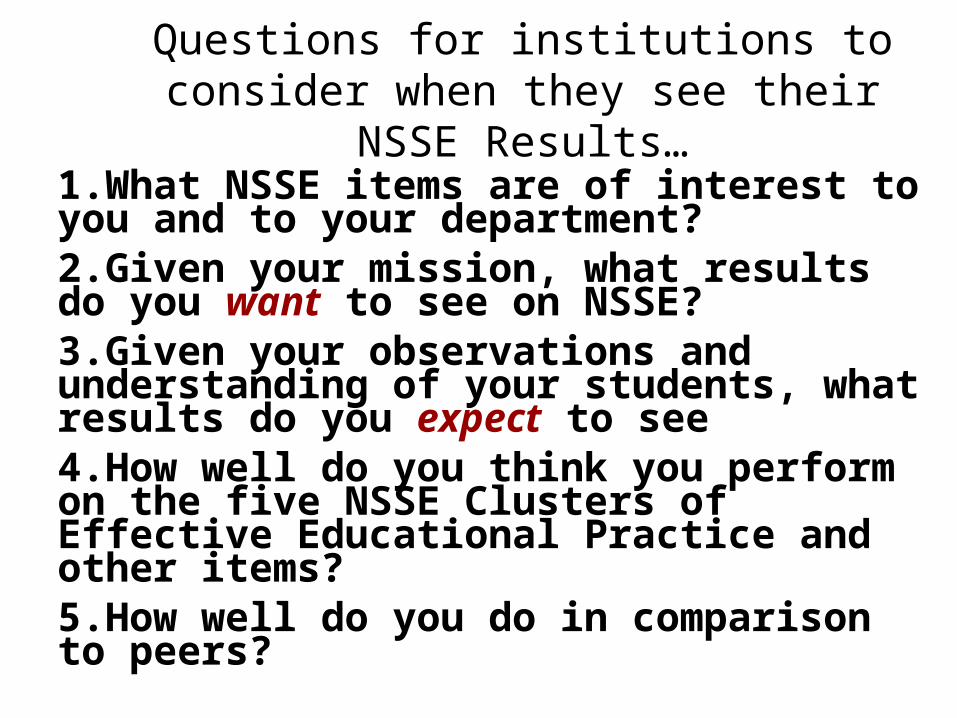
Questions for institutions to consider when they see their NSSE Results…
1.What NSSE items are of interest to you and to your department? 2.Given your mission, what results do you want to see on NSSE?3.Given your observations and understanding of your students, what results do you expect to see4.How well do you think you perform on the five NSSE Clusters of Effective Educational Practice and other items?5.How well do you do in comparison to peers?

Disseminating Results

Using NSSE Results
Diagnostic purpose: analyze the undergraduate experience• Identify strengths and weaknesses, areas where
improvement is needed• Stimulate conversations about quality• Inform decision-making with comparative data
and actionable information

Engagement Among Business Majors
• Where should UNLV SENIORs score?• Are business students at peer and aspirant
schools more engaged than at UNLV?
UNLV Business
Peer Business Aspirant Business 1 & 2
Seniors (n= 65 in 2009)
Hawaii at Manoa; BYU; Utah State; Colorado State;
SDSU(n = 113)
Mizzou; Colorado
Boulder; Utah; Oklahoma
(n=117; 111)

Going Beyond Reports

NSSE: Only One Step in Assessment Process
Step #1: Survey Data
• Survey students• Review results• Develop preliminary
list of strengths and opportunities for improvement
Step #2: Feedback
• Share results with faculty, administrators & students
• Identify themes & priorities
• Design action plan
Step #2: Feedback
• Share results with faculty, administrators & students
• Identify themes & priorities
• Design action planStep #3: Action Plan
• Finalize plan• Share plan with
appropriate groups• Link to strategic plan• Implement action
Step #4: Follow-up
• Use results as benchmarks to monitor progress
• Faculty & student focus groups
Step #4: Follow-up
• Use results as benchmarks to monitor progress
• Faculty & student focus groups

Taking Action on Student Engagement Results
Source: Kinzie, J. & Pennipede, B. (in press). Converting engagement results into action. New Directions for Institutional Research

Plan Action Before Results Arrive
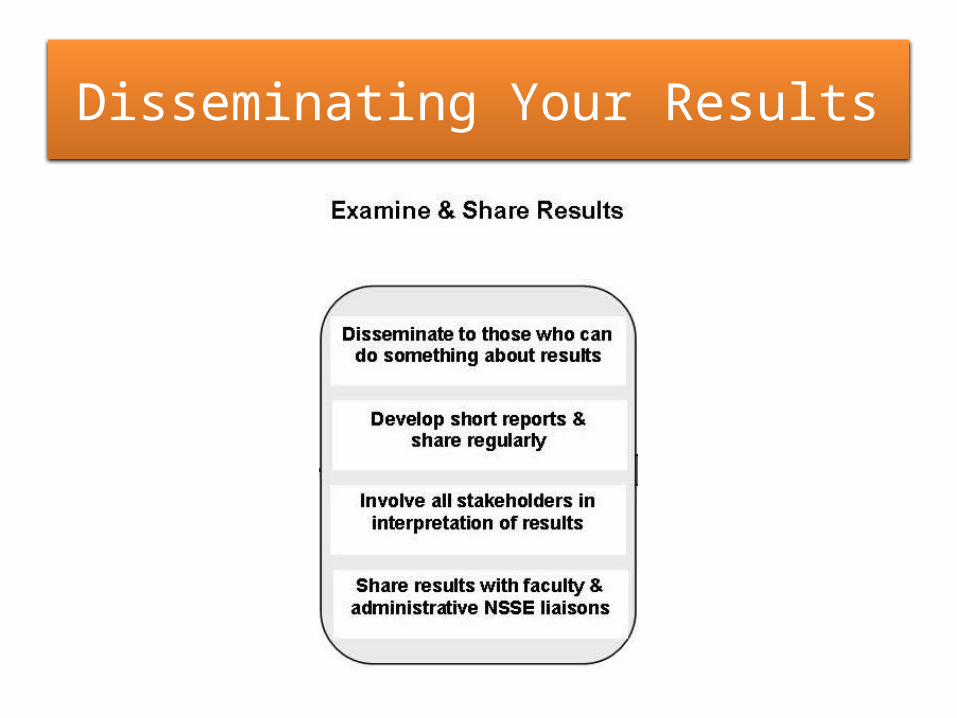
Disseminating Your Results
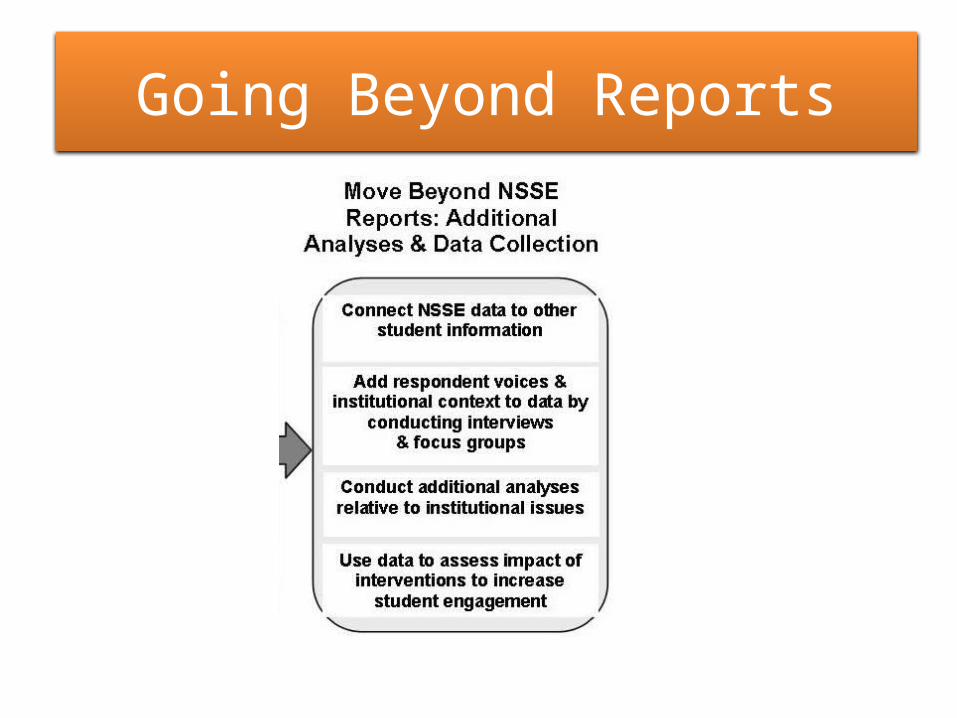
Going Beyond Reports

NSSE in Your Assessment Plan
How often should I administer NSSE?Every Year: Gives you a snapshot of each classEvery Three Years: Gives you a picture of a cohort at the beginning and the end of their college experiencesEvery Five Years: Works well with most accreditation cycles (Accreditation and Interim Reports)Other factors to consider
Establishing a baselineCosts (using all core surveys)Additional Surveys/Sources of DataTime to take absorb results, make changes

NSSE Services
You become part of the NSSE Family with your participation
Consulting
Help with making sense of data
Presentation assistance
Technical questions
Updates, Briefs, Annual Report, new information
Special regional users workshops (meeting other users)
Feedback for NSSE – our Report Card

Beyond Reports
Doing your own within-institution analyses using NSSE resources
SPSS dataCodebooksSyntax library
Additional tools and services from NSSESpecial analysesVoluntary System of AccountabilityAccreditation Toolkits (regional and specialized)Multi-year Data GuideFocus groups
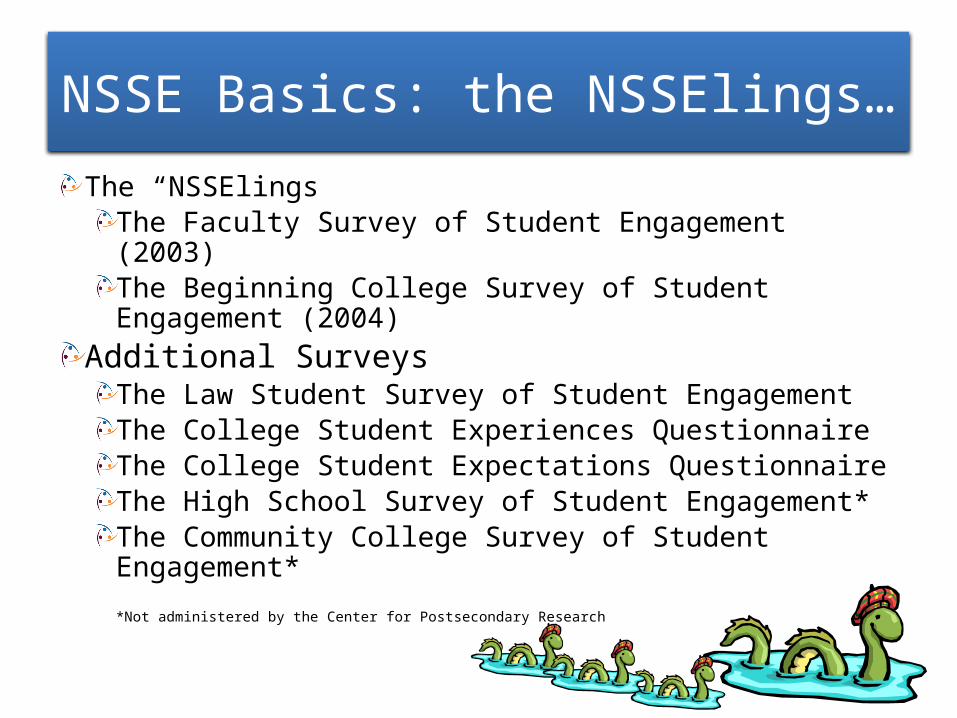
The “NSSElings”The Faculty Survey of Student Engagement (2003)The Beginning College Survey of Student Engagement (2004)
Additional SurveysThe Law Student Survey of Student EngagementThe College Student Experiences QuestionnaireThe College Student Expectations QuestionnaireThe High School Survey of Student Engagement*The Community College Survey of Student Engagement*
*Not administered by the Center for Postsecondary Research
NSSE Basics: the NSSElings…

Administration: Response Rates and Sample Error
Why is this important / Potential problemsStudent beliefs
Age of Spam e-mail and junk mailOver-surveying students (Survey Monkey, etc)Does their opinion matter?
Are students getting the survey?Do they check those mailboxes/e-mailsAre messages getting through e-mail system
Are other admin and faculty aware?Will they endorse the idea if asked by students?Do they see it as important?

Administration: Increasing Student Participation
Customized invitesVariety of templates with customized options
ModePaper, Web, Web+
Announcements and Follow-ups (up to five student contacts)Promotion

Administration: Increasing Respondents
• Advertising-Know your Students– Ads/Articles in Student
Media• How have results been
used in the past?• What are you hoping to
learn/change based on results?
– Flyers/table tents across campus (NSSE is coming)
• Parking Lots, Caf., etc
– E-mail announcements• Popular administrators• Student leaders• FY/SN faculty
– Other venues• Large events or
assemblies• Res. Hall meetings• Student gov’t meetings• Advising meetings• Organization meetings• Front page of website

Administration: Customization
OversamplingTargeting specific types of students
Group VariablesUp to five group variablesFields for targeted oversampling or special analysis
School program, honors status, distance education, learning community, etc.
Selected comparison groupsYour choice – pick schools by name, Carnegie, NSSE cohortConsortia and Systems

Model of NSSE in an institutional assessment plan
Step #1: NSSE Data
• Survey Students• Review Results• Develop Preliminary
List of Strengths and Opportunities for Improvement
Step #2: Feedback
• Share results with Faculty, Administrators & Students
• Identify Themes & Priorities
• Design Action Plan
Step #2: Feedback
• Share results with Faculty, Administrators & Students
• Identify Themes & Priorities
• Design Action PlanStep #3: Action Plan
• Finalize Plan• Share Plan with
Appropriate Groups• Link to Strategic
Plan• Implement Action
Step #4: Follow-up
• Use Results as Benchmarks to Monitor Progress
• Faculty & Student Focus Groups
Step #4: Follow-up
• Use Results as Benchmarks to Monitor Progress
• Faculty & Student Focus Groups
Institutional Effectiveness

Review Respondent Characteristics
1. Does the NSSE sample reflect your student body profile? If sample seems skewed, what cautions might be exercised?
2. How does your institution compare to other institutions in terms of demographic features?
3. What generalizations are or are not possible based on these data?
4. How does your institution’s response rate stack up against other institutions?

Results Reports: Multi-Year Benchmarks
NEW in 2008First-year and senior benchmark scores charted for all years of participationNSSE changes (weight, item changes, etc.) accounted forDetailed statistics (standard errors, confidence intervals, etc.)See our new Multi-Year Data Analysis Guide

Sharing your NSSE data
Provide summaries of results Copy NSSE tables; create your own
Appeal to different stakeholder needsUse the Power Point templateInvolve groups from the beginningMake meaning of the data; why are the numbers what they are?Go back to other data sourcesHow might scores be improved?
National Survey of Student Engagement
66
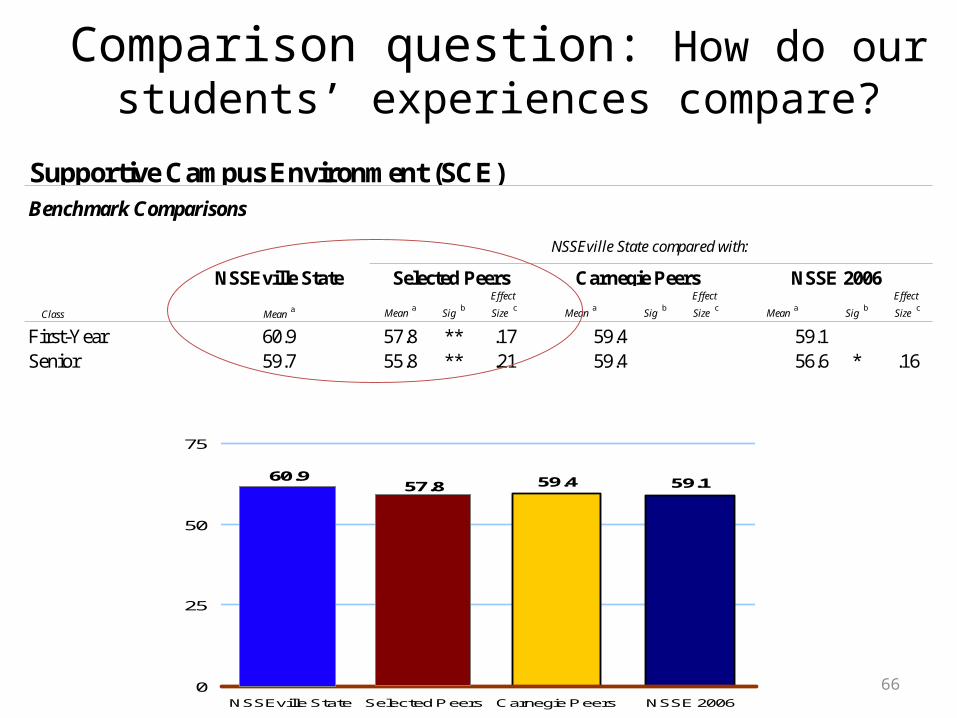
Comparison question: How do our students’ experiences compare?
First-Year
60.957.8 59.4 59.1
0
25
50
75
100
NSSEville State Selected Peers Carnegie Peers NSSE 2006
Class Mean a
Sig bEffect
Size c Mean a
Sig bEffect
Size c Mean a
Sig bEffect
Size c
First-Year 57.8 ** .17 59.4 59.1Senior 55.8 ** .21 59.4 56.6 * .16
Carnegie Peers
59.7
Mean a
NSSEville State
Supportive Campus Environment (SCE)
Selected Peers
Benchmark Comparisons
NSSE 2006
60.9
NSSEville State compared with:

Linking other data: Predicting Retention at Elon University
Students’ relationship with peers predictive of retention. Elon considering programs/services to foster these relationships, checking published findings & best practice.

Using Results: Effect Size
Using NSSE data, we created our own NSSE recommendations for effect size
See our NSSE Effect Size Analysis handoutSmall: d = .1Medium: d = .3Large: d = .5Very Large: d = .7
Context is key!

Using Results: Effect Size
What is effect size?Significant difference versus practical difference
We calculate effect size by dividing the difference between two means by their pooled standard deviation
Cohen’s dSmall: d = .2Medium: d = .5Large: d = .8

Helpful Resource: Facilitator’s Guide
Facilitator’s guide can help you get organizedProvides suggestions for leading a workshop or session on understanding, interpreting and taking action on NSSE dataSimply reporting results may not lead to action
Copies available: www.nsse.iub.edu/institute