encouraging student engagement and educational effectiveness at uw oshkosh jillian kinzie associate...
TRANSCRIPT

Encouraging Student Engagement and Educational Effectiveness at UW Oshkosh
Jillian KinzieAssociate Director
NSSE Institute and Indiana University Center for
Postsecondary Research

Agenda
1.1. Welcome and IntroductionsWelcome and Introductions
2.2. Why student engagement mattersWhy student engagement matters
3.3. Some insights from NSSE Some insights from NSSE
4.4. NSSE, FSSE and UW OshkoshNSSE, FSSE and UW Oshkosh
5.5. Effective Educational Practice Effective Educational Practice
6.6. Creating an Action PlanCreating an Action Plan
7.7. Keeping the Engagement Agenda Keeping the Engagement Agenda manageablemanageable
8.8. Wrap Up and Next StepsWrap Up and Next Steps

The Challenge:
“With respect to college, people have thought that there were two important issues: first, getting in & being able to afford college, and second, to finish and have a degree. But very few people have asked the question, What happens in the four or five years in between those two points? And we’re beginning to find out that what’s going on in that black box called college is less than we had hoped; that maybe the ‘higher’ in higher education is lower than we think.”
- RICHARD H. HERSH, Former - RICHARD H. HERSH, Former President, Trinity College (CT)President, Trinity College (CT)

The Challenge
“We can tell people almost anything We can tell people almost anything about education except how well about education except how well students are learning.”students are learning.”
“Higher Education is stalled despite high school improvement.”
– Patrick M. Callan, President of the National Center for Public Policy and Higher Education

Student Engagement Quiz
What percent of full-time seniors study, on average, more than 20 hours per week?
(a) 14% (b) 23% (c) 32% (d) 41% (e) 50%
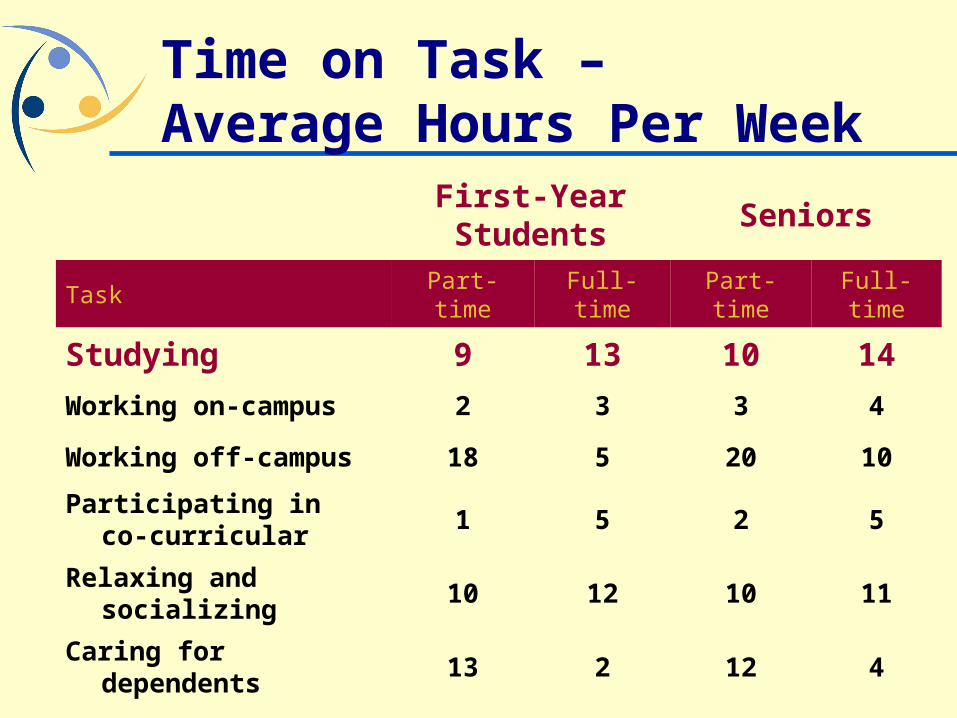
Time on Task – Average Hours Per Week
First-Year Students Seniors
Task Part-time Full-time Part-time Full-time
Studying 9 13 10 14
Working on-campus 2 3 3 4
Working off-campus 18 5 20 10
Participating in co-curricular 1 5 2 5
Relaxing and socializing 10 12 10 11
Caring for dependents 13 2 12 4
Commuting to class 5 4 5 5
Student Engagement Quiz
What percent of first-year students believe their institution provides the support they need to succeed academically?
(a) 44% (b) 55% (c) 66% (d) 77% (e) 88%

Student Perceptions of Their Campus Environment
Percent students say institution provides substantial* emphasis:
First-Year Students
Seniors
Part-
timeFull-
timePart-
timeFull-
time
Spending significant amounts of time studying
72% 81% 77% 81%
Providing academic support 66% 78% 67% 73%
Helping with non-academic responsibilities
27% 33% 22% 26%
* substantial = ‘quite a bit’ or ‘very much’

The Challenge
How might we more effectively use data about quality in undergraduate education to:provide evidence of student learning motivate and inspire institutional improvement promote student success?

Lessons from the Research
• What matters most to desired outcomes is what students do, not who they are
A key factor is the quality of effort students devote to educationally purposeful activities
Educationally effective institutions channel student energy toward the right activities

Good Practices in Undergraduate Education (Chickering & Gamson, 1987; Pascarella & Terenzini, 2005)
Student-faculty contactStudent-faculty contact
Active learningActive learning
Prompt feedbackPrompt feedback
Time on taskTime on task
High expectationsHigh expectations
Experiences with diversityExperiences with diversity
Cooperation among studentsCooperation among students

Engagement Really Matters
Pascarella & Terenzini, How College Affects Students, 2005, p. 602
Because individual effort and involvement are the critical determinants of college impact, institutions should focus on the ways they can shape their academic, interpersonal, and extracurricular offerings to encourage student engagement.

Foundations of Student Engagement
Time on task (Tyler, 1930s)
Quality of effort (Pace, 1960-70s)
Student involvement (Astin, 1984)
Social, academic integration (Tinto,1987, 1993)
Good practices in undergraduate education (Chickering & Gamson, 1987)
College impact (Pascarella, 1985)
Student engagement (Kuh, 1991, 2005)

Defining Student Engagement
Two components to student engagement
What students do —time and energy devoted to educationally purposeful activities
What institutions do —using effective educational practices to induce students to do the right things

Student Engagement is…
“… the time and energy students devote to educationally sound activities inside and outside the classroom, and the policies and practices that institutions use to induce students to take part in these activities.”
(George Kuh, Change, March/April 2003)

Promise ofStudent Engagement
“If faculty and administrators use principles of good practice to arrange the curriculum and other aspects of the college experience, students would… write more papers, read more books, meet with faculty and peers, and use information technology appropriately, all of which would result in greater gains in such areas as critical thinking, problem solving, effective communication, and responsible citizenship.”
Kuh, Kinzie, Schuh, Whitt & Associates, Student Success in College, 2005

Taking a look at NSSE:
Based on effective educational practices
Designed and tested for high validity and reliability
Relatively stable over time
High credibility of self-reported data
Students will participate Actionable data Psychometric properties
document on website*What questions do you have about the items??

NSSE: The College Student Report
Student Behaviors
Institutional Actions & Requirements
Reactions to College
Student BackgroundInformation
Student Learning &
Development

Five Indicators ofEffective Educational Practice
Level of Academic Challenge
Active & Collaborative
Learning
EnrichingEducational Experiences
SupportiveCampus
Environment
StudentFaculty
Interaction

NSSE Project ScopeNSSE Project Scope
Launched in 2000Launched in 2000 First Years & First Years &
SeniorsSeniors Spring Spring
AdministrationAdministration Database =613,500 Database =613,500
students from 850+ students from 850+ different schools different schools
50 states, PR, 50 states, PR, CanadaCanada
40+ consortia40+ consortia 41% response rate41% response rate
Oshkosh 2004 Stats:
Spring 2004, Web Admin33% Response Rate (38% WI system)
Sample error 3.7%302 FY / 302 Seniors

What have we learned from NSSE so far?
The single best predictor of student satisfaction with college is the degree to which they perceive the college environment to be supportive of their academic and social needs.
Effective educational practices measured by NSSE are independent of institutional selectivity.
Schools that have a lower student-faculty ratio, more full-time faculty, and more classes with fewer than 20 students generally score higher on all five NSSE benchmarks.
Grades, persistence, student satisfaction, and engagement go hand in hand.
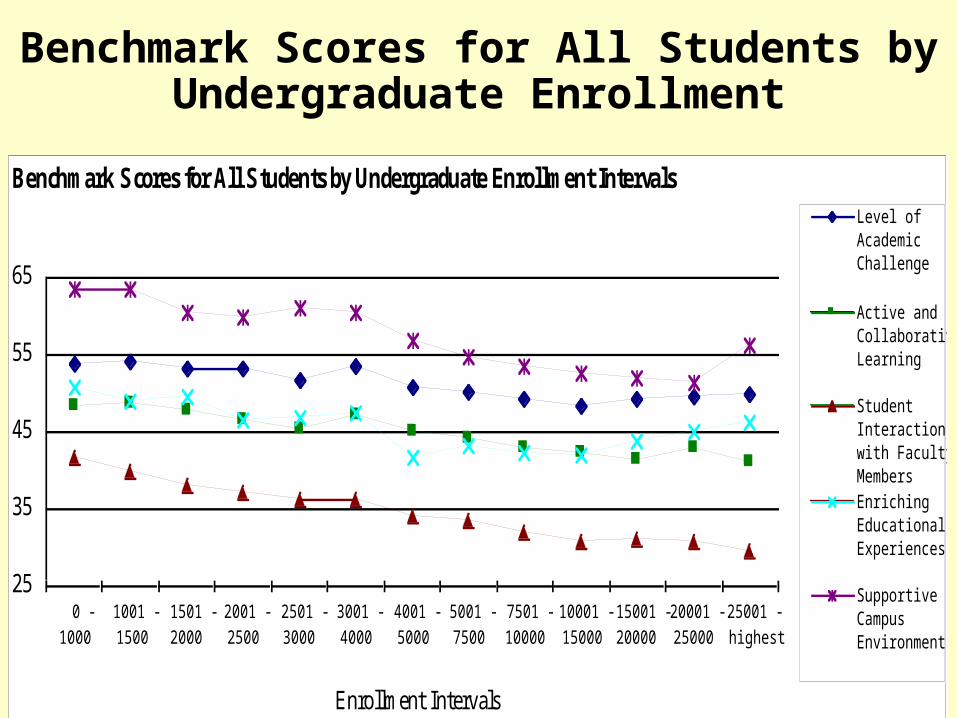
Benchmark Scores for All Students by Undergraduate Enrollment
Benchmark Scores for All Students by Undergraduate Enrollment Intervals
25
35
45
55
65
0 -1000
1001 -1500
1501 -2000
2001 -2500
2501 -3000
3001 -4000
4001 -5000
5001 -7500
7501 -10000
10001 -15000
15001 -20000
20001 -25000
25001 -highest
Enrollment Intervals
Level ofAcademicChallenge
Active andCollaborativeLearning
StudentInteractionswith FacultyMembersEnrichingEducationalExperiences
SupportiveCampusEnvironment

Academic Challenge at Two Public Universities
Student engagement varies more within than between institutions.

First-year students*
Seniors*
Academic Challenge .60 .46
Active & Collaborative Learning .23 .09
Student Faculty Interaction .28 .37
Enriching Educational Experiences
.53 .48
Supportive Campus Environment
.38 .26
Relationship between NSSE & Graduation Rates
*All correlations are significant at p<.01

NSSE Promising Findings
More than 75% of “A” students say they are highly motivated to succeed compared with only half of the “C” students.
At institutions where faculty members use effective educational practices more frequently in their classes, students are more engaged over all and gain more from college.
A majority of students (54% of first-year students and 63% of seniors) says they often discuss ideas from readings or classes with others outside of class, and well over 90% do this at least sometimes.

Engagement Challenges & Responses
CHALLENGES
Institutional size
Varied levels of engagement within institution
Research mission competes with undergraduate education
EFFECTIVE RESPONSES
University of Kansas
Research Mission but focus on undergraduate teaching
Miami University
Student – faculty research emphasis

NSSE Disappointing Findings
Three of ten first-year students reported working just hard enough to get by.
Between 40% and 50% of first-year students never used career planning, financial advising, or academic tutoring services.
Almost half of all students (43% first-years, 48% seniors) spend no time on cocurricular activities.

Considering Student Engagement at UW OshkoshExercise #1:Exercise #1:
1. Assess Oshkosh’s effectiveness on 1. Assess Oshkosh’s effectiveness on the five NSSE Clusters of Effective the five NSSE Clusters of Effective Educational Practice Educational Practice
Ratings:Ratings:+ we do this very well we do this pretty well- we could improve in this area? not sure
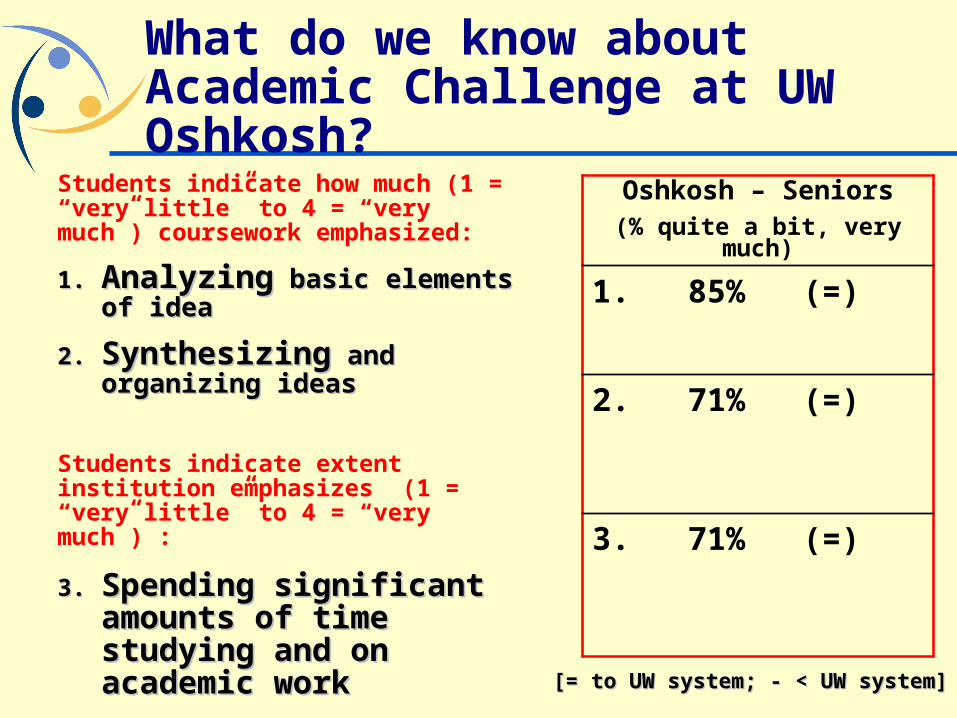
What do we know about Academic Challenge at UW Oshkosh?
Students indicate how much (1 = “very little” to 4 = “very much”) coursework emphasized:
1.1. AnalyzingAnalyzing basic elements basic elements of ideaof idea
2.2. SynthesizingSynthesizing and and organizing ideas organizing ideas
Students indicate extent institution emphasizes (1 = “very little” to 4 = “very much”) :
3.3. Spending significant Spending significant amounts of time amounts of time studying and on studying and on academic workacademic work
Oshkosh – Seniors(% quite a bit, very
much)
1. 85% (=)
2. 71% (=)
3. 71% (=)
[= to UW system; - < UW system][= to UW system; - < UW system]

Student Engagement at Oshkosh
True or False?
1. More Oshkosh seniors than first year students report that they worked harder than they thought they could to meet an instructors standards or expectations.

What do we know about Active & Collaborative learning at UW Oshkosh?
Students indicate how often (1 = “never” to 4 = “very often”) they’ve done the following:
1.1. Asked questions in class or Asked questions in class or contributed to class contributed to class discussionsdiscussions
2.2. Made a class presentationMade a class presentation
3.3. Worked with other Worked with other students on projects in students on projects in classclass
4.4. Worked with classmates Worked with classmates outside of class to prepare outside of class to prepare assignmentsassignments
5.5. Participated in a Participated in a community-based project community-based project (e.g. service learning) as (e.g. service learning) as part of a coursepart of a course
Oshkosh – First-Years(% often, very often)
1. 39% (-)
2. 25% (=)
3. 39% (=)
4. 26% (-)
5. 5% (-)
[= to UW system; - < UW system][= to UW system; - < UW system]

Student Engagement at Oshkosh
True or False?
2. More Oshkosh seniors than first year students report that they frequently* worked with classmates outside of class to prepare class assignments.
(*% reporting “often” and “very often”)

Student Engagement at Oshkosh
3. What percent of Oshkosh seniors “never” participated in a community based project as part of a course?
(a) 75% (b) 60% (c) 54% (d) 48% (e) 40%

Students indicate how often (1 = “never” to 4 = “very often”) they’ve done the following:
1.1. Discussed ideas from your Discussed ideas from your readings or classes with faculty readings or classes with faculty members outside of classmembers outside of class
2.2. Received prompt feedback Received prompt feedback from faculty on academic from faculty on academic performanceperformance
Seniors indicate if they have done the following:
3.3. Practicum, internship, co-opPracticum, internship, co-op
4.4. Community serviceCommunity service
5.5. Work on a research project Work on a research project with faculty member outside with faculty member outside course or program course or program requirementsrequirements
Oshkosh – FY and Seniors
(% often, very often OR “Done”)
1. FY 8% (=/-)
SR 17% (=)
2. FY 43% (=)
SR 61% (=)
3. SR 46% Done (=/-)
4. SR 58% Done (=)
5. SR 10% Done (-)
What do we know about Student-Faculty Interaction and Enriching Educational Experiences at UW Oshkosh?

Student Engagement at Oshkosh
4. What percent of Oshkosh seniors “never” talked about career plans with a faculty member or advisor?
(a) 50% (b) 43% (c) 30% (d) 27% (e) 21%

Student Engagement at Oshkosh
5. What percent of Oshkosh first-year students rate the quality of advising as “good” or “excellent”?
(a) 60% (b) 68% (c) 74% (d) 80% (e) 85%

Some Findings for Oshkosh First-Years (FY)
Only 48% of FY “often-very often” prepared 2 or more drafts of a paper/assignment before turning it in
Few FY worked with classmates outside of class to prepare assignments
FY have limited interaction with faculty – they infrequently discuss grades or assignments, rarely email faculty, and don’t interact much with faculty in co-curricular settings
Oshkosh FY students are not engaged as much as their peers at other WI schools in active learning, and report limited use of practices associated with enriched learning (multiple drafts, talking with faculty, studying with peers, attending arts, theater events)
How can expectations for active learning be raised for first years?

Some Findings for Oshkosh Seniors
58% of seniors report spending 0 hrs. a week in co-curricular activities (vs. 38% at UW syst)
61% of seniors report little institutional emphasis on attending campus events (vs. 43% at UW syst)
Oshkosh seniors report limited engagement in activities associated with enriched learning for seniors (working with faculty on research, or in out-of-class activities, co-curricular involvements, attending cultural activities)
How can Seniors’ experience be enriched?

Considering Student Engagement at Oshkosh
1.1. Do these data fit your Do these data fit your perceptions?perceptions?
2.2. What surprised you?What surprised you?3. Where might you look to
improve?4.4. Around which benchmarks and Around which benchmarks and
data points do you want more data points do you want more evidence?evidence?

Effective Educational Practice at UW Oshkosh
Exercise #2:Exercise #2: 1.1. Which activity listed in NSSE question Which activity listed in NSSE question
#1 if increased would lead to #1 if increased would lead to greatestgreatest learning and development for first-learning and development for first-year students? for seniors?year students? for seniors?
2.2. What could What could youyou do to influence this do to influence this item?item?
3.3. What activities in NSSE question #1 What activities in NSSE question #1 are most interesting to UW Oshkosh?are most interesting to UW Oshkosh?
4.4. What other NSSE items (#2-30) are of What other NSSE items (#2-30) are of interest to you?interest to you?

Encouraging Educational Effectiveness: Lessons from Project DEEP
Project DEEP: Project DEEP:
To discover, To discover, document, and document, and describe what 20 describe what 20 high performing* high performing* institutions do to institutions do to achieve their achieve their notable level of notable level of effectiveness.effectiveness.
*better-than-predicted graduation *better-than-predicted graduation rates and student engagement rates and student engagement scoresscores

DEEP - Six Shared Conditions
1.1. ““Living” Mission and “Lived” Living” Mission and “Lived” Educational PhilosophyEducational Philosophy
2.2. Unshakeable Focus on Student Unshakeable Focus on Student Learning Learning
3.3. Environments Adapted for Environments Adapted for Educational EnrichmentEducational Enrichment
4.4. Clearly Marked Pathways to Clearly Marked Pathways to Student SuccessStudent Success
5.5. Improvement-Oriented Ethos - Improvement-Oriented Ethos - “Positive Restlessness”“Positive Restlessness”
6.6. Shared Responsibility for Shared Responsibility for Educational Quality Educational Quality

Student-Faculty Interaction
Student role in campus governance
All University of Kansas committees are required to have 20% student representation, including search and screen committees. Therefore, new faculty recruits interact with students from the start.

Supportive Campus Environment
Intentionally orchestrated, educationally purposeful peer interaction
Longwood University values “students helping other students” as a catalyst to promote student achievement and learning and “to wake up students’ volunteerism and academic pursuits.” Peer mentors in the Longwood Seminar, residence halls leadership roles, and the strong co-curricular program makes this possible.

Unshakeable Focus on Student Learning
Timely and Apt Feedback
GMU, Ursinus, CSUMB…students use electronic technology (email, Blackboard) to submit drafts of papers for feedback. “E-mailing a professor is a much more efficient way to interact. . . . It reduces the wait between when I have a question and when I can get a response from my professor.”

Environments Adapted for Educational Enrichment
Physical space promotes collaboration
Wofford’s Milliken Building -- its science center -- was intentionally designed with plenty of “fishbowls” and other areas for group work space. “Homework lounges,” adjacent to faculty offices, also promote interactive learning.

Redundant early warning systems -“Tag Teaming”
Wheaton’s first-year student advising team includes faculty, student preceptors, librarians and administrative staff.
At Ursinus, Miami, and Wheaton representatives from both academic affairs and student affairs serve as academic advisors.
Clearly Marked Pathways to Student Success
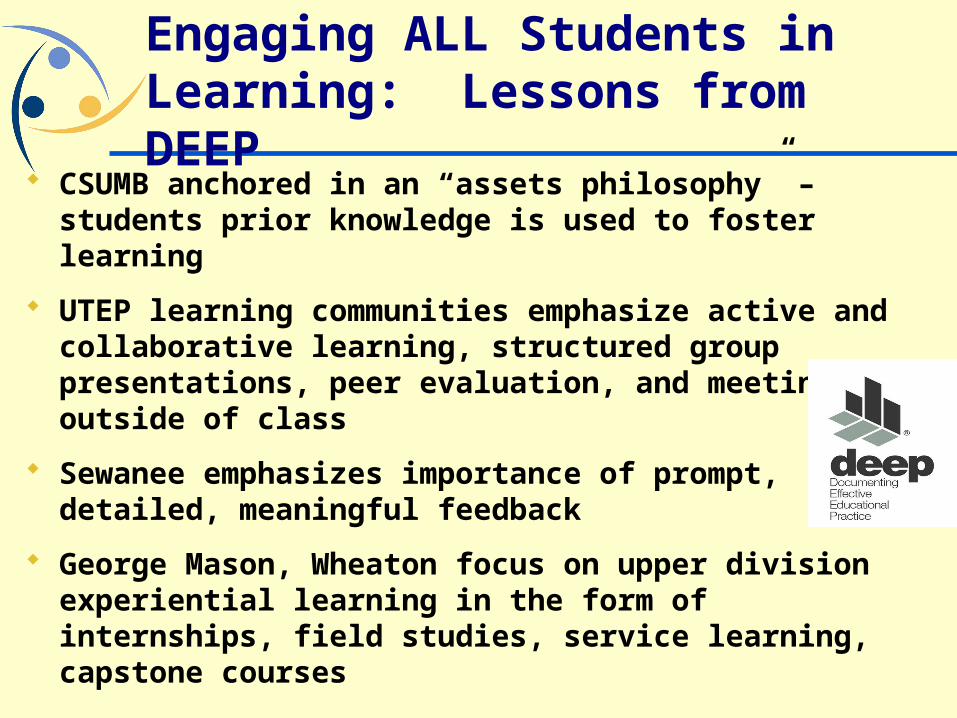
Engaging ALL Students in Learning: Lessons from DEEP
CSUMB anchored in an “assets philosophy” – students prior knowledge is used to foster learning
UTEP learning communities emphasize active and collaborative learning, structured group presentations, peer evaluation, and meetings outside of class
Sewanee emphasizes importance of prompt, detailed, meaningful feedback
George Mason, Wheaton focus on upper division experiential learning in the form of internships, field studies, service learning, capstone courses

DEEP issues to ponder:
1.1. To what degree are all students having a To what degree are all students having a quality learning experience?quality learning experience?
2.2. What might be done to improve the conditions What might be done to improve the conditions for student success?for student success?
3.3. How might curricular and co-curricular How might curricular and co-curricular opportunities be integrated to enrich student opportunities be integrated to enrich student learning?learning?
4.4. How do new students learn what it takes to How do new students learn what it takes to succeed? How does this differ for seniors?succeed? How does this differ for seniors?
5.5. To what degree are faculty and staff To what degree are faculty and staff encouraged to adopt new approaches to encouraged to adopt new approaches to engaged learning?engaged learning?
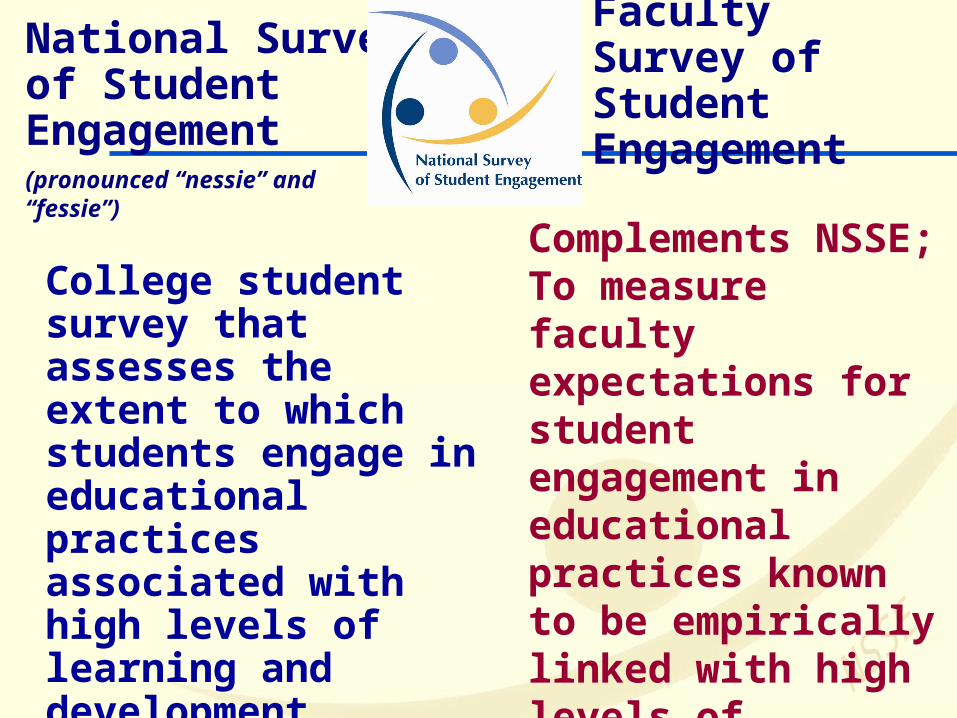
National Survey of Student Engagement
College student survey that assesses the extent to which students engage in educational practices associated with high levels of learning and development
Complements NSSE; To measure faculty expectations for student engagement in educational practices known to be empirically linked with high levels of learning and development
(pronounced “nessie” and “fessie”)
Faculty Survey of Student Engagement

NSSE – FSSE Oshkosh Learning Activity
Importance - Frequency GapOshkosh Upper Div. Faculty Importance (very important - imp)
ITEM Oshkosh SENIOR
89% Practicum, Internship
48% “Done”
55% Work on research project
10% “Done”
59% Work with classmates
outside of class to prepare
assignments
61% “Often or Very Often”
66% Put together ideas or concepts from different courses
65% “Often or Very Often”

NSSE-FSSE Gap – UW Oshkosh Prompt Feedback
FACULTY gave prompt feedback often or very often
STUDENTS received prompt feedback often or very often
84% | 97%
Lower Division
Upper Division
43% | 61%
1st yr. Students Seniors

NSSE-FSSE Educational Gains Gap
[Oshkosh Seniors]Upper Div. Fac
Structure Courses Quite a bit/Very
much so students develop
ITEM % SENIOR Frequency (very much/Quite a bit)
63% Write Clearly 70% (=)
49% Speak Clearly 66% (-)
57% Work with others 73% (-)
92% Think Critically & Analytically
83% (=)
67% Solve Complex Real Problems
49% (=)
77% Acquiring Work-related Knowledge
72% (=)

NSSE-FSSE GapsWhat to make of this?
1. When faculty members emphasize certain educational practices, students engage in them to a greater extent than their peers elsewhere.
2. Conversation starters about expectations for teaching and learning

Creating an Action Plan around Student Engagement and Educational
Effectiveness

“NSSE is a great way to stimulate reflection and debate about what we do more and less well, and why. For us it’s proving an exciting and enlivening tool for self-reflection and self-improvement.”
--Michael McPherson, President of The Spencer Foundation (former President of Macalaster College)
Using NSSE Results…Stimulating Conversation on
Campus

Best Practices in Using NSSE Results: Institutional Examples
NSSE pivotal tool to document general characteristics of undergrad ed
Used by colleges (College of Arts and Sciences)
NSSE data used by different stakeholders FY data more useful for Student Affairs, SR data more useful as a proxy for student learning in Acad
Affairs, Departments use NSSE items as “big picture” indicators Means of assessing strategy and priority for quasi-academic
programs (ADP, service learning) Fodder for department meetings “Just another piece of the assessment puzzle” Future ideas: Find ways to incorporate NSSE more directly into
departmental assessment (primarily for Gen Ed classes); Continue to share NSSE widely; Many want data on seniors/graduates: Alumni, Endowment, Student Affairs; Use the freshmen data much more in Academic Affairs

Best Practices in Using NSSE Results: Institutional Examples
Used NSSE items in 11a-p to assess Used NSSE items in 11a-p to assess institutional impact on college-level institutional impact on college-level competencies competencies (a.k.a., indirect measures of (a.k.a., indirect measures of student learning outcomes) student learning outcomes)
Undergraduate Undergraduate seniors seniors 2005 NSSE 2005 NSSE results confirmed findings from 2004results confirmed findings from 2004
Most seniors (75%+) reported that Most seniors (75%+) reported that KSU experience had “substantial KSU experience had “substantial impact” (VM+QAB) in 9 or 16 college-impact” (VM+QAB) in 9 or 16 college-level competencieslevel competencies
KSU rank ordered competencies, KSU rank ordered competencies, showing connection to mission, and showing connection to mission, and compared to other master’s instit compared to other master’s instit where KSU was sig. higher, where KSU was sig. higher, comparable, sig. lower on comparable, sig. lower on competenciescompetencies

Best Practices in Using NSSE Results: Institutional Examples
NSSE results framed a “Sophomore Experience”
2005 = Pace’s 5th year of participation
Concern regarding SP- JR persistence; FY results offers context for understanding exp. as students enter SP year
Established “SP Experience Working Group” to investigate if FY exp. carried over in SP year. Focused on low NSSE score items, conducted focus groups, created sophomore survey. Led to pilot of “Pace Plan” (mentoring), includes Career Exploration Course, Sophomore Kick-Off Day
NSSE also used in strategic indicators, Accred, NCATE, AACSB, Faculty Development/Colloquia, items used by offices (Technology, Multicultural Affairs), studies performed by Enrollment Mngmt.

Best Practices in Using NSSE Results: Institutional Examples
Concerned about FY-SP retention. Concerned about FY-SP retention. Used NSSE to identify conflict Used NSSE to identify conflict between UC image and student between UC image and student experience. Shared with stakeholders to experience. Shared with stakeholders to brainstorm around retention.brainstorm around retention.
Only 50% of FY students reported that Only 50% of FY students reported that they participated in a “learning they participated in a “learning community,” though all were required. community,” though all were required. UC made LC goals, purpose more UC made LC goals, purpose more explicit, saw rise to 75% in next NSSE. explicit, saw rise to 75% in next NSSE.
UC mission focuses on writing, yet NSSE UC mission focuses on writing, yet NSSE data did not stand out. Used data to data did not stand out. Used data to propose new strategies around propose new strategies around developmental writing. developmental writing.
Saw 5% retention boost, over 2 years.Saw 5% retention boost, over 2 years.

Best Practices in Using NSSE Results: Institutional Examples
Created engagement agenda on Created engagement agenda on campuscampus
NSSE introduced to New Faculty NSSE introduced to New Faculty Teaching Scholars Teaching Scholars
Workshops held with academic Workshops held with academic leaders to link results with leaders to link results with University’s strategic indicatorsUniversity’s strategic indicators
NSSE items in course evaluations NSSE items in course evaluations Open forum to get student input Open forum to get student input
about ways to improve learning about ways to improve learning environmentenvironment

1. Get the ideas rightFocus on a real problem Persistence Under-engaged students Fragmented gen ed program Tired pedagogical practices Poor first-year experience Low academic challenge Connections to real world Capstone experiences
LESSONS FOR MAXIMIZING USE OF NSSE DATA

2. Get grass roots buy-in
Confirm/corroborate resultsConfirm/corroborate results
Drive data down to dept levelDrive data down to dept level
Gain consensus on student Gain consensus on student engagement prioritiesengagement priorities

3. Fashion data-informed monitoring systems
Use multiple sources of dataUse multiple sources of data ACT/SAT score reportsACT/SAT score reports BCSSEBCSSE NSSENSSE FSSEFSSE CIRP/CSSCIRP/CSS Noel LevitzNoel Levitz CLACLA ACT CAAPACT CAAP
Explain every number Consider a systematic review of Consider a systematic review of
policies and practices (ISES)policies and practices (ISES)

NSSE: Only one step towards educational effectiveness
Step #1: Survey Data
• Survey Students• Review Results• Develop Preliminary
List of Strengths and Opportunities for Improvement
Step #2: Feedback
• Share results with Faculty, Administrators & Students
• Identify Themes & Priorities
• Design Action Plan
Step #2: Feedback
• Share results with Faculty, Administrators & Students
• Identify Themes & Priorities
• Design Action PlanStep #3: Action Plan
• Finalize Plan• Share Plan with
Appropriate Groups• Link to Strategic
Plan• Implement Action
Step #4: Follow-up
• Use Results as Benchmarks to Monitor Progress
• Faculty & Student Focus Groups
Step #4: Follow-up
• Use Results as Benchmarks to Monitor Progress
• Faculty & Student Focus Groups
Institutional Effectiveness

Inventory for Student
Engagement and Success
A qualitative assessment of educational effectiveness
based on findings from Project DEEP (Documenting
Effective Educational Practice) regarding
conditions that matter to student success

5. Stay the course
Emphasize qualityEmphasize quality
Front-load resourcesFront-load resources
If it works, consider requiring itIf it works, consider requiring it
Scale up effective practicesScale up effective practices
Sunset ineffective programs Sunset ineffective programs
Beware the implementation dipBeware the implementation dip
Creating an Action Plan:
“Ready, fire, aim.” Weick, 1995, p. 168

Keeping the Engagement Agenda Manageable…
“The good-to-great transformations The good-to-great transformations never happened in one fell swoop. never happened in one fell swoop. There was no single defining action, There was no single defining action, no grand program, no one killer no grand program, no one killer innovation, no solitary lucky break, innovation, no solitary lucky break, no miracle moment. Sustainable no miracle moment. Sustainable transformations follow a predictable transformations follow a predictable pattern of buildup and pattern of buildup and breakthrough…” breakthrough…” (Collins, 2001, p. (Collins, 2001, p. 186)186)

Exploring Next Steps at Oshkosh
• What steps might you take to generate more interest in student engagement and NSSE data?
• What is one thing you can commit to doing now?
• What do you hope to do next?
• How will you ensure the success of your 2006 NSSE administration?
• Which results do you hope to monitor?

Discussion and Comments
1900 East 10th StreetEigenmann Hall, Suite 419Bloomington, IN 47406 Ph: 812-856-5824Fax: 812-856-5150
www.iub.edu/~nsse
Jillian Kinzie, PhD.NSSE Institute – Indiana University Center for Postsecondary Research