shale gas: analyzing risks and opportunities - boston university
TRANSCRIPT

Shale Gas: Analyzing Risks and Opportunities
Sue Tierney – Analysis Group
Society for Risk Assessment Boston University – April 9, 2012
Society for Risk Assessment / Boston University
O i N t l G Ri k d O t itiOverview – Natural Gas Risks and Opportunities:
Shale Gas: Game Changer or Something Else?Context for my comments
What’s happening with shale gas
Some implications
Page 2April 9, 2012

Society for Risk Assessment / Boston University
CONTEXT FOR MY COMMENTS:Natural Gas: Shale Gas
CONTEXT FOR MY COMMENTS:Recent Involvement in NPC and SEAB Studies
Page 3April 9, 2012

Society for Risk Assessment / Boston University
O i d b k dOverview and background:
Who: SEAB Board Natural Gas SubcommitteeDeutch, Holditch, McGinty, Krupp, Yergin, Tierney, Zoback
Wh t P id ti l t t S t ChWhat: Presidential request to Secretary Chu (Blueprint for Secure Energy Future Charge):
examine steps to improve the safety and environmental performance of shale gas developmentnot regulation, per se
When: Initial report: mid-August 2011Final report: mid-November 2011
Page 4April 9, 2012

Society for Risk Assessment / Boston University
O i d b k dOverview and background:
Who: National Petroleum Council
What: Energy Secretary Request to NPCAssessment of the size of the oil and natural gas resource base in North Americabase in North AmericaAssessment of the role of natural gas in GHG reductions
When: Start – early 2010When: Start early 2010
Report: September 15, 2011“Prudent Development: Realizing thePrudent Development: Realizing the Potential of North America’s Abundant Natural Gas and Oil Resources”
Page 5April 9, 2012

Society for Risk Assessment / Boston University
WHAT’S HAPPENINGNatural Gas: Shale Gas
WHAT S HAPPENING
Page 6April 9, 2012

Society for Risk Assessment / Boston University
What does shale gas look like? ROCK
Shale Gas Outcropping
Page 7April 9, 2012
Shale Gas Outcropping –Marcellus

Society for Risk Assessment / Boston University
Wh d h l l k lik ? REGIONSWhat does shale gas look like? REGIONS
Page 8April 9, 2012

Society for Risk Assessment / Boston University Drill site
Stored water
Drinking waterSteel casing and cement
BoreholeWhat does shale gas look like? TECHNOLOGY
Hydraulic fracturing
Page 9April 9, 2012
http://news.nationalgeographic.com/news/energy/2010/10/101022-energy-marcellus-shale-gas-rush/
Horizontal drilling
Society for Risk Assessment / Boston University
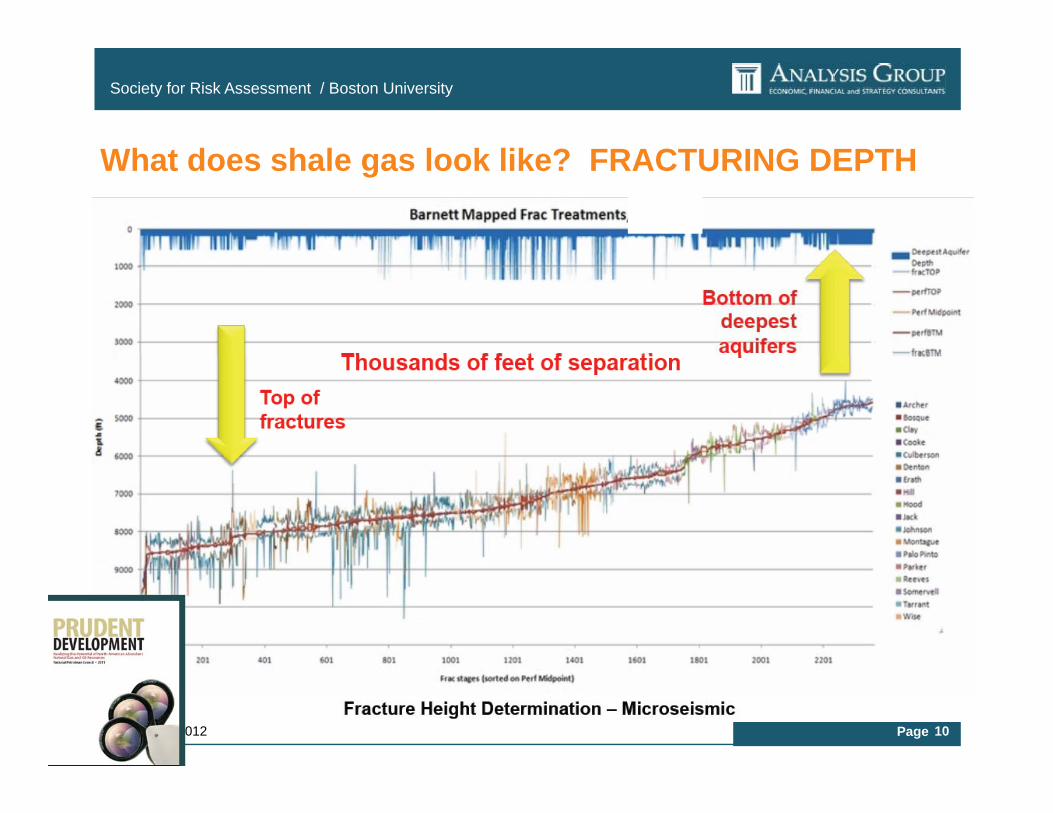
Wh t d h l l k lik ? FRACTURING DEPTHWhat does shale gas look like? FRACTURING DEPTH
Page 10April 9, 2012

Society for Risk Assessment / Boston University
What does shale gas look like? SURFACE ACTIVITIES
Page 11April 9, 2012
http://news.nationalgeographic.com/news/2010/10/photogalleries/101022-energy-shale-gas-drilling-pictures/#/energy-marcellus-shale-environment03-hallowich-dinner_27065_600x450.jpg

Society for Risk Assessment / Boston University
What does shale gas look like? ENVIRONMENTAL RISKSWhat does shale gas look like? ENVIRONMENTAL RISKS
Risks from past ti d
Page 12April 9, 2012
Phil Nguyen, Regulatory Options and Challenges in Hydraulic Fracturing, WISE, 2010
practices and events

Society for Risk Assessment / Boston University
What does shale gas look like? PRODUCTION GROWTHgPast decade…..
Marcellus
Shale plays
Marcellus
Page 13April 9, 2012 NPC, Prudent Development, 2011

Society for Risk Assessment / Boston University
What does shale gas look like? PRODUCTION GROWTHgPast decade ………… versus past two years
Page 14April 9, 2012 NPC, Prudent Development, 2011

Society for Risk Assessment / Boston University
What does shale gas look like?
3500
gPACE OF DEVELOPMENT
Marcellus shale gas permits issued and wells
2500
3000 drilled in Pennsylvania 2007 – 2011 (Dec)
1500
2000
500
1000
0
500
Permitted Drilled
Page 15April 9, 2012
Marcellus Shale Gas Commission, July 2011, Figures 22 and 23; http://www.dep.state.pa.us/dep/deputate/minres/oilgas/Marcellus%20Wells%20permitted-drilled%20NOVEMBER%202011.gif

Society for Risk Assessment / Boston University
What does shale gas look like? ATTENTION (+ and -)
Page 16April 9, 2012

Society for Risk Assessment / Boston University
Wh t d h l l k lik ? SUPPLY ESTIMATESWhat does shale gas look like? SUPPLY ESTIMATES 3500
ANGAChanging estimates of the U.S. natural gas resources* 1999-2011
2500
3000
ICF, PGC
EIA
TCF
2000
NPC EIA EIA EIANPC
PGC, MIT
1000
1500
PGC
PGC/ NPC
NPC
PGC
EIA
500
Page 17April 9, 2012
01999 2000 2003 2004 2005 2006 2007 2008 2009 2010 2011
* Technically recoverable The effect of a reduction in EIA’s Marcellus estimate from 410 Tcf to 84 Tcf (the new USGS estimate, up from 2 in 2002)

Society for Risk Assessment / Boston University
What does shale gas look like? LOWER GAS PRICES1.4
coal
1.0
1.2
0.6
0.8
Average delivered price of coal to electric utilities
gas
0.2
0.4
Average delivered price of coal to electric utilities
Average delivered price of coal to IPPs
Average price of natural gas to electric generators
0.02006 2007 2008 2009 2010
g p g g
S N t l i EIA htt // i /d / / i d ht
Page 18April 9, 2012
Source: Natural gas prices: EIA, http://www.eia.gov/dnav/ng/ng_pri_sum_dcu_nus_a.htm; Coal prices: William Watson, Nicholas Paduano, Tejasvi Raghuveer and Sundar Thapa, EIA, “U.S. Coal Supply and Demand: 2010 Year in Review,” June 1, 2011 (available at http://www.eia.gov/coal/review/pdf/feature10.pdf)

Society for Risk Assessment / Boston University
Natural gas prices – before shale gas……$14
U.S. Natural Gas Price History, 1976 to 2008
$10
$12
y,(Nominal Dollars)
$6
$8
$4
$6
$0
$2
Jan-1976 Jan-1981 Jan-1986 Jan-1991 Jan-1996 Jan-2001 Jan-2006 Jan-2011
Page 19April 9, 2012
Source: EIA, Wellhead prices through 1994. Henry Hub prices from 1995 – 2011

Society for Risk Assessment / Boston University
Natural gas prices – before shale gas……$14
U.S. Natural Gas Price History, 1976 to 2010
$10
$12
y,(Nominal Dollars)
$6
$8
$4
$6
$0
$2
Jan-1976 Jan-1981 Jan-1986 Jan-1991 Jan-1996 Jan-2001 Jan-2006 Jan-2011
Page 20April 9, 2012
Source: EIA, Wellhead prices through 1994. Henry Hub prices from 1995 – 2011

Society for Risk Assessment / Boston University
What does shale gas look like? LOWER GAS PRICES
201120122012
S N t l i EIA htt // i /d / / i d ht
Page 21April 9, 2012
Source: Natural gas prices: EIA, http://www.eia.gov/dnav/ng/ng_pri_sum_dcu_nus_a.htm; Coal prices: William Watson, Nicholas Paduano, Tejasvi Raghuveer and Sundar Thapa, EIA, “U.S. Coal Supply and Demand: 2010 Year in Review,” June 1, 2011 (available at http://www.eia.gov/coal/review/pdf/feature10.pdf)

Society for Risk Assessment / Boston University
What does shale gas look like? LOWER GAS PRICES
9
10 $/mcf 3-2008
3 20103-2009
What does shale gas look like? LOWER GAS PRICES
7
8
3-2011
3-20103-2007
5
6
3-2012
3-2011
2
3
4
0
1
2
Natural Gas Futures – Henry Hub
Page 22April 9, 2012
Jan-12 Jan-13 Jan-14 Jan-15 Jan-16 Jan-17 Jan-18 Jan-19 Jan-20

Society for Risk Assessment / Boston University Shale Gas: New Opportunities, New Challenges
Bipartisan Policy Center Energy Project
What does shale gas look like? MEETING DEMAND
40U.S. Energy Consumption by Sector - 2010
30
35 NuclearRenewableCoal
20
25
adril
lion
Btu
Natural GasOil
10
15
Qua
Feedstock
0
5 Feedstock
Page 23April 9, 2012
0
Residential Commercial Industrial Transportation ElectricSource: Bipartisan Policy Center Energy Project; U.S. Energy Information Administration, Annual Energy Outlook 2011.

Society for Risk Assessment / Boston University
What does shale gas look like? LOWER INPUT PRICESMeeting industrial demand (directly, indirectly)
Aluminum manufacturing cost structureTotal power production cost structure
Announcements by Dow Chemical, Shell, Williams Companies: new chemical facility investments
Aluminum manufacturing cost structure Total power production cost structure
Page 24April 9, 2012

Society for Risk Assessment / Boston University
What does shale gas look like? BOOST TO OUTPUT
Industrial d ddemand
Aluminum cost structure
Page 25April 9, 2012

Society for Risk Assessment / Boston University
What does shale gas look like? PRESSURE ON COAL PLANTS
U.S. Major Coal-Fired Power Plants
Page 26April 9, 2012Source: National Public Radio – http://www.npr.org/templates/story/story.php?storyId=110997398, based on information from: American Electric Power, American Wind Energy Association, Center for American Progress, Department of Energy, Edison Electric Institute, Energy Information Administration, Electric Power Research Institute, Federal Energy Regulatory Commission, National Renewable Energy Laboratory, Environmental Protection Agency, Western Resource Advocates

Society for Risk Assessment / Boston University
Impacts from electricity produced at coal power plantsImpacts from electricity produced at coal power plants
National Mortality Effects from Existing National Mortality Effects from Existing Power Plants (Annual Persons/100 000)Power Plants (Annual Persons/100 000)Power Plants (Annual Persons/100,000)Power Plants (Annual Persons/100,000)
< 3< 333--77
77--10101010--1414> 14> 14 14 14
Annual Mortality Due to Individual Annual Mortality Due to Individual Power Plants (Persons)Power Plants (Persons)
<25<252525--7575> 75> 75
Page 27April 9, 2012Clean Air Task Force, “Toll from Coal,” 2010 (Google Maps programs)

Society for Risk Assessment / Boston University
What does shale gas look like? ALTERNATIVES TO COALWhat does shale gas look like? ALTERNATIVES TO COALPower plants affected by EPA MATS Rule
Page 28April 9, 2012

Society for Risk Assessment / Boston University
Coal plant capacity –All coal plantsWithout emission controls, by state
12
All coal plants
8
10
6GW
4
Coal Units Without Emissions Controls(Total GW – 2009)
0
2
(Total GW 2009)
Page 29April 9, 2012
0
IL MI
OH
MO TX IN IA OK
TN AL KY PA NC
NE
WV SC GA VA WI
AR FL LA MS
MD NY
MN KS DE
CO MA
UT
MT CT ND NJ
CA WY
NV AZ ME
NH SD ID NM
Notes:[1] Totals do not include Alaska or Hawaii.[2] Units without emissions are those units without SCR or FGD systems.
Source: SNL data.

Society for Risk Assessment / Boston University 200810GW load 20GW load 25GW load
Coal: $31 7
Gas:$95 1ISO-NE
Oil$157.9
$31.7 $95.1
@20 GW load, gas price is3x coal @10GW load3 coa @ 0G oad
2010What it means for NE electricity consumers
Coal: Gas:Gas:$94.5
What it means for NE electricity consumers…..
$39.0Gas:$43.4
@20 GW load gas price is
Page 30April 9, 2012
@20 GW load, gas price is1.1x coal @10GW load
SNL Financial Data, accessed 3-1-2012

Society for Risk Assessment / Boston University
Page 31April 9, 2012
Society for Risk Assessment / Boston University
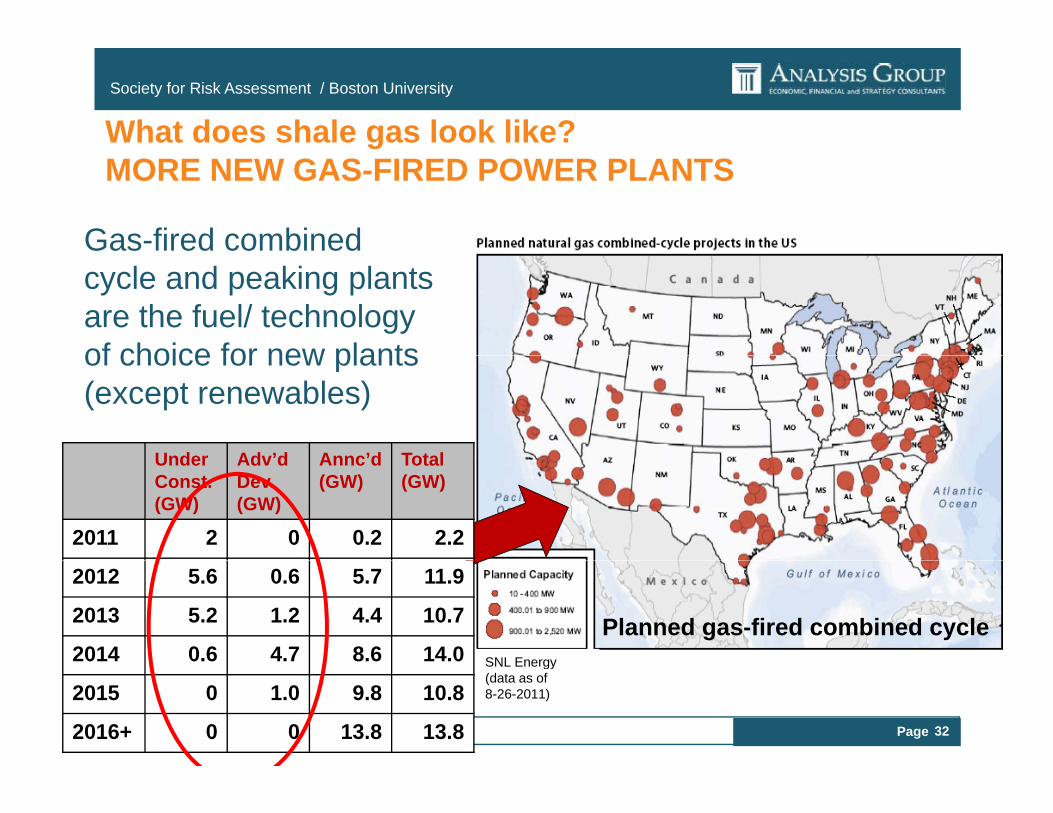
What does shale gas look like?MORE NEW GAS-FIRED POWER PLANTS
Gas-fired combined cycle and peaking plants are the fuel/ technology of choice for new plantsof choice for new plants (except renewables)
Under Adv’d Annc’d TotalUnder Const. (GW)
Adv dDev. (GW)
Annc d(GW)
Total (GW)
2011 2 0 0.2 2.2
SNL Energy
Planned gas-fired combined cycle
2012 5.6 0.6 5.7 11.9
2013 5.2 1.2 4.4 10.7
2014 0.6 4.7 8.6 14.0
Page 32April 9, 2012
SNL Energy (data as of 8-26-2011)2015 0 1.0 9.8 10.8
2016+ 0 0 13.8 13.8

Society for Risk Assessment / Boston University
Markets: Gas-fired plants are now the fuel/technology of choice
140.00
Natural gas prices:
100.00
120.00Natural gas prices:
Already putting pressure on many coal plants
Possible to sign long-term fuel contracts
60 00
80.00
40.00
60.00
0.00
20.00
Hydro Nuclear Coal Wind Solar Natural gas
Page 33April 9, 2012
Hydro Nuclear Coal Wind, Solar, Biomass
Natural gas
EIA, Annual Energy Outlook, 2011

Society for Risk Assessment / Boston University
More gas-powered generation aheadMore gas powered generation aheadISO-NE Interconnection Queue* (new generation projects)
60%
5 931 MWNatural gas prices:
40%
50%
5,931 MWAlready putting pressure on many coal plants, but also other technologies (renewables, nuclear)
Increasingly able to sign long-term fuel contracts,but may require alignment between capacity
30%
40% but may require alignment between capacity markets, firm transportation service, and other market rules
10%
20% 2,430 MW
10%
0%Gas Wind Hydro Solar Oil Biomass
1,163 MW
345 MW
Page 34April 9, 2012
-10%
* ISO-NE, “Active FERC” Queue, as of 2-1-2012 (does not include transmission projects or equipment replacement)

Society for Risk Assessment / Boston University
Gas will be needed even more as renewables ramp upGas will be needed even more as renewables ramp up
Significant increases in renewable energy needed in upcoming years
Colorado
energy needed in upcoming years to meet RPS requirements – with push and pull from gas market
conditions and operations Maryland
Pennsylvania
N Y k
New Jersey
Texas
2011
California
New York
Page 35April 9, 2012
http://www.emerging-energy.com/content/press-details/State-RPS-Policies-Will-Drive-250-Increase-in-Renewable-Energy-Generation-by-2025/32.aspx
2x 3x

Society for Risk Assessment / Boston University
OPPORTUNITIES ANDImplications for Massachusetts and the Region
OPPORTUNITIES AND CHALLENGES
Page 36April 9, 2012

Society for Risk Assessment / Boston University
A huge opportunity for U.S. energy markets
NPC report: “N. America’s natural gas resource base is enormous – with potential benefits to the economy, environment and energy security”y, gy y
Secretary of Energy Advisory Board report:
“extremely important for U.S. energy security, with potentially large economic impact on local communities and states” and well aslocal communities and states and well as benefits for customers of natural gas and electricity
Page 37April 9, 2012
Society for Risk Assessment / Boston University
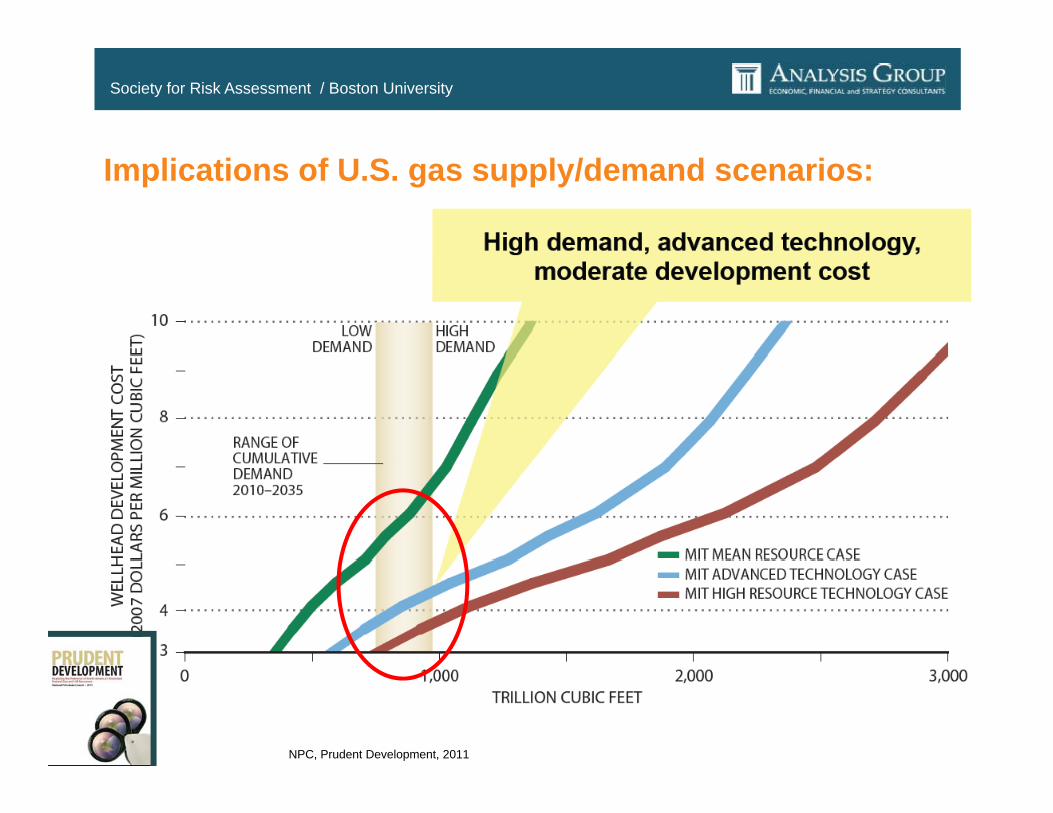
Implications of U.S. gas supply/demand scenarios:
Page 38April 9, 2012
NPC, Prudent Development, 2011

Society for Risk Assessment / Boston University
U S G d d tl k d i b tU.S. Gas demand outlooks – driven by power sector
Page 39April 9, 2012 NPC, Prudent Development, 2011

Society for Risk Assessment / Boston University
But this depends upon doing it right …..NPC report: ‘benefits depend on prudent development’
Everywhere, responsible practices are needed.
Regulators must evolve their requirements.
Such steps are necessary for public trust, protection of health, safety and the environment – and for maintaining access to the natural gas resources.maintaining access to the natural gas resources.
Page 40April 9, 2012

Society for Risk Assessment / Boston University
But this depends upon doing it right …..SEAB report: ‘genuine environmental urgency’
There are potentially serious environmental impacts.
These impacts need to be prevented, reduced and, h ibl li i t d iblwhere possible, eliminated as soon as possible.
Absent effective control, public opposition will grow, thus putting continued production at risk.thus putting continued production at risk.
Page 41April 9, 2012

Society for Risk Assessment / Boston University
SEAB’s “environmental urgency” related to shale gas:
Areas of concern:
Water – possible pollution of drinking water (methane, chemicals), water consumption, disposition/management of flow back waterdisposition/management of flow back water
Air pollution – GHG (methane), ozone precursors
Community disruption during shale gas production
Preservation of unique and/or sensitive areas
Cumulative adverse impacts (traffic, noise, visual, odors, intensity) on communities and ecosystems, wildlife
Page 42April 9, 2012
wildlife

Society for Risk Assessment / Boston University
Natural gas can help lower GHG emissions
Deep reductions require CCS or other zero-
Page 43April 9, 2012 NPC, Prudent Development, 2011
CCS or other zerocarbon technologies

Society for Risk Assessment / Boston University
GHG reductions …Depend on addressing methane emissions from gas….
120 0120
Comparison of NG and Coal Burnertip GHG Emissions in Recent LCAs
94.2
79.9
104.899.2 99.7 100.2 96.3
106.4101.9
107.4
80 0
100.0
120.0
80
100
120
u
MethaneUpstream CO2Fuel CO2
Natural Gas Coal
65.172.3
63.167.7 64.5
70.2
40 0
60.0
80.0
40
60
80
kg CO2e/M
MBtu
Variation in total footprint is largely due to
uncertainty
0 0
20.0
40.0
0
20
40k
in methane
0.00
DB 20
10
DB 20
11
Jaramillo
Barnett
Dom
estic
Conv Low
Conv High
Shale Low
Shale High
DB
Jaramillo
Dom
estic
PRB
Illinois #6
Surface
Und
ergrou
nd
DBCCA/WWINETL Howarth NETL Howarth
Page 44April 9, 2012
Source: Armond Cohen, Clean Air Task Force, “Natural Gas and Climate Bridge, Highway, or Destination?” EUEC presentation, 1-30-2012
Howarth Howarth
Society for Risk Assessment / Boston University
Shale gas – and energy marketsShale gas development provides opportunities for:
lower building heating costs than previously expected
lower power prices than previously expected – and less differential than in traditional coal regionsdifferential than in traditional coal regions
lower emissions profile of power plants in upwind regions
B tBut ….greater challenges with meeting renewables’ targets
greater need for integration of gas/electric market operations
increased attention by many players to the GHG from gas
Page 45April 9, 2012
increased attention by many players to the GHG from gas

Society for Risk Assessment / Boston University
Sue TierneyManaging PrincipalManaging PrincipalAnalysis Group111 Huntington Avenue, 10th Floor Boston, MA [email protected]
Page 46April 9, 2012