21, december tinggi field -analyzing the dhis · tinggi field - analyzing the ohis 141 shallow...
TRANSCRIPT

Geol. Soc. Malaysia Bulletin 21, December 1987; pp. 133 - 149
Tinggi field - analyzing the DHIs
HARUN MOHD. NOOR
Esso Production Malaysia Inc.
Abstract: The Tinggi field, which is in the Malay Basin, offshore Peninsular Malaysia, is a fully developed and producing field in Esso Production Malaysia Inc.' s production sharing contract area.
A detailed pre-development field study of the near surface for direct hydrocarbon indicators or Ollis and geohazards, using conventional seismic and high resolution sparker data, provided invaluable information that helped in the accident-free development of Tinggi which has numerous uneconomic but hazardous shallow gas sands. These sands also cause depth prediction problems for the underlying reservoirs. Seismic modelling of one gas DHI is discussed in detail. .
INTRODUCTION
During our exploration ofthe Malay Basin (Fig. 1), we have noted numerous shallow seismic anomalies which suggested the presence of underlying structural traps. These shallow anomalies have seldom turned out to be commercial reservoirs because of their depth
, and size. Also they are often low gas saturation accumulations .. However, their presence, which is well displayed on seismic data, gives rise to significant drilling hazards that need to be brought to the attention of drilling personnel. The Tinggi structure has a classic DHI (Direct Hydrocarbon Indicator) which was interpreted as a potential shallow gas hazard and also a DHI associated with the J -20 oil-water contact. This paper is a review of their impact in the discovery and the development of Tinggi field.
TINGGI FIELD
Tinggi field is located 260 km offshore from Kuala Terengganu (Fig. 2). The field is in the water depth of73 meters. The main reservoir in Tinggi field is J-18/20 sandstone (Fig. 3). It was seen as a lead in the 1974 seismic survey and subsequent delineation lines shot in 1978 confirmed the structure. The Tinggi discovery well was drilled in 1980. The results of the discovery well together with the structural and DHI interpretation obtained from the 1980 seismic data, were sufficient for management to immediately recommend the construction and placement of a 32 conductor self-contained platform.
SEISMIC DATA
Figure 4 is a 1980 seismic line shot along the axis of the Tinggi structure. As can be seen, the Tinggi 'A' platform is located right above several DHIs. The prominent DHI is approximately 594 m below sea-level. The Tinggi discovery well is situated outside the shallow gas anomalies. It was positioned to intersect the interpreted hydrocarbon contact in the J-20 horizon. At that location, the well appear to be on the crest of the J-20 seismic horizon. However, the actual Tinggi field crest lies to the west of the well in an area seen as an apparent syncline due to the overlying low velocity gas sand. This gas sand causes the sag or time delay on the seismic section. A time sag correction was made when the depth structure map was constructed.
Presented at GSM Petroleum Geology Seminar 1985

CENOZOIC BASINS OLIGOCENE (37 MYBP) TO RECENT
~ 1 - 5KM
~ II1II ) lOKM
Fig. I The Malay Basin is a Terti ary Basin beneath the South China Sea. Combined with the Tha i Basin to the north, the basin is approx imately 1050 km long and 160 km wide.
z o o ...,

""--, / -',
PENINSULAR MALAYSIA CONTRACT AREA LOCATION MAP
/ -" .. . ' '. / -'" ~ ,~
/ '--,. '-/ ,~ ,. , / ,~
.' '" f "
! '-..,. I ' __ , ' -......
! -......, I _,
' -', I , .... ! i
! i ' i ! ,
. "-, I ~""" ""'" r , ----1 : . • I! r I
) I ilL, ~ / ,/ "--""'. ' L..__ i-~Yl' ) L~iI$_'"7-~ -~ Em ~
60 Km - - - - - - L _______ -, PULAI 2 -- I --- --------~ ----Kuala _-
Terengganu
100 km i
.. /' Fig, 2 Tinggi field location in EPMI's contract area,
::3 z ~ :!l g; I
;I> z » r ~ Z o -I ::c trJ
~ -CI>
-y.) VI

LEGEND: • J -16/17 OIL COMPLETION
2m J -16/17 GAS INJECTOR
® K -20/30 OIL COMPLETION
"* EXPLORATION WELL
@ J -18/20 OIL COMPLETION <::> PLATFORM
-,.w-~~
"F}iJ
CONTOUR INTERVAL=20m
1km
TINGGI FIELD STRUCTURE: J 18/20 SEISMIC HORIZON
Fig.3 Depth structure map of the J-18/20 seismic horizon.
:I: '" 2 ::l
3:: o :r po Z o ~

UJ 0 Z 0 u w UJ
~ W 2 i=
A SOUTHEAST
1.n 1 •• _i1!'I"'> ""'I!JI>'I~~~ .. ~lrt·. ;.·-I:-""::.I1- -', '~:a·~·:I!·--~.:"I-~.~r_·;-i·.~~.~-i~~.~~I·~~=
J-20
',5
1"5 KM
Fig.4 The 1980 se ismic l ine MSOA- I72 shot along the ax is ofTingg i fi eld showing the obv ious shall ow gas DHI at 0.7 sec ancl the se ismic sag caused by the overl ying low ve locity gas sand . 48 fold 96 trace.
::l z ()
g :!l rn r 0
» z » r -< !::! z () ..., :r: rn
CJ :5 til
W -....J

138 HARUN MoHO. NooR
SAG CORRECTION
The real syncline is not affected by overlying gas. However, to determine the crestal position, the J -20 seismic horizon was projected from the flanks of the structure as if there was no overlying gas and a correction of up to 50 msec. was made. Incidently, Tinggi A-I, the fIrst well drilled from the platform at a crestal position, encountered the reservoir sand within half a meter of the predicted pre-drill depth which had been adjusted by 50 meters for the sag correction.
Despite the signifIcant sag on the seismic section caused by the presence of the overl ying shallow gas sands, most of the wells encountered the reservoir sandstones close to the predicted depths.
PLATFORM LOCATION
The location of the Tinggi 'A' platform was planned at a position which allows efficient drainage of all reservoirs. It was, however, recognised that a shallow hazard did exist and most of the wells drilled from the platform would have to penetrate this potential drilling hazard. A site survey was conducted to provide additional information on the shallow anomalies at the proposed platform location. It has always been our practice to analyse any possible shallow hazard and, if it appears real, to bring to the attention of our drilling personnel prior to the spudding of each exploration well or the fIrst development well drilled from the platform. The analysis of the site survey data is particularly important at Tinggi fIeld to study near-surface strata.
Figure 5 shows a detailed sparker survey data which was shot in the southwest/northeast direction through the site of the proposed Tinggi 'A' platform location. The data was interpreted for additional information on shallow hazards. There is a shallow channel that lies at 0.22 second. As you may notice, a high amplitude event which possibly associated with gas sandstone truncates against the edge of the channel. However, the channel was found not to be a hazard upon drilling. The obvious gas anomaly lies at 0.7 second which is 594 meters below sea-level. Its presence at such a shallow depth could pose a potential danger if proper drilling procedures were not taken.
To minimize the risk of drilling through this anomaly, several precautionary measures were taken. They were:
1. The potential hazards were reviewed to the engineering personnel prior to platform installation.
2. Drilling, casing and mud programs for the development wells were designed to control gas influx.
3. Drilling personnel were alerted to the problems that could be encountered when drilling through the gas section.
4. Well control procedures were rehearsed, and fIre and platform abandonment drills held so that the personnel onboard the platform would be ready to react in any case of emergencies.
5. Non-essential personnel were evacuated from the platform prior to drilling into the gas sand.
6. Drilling was done only in the day.

Fig. 5 A elelai leel sparker survey elaia show ing an obv ious shallow gas DI-II al 0.7 sec . Li ne 9 24 folel 24 Irace eligi lal sparker elma.
140 HARUN MOHO. NooR
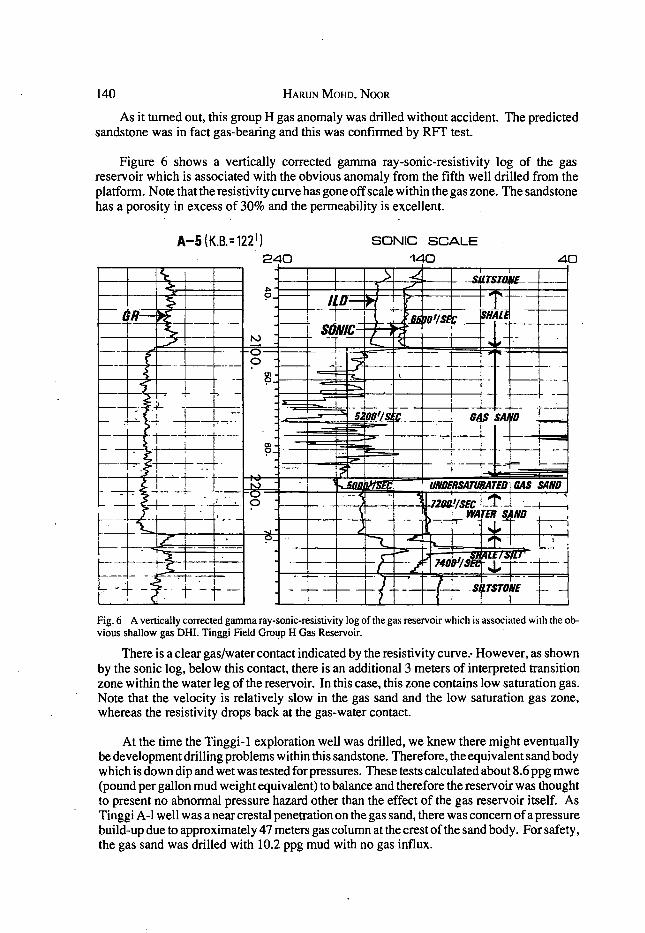
As it turned out, this group H gas anomaly was drilled without accident. The predicted sandstone was in fact gas-bearing and this was confirmed by RFT test.
Figure 6 shows a vertically corrected gamma ray-sonic-resistivity log of the gas reservoir which is associated with the obvious anomaly from the fifth well drilled from the platform. Note that the resistivity curve has gone off scale within the gas zone. The sandstone has a porosity in excess of 30% and the permeability is excellent.
A-5 (K.B.=1221)
240
SONIC SCALE
140
Fig. 6 A vertically corrected gamma ray-soDie-resistivity log of the gas reservoir which is associated with the obvious shallow gas Dill. Tinggi Field Group H Gas Reservoir.
There is a clear gas/water contact indicated by the resistivity curve." However, as shown by the sonic log, below this contact, there is an additional 3 meters of interpreted transition zone within the water leg of the reservoir. In this case, this zone contains low saturation gas. Note that the velocity is relatively slow in the gas sand and the low saturation gas zone, whereas the resistivity drops back at the gas-water contact.
At the time the Tinggi-1 exploration well was drilled, we knew there might eventually be development drilling problems within this sandstone. Therefore, the equivalent sand body which is down dip and wet was tested for pressures. These tests calculated about 8.6 ppg mwe (pound per gallon mud weight equivalent) to balance and therefore the reservoir was thought to present no abnormal pressure hazard other than the effect of the gas reservoir itself. As Tinggi A-I well was a near crestal penetration on the gas sand, there was concern of a pressure build-up due to approximately 47 meters gas column at the crest of the sand body. For safety, the gas sand was drilled with 10.2 ppg mud with no gas influx.

TINGGI FIELD - ANALYZING THE OHIs 141
SHALLOW GAS-SAND MODEL
We have used the log values for the interval velocities of the shale, gas sand and the water sand to calculate reflective coefficients for the gas-sand model. A synthetic seismogram was constructed from the data obtained from the A-5 well. Figure 7 shows the responses to the different lithologies and fluid contents, and the resulting wave configuration. Figure 8 shows the synthetic seismogram that was constructed from A-5 well data which ties quite well with the actual seismic data that was shot at Tinggi A-I well location.
REFLECTION COEFFICIENT MODEL
Using sonic and density values from logs, reflective coefficients were calculated. Figure 9 shows the upper shale/sand contact changes from +2% within the water leg to -20% between the shale and gas sand. The base of the sand is a rather weak reflector of +6%, possibly even lower, which changes to +27% where this underlying silty shale would impinge against the gas sand. The gas/water contact also has a high reflective index of +21 %. Note that the top. of the sand body is 594 meters below sea-level.
Figure 10 shows the seismic reflection derived from the reflection coefficient model. Strong amplitude is observed between shale/gas and gas/water contacts as predicted by the model. If we compare the seismic reflection model (figure 10) and the gas OHI shown on figure 11, the shape, the amplitudes and the polarity of the seismic model match very well. As you may notice on figure 11, the gas-water contact reflector slightly bow-downward on both sides which is due to increasing gas column. In the central part of the model, there is a slight bow-upward of the reflector at the base of gas sandstone which is due to the impingement of the underlying silty shale.
J-20 OIL-WATER CONTACT OHI
Figure 12 shows the OHI, plus some other gas sandstones causing the J-20 oil-water contact reflector to bow downward in time even though the actual contact is flat.
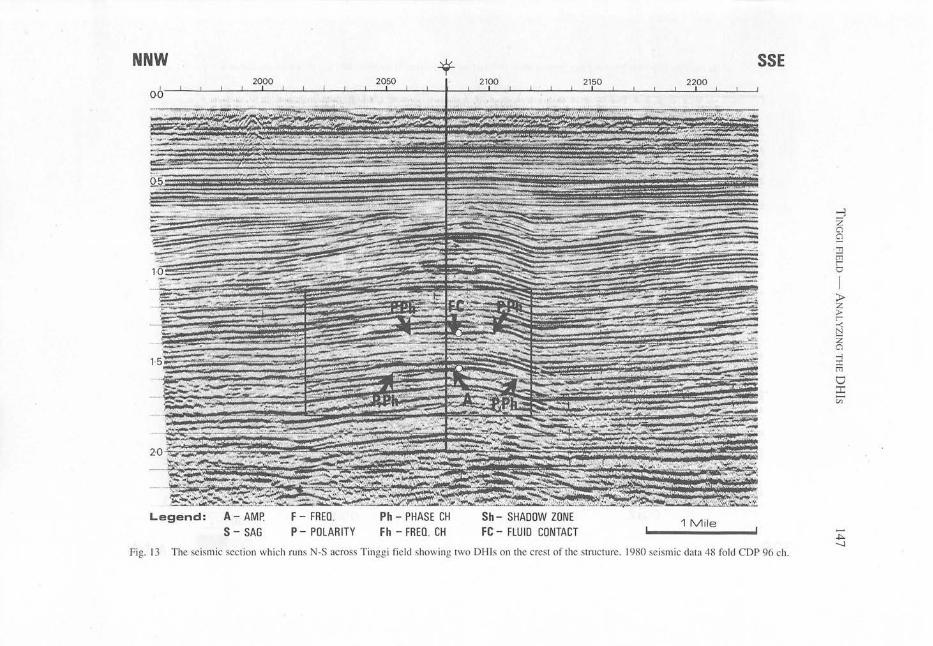
Figure 13 shows the seismic section which runs approximately N-S across the Tinggi field through the Tinggi-l well. Note the two OHIs that occur atthe crest of the structure. The blown-up section of the boxed area as shown on Figure 14 illustrates the details of these two OHIs. Prior to drilling on this prospect, the upper flat lying event was interpreted to be a possible hydrocarbon fluid contact. The limits of this anomalous event are marked by apparent polarity reversals and phase shifts.
The lower anomaly is distinguished from the surrounding reflections by its high amplitude and limited lateral extent. Its edges are marked by polarity reversals and phase shifts. This lower event was also interpreted to be due to the presence of hydrocarbons.
Tinggi 1 encountered 9 meters of gas and 55 meters of oil on water in a thick sandstone unit with an oil-water contact that corresponds to the upper OHI. The velocity survey results and the synthetic seismogram from the well confirm this. About 24 meters of oil-bearing sandstones were found to be associated with the lower OHI. Using the lateral extent of these
• OHIs, the positive correlations between them and the proven hydrocarbon contacts seen in

TIME DENS! fY
0 .0
so . 0
100 .0
150 . 0
c c c
SON I C W N
C C C . C C
c <>
VELOC TTY
TINGGI A-5 35HZ IN-PULSE
;, :,
g] Reous r!c !MPEDRNCt:
g c c
RE F COEFF RESUL rRN r c
'" <>
DEPrH
0 . 0
200.0 ~ l~ I >~ ~ h I =f I 2JSSSZ£Lpi ~ .oo.o
!~U :iJ ___ -L _____ 1-____ --' _____ -.-l _____ --.L ______ ----'
Fi g. 7 A synthetic seismogram was constructed rrom the T inggi A-5 we ll data.
.j:>. IV
::r: ~ ..., c: ::l
$: o g: z o o ...,

NW BE 17 16 15 14 13 12 11 10 5 4 3 2
227 T
en O· 0 Z 0 U w en Z
,.0 I! I I ! I IIIIII I II r nq q V,'.·<SSSs,q{{{CS\U);!llll I IIlllll '«q 'CI C{( 1(([ I {[ (11 [J II" \Sus B\\\ \( ISSJ II ,,\1\ U\Lo)) " LCurcccrrrlJ ({ rr If (rr r I" In 1111 \ SS If) If
O'5KM
Fig. 8 The constructed synthetic seismogram ties well with the actual seismic data. Line 20 24 fold 24 trace digital sparker data.
::l z 0 9 ::!l tn r-0
I ;I> z > r--< N Z 0 -l :I: tn I:) ::c -til
~ w

144 Harun Mohd. Noor
REFLECTION COEFFICIENTS __ -......::~._.- 1950' (594m) SUBSEA
........... ~""2~j WATER SAND
. ~",,60{0' ~
VELOCITY
SHALE 6500' (1980m)
GAS SAND 5200' (1585m)
WATER SAND 7200' (2195m)
SHALE/SILT 7400' (2255m)
DENSITY
2·16
1·80
2'01
2'19
R.C. = V2P2- V1Pl V2P2+Vl PI
V = Velocity P = Density
Fig. l) Reflective coefficients of gas-sand model were calculated using sonic and density values from logs. Tinggi Field Group H Gas Reservoir. .
en o z o u m ,
0'5-
0'6-
0'7-
~ 0'8-
i=
SEISMIC MODEL
Fig. 10. The shallow gas reserVoir seismic reflection was derived from the reflective coefficient model. Tinggi Field Group H Gas Reservoir. .

sw NE 18
o·s
.mt.ff!f~iI~_lWffffif{l.m~l~?~~~a{ __
'.0 1IIIIIIIIIIllllmHmmmmIIHfIIlHllm!!t!I!!WI~nmtmUWml!mmlHmmmnnummummmm}}})RmmmmliiU{{~ O·5KM
Fig. II Comparison between seismic reflection (Fig. 10) and gas DHI shows the shape, amplitude and polarity of the seismic model tie very well. Line 10 24 fold 24 trace digital sparker data.
::3 z 0 9 ::!l m r-0
I > z > r-oo(
t:::! z 0 ~ :c m 0 ::t -'"
~ Ul

(J) 0 z 0 1·0
U W (J)
~ J -20
W 1·5
2 ~
1"5 KM
Fig. 12 The overl ying sha llow gas sandstones calise the J-20 seismic hori zon and J-20 o il-water contact DHI to bow downward in ti me. 48 fold 96 trace.
.j::> 0\
::r:: $:>:> .., c: :l
s: 0 ::r ~ Z 0 0 ..,
NNW
Legend: A - AMP. F - FRED. S - SAG P - POLARITY
*
Ph - PHASE CH Fh - FRED. CH
Sh - SHADOW ZONE Fe - FLUID CONTACT
SSE
1 M ile
Fig. 13 The seismic sec tion which ru ns N-S across Tingg i fi e ld showing two D!-lI s on the crest of the structure. 1980 seismic dara 48 fo ld CDP 96 ch.
::l z o o ::!l m r-
" :» z » r-< N Z o -l :r: m
o ::s en
.j::>. ---.J

NNW "GAS SSE
c::J Oil 2( 50 2100
T~):'t((((, :',,> ))j ))' '«()1~~ i~~\ l(~~~>fJ ~;~~\\\m)!l)I)~ {~l ~~))I mll, t}; ~): ~j lIi.(~W ~t&j I~??~~~ ;\( :(~
,)\ I): ))(~ m))'~
'(~ Ilil 1!~ (( « ~(~ t~~\ •
((
Legend:
A- AMP F - FREG. Ph - PHASE CH Sh - SHADOW ZONE o·s MILE
S - SAG P- POLARITY Fh - FREn . CH Fe - FLUID CONTACT
Fig. 1-1 A blown-up sec tion oi' the same se ismic data showing the DHls in more detai Is. 1980 se ism ic data 4X rold COP 96 ch.
-Po 00
z o o ...,

TINGGI FIELD - ANALYZING THE DHIs 149
the discovery well and the seismic structure map. the fluid limits for the field were outlined without requiring any additional delineation wells. This enabled management to have confidence in the interpretation to make the decision to develop the field after only one exploration well.
CONCLUSION
Despite the. occurrence of sag on the crest caused by the overlying shallow gas sands. the Tinggi field was successfully recognised and developed. It has been know for some time that Dms associated w~th oil~water contact do exist in the Malay Basin. The interpretation of this event was used to predict the fluid extent of Tinggi field. The Tinggi field was EPMI' s first field developed on the basis of only one exploration well.
ACKNOWLEDGEMENT
The author would like to thank Esso Production Malaysia Incorporated (EPMI) and Petroliam Nasional Berhad (PETRONAS) for their consent to publish this paper.
Manuscript received 24 March 1987.
Revised manuscript received 13 October 1987.