shake table testing of a large scale two span r-c bridge univ. of washington *pi: marc eberhard...
TRANSCRIPT
Shake Table Testing of a Large Scale Two Span R-C Bridge
Univ. of Washington*PI: Marc EberhardCo-PI: Pedro ArduinoCo-PI: Steven KramerRA: Tyler Ranf
Univ. of Nevada, Reno*PI: M. “Saiid” SaiidiCo-PI: David SandersRA: Nathan Johnson
Overall project PI: Sharon Wood, Univ. Texas, Austin

Outline
• Background information
• Basics of the design
• Construction and assembly
• Instrumentation and test schedule
• Experimental observations/results
• Analytical modeling
• Future work

Prototype Bridge Frame• Continuous CIP post-tensioned RC box girder.
• 120 ft span lengths.
• 4 ft circular columns, fixed-fixed.
• Varied column heights.
• Drilled shafts (pile extension as opposed to pile cap).
• Axial load index = 0.08.

Shake Table Tests• 0.25 linear scale (12in dia. Columns)• Columns fixed at pile point of maximum
curvature
• Column heights of 5ft, 8ft & 6ft• Input motions: soil motion at pile immediately below plastic hinge• Concentrate on column response and interaction in global system
Mult
Mult
V
linear soil pressure
Hclear
Hcol
Ground
Mult
Mult

Basics of the Design– Columns: NCHRP 12-49 / Caltrans
• Long. steel ratio = 1.56%
• Lateral steel ratio = 0.86%
– Joints not modeled in detail– Superstructure not modeled in detail
• Convert prototype into equivalent specimen solid section
90in [2286mm]14in [356mm]
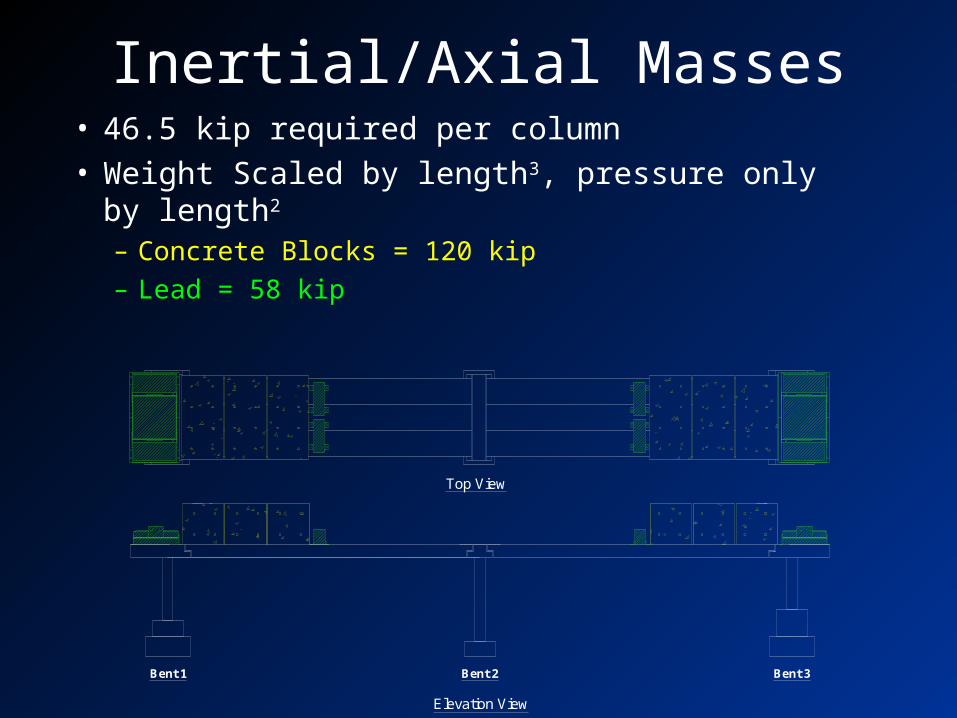
Inertial/Axial Masses• 46.5 kip required per column• Weight Scaled by length3, pressure only by length2
– Concrete Blocks = 120 kip
– Lead = 58 kip
Bent 1 Bent 2
Elevation View
Top View
Bent 3
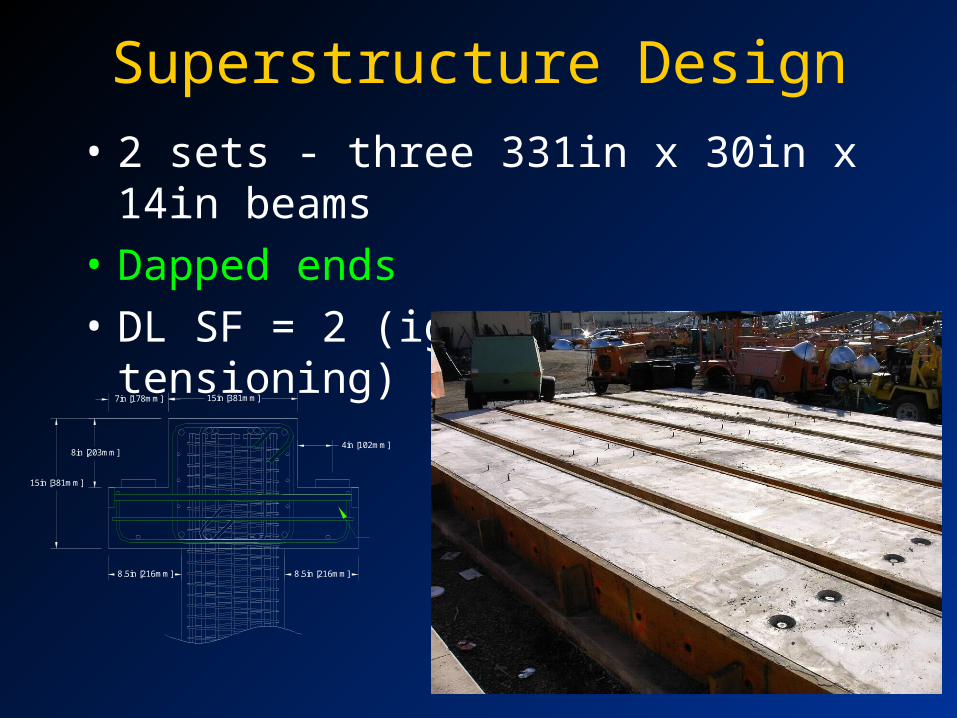
Superstructure Design
• 2 sets - three 331in x 30in x 14in beams
• Dapped ends
• DL SF = 2 (ignore post-tensioning)
8.5in [216mm]8.5in [216mm]
4in [102mm]
15in [381mm]
8in [203mm]
7in [178mm] 15in [381mm]

Post-Tensioning• Longitudinal System
– Prevent cracking in superstructure• Transverse System
– Maintain beam continuity (90in x 14in)– Clamping force to prevent beam separation
caused by transverse lateral moment • Mass to deck• Footings to tables

ConstructionAA
BB CC
DD EE FF

Assembly• 11 pieces cast separately on and off-site• Grouted / Post tensioned together• Imposed mass added
AA BB CC
DD EE FF
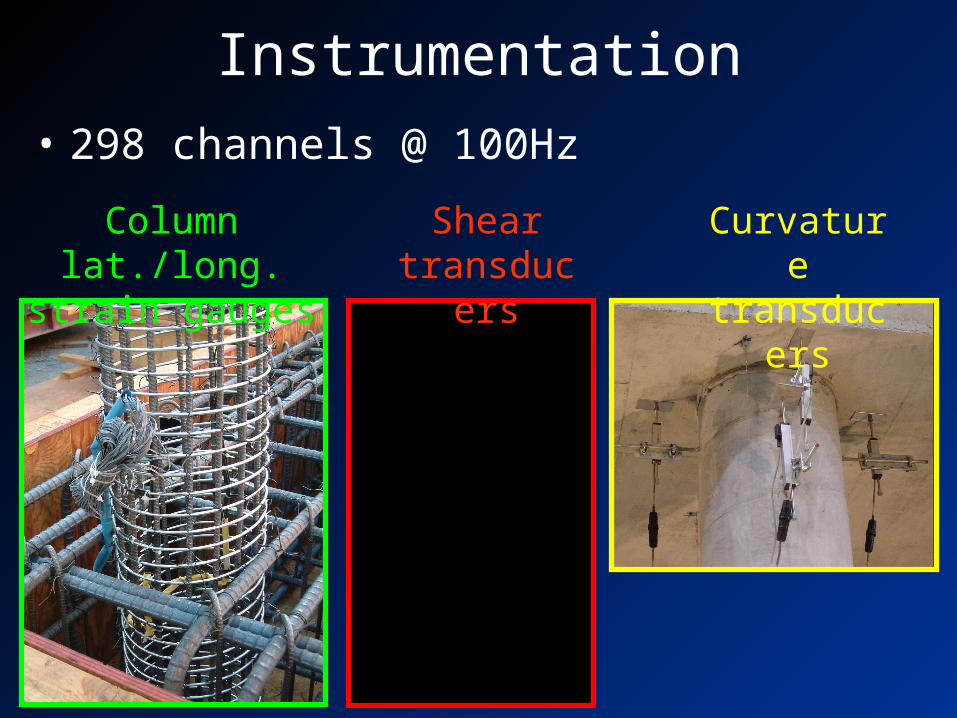
Instrumentation
• 298 channels @ 100Hz
Column lat./long. strain gauges
Shear transducers
Curvature transducers

• Accelerometers
• TransducersNOTES:
= Out of PlaneMeasurement
= DisplacementMeasurementDirection
Bent 1 Bent 2 Bent 3
Top View
Elevation View
NOTES:
= Out of PlaneMeasurement
= AccelerationMeasurementDirection
Bent 3Bent 2Bent 1
Elevation View
Top View
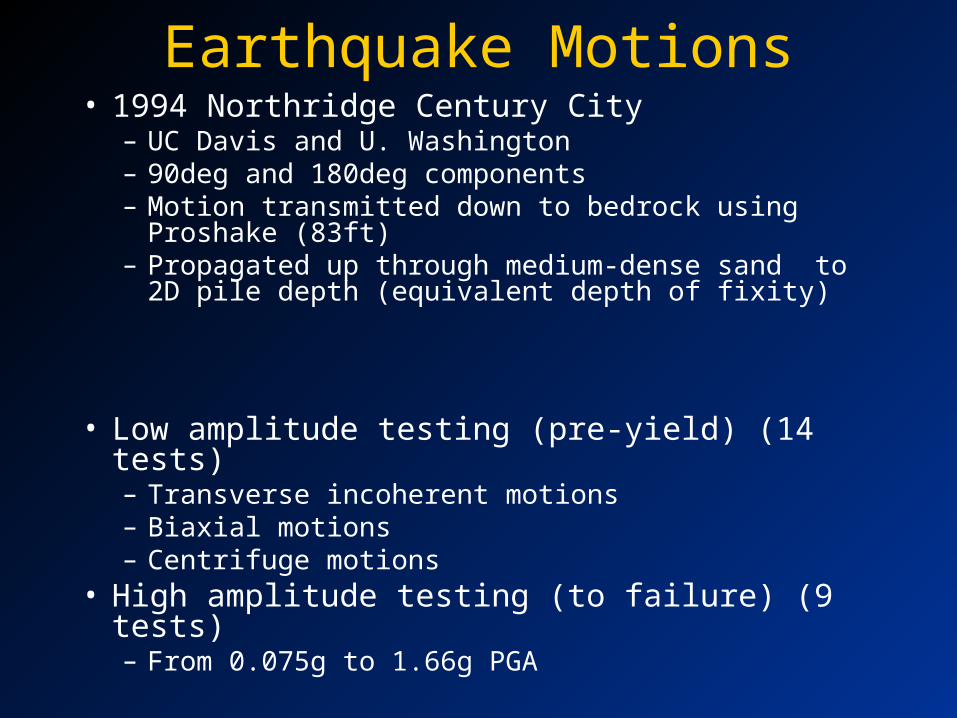
Earthquake Motions• 1994 Northridge Century City
– UC Davis and U. Washington– 90deg and 180deg components– Motion transmitted down to bedrock using Proshake
(83ft)– Propagated up through medium-dense sand to 2D pile
depth (equivalent depth of fixity)
• Low amplitude testing (pre-yield) (14 tests)– Transverse incoherent motions– Biaxial motions– Centrifuge motions
• High amplitude testing (to failure) (9 tests)– From 0.075g to 1.66g PGA
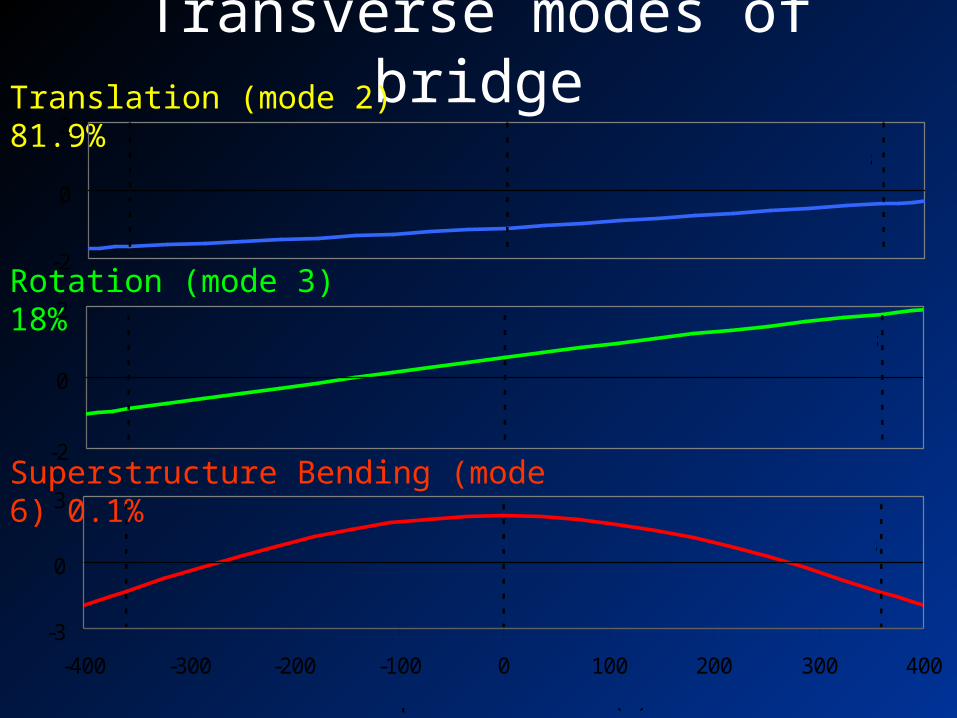
Transverse modes of bridgeTranslation (mode 2) 81.9%
Rotation (mode 3) 18%
Superstructure Bending (mode 6) 0.1%
-2
0
2
Bent 1 Bent 3Bent 2
-2
0
2Bent 1 Bent 3Bent 2
-3
0
3
-400 -300 -200 -100 0 100 200 300 400
Superstructure Location (in)
Bent 1 Bent 3Bent 2

High Amplitude Spectra
0
2
4
6
8
0 0.25 0.5 0.75 1
Period (seconds)
Acc
eler
atio
n (g
)
Motion 1, 0.075g to 1.66g PGA
mode2
mode3
mode6
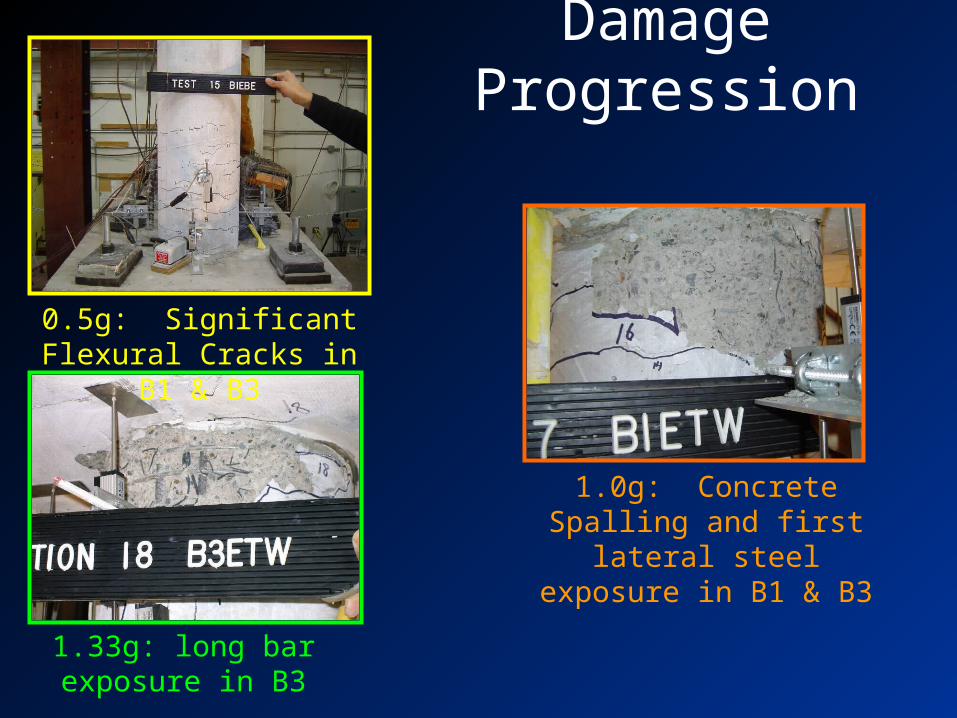
Damage Progression
0.5g: Significant Flexural Cracks in B1 & B3
1.0g: Concrete Spalling and first lateral steel exposure in
B1 & B3
1.33g: long bar exposure in B3

Damage Progression
1.33g: First lateral steel exposure in B2
1.66g (failure): four spirals fractured, 36 buckled long. bars

Failure test (1.66 PGA)
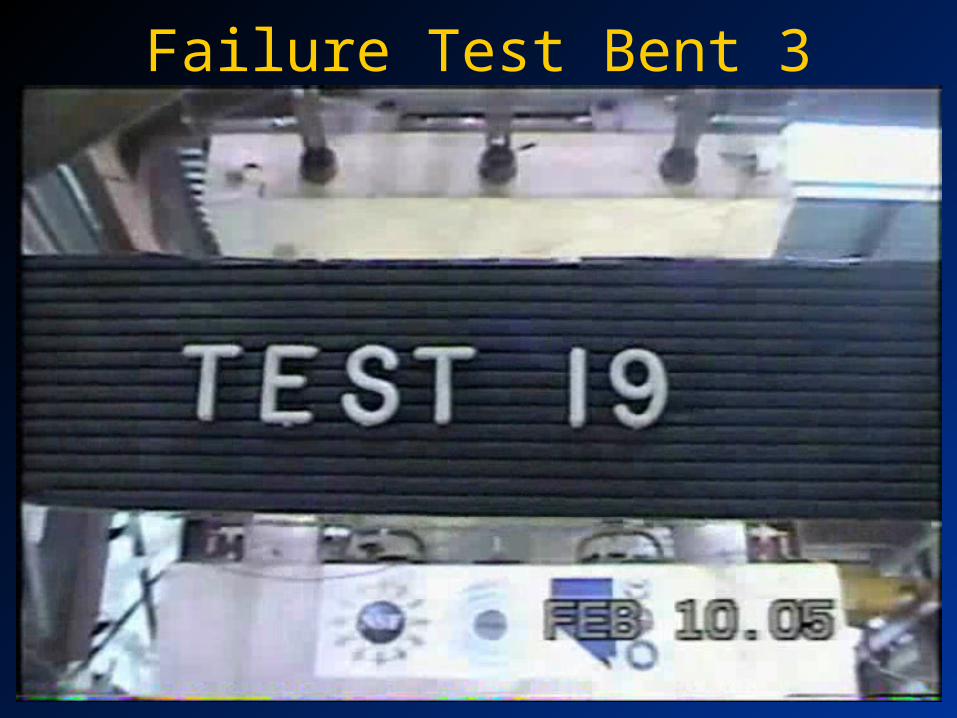
Failure Test Bent 3
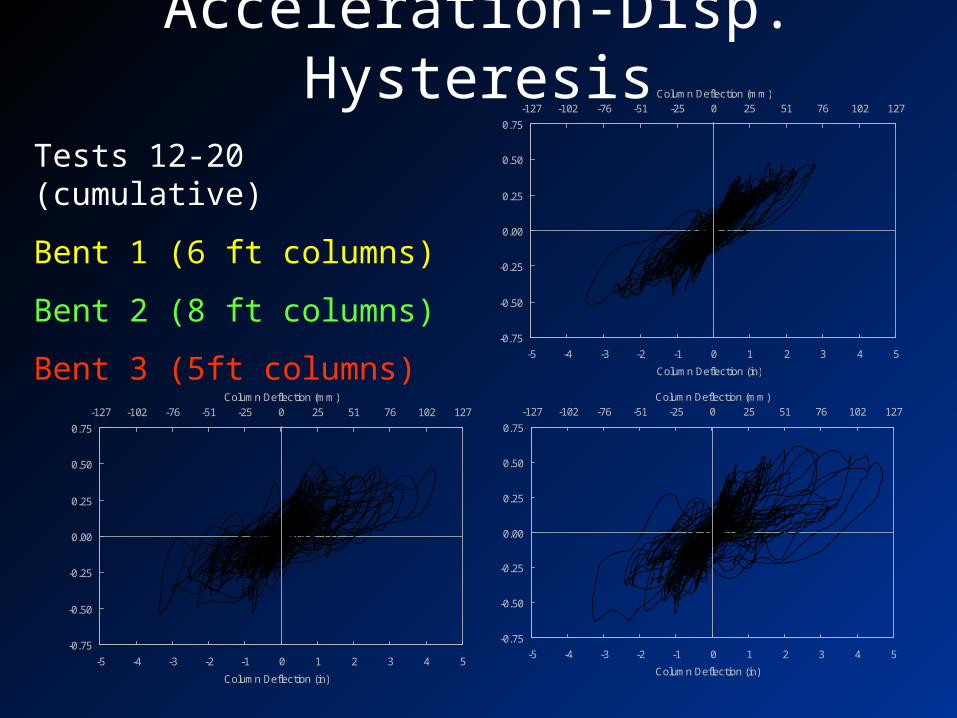
Acceleration-Disp. Hysteresis
-0.75
-0.50
-0.25
0.00
0.25
0.50
0.75
-5 -4 -3 -2 -1 0 1 2 3 4 5
Column Deflection (in)
-127 -102 -76 -51 -25 0 25 51 76 102 127Column Deflection (mm)
Sup
erst
ruct
ure
Acc
eler
atio
n (g
)
-0.75
-0.50
-0.25
0.00
0.25
0.50
0.75
-5 -4 -3 -2 -1 0 1 2 3 4 5
Column Deflection (in)
-127 -102 -76 -51 -25 0 25 51 76 102 127Column Deflection (mm)
Sup
erst
ruct
ure
Acc
eler
atio
n (g
)
-0.75
-0.50
-0.25
0.00
0.25
0.50
0.75
-5 -4 -3 -2 -1 0 1 2 3 4 5
Column Deflection (in)
-127 -102 -76 -51 -25 0 25 51 76 102 127Column Deflection (mm)
Sup
erst
ruct
ure
Acc
eler
atio
n (g
)
Tests 12-20 (cumulative)
Bent 1 (6 ft columns)
Bent 2 (8 ft columns)
Bent 3 (5ft columns)

Displacement Ductility
-0.75
-0.50
-0.25
0.00
0.25
0.50
0.75
-5 -4 -3 -2 -1 0 1 2 3 4 5
Column Deflection (in)
-127 -102 -76 -51 -25 0 25 51 76 102 127Column Deflection (mm)
Supe
rstru
ctur
e Ac
cele
ratio
n (g
)
Test Bent 1 Bent 2 Bent 3
12 0.35 0.21 0.2113 0.96 0.52 0.5214 1.14 0.68 0.8315 2.37 1.53 2.4516 3.98 2.81 3.1617 2.99 2.38 2.3918 4.20 4.12 5.5419 5.33 5.22 7.9020 3.40 3.77 5.84
displacement ductility

Test 19 animation 2.5-17.5sec 1x timescale

Test 19 animation 5-7.5sec 0.2x timescale

Test 14 Achieved Table Motions
-0.4
-0.2
0
0.2
0.4
0 1 2 3 4 5 6 7 8 9 10
Time (sec)
target
Ta
rge
t A
cc
ele
rati
on
(g
)
-0.4
-0.2
0
0.2
0.4
0 1 2 3 4 5 6 7 8 9 10
Time (sec)
Table 1Table 2Table 3
Ac
hie
ve
d A
cc
ele
rati
on
(g
)
-2
-1
0
1
2
0 1 2 3 4 5 6 7 8 9 10
Time (sec)
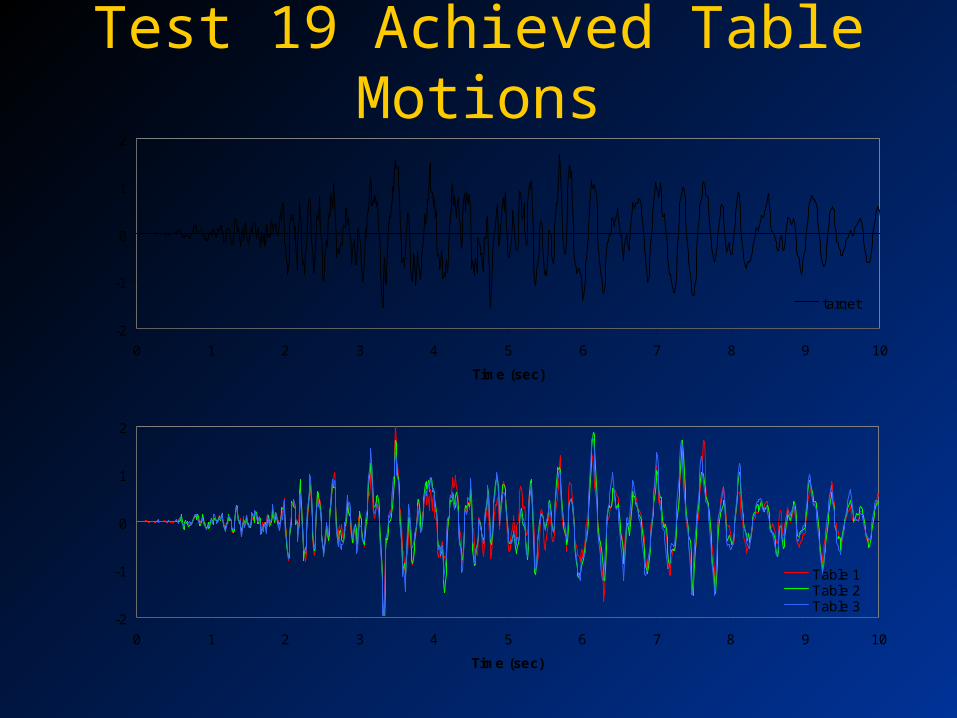
target
Ta
rge
t A
cc
ele
rati
on
(g
)
-2
-1
0
1
2
0 1 2 3 4 5 6 7 8 9 10
Time (sec)
Table 1Table 2Table 3A
ch
iev
ed
Ac
ce
lera
tio
n (
g)
Test 19 Achieved Table Motions
Data Processing
• Structural data: displacement, acceleration, strain, curvature, shear
• Shake table motions– Accelerations, displacements, spectra
• Videos, photos
• Correlation of force with acceleration• Extract force from shake tables for select
runs

SAP 2000 Modeling(work in progress)
• Expansion of model used for design / pre-analysis– Moment-rotation hinges Nonlinear fiber hinges
• Model efficiency– Study the effect of fiber and element configurations
• Model parameters– Material models– Input motions– Time-step / integration
• Verification/calibration of model– Compare accelerations and displacements from shake table
tests– Compare with Drain-3DX
• Utilize model to focus on system response
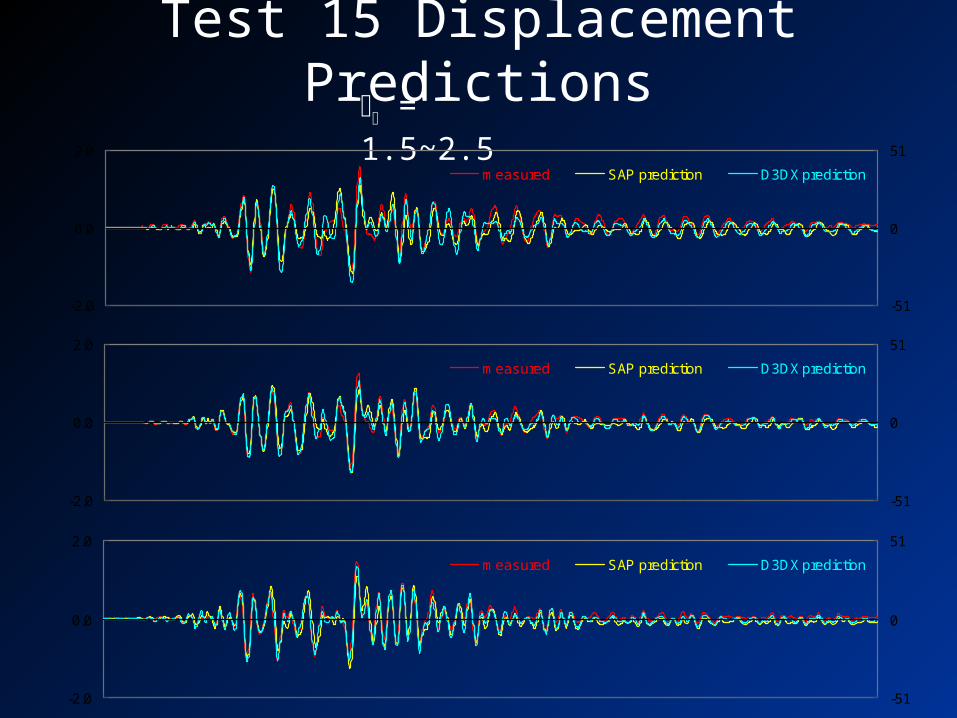
Test 15 Displacement Predictions = 1.5~2.5
-2.0
0.0
2.0
-51
0
51
measured SAP prediction D3DX prediction
Ben
t 1
-2.0
0.0
2.0
-51
0
51
measured SAP prediction D3DX prediction
Ben
t 2
Def
lect
ion
(in)
Def
lect
ion
(mm
)
-2.0
0.0
2.0
-51
0
51
measured SAP prediction D3DX prediction
Ben
t 3
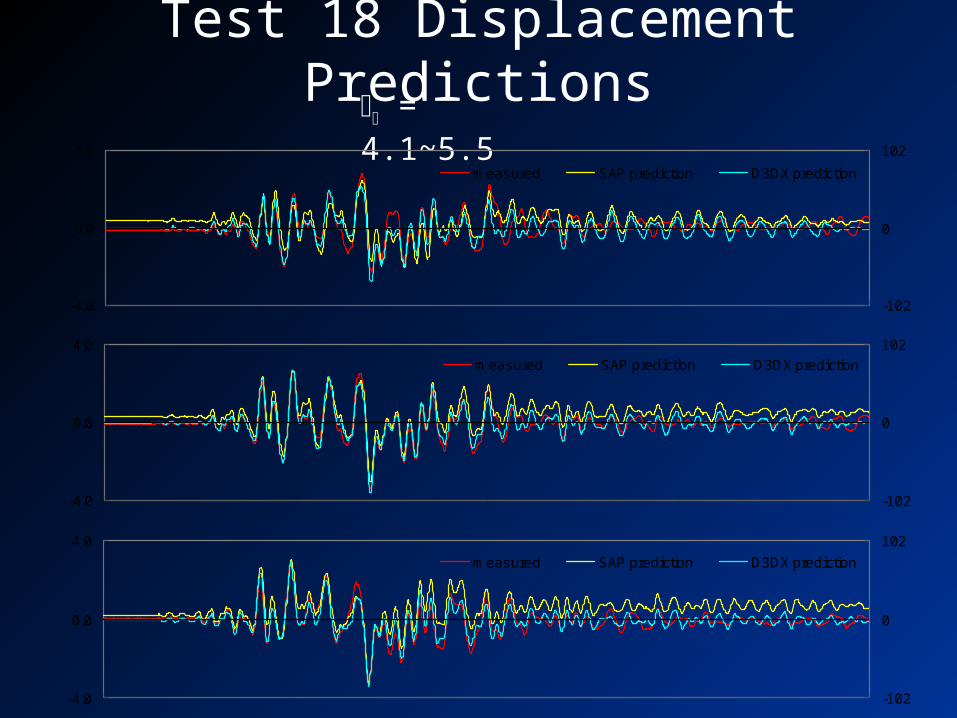
Test 18 Displacement Predictions = 4.1~5.5
-4.0
0.0
4.0
-102
0
102
measured SAP prediction D3DX prediction
Ben
t 1
-4.0
0.0
4.0
-102
0
102
measured SAP prediction D3DX prediction
Ben
t 2
Def
lect
ion
(in)
Def
lect
ion
(mm
)
-4.0
0.0
4.0
-102
0
102
measured SAP prediction D3DX prediction
Ben
t 3
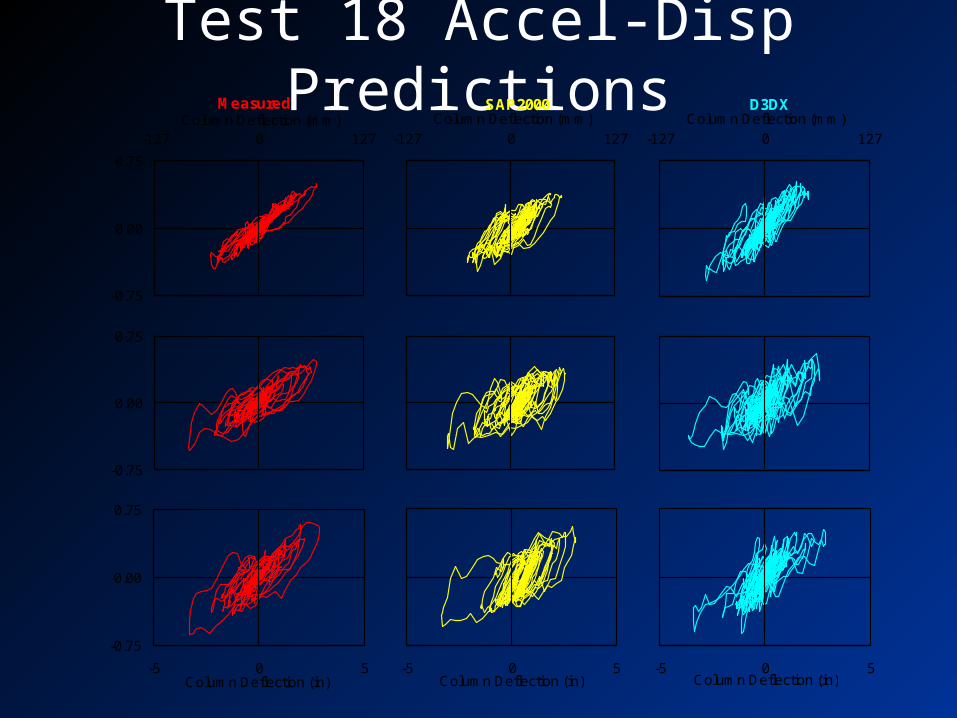
Test 18 Accel-Disp PredictionsMeasured
-0.75
0.00
0.75
-127 0 127Column Deflection (mm)
To
p A
cce
lera
tion
(g
)
Ben
t 1
SAP2000
-127 0 127
Column Deflection (mm)
-0.75
0.00
0.75
-5 0 5Column Deflection (in)
To
p A
cce
lera
tion
(g
)
Ben
t 3
D3DX
-127 0 127
Column Deflection (mm)
-0.75
0.00
0.75
To
p A
cce
lera
tion
(g
)
Ben
t 2
-5 0 5Column Deflection (in)
-5 0 5Column Deflection (in)

Future Work
• Complete calibration and verification of analytical model
• Investigation of system response utilizing experimental data and analytical model
• Expansions of computer model– More complete system – Earthquake loading including biaxial motions
