andrew jackson and eberhard e. fetz
TRANSCRIPT

98:3109-3118, 2007. First published Sep 12, 2007; doi:10.1152/jn.00569.2007 J NeurophysiolAndrew Jackson and Eberhard E. Fetz
You might find this additional information useful...
25 articles, 6 of which you can access free at: This article cites http://jn.physiology.org/cgi/content/full/98/5/3109#BIBL
2 other HighWire hosted articles: This article has been cited by
[PDF] [Full Text]
, November 12, 2008; 28 (46): 11830-11838. J. Neurosci.D. R. Kipke, W. Shain, G. Buzsaki, E. Fetz, J. M. Henderson, J. F. Hetke and G. Schalk
OpportunitiesAdvanced Neurotechnologies for Chronic Neural Interfaces: New Horizons and Clinical
[PDF] [Full Text] [Abstract], August 1, 2009; 102 (2): 1331-1339. J Neurophysiol
A. S. Dickey, A. Suminski, Y. Amit and N. G. Hatsopoulos Single-Unit Stability Using Chronically Implanted Multielectrode Arrays
including high-resolution figures, can be found at: Updated information and services http://jn.physiology.org/cgi/content/full/98/5/3109
can be found at: Journal of Neurophysiologyabout Additional material and information http://www.the-aps.org/publications/jn
This information is current as of December 7, 2009 .
http://www.the-aps.org/.American Physiological Society. ISSN: 0022-3077, ESSN: 1522-1598. Visit our website at (monthly) by the American Physiological Society, 9650 Rockville Pike, Bethesda MD 20814-3991. Copyright © 2005 by the
publishes original articles on the function of the nervous system. It is published 12 times a yearJournal of Neurophysiology
on Decem
ber 7, 2009 jn.physiology.org
Dow
nloaded from

Innovative Methodology
Compact Movable Microwire Array for Long-Term Chronic Unit Recordingin Cerebral Cortex of Primates
Andrew Jackson1 and Eberhard E. Fetz2
1School of Neurology, Neurobiology and Psychiatry, University of Newcastle, Newcastle-upon-Tyne, United Kingdom; and 2Departmentof Physiology and Biophysics and Washington National Primate Research Center, University of Washington, Seattle, Washington
Submitted 22 May 2007; accepted in final form 10 September 2007
Jackson A, Fetz EE. Compact movable microwire array for long-term chronic unit recording in cerebral cortex of primates. J Neuro-physiol 98: 3109–3118, 2007. First published September 12, 2007;doi:10.1152/jn.00569.2007. We describe a small, chronically implant-able microwire array for obtaining long-term unit recordings from thecortex of unrestrained nonhuman primates. After implantation, thedepth of microwires can be individually adjusted to maintain large-amplitude action potential recordings from single neurons over manymonths. We present data recorded from the primary motor cortex oftwo monkeys by autonomous on-board electronic circuitry. Wave-forms of individual neurons remained stable for recording periods ofseveral weeks during unrestrained behavior. Signal-to-noise ratios,waveform stability, and rates of cell loss indicate that this method maybe particularly suited to experiments investigating the neural corre-lates of processes extending over multiple days, such as learning andplasticity.
I N T R O D U C T I O N
Extracellular recordings of action potentials (“spikes”) inawake, behaving primates provide unique insights into theneural control of complex behavior. Conventionally, a record-ing chamber is positioned over a craniotomy and sharp micro-electrodes are lowered through the dura into the cerebral cortexof restrained animals performing trained tasks (Lemon 1984).Commercially available electrode drives, including those fromThomas Recording (Baker et al. 1999; Eckhorn and Thomas1993), Alpha-Omega Engineering (Johnson and Welsh 2003),and Nan Instruments, allow multiple microelectrodes to beindependently positioned on a daily basis, although head fix-ation is usually required to stabilize recordings and the range ofmovement tasks that can be studied with this paradigm islimited. Furthermore, electrodes must be removed at the end ofeach recording session, making this method unsuitable forinvestigating neural correlates of processes that take severaldays or more, such as cortical plasticity during skill learning.Recently, chronically implanted electrodes have been devel-oped to follow cells long term without the need for headfixation or restraint. Common electrode designs include thin,flexible microwires (Kralik et al. 2001) or micromachinedsilicon probes (Nordhausen et al. 1996; Suner et al. 2005) and,in the future, such devices may have clinical application ina new generation of neural prostheses and brain–computerinterfaces (BCIs) controlled by real-time spike recordings(Nicolelis 2003; Schwartz et al. 2006). However, a commondisadvantage of current techniques is the need to permanently
fix electrodes in place at the time of surgery. Gauging thecorrect depth may be difficult if spontaneous firing rates underanesthesia are low and there is no possibility of subsequentlymoving electrodes to sample new cells or record from deepertissue, such as in the banks of sulci. Furthermore, gliosis andcell death around implanted electrode tips cause a reduction inrecording quality over time (Biran et al. 2005; Griffith andHumphrey 2006; Szarowski et al. 2003). A movable designcould extend the usable lifetime of these implants and providemore comprehensive sampling of neural responses from acortical area by allowing electrodes to be repositioned asneeded in fresh tissue.
In small mammals, miniature microdrives attached to theskull have been successfully used to study neural activityduring unrestrained behavior (Kralik et al. 2001; O’Keefe andRecce 1993; Swadlow et al. 2005; Wilson and McNaughton1993). However, their application in primates is limited by thetougher dura mater and large subarachnoid space within whichthe brain moves in relation to the skull. Even a slight move-ment of the brain will cause substantial changes in the size ofaction potentials recorded by sharp electrodes penetrating thedura. Larger movements may result in tissue injury. Althoughsuch techniques can initially provide a good yield of cells aftermoving electrodes into fresh tissue, the long-term stability ofcortical recordings seems limited to a few days at most (Grayet al. 2006; Wilson et al. 2003).
We are developing low-power, implantable electronic de-vices that monitor and modulate neural activity in freelybehaving primates to explore long-term plasticity induced byrecurrent BCIs (Jackson et al. 2006a,b; Mavoori et al. 2005).To obtain stable recordings of the same isolated single unitsover many days and to sample new cells with good signal-to-noise characteristics over long experimental periods we havedeveloped a technique to implant movable microwire arrays inthe cortex of primates. The arrays are easily constructed fromreadily available materials and yield high-quality, stable re-cordings of the same single units for �1 wk at a time. Byperiodically moving the wires we have been able to obtainlarge spike waveforms and clean recordings over experimentalperiods of �1 yr from the same area of cortex. Herein wedescribe the construction of the implant and document therecording quality and stability of spike waveforms obtainedfrom implants in the hand area of primary motor cortex (M1)of two monkeys. Some of these data were collected as part ofpreviously reported experiments (Jackson et al. 2006a, 2007).
Address for reprint requests and other correspondence: A. Jackson, Sir JamesSpence Institute, Royal Victoria Infirmary, Queen Victoria Road, Newcastle-upon-Tyne NE1 4LP, UK (E-mail: [email protected]).
The costs of publication of this article were defrayed in part by the paymentof page charges. The article must therefore be hereby marked “advertisement”in accordance with 18 U.S.C. Section 1734 solely to indicate this fact.
J Neurophysiol 98: 3109–3118, 2007.First published September 12, 2007; doi:10.1152/jn.00569.2007.
31090022-3077/07 $8.00 Copyright © 2007 The American Physiological Societywww.jn.org
on Decem
ber 7, 2009 jn.physiology.org
Dow
nloaded from

M E T H O D S
Implant design
The microwire implant consisted of 12 Teflon-insulated 50-�m-diameter tungsten wires running inside polyamide guide tubes. Thewires entered the brain through an opening in the dura within a smallcraniotomy that was subsequently closed with dental cement. Theguide tubes themselves were filled with antibiotic ointment and sealedat both ends with Silastic. This waterproof seal prevented infectiontracking into the brain and allowed experiments to be performed overmany months with minimal chamber maintenance. The microwiresslid freely through the Silastic seal, allowing the depth of each to beindividually adjusted at any stage by grasping the wire above theguide tube with forceps. The entire assembly was housed within alidded titanium casing attached with screws to the skull. For theseexperiments a 6-cm-diameter cylindrical casing contained a singlemicrowire array in M1, as well as our Neurochip electronics andbattery.
Implant construction
The microwire implant consisted of two components constructedseparately: an array of guide tubes to align the microwires and aconnector block for making electrical contacts. Figure 1 shows theassembly procedure. The guide tubes were made from 40-mm lengthsof polyamide tubes with 225-�m internal diameter (part #822200,A-M Systems, Carlsborg, WA), threaded onto tungsten rods andaligned in the desired spatial arrangement. This was performed bytaping the ends of the rods to a piece of card with a cut-out window(Fig. 1A). Two rows of six rods were taped to each side of the card toproduce a 6 � 2 array. Once all the tubes lay parallel they were fixedat one end with a small amount of dental cement. After this hadhardened, the rods at the other end were splayed and more dentalcement was applied. The result was a fan-shaped arrangement of tubeswith a spacing of about 2 mm along one side and 300 �m along theother (Fig. 1B).
Centiloc-series pin connectors (part #031-9540-000; ITT Cannon,Santa Ana, CA) were crimped to 15-cm lengths of tungsten microwire(part #795500, A-M Systems) and slotted through holes in a 4 �3-way plastic connector block (part #CTA4-IP-60, ITT Cannon). Theconnector was held upside-down with the wires aligned in paralleldown one side by threading them through holes in a spacer andweighting each with an alligator clip (Fig. 1C). Slow-setting epoxywas applied to the base and side of the connector to insulate thecontacts and fix the wires. The connector was then rotated by 90° sothe bent wires projected from the side of the connector, where aone-part Silastic (type A; Dow Corning, Midland, MI) was applied toadd strain relief (Fig. 1, D and E).
At this stage, both components were sterilized by overnight (min-imum 10 h) immersion in freshly activated glutaraldehyde steriliza-tion fluid (Cidex Plus, Johnson & Johnson Medical Products); thetungsten rods were removed while the array was submerged to drawfluid into the interiors of the guide tubes. The final assembly processwas completed under aseptic conditions with sterile tools. Afterflushing with sterile water, each guide tube was filled with antibioticcream (Gentak; Akorn, Buffalo Grove, IL) by injection through a26-gauge needle placed around it. The tubes were then trimmed to afinal length of around 20 mm and attached to the connector block withdental cement. The wires were threaded into the guide tubes with theaid of magnifying loupes, and a quick-setting two-part Silastic (Kwik-Sil; WPI, Sarasota, FL) was applied to seal each end. Finally, themicrowires were cut to the appropriate length with sharp scissorsperpendicular to the long axis, yielding a tip impedance of around 0.5M� at 1 kHz, and retracted so that they protruded only slightly fromthe Silastic. The assembled implant is shown in Fig. 1E.
Implant surgeries
All procedures were approved by the University of WashingtonInstitutional Animal Care and Use Committee. Arrays were implantedin two male Macacca nemestrina monkeys (monkey Y: 3 yr, weight:4.3 kg; monkey K: 3 yr, weight: 4.6 kg). Each animal receivedcorticosteroids [dexamethasone, 1 mg/kg, administered orally (po)] onthe night before and at the beginning and end of surgery to reducecerebral edema. Implantation was performed under aseptic conditionswith inhalational anesthetic (isoflurane 2–2.5% in 50:50 O2:N2O).Heart rate, blood pressure, temperature, end-tidal CO2, and bloodoxygen saturation were continuously monitored to ensure stableanesthesia, and fluids were administered by an intravenous (iv) cath-eter. With the animal in a stereotaxic frame, the skin and periosteumover the skull were resected and a craniotomy approximately 10 mmwide was drilled with a dental bur at stereotaxic coordinates A 13 mmand L 18 mm. A skull screw was placed close to the craniotomy toanchor the microwire connector block. Before opening the dura mater,the monkey was hyperventilated slightly to reduce the intracranialpressure. The dura mater was then resected to the edge of thecraniotomy, permitting visualization of the central sulcus (CS). Stim-uli were delivered through a silver ball electrode placed anterior to theCS to locate the area from which movements of the hand could beelicited with the lowest threshold. To reduce relative movement of thebrain and skull and stabilize recordings, the pia mater was bonded tothe edge of the craniotomy with cyano-acrylate glue following themethod described by Kralik et al. (2001). The microwire array wasthen lowered into position on a stereotaxic carrier such that the endsof the guide tubes rested just above the pial surface over the handrepresentation and oriented such that extruded wires would travelalong the bank of the precentral cortex. The connector block wassecurely anchored to the skull screw with dental cement (Fig. 1F) andeach wire was individually inserted into the cortex by grasping theexposed loop with fine, angled forceps and advancing slowly at aspeed of about 1 mm/s. Where possible, penetration of the pia materwas verified through a microscope. We did not record from the wiresat the time of surgery, preferring to position them slightly below thesurface and advance them further at a later stage under ketamineanesthesia when M1 firing rates are robust. With the dura removedand the guide tubes positioned just above the pial surface, theindividually inserted wires easily penetrated the brain without theproblems of electrode buckling or tissue dimpling reported with othermethods (Kralik et al. 2001; Swadlow et al. 2005). However, it isimportant to ensure that each wire has penetrated the pia at the timeof surgery because the formation of scar tissue may prevent insertionat a later stage. Once all microwires had been inserted, the craniotomywas tightly filled with gelfoam and sealed using dental cement. Carewas taken to apply the cement initially in small quantities to avoidheating the tissue. A cross section of the implanted microwire array isshown in Fig. 1G.
The titanium casing was attached with further skull screws andcement. To seal the inside of the casing, exposed skull was coveredfirst with a layer of varnish (Copaliner; Bosworth, East Providence,RI) and then with a thin layer of dental cement. The layer of varnishproved useful in preventing fluid leaking from the skull into thecasing, which could occur when only dental cement was used. Finally,the skin was drawn around the implant with several sutures. The entireprocedure took approximately 5 h and was followed by a full programof analgesics [buprenorphine 0.15 mg/kg, administered intramuscu-larly (im), and ketoprofen 5 mg/kg, po] and antibiotics (cephalexin 25mg/kg, po).
Implant maintenance
Every 1–2 wk the monkeys were lightly sedated with ketamine (10mg/kg, im) to sterilize the inside of the head casing using warmed,dilute chlorohexadine solution followed by isopropol alcohol. If
Innovative Methodology
3110 A. JACKSON AND E. E. FETZ
J Neurophysiol • VOL 98 • NOVEMBER 2007 • www.jn.org
on Decem
ber 7, 2009 jn.physiology.org
Dow
nloaded from

recording quality had deteriorated, or the current sample of cells hadbeen sufficiently characterized for experimental purposes, we tookthis opportunity to move some or all of the microwires to find newcells. We typically moved between four and eight wires during one ofthese sessions, aiming to achieve a sample of two to five cells. Ourexperiments required monitoring individual cells for several dayseach, so this sample was sufficient for �1 wk of data collection. Oncean appropriate sample of cells was obtained, we avoided movingadditional wires to minimize disturbance to the tissue.
While listening to an audio monitor of the recorded signal, the wireswere nudged up or down with fine, angled forceps. Care was taken toavoid bending the wires while pushing them down because kinks
could prevent free movement through the guide tubes. By grasping thewires only a short distance (no more than a few millimeters) above thetop of the guide tube, buckling or kinking of the wires and large,uncontrolled movements could be avoided. Although there is potentialfor the forceps to damage the insulation around the wires, in ourdesign any breaks at the level that the wires are grasped will remainabove or within the sealed guide tubes, preventing any shunting of therecorded signal through the tissue. Often the first movement of a wireafter it had remained in place for days or weeks produced largechanges in the audio quality, possibly as the tips broke through glialencapsulation. Subsequent movements did not produce such abruptchanges, although an increase in background noise often preceded the
A B
C D E
F G
FIG. 1. Construction of the movable microwire array.A: guide tubes were first aligned on parallel tungsten rodsand fixed with dental cement. Two rows of 6 tubes werepositioned on each side of a piece of card to produce a6 � 2 array (see expanded end view). B: guide tubes weresplayed at one end and more cement was applied.C: weighted microwires hung parallel along one side ofthe connector. Epoxy was applied to electrically insulatethe contacts and fix the wires. D: connector block wasrotated and Silastic was applied to the wires for strainrelief. E: finished implant. Wires ran in loops from theconnector block to the guide-tube array. Guide tubeswere filled with antibiotic ointment and sealed at bothends with Silastic. F: implant as it was fixed to the skullduring surgery. Microwires can be seen entering thebrain through a craniotomy. G: cross section showingmicrowires penetrating the pia mater anterior to thecentral sulcus (CS) through a craniotomy and duralopening. Pia mater was bonded to the edge of the crani-otomy with cyano-acrylate glue and the craniotomy wassealed with gelfoam and dental cement.
Innovative Methodology
3111MOVABLE MICROWIRE ARRAY
J Neurophysiol • VOL 98 • NOVEMBER 2007 • www.jn.org
on Decem
ber 7, 2009 jn.physiology.org
Dow
nloaded from

appearance of clean neurons. Unlike isoflurane anesthesia, ketaminesedation is associated with considerable activity in M1. Many neuronsfire bursts of action potentials �50 Hz followed by periods ofquiescence with an overall rhythmicity of around 0.2–0.4 Hz (Ste-riade et al. 1993), making it possible to position the wires at suitabledepths to record units.
Recording
The recordings documented here were obtained with our Neurochiptechnology, previously described in detail (Jackson et al. 2007;Mavoori et al. 2005). Briefly, this battery-powered electronic implantamplifies, filters, and samples the signal from a single microwire. Forthese recordings, the gain was set in the range �1,500–12,000, thefilter pass band was 500 Hz to 5 kHz, and the sampling frequency was11.7 kHz. The Neurochip recorded the raw signal, the rate of spikeevents accepted by its on-line dual time–amplitude window discrim-inator algorithm, or some combination of both. Most of the analysisreported here is derived from sequential sections of raw data (�10min per channel) recorded during the daytime while the monkeysperformed a trained wrist-movement task. Overnight records of thefiring rate of a single cell were compiled with 100-ms bins andinterspersed with 22-ms sections of raw signal every 3 min to assesscell stability. Changes in spike size during overnight recordings wereverified in the subsequent daytime session using a fresh battery and adifferent Neurochip board to ensure these did not arise from nonsta-tionarities in the electronics. During periods of trained behavior,precise times of discriminated spike events were transmitted in realtime by infrared to a remote PC. Interspike interval (ISI) histogramscompiled from these records were used to distinguish single-unit andmultiunit activity. Because transmission of data in this way requiresan unbroken line of sight to the implant, we were unable to compileISI histograms for overnight recordings during unrestrained behavior.
Postmortem histology
At the end of the recording period in monkey Y, a surgical level ofanesthesia was induced with sodium pentobarbitone (25 mg/kg, iv)before perfusion through the heart with neutral-buffered formalin.Coronal sections (50 �m) of cortex were stained with cresyl violet.Monkey K is still alive at the time of writing.
Analysis
Off-line, spike events were extracted from the daily raw recordingsusing the same discrimination algorithm as was implemented in realtime by the Neurochip, consisting of a threshold and two time–amplitude windows (Mavoori et al. 2005). Discriminator parameterswere adjusted for each day’s record to compensate for changes inspike waveform. In general we have found that the recording qualityusing our Neurochip system is excellent; the short leads to theNeurochip circuit do not pick up interference or generate movementartifacts, and the battery power supply and titanium shielding effec-tively isolate the recording from other sources of electrical noise andartifacts. Therefore waveforms with peak-to-peak amplitudes �100�V could usually be isolated on the basis of threshold crossing alone,although the subsequent time–amplitude windows were useful forrejecting the occasional erroneous trigger or, in rare cases, separatingmultiple cells present on the same electrode. We separated multiplecells only when the waveforms were clearly distinct (i.e., the respec-tive time–amplitude windows did not overlap) because overly restric-tive discrimination criteria could artificially inflate signal-to-noisemeasures by rejecting spikes that did not fit a precise template.
Cell identities were verified across multiple days of recording usingseveral factors. We looked for stability of cell waveforms and behav-ioral tuning assessed both during a trained wrist-movement task andunrestrained behavior (Jackson et al. 2007). Continued identity of
those cells for which overnight Neurochip recordings revealed gradualchanges in waveforms was accepted so long as ISI histograms indi-cated that there was only one cell in the recording. If spike waveformschanged abruptly, or when a large change in waveform and/or behav-ioral tuning occurred on channels that were not tracked using theNeurochip, the cell was considered to have been lost.
Accepted waveforms consisted of sections from 5 sampling pointsbefore to 15 sampling points after the threshold crossing (1.7 mstotal). Cell size was quantified by averaging peak-to-peak amplitudesacross accepted waveforms. In addition, for comparison with a pre-vious report we calculated signal-to-noise ratio (SNR) using thetechnique described by Suner et al. (2005). In this method, acceptedspike waveforms are aligned at the threshold crossing and the peak-to-peak amplitude (A) of the average waveform is calculated. Noise(�) is quantified by the SD of the residuals remaining after thisaverage is subtracted from each individual waveform, and SNR iscalculated as A/�. Because this calculation relies on precise alignmentof the individual waveforms to the threshold crossing, we performedthe analysis on data that had been up-sampled by a factor of 4 usinglow-pass interpolation (MatLab interp function) to give an effectivesampling resolution of 47 ksp/s. Use of other interpolation methodsdid not affect the results.
Finally, to evaluate the similarity of different spike shapes wecalculated linear correlation (r) values between time-shifted averagewaveforms (i.e., the cross-correlation function calculated betweenmean-subtracted, variance-normalized spike shapes). The maximum rvalue across time shifts was used to quantify similarity, with a valueof 1 indicating identical spike shapes irrespective of absolute ampli-tude differences. Similarity scores were calculated between all wave-forms for the same cell recorded on different days and between allpairs of different cells recorded during the experiment.
R E S U L T S
Data set
This analysis is based on 113 cells (monkey Y: 58 cells;monkey K: 55 cells), of which 88% were verified as cleansingle units from refractory periods in ISI histograms. Thisprobably represents an underestimate of the maximum cellcount that could have been obtained because the single Neu-rochip recording channel and other experimental consider-ations meant we could not record from every microwire duringevery session. However, on the first day after the wires weremoved we sampled all channels showing good activity; sub-sequently we typically followed all these cells on a daily basisduring performance of the task while recording individual cellsovernight with the Neurochip. Therefore these totals are arealistic estimate of the yield of usable neurons that can beexpected in practice under similar experimental conditions.
Spike amplitudes and signal-to-noise ratio (SNR)
Figure 2A shows a 1-s section of signal recorded from amicrowire that had just been repositioned in M1 (subsequentlyreferred to as day 0). This recording from monkey K was made77 days after the initial microwire implant surgery. The burstof action potentials was typical of the robust activity seenunder ketamine anesthesia and the peak-to-peak amplitude(300 �V) is representative of well-isolated neurons obtainedwith this implant. Recordings on subsequent days with themonkey awake (Fig. 2B, days 1–5) show that the spike shaperemained generally stable. On day 6 this large waveform wasabsent and, although smaller spikes were present in the record-ing, these had a different modulation with trained wrist move-
Innovative Methodology
3112 A. JACKSON AND E. E. FETZ
J Neurophysiol • VOL 98 • NOVEMBER 2007 • www.jn.org
on Decem
ber 7, 2009 jn.physiology.org
Dow
nloaded from
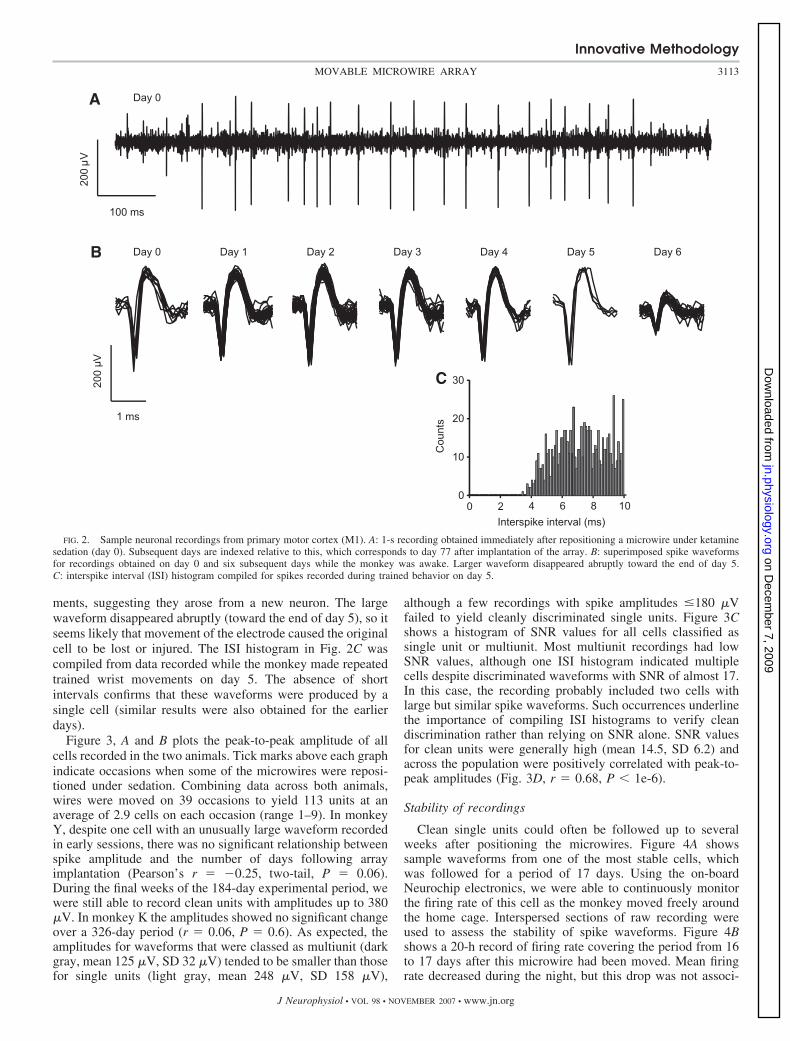
ments, suggesting they arose from a new neuron. The largewaveform disappeared abruptly (toward the end of day 5), so itseems likely that movement of the electrode caused the originalcell to be lost or injured. The ISI histogram in Fig. 2C wascompiled from data recorded while the monkey made repeatedtrained wrist movements on day 5. The absence of shortintervals confirms that these waveforms were produced by asingle cell (similar results were also obtained for the earlierdays).
Figure 3, A and B plots the peak-to-peak amplitude of allcells recorded in the two animals. Tick marks above each graphindicate occasions when some of the microwires were reposi-tioned under sedation. Combining data across both animals,wires were moved on 39 occasions to yield 113 units at anaverage of 2.9 cells on each occasion (range 1–9). In monkeyY, despite one cell with an unusually large waveform recordedin early sessions, there was no significant relationship betweenspike amplitude and the number of days following arrayimplantation (Pearson’s r � �0.25, two-tail, P � 0.06).During the final weeks of the 184-day experimental period, wewere still able to record clean units with amplitudes up to 380�V. In monkey K the amplitudes showed no significant changeover a 326-day period (r � 0.06, P � 0.6). As expected, theamplitudes for waveforms that were classed as multiunit (darkgray, mean 125 �V, SD 32 �V) tended to be smaller than thosefor single units (light gray, mean 248 �V, SD 158 �V),
although a few recordings with spike amplitudes �180 �Vfailed to yield cleanly discriminated single units. Figure 3Cshows a histogram of SNR values for all cells classified assingle unit or multiunit. Most multiunit recordings had lowSNR values, although one ISI histogram indicated multiplecells despite discriminated waveforms with SNR of almost 17.In this case, the recording probably included two cells withlarge but similar spike waveforms. Such occurrences underlinethe importance of compiling ISI histograms to verify cleandiscrimination rather than relying on SNR alone. SNR valuesfor clean units were generally high (mean 14.5, SD 6.2) andacross the population were positively correlated with peak-to-peak amplitudes (Fig. 3D, r � 0.68, P � 1e-6).
Stability of recordings
Clean single units could often be followed up to severalweeks after positioning the microwires. Figure 4A showssample waveforms from one of the most stable cells, whichwas followed for a period of 17 days. Using the on-boardNeurochip electronics, we were able to continuously monitorthe firing rate of this cell as the monkey moved freely aroundthe home cage. Interspersed sections of raw recording wereused to assess the stability of spike waveforms. Figure 4Bshows a 20-h record of firing rate covering the period from 16to 17 days after this microwire had been moved. Mean firingrate decreased during the night, but this drop was not associ-
FIG. 2. Sample neuronal recordings from primary motor cortex (M1). A: 1-s recording obtained immediately after repositioning a microwire under ketaminesedation (day 0). Subsequent days are indexed relative to this, which corresponds to day 77 after implantation of the array. B: superimposed spike waveformsfor recordings obtained on day 0 and six subsequent days while the monkey was awake. Larger waveform disappeared abruptly toward the end of day 5.C: interspike interval (ISI) histogram compiled for spikes recorded during trained behavior on day 5.
Innovative Methodology
3113MOVABLE MICROWIRE ARRAY
J Neurophysiol • VOL 98 • NOVEMBER 2007 • www.jn.org
on Decem
ber 7, 2009 jn.physiology.org
Dow
nloaded from

ated with a change in action potential and rates returned tooriginal levels the next morning. ISI histograms compiled fromspike events transmitted in real time during trained behavior,combined with the stability of directional tuning (Jackson et al.2007), strongly suggest that we were recording the same singleunit throughout this period. The size and shape of the actionpotential waveforms remained consistent despite the energeticbehavior of the monkeys in the home cage, which includedfrequent jumping, somersaulting, swinging upside down, andsudden movements of the head.
Although the majority of data sets tracked stable activity, insome cases cells were lost during recording with the Neuro-chip. Figure 4C shows firing rate data collected for one cellbetween 7 and 8 days after moving this microwire. The
recorded rate of spike events classified by the Neurochipdeclined steadily from 2 a.m. onward. At this point, themonkey was probably asleep, given the periodic fluctuations infiring rate characteristic of sleep cycles (Jackson et al. 2007).Interspersed raw recordings revealed that the decline in de-tected spike events was caused by a steady reduction inwaveform amplitude, such that by 6 a.m. very few spikessatisfied the criteria for discrimination. The amplitude of thiscell continued to decline and by day 9 could not be distin-guished above the background noise. This suggests that a slowdrift or change at the electrode–tissue interface caused steadysignal degradation over several days. A different type ofunstable recording is shown in Fig. 4D. At around 5:30 p.m. onday 4 the rate of discriminated events on this channel fellabruptly to zero. Although small waveforms could subse-quently be seen in the recording, it is not possible to knowwhether any arose from the same cell. Of 26 neurons lost whilethe Neurochip was recording, the majority (20) declinedsteadily in amplitude. The remaining 6 disappeared abruptlyand all these cases of sudden loss occurred during the daytime.This suggests that abrupt disappearances may be related tomovements of the animal, consistent with a previous report(Santhanam et al. 2007). On one occasion the abrupt loss ofa cell coincided with observation of the monkey vigorouslyshaking his head.
For 69 cells that were followed over consecutive recordingsessions we calculated the percentage lost per day (Fig. 5A).The highest rate of loss (23% or 7/31 cells) occurred immedi-ately after the wires were moved (i.e., between day 0 and day1). This rate fell to 7% (4/53 cells) between day 1 and day 2,before rising to between 15 and 20% per day over the next fewweeks. By cumulatively combining the loss rates from day 1onward, we predicted the proportion of day 1 cells that wouldbe retained on each subsequent day. This prediction, shown asa dashed line in Fig. 5B, suggests that approximately half of theoriginal population of day 1 neurons would be retained after 1wk and only one tenth after 2 wk. Figure 5B also shows theactual proportion of cells that were recorded on each subse-quent day (solid line), which falls slightly below the predictedretention rate because we did not always follow every cell untilit was lost. Microwires were sometimes moved to sample newcells even if previously documented neurons were still present.Those cells that were not followed over consecutive recordingsessions were not included in the calculation of the loss rates(Fig. 5A) used to predict the dashed line in Fig. 5B.
The average percentage change in peak-to-peak amplitudesof retained cells over successive recordings is shown as solidcircles in Fig. 5C. On average this was not significantlydifferent from zero over any period tested, suggesting thatdeclining spike amplitudes for some cells were balanced byincreases in the amplitude of other cells, particularly betweenday 0 and day 1. The open circles in Fig. 5C plot the averageabsolute change (i.e., disregarding sign), which decreasedsteadily over each day after repositioning of the microwires(r � �0.67, P � 0.002). This may be in part because someunstable cells were lost progressively from the sample, al-though even those cells that were retained tended to show thelargest amplitude changes during the first few days after thewires were moved.
To characterize the similarity between spike shapes recordedfrom the same cell on different days we calculated the maxi-
0
200
400
600
800
1000
0 50 100 150 200
0
200
400
600
800
1000
0 50 100 150 200 250 300 350
Pea
k-to
-pea
k am
plitu
de (µV
)P
eak-
to-p
eak
ampl
itude
(µ
V)
Days since implantation
Days since implantation
0
10
20
30
40
0 500 750250 1000
SN
R
Peak-to-peak (µV)
0
5
10
15
20
25
0 10 20 30 40
SNR
Cel
l cou
nt
C D
B
A
Single-unitMulti-unit
FIG. 3. Long-term performance of movable microwire array. A: peak-to-peak amplitude of all single units (light gray circles) and multiunits (dark graycircles) recorded over the lifetime of the implant in monkey Y. Each pointrepresents the amplitude of the cell on the first day that it was recorded. Tickmarks above the plot indicate occasions when the microwires were reposi-tioned. Trend line is based on least-squares fitting through all single- andmultiunit amplitudes. B: comparable plot for monkey K. C: histogram ofsignal-to-noise ratio (SNR) values for single-unit (light gray) and multiunit(dark gray) waveforms. D: scatterplot of SNR vs. peak-to-peak amplitude forall cells.
Innovative Methodology
3114 A. JACKSON AND E. E. FETZ
J Neurophysiol • VOL 98 • NOVEMBER 2007 • www.jn.org
on Decem
ber 7, 2009 jn.physiology.org
Dow
nloaded from

mum linear correlation coefficient between time-shifted aver-age waveforms (Fig. 6A). This similarity score is independentof the absolute amplitudes of waveforms and a value of 1indicates identically shaped spikes. Waveforms for the sameneuron on different days tended to be very similar with 81% ofr values �0.95, compared with only 37% of similarity scorescalculated between waveforms of different cells (Fig. 6B).Although this suggests that in general spike shapes remainedconsistent, the overlap between the distributions shown in Fig.6B indicates that spikes from different cells could also exhibitsimilar waveforms. Thus a consistent spike shape alone doesnot provide conclusive evidence that the same individual neu-rons are present in recordings on subsequent days.
Postmortem histology
Cresyl-stained slices from monkey Y revealed clear elec-trode tracks running down the anterior bank of the centralsulcus along the edge of the gray/white matter border (Fig. 7A).Dense glial scarring surrounded these tracks and electrode tips(Fig. 7B). The orientation revealed by this histology helpsexplain the successful yield and large waveform amplitudesobtained during this experiment because many tracks ran closeto layer V where large pyramidal cell bodies are located. Forthis reason movable microwire arrays may be particularlyapplicable to recording down the banks of sulci where cells canbe found at many different depths.
D I S C U S S I O N
Suitability of movable microwire arrays forlong-term recording
In our experience movable microwire arrays provide a fa-vorable combination of high signal-to-noise ratios (SNRs),excellent neuronal stability during free behavior, and long-termperformance. Large-amplitude waveforms can be acquiredconsistently on moving the microwires into fresh tissue (at thetime of writing, the implant in monkey K is still recordingclean neurons after 22 mo) and the movable wires allowrecording from multiple sites down the banks of sulci. Al-though the yield of simultaneously recorded neurons is rela-tively low, individual cells remain well isolated and stable formany days at a time (one cell remained consistent for almost 3wk before the microwire was moved). This technique is there-fore well suited to studying the neural correlates of natural,unrestrained behaviors and processes that extend over periodsof several days, such as learning. The implant is simple toconstruct with readily available components and sufficientlysmall to be used in conjunction with implanted electroniccircuitry for wireless recording. For our experiments, the arraywas enclosed by a large (6-cm-diameter) chamber, which alsohoused the electronics and battery. In other situations a smallerimplant about the size of a conventional recording chamberwould be feasible, or multiple arrays could be implanted torecord from different cortical areas. These microwires can
Day 17
Day 13
Day 6
Day 2
Day 16
Day 12
Day 5
Day 1
Day 5Day 4
Day 8Day 7
2pm 6pm 10pm 2am 6am 10am
6pm 10pm 2am 6am 10am 2pm
5:00pm 5:30pm 6:00pm 6:30pm
200 µ
V
0
25
50
0
25
50
0
50
100fir
ing
rate
(H
z)
firin
g ra
te (
Hz)
firin
g ra
te (
Hz)
A
B
C
D
1 ms
400 µ
V
1 ms
1000
µV
1 ms
FIG. 4. Stable and unstable recordings obtained during unrestrained behavior using implanted Neurochip circuitry. A: sample waveforms for one cell over a17-day period after positioning the microwire (on day 0). B: mean firing rate over consecutive 1-min intervals (dark line) through 18 h of recording for this cellfrom day 16 to day 17. Also shown in gray are the maximum and minimum firing rates obtained during 100-ms intervals within each minute. Firing rate waslower while the monkey was asleep during the night but was otherwise stable. C: recorded firing rate and waveforms for a different cell that showed steadilyreduced amplitude between days 7 and 8. Apparent decline in recorded firing rate actually results from failure of the smaller waveforms to satisfy thediscriminator parameters. D: recorded firing rate and waveforms for a cell exhibiting an abrupt change on day 4.
Innovative Methodology
3115MOVABLE MICROWIRE ARRAY
J Neurophysiol • VOL 98 • NOVEMBER 2007 • www.jn.org
on Decem
ber 7, 2009 jn.physiology.org
Dow
nloaded from

also be used to deliver intracortical microstimulation (e.g.,Jackson et al. 2006a).
Movable microwires may be especially useful for experi-ments that require repeated monitoring of small populations ofcells over periods of several days, for example, to study neuralplasticity during learning. In such cases, continued identifica-tion of specific cells may be critical to unambiguous interpre-tation of the data. In our experiments, a range of corroboratingevidence supported the general consistency of cell identitiesthrough the recordings, including clean ISI histograms, stabil-ity of waveforms, and preserved behavioral correlations overseveral days. However, no single test can provide a conclusiveassurance that individual cells on any given day are the sameas those recorded previously. Spike amplitudes could varyconsiderably over a 24-h period and in many learning experi-
ments a change in behavioral tuning may be the observation ofinterest. Different cells could often have similar waveforms(Fig. 6B) such that a consistent spike shape from day to day isno guarantee of identity. In some cases (e.g., pyramidal tractneurons), antidromic identification by stimulating output path-ways may be useful in this regard (Lemon 1984), although thestability of antidromic latencies and thresholds over many daysremains to be demonstrated. In light of these issues, continuousrecording with implanted microprocessors or telemetry sys-tems may prove valuable for future experiments, revealing as itdoes both gradual and abrupt changes in spike shape.
Comparison with alternative techniques
The range of commercially available chronic electrode andmicrodrive designs has expanded considerably in recent years,although a review of the relative merits of each is beyond thescope of this article. Here we will contrast several recentreports of long-term recordings from the macaque cortex.Performance of the movable microwire arrays can be comparedmeaningfully with fixed electrode arrays (Nicolelis et al. 2003;Santhanam et al. 2007; Suner et al. 2005) and miniaturemicrodrives carrying conventional sharp electrodes (Chamet al. 2005; Gray et al. 2006; Wilson et al. 2003). The numberof electrodes in high-density implants such as fixed microwires(Nicolelis et al. 2003) or the Utah array (Suner et al. 2005) canyield large cell counts, and these devices may be sufficiently
0.8 0.85 0.9 0.95 1
Waveform similarity (Max r)
Same neuron
Different neurons
Per
cent
age
of c
ompa
rison
s
0
10
4
6
8
10
Same neuron
Different neurons
Max r = 0.99
Max r = 0.82
B
A
FIG. 6. Similarity between spike shapes for the same neuron on differentdays vs. different neurons. A: spike-shape similarity was quantified by the peakof the normalized cross-correlation function between average waveforms; avalue of 1 indicates identical spike shapes, irrespective of absolute spikeamplitudes. B: histogram of all spike-shape similarities for the same neuron ondifferent days (dark line), and between all pairs of different neurons in theentire data set (gray line).
0
20
40
60
80
100
0 5 10 15
0
10
20
30
40
Cel
ls lo
st p
er d
ay (
%)
0-1 1-2 2-4 4-9 9+
Days since moving wires
Days since moving wires
Cel
ls r
etai
ned
(%)
B
A
C
-10
0
10
20
30
40
0-1 1-2 2-4 4-9 9+
AbsoluteAverage
PredictedActual
Dai
ly a
mpl
itude
cha
nge
(%)
Days since moving wires
FIG. 5. Analysis of overall cell stability. A: mean rate of cell loss per dayfor different intervals of time following movement of the wires. Bars indicatethe SD of loss rate based on the assumption that loss events occur indepen-dently with equal probability. B: predicted percentage of day 1 cells retainedon each subsequent day calculated from mean loss rates (dashed line). Alsoshown is the actual percentage of day 1 cells that were subsequently recorded(solid line). C: mean change in signed (solid circles) and absolute (filledcircles) peak-to-peak amplitude per day for different intervals of time follow-ing movement of the wires. Error bars indicate SEs.
Innovative Methodology
3116 A. JACKSON AND E. E. FETZ
J Neurophysiol • VOL 98 • NOVEMBER 2007 • www.jn.org
on Decem
ber 7, 2009 jn.physiology.org
Dow
nloaded from

small and safe for clinical use as BCIs. Long-term performancecontinues to improve, with spike recordings reported severalyears after implantation (Sandler et al. 2005; Suner et al. 2005).Stability of individual cells recorded on the Utah array overperiods of several days has recently been demonstrated usingan implanted recording system (Santhanam et al. 2007). Am-plitude variations of a magnitude similar to that of the presentstudy were reported. However, comparison with published datafor both fixed microwires and Utah arrays suggests that themovable microwires yield recordings with substantially higherSNR. Suner et al. (2005) reported a mean SNR value of 4.8 forsignals ranked as “high quality” on a Utah array, whereasNicolelis et al. (2003) reported a mean SNR of 5.5 for fixedmicrowire recordings. By contrast, the mean SNR value for ourmovable microwire recordings was 14.5. This improvement isalso evident in the mean peak-to-peak amplitude (248 �V)compared with that of fixed microwires (115 �V; Nicoleliset al. 2003). Furthermore, a single well-isolated unit was mostoften obtained with our method, compared with the multiunitrecordings often obtained with fixed arrays. Although it re-mains to be seen whether single- or multiunit data will be mostappropriate for BCI applications (Carmena et al. 2003), isolat-ing individual cells has clear benefits for scientific studies.Even if waveforms are sufficiently distinct to be separated, thepresence of multiple cells on a channel may compromise thereliability of identifying neurons over several days, giventhe changes of amplitude that can occur.
One explanation for the high SNR and prevalence of singleunits on these electrodes may be the ability to accurately adjusttheir depth to position the tips within layer V, close to the largepyramidal cells. The ability to repeatedly advance individualelectrodes into fresh tissue is also likely to be an importantfactor. A number of groups are working to reduce the tissueresponse to chronically implanted electrodes (He et al. 2006;
Retterer et al. 2004) and the data reported here may offerincentive by demonstrating that significant future improve-ments in signal-to-noise performance should be possible.
In many ways the converse of these considerations applies tominiature microdrives fixed to the skull (Cham et al. 2005;Gray et al. 2006; Swadlow et al. 2005; Wilson et al. 2003).Such systems yield well-isolated units with good SNR oninitially penetrating the cortex, and can reach deeper structures,including the banks of sulci. However, reports suggest that thelong-term stability of individual neurons in primates is limitedto several days at most (Gray et al. 2006; Wilson et al. 2003).In an attempt to address this issue, Cham et al. (2005) proposedan automated tracking algorithm for continually adjustingelectrode depth to maintain cell isolation, although the practi-cality of this remains to be proven. Stability could possibly beimproved using flexible microwires as in our movable arrayinstead of rigid, sharp electrodes, but this would likelyrequire resection of the dura mater in primates. Commer-cially available screw drives such as the Neuralynx micro-drive (Neuralynx, Bozeman, MT) may prove suitable forpositioning microwires in primate cortex if the risk of infectioncan be managed, perhaps using the combination of antibioticcream and Silastic described in this report. The use of suchscrew drives would be advantageous in situations requiringcalibrated depth measurement. In practice, however, the pre-cise depth control of a microdrive may not confer sufficientlong-term advantage to justify the increased implant size. Inour experience, many cells changed size or were lost in the first24 h after moving the microwires, so efforts to optimizespecific waveforms on day 0 were often unrewarded, whereaschannels with small waveforms subsequently yielded stable,well-isolated cells a day later.
In conclusion, we have described a compact movable mi-crowire array, constructed from readily available materials,
FIG. 7. Postmortem histology from monkey Y. A: cresyl-stained coronal sections showing gliosis surrounding electrode tracks running down the anterior bankof the CS along the gray matter (GM) and white matter (WM) border. B: increased magnification of the end of one electrode track located close to large layerV pyramidal cells.
Innovative Methodology
3117MOVABLE MICROWIRE ARRAY
J Neurophysiol • VOL 98 • NOVEMBER 2007 • www.jn.org
on Decem
ber 7, 2009 jn.physiology.org
Dow
nloaded from
that offers favorable signal-to-noise characteristics, neuronalstability, and long-term performance. This technique allowsindividual cells in the cortex of nonhuman primates to befollowed for several weeks at a time and opens the possibilityof studying neural correlates of long-term processes such asplasticity and motor learning.
A C K N O W L E D G M E N T S
We thank S. Perlmutter, J. Mavoori, C. Kirby, C. Moritz, S. Zanos, L.Shupe, and S. Baker for assistance.
G R A N T S
This work was supported by National Institutes of Health Grants NS-12542and RR-00166 and the University of Washington Royalty Research Fund.
R E F E R E N C E S
Baker SN, Philbin N, Spinks R, Pinches EM, Wolpert DM, MacManusDG, Pauluis Q, Lemon RN. Multiple single unit recording in the cortex ofmonkeys using independently moveable microelectrodes. J Neurosci Meth-ods 94: 5–17, 1999.
Biran R, Martin DC, Tresco PA. Neuronal cell loss accompanies the braintissue response to chronically implanted silicon microelectrode arrays. ExpNeurol 195: 115–126, 2005.
Carmena JM, Lebedev MA, Crist RE, O’Doherty JE, Santucci DM,Dimitrov DF, Patil PG, Henriquez CS, Nicolelis MA. Learning to controla brain-machine interface for reaching and grasping by primates. PLoS Biol1: e42, 2003.
Cham JG, Branchaud EA, Nenadic Z, Greger B, Andersen RA, BurdickJW. Semi-chronic motorized microdrive and control algorithm for autono-mously isolating and maintaining optimal extracellular action potentials.J Neurophysiol 93: 570–579, 2005.
Eckhorn R, Thomas U. A new method for the insertion of multiple micro-probes into neural and muscular tissue, including fiber electrodes, fine wires,needles and microsensors. J Neurosci Methods 49: 175–179, 1993.
Gray CM, Goodell B, Salazar R, Baker J. Semi-chronic recording ofneuronal activity in monkey visual cortex using a 60-channel microdrive.Soc Neurosci Abstr 148.16, 2006.
Griffith RW, Humphrey DR. Long-term gliosis around chronically im-planted platinum electrodes in the Rhesus macaque motor cortex. NeurosciLett 406: 81–86, 2006.
He W, McConnell GC, Bellamkonda RV. Nanoscale laminin coating mod-ulates cortical scarring response around implanted silicon microelectrodearrays. J Neural Eng 3: 316–326, 2006.
Jackson A, Mavoori J, Fetz EE. Long-term motor cortex plasticity inducedby an electronic implant. Nature 444: 56–60, 2006a.
Jackson A, Mavoori J, Fetz EE. Correlations between the same motor cortexcells and arm muscles during a trained task, free behavior, and natural sleepin the macaque monkey. J Neurophysiol 97: 360–374, 2007.
Jackson A, Moritz CT, Mavoori J, Lucas TH, Fetz EE. The Neurochip BCI:towards a neural prosthesis for upper limb function. IEEE Trans Neural SystRehab Eng 14: 187–190, 2006b.
Johnson JL, Welsh JP. Independently moveable multielectrode array torecord fast-spiking neurons in the cerebral cortex during cognition. Methods30: 64–78, 2003.
Kralik JD, Dimitrov DF, Krupa DJ, Katz DB, Cohen D, Nicolelis MA.Techniques for chronic, multisite neuronal ensemble recordings in behavinganimals. Methods 25: 121–150, 2001.
Lemon RN. Methods for neuronal recording in conscious animals. In: IBROHandbook Series: Methods in Neurosciences (4th ed.), edited by Smith AD.London: Wiley, 1984, p. 1–162.
Mavoori J, Jackson A, Diorio C, Fetz EE. An autonomous implantablecomputer for neural recording and stimulation in unrestrained primates.J Neurosci Methods 148: 71–77, 2005.
Nicolelis MAL. Brain-machine interfaces to restore motor function and probeneural circuits. Nat Rev Neurosci 4: 417–422, 2003.
Nicolelis MAL, Dimitrov D, Carmena JM, Crist R, Lehew G, Kralik JD,Wise SP. Chronic, multisite, multielectrode recordings in macaque mon-keys. Proc Natl Acad Sci USA 100: 11041–11046, 2003.
Nordhausen CT, Maynard EM, Normann RA. Single unit recording capa-bilities of a 100 microelectrode array. Brain Res 726: 129–140, 1996.
O’Keefe J, Recce ML. Phase relationship between hippocampal place unitsand the EEG theta rhythm. Hippocampus 3: 317–330, 1993.
Retterer ST, Smith KL, Bjornsson CS, Neeves KB, Spence AJ, Turner JN,Shain W, Isaacson MS. Model neural prostheses with integrated microflu-idics: a potential intervention strategy for controlling reactive cell and tissueresponses. IEEE Trans Biomed Eng 51: 2063–2073, 2004.
Sandler AJ, Dewey KS, Nicolelis MAL. Long-term neuronal recordings fromnonhuman primates. Soc Neurosci Abstr 402.8, 2005.
Santhanam G, Linderman MD, Gilja V, Afshar A, Ryu SI, Meng TH,Shenoy KV. HermesB: a continuous neural recording system for freelybehaving primates. IEEE Trans Biomed Eng doi:10.1109/TBME.2007.895753.
Schwartz AB, Cui XT, Weber DJ, Moran DW. Brain-controlled interfaces:movement restoration with neural prosthetics. Neuron 52: 205–220, 2006.
Steriade M, Nunez A, Amzica F. A novel slow (�1 Hz) oscillation ofneocortical neurons in vivo: depolarizing and hyperpolarizing components.J Neurosci 13: 3252–3265, 1993.
Suner S, Fellows MR, Vargas-Irwin C, Nakata GK, Donoghue JP. Reli-ability of signals from a chronically implanted, silicon-based electrode arrayin non-human primate primary motor cortex. IEEE Trans Neural SystRehabil Eng 13: 524–541, 2005.
Swadlow HA, Bereshpolova Y, Bezdudnaya T, Cano M, Stoelzel CR. Amulti-channel, implantable microdrive system for use with sharp, ultra-fine“Reitboeck” microelectrodes. J Neurophysiol 93: 2959–2965, 2005.
Szarowski DH, Andersen MD, Retterer S, Spence AJ, Isaacson M, Craig-head HG, Turner JN, Shain W. Brain responses to micromachined silicondevices. Brain Res 983: 23–35, 2003.
Wilson FA, Ma YY, Greenberg PA, Ryou JW, Kim BH. A microelectrodedrive for long term recording of neurons in freely moving and chairedmonkeys. J Neurosci Methods 127: 49–61, 2003.
Wilson MA, McNaughton BL. Dynamics of the hippocampal ensemble codefor space. Science 261: 1055–1058, 1993.
Innovative Methodology
3118 A. JACKSON AND E. E. FETZ
J Neurophysiol • VOL 98 • NOVEMBER 2007 • www.jn.org
on Decem
ber 7, 2009 jn.physiology.org
Dow
nloaded from