sgp presentation 4q11 -...
TRANSCRIPT

Siamgas and Petrochemicals PLC
“Toward a New Horizon”
Presentationfor investor & analyst4Q’11 and 2011

2Disclaimer
• The information contained in this presentation is for information purposes only and does not constitute an offer or invitation to sell or the solicitation of an offer or invitation to purchase or subscribe for share in Siamgasand Petrochemicals Public Company Limited (“SGP” and shares in SGP, “shares”) in any jurisdiction or should it or any part of it form the basis of, or be relied upon in any connection with, any contract or commitment whatsoever.
• This presentation may include information which is forward‐looking in nature. Forward‐looking information involve known and unknown risks, uncertainties and other factors which may impact on the actual outcomes, including economic conditions in the markets in which SGP operates and general achievement of SGP business forecasts, which will cause the actual results, performance or achievements of SGP to differ, perhaps materially, from the results, performance or achievements expressed or implied in this presentation.
• This presentation has been prepared by the SGP. The information in this presentation has not been independently verified. No presentation, warranty, express or implied, is made as to, and no reliance should be placed on, the fairness, accuracy, completeness or correctness of the information and opinions in this presentation. None of the SGP or any of its agents or advisers, or any of their respective affiliates, advisers or representatives, shall have any liability (in negligence or otherwise) for any loss howsoever arising from any use of the presentation or its contents or otherwise arising in connection with this presentation.
• This presentation is made, furnished and distributed for information purposes only. No part of this presentation shall be relied upon directly or indirectly for any investment decision‐making or for any other purposes.
• This presentation and all other information, materials or documents provided in connection therewith, shall not, either in whole or in part, be reproduced, redistributed or made available to any other person, save in strict compliance with all applicable laws.
3Agenda
• New perspective on SGP
• Current SGP’s major businesses
• Oversea LPG Market Highlights
• Thailand LPG Market Highlights
• Financial Results
• 2012 Business Outlook
• Recent events
• Q & A

4Agenda
• New perspective on SGP
• Current SGP’s major businesses
• Oversea LPG Market Highlights
• Thailand LPG Market Highlights
• Financial Results
• 2012 Business Outlook
• Recent events
• Q & A

5New perspective on SGP for 2011 onward
• Previously, relied only on stable Thailand domestic business– Controlled price (U$ 333/ton), moderate competition, stable but limited growth
• Changing perspectives on SGP after expansion to oversea markets:– Opportunities for unlimited growth
– Trading with LPG world price (CP Saudi Aramco U$700‐900/ton) • Changing price on monthly basis
• Seasonal pricing trend is normally in line with climate condition
• Annual cycle of business operation gives a clearer picture of SGP’s oversea operation performance
• Significant price movement may imply change in financial figures
• Profit margin relies on price moving trend, and inventory balance
– Financial cost is probably high at the beginning of expansion projects
– Foreign exchange has some effect on booking transaction in financial statement.

6Agenda
• New perspective on SGP
• Current SGP’s major businesses
• Oversea LPG Market Highlights
• Thailand LPG Market Highlights
• Financial Results
• 2012 Business Outlook
• Recent events
• Q & A

7Current areas of SGP’s operations
THAILAND
VIETNAM
SINGAPORE
ZHUHAI
SHANTOU
SUPER GAS
SINGGAS
SGP, UNIQUE GAS, LOGISTICS, ETC
SINO SIAM GAS AND PETROCHEMICALS
SIAM OCEAN GAS AND ENERGY
BATAM

8
Siamgas and Petrochemicals PCLThailandLPG Offshore Trading BusinessUtilizing mega size storage and facilities of subsidiaries in China i.e. SINO SIAM, and SOGEL in importingand re‐exporting LPG to other traders and subsidiaries in the regionSGP currently utilizes VLGC as floating terminal in Batam (Indonesia) to enhance competitive advantage in SEA
LPG Business
Acquired from Chevron (Jun’11)
LPG Terminal (Bulk‐Breaking)
Storage. Cap 100,000 tons
(Underground Storage Caverns)
LPG Business
Acquired from BP (Dec’10)
LPG Terminal (Bulk‐Breaking)
LPG Filling Plant
LPG Retail Outlets
Storage. Cap 200,000 tons
(Underground Storage Caverns)
LPG Business
Acquired from Shell Gas (LPG), Jul’10
LPG Filling Plant
Storage. Cap 75 tons
LPG Business
(Acquired from Chinese owner), Mar’10
LPG Terminal & Filling Plant
Storage. Cap 2,000 tons
Siam Ocean Gas& EnergyLtdShantou, China
Sino Siam Gas &PetrochemicalsCo LtdZhuhai, China
SingGas (LPG)Pte Ltd
Singapore
Super GasCo Ltd
Vietnam
Oversea Business Operations
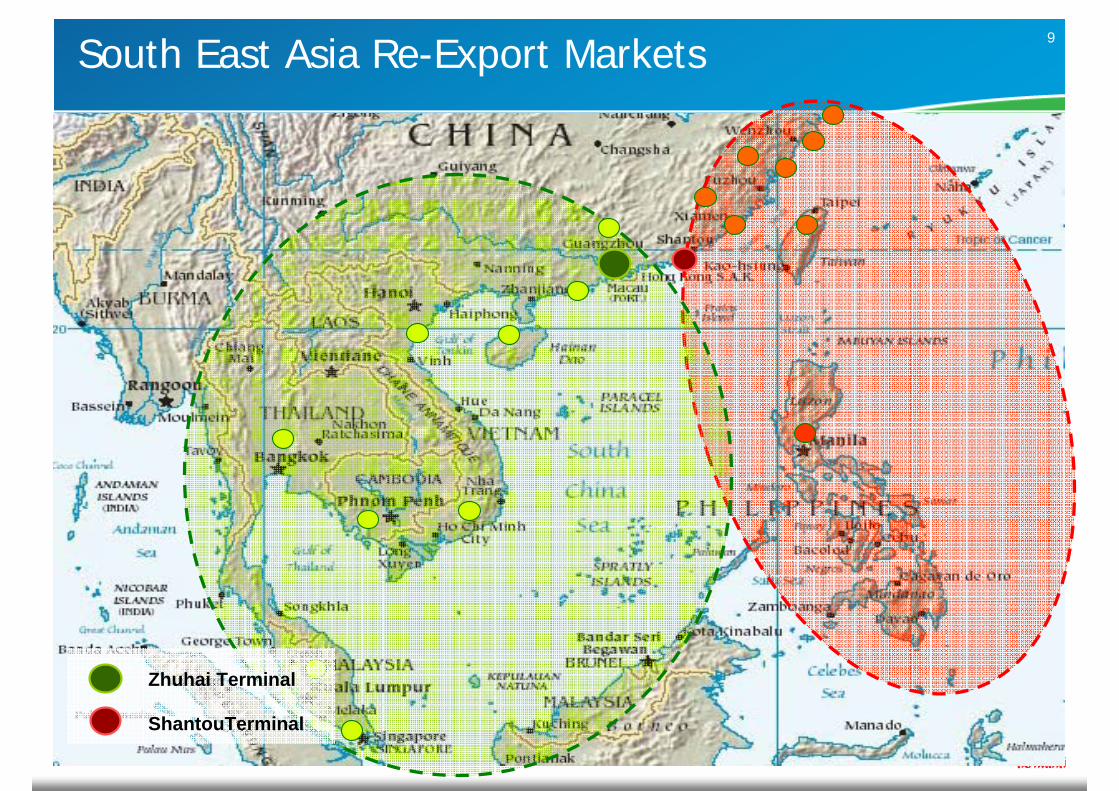
9South East Asia Re-Export Markets
Zhuhai Terminal
ShantouTerminal
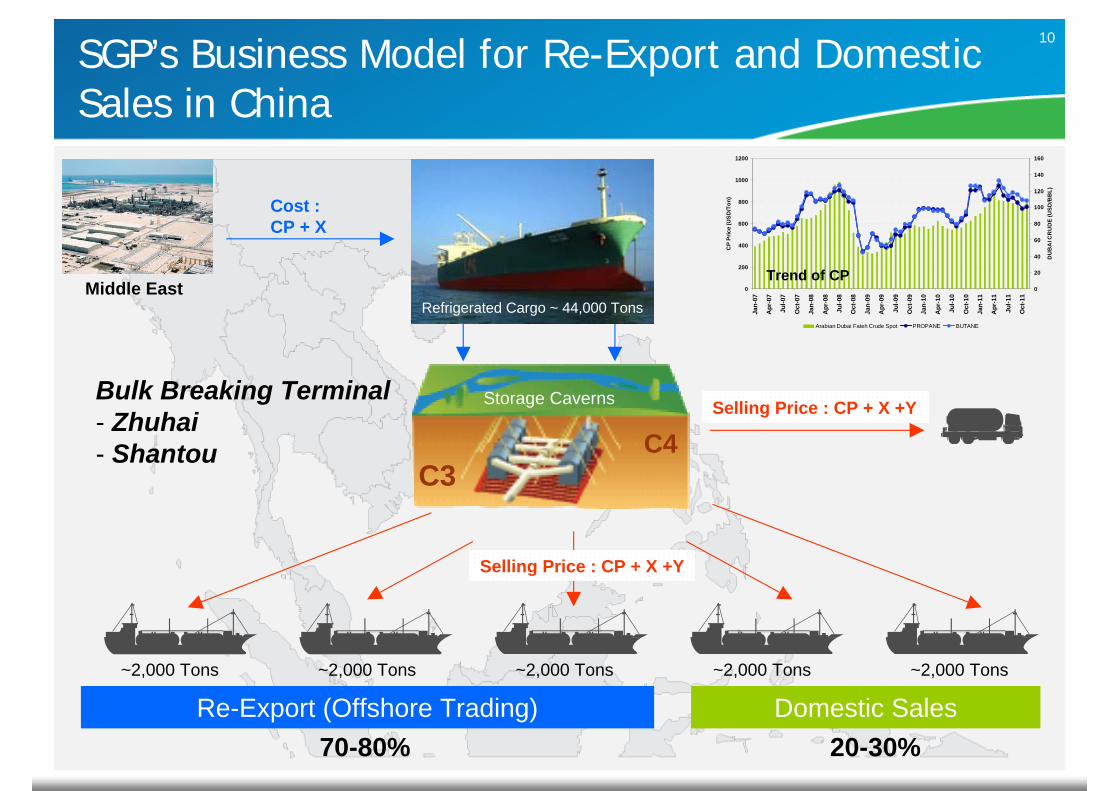
10SGP’s Business Model for Re-Export and Domestic Sales in China
Bulk Breaking Terminal- Zhuhai- Shantou
C3C4
~2,000 Tons ~2,000 Tons ~2,000 Tons ~2,000 Tons~2,000 Tons
Re-Export (Offshore Trading) Domestic Sales
Cost :CP + X
Selling Price : CP + X +Y
Selling Price : CP + X +Y
70-80% 20-30%
Storage Caverns
Middle EastRefrigerated Cargo ~ 44,000 Tons
0
200
400
600
800
1000
1200
Jan-
07
Apr
-07
Jul-0
7
Oct
-07
Jan-
08
Apr
-08
Jul-0
8
Oct
-08
Jan-
09
Apr
-09
Jul-0
9
Oct
-09
Jan-
10
Apr
-10
Jul-1
0
Oct
-10
Jan-
11
Apr
-11
Jul-1
1
Oct
-11
CP
Pric
e (U
SD
/Ton
)
0
20
40
60
80
100
120
140
160
DU
BA
I CR
UD
E (U
SD/B
BL)
Arabian Dubai Fateh Crude Spot PROPANE BUTANE
Trend of CP
11
z
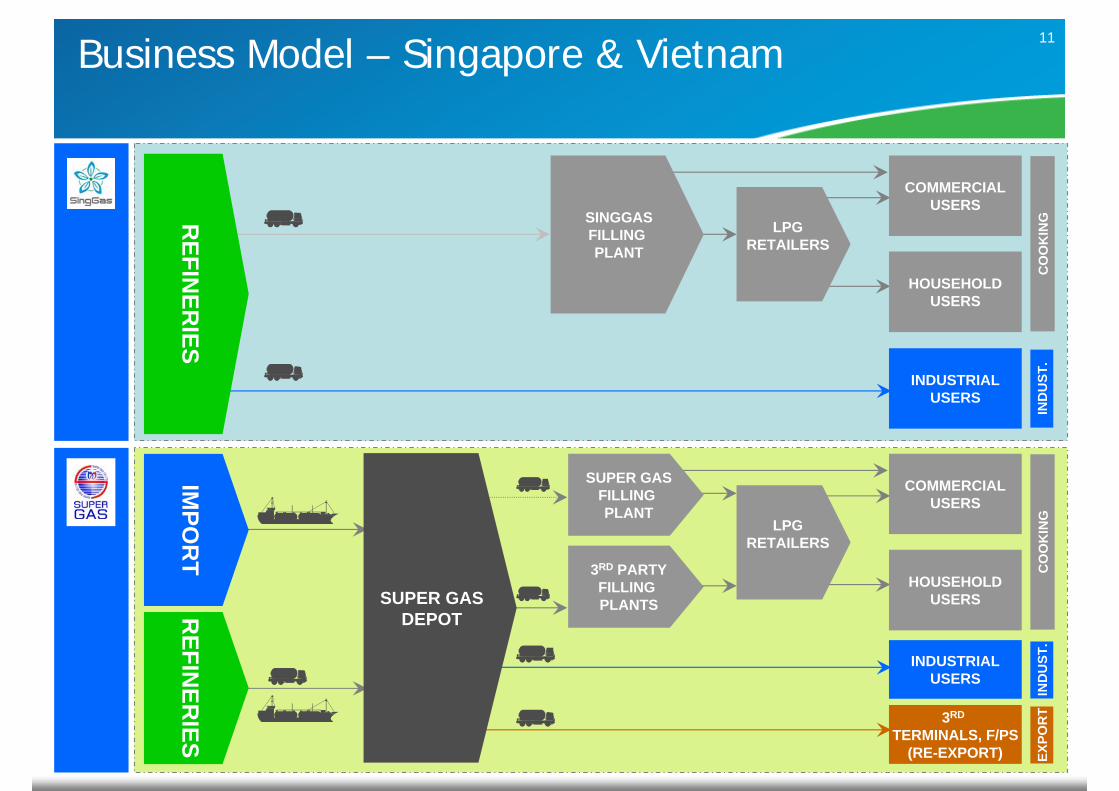
Business Model – Singapore & Vietnam
SINGGASFILLING PLANT
LPGRETAILERS
HOUSEHOLDUSERS
COMMERCIALUSERS
INDUSTRIALUSERS
CO
OK
ING
IND
UST
.
REFIN
ERIES
SUPER GASFILLING PLANT
LPGRETAILERS
HOUSEHOLDUSERS
COMMERCIALUSERS
INDUSTRIALUSERS
CO
OK
ING
IND
UST
.
IMPO
RT
3RD PARTYFILLING PLANTS
3RD
TERMINALS, F/PS(RE-EXPORT) EX
POR
T
REFIN
ERIES
SUPER GASDEPOT

12
RESIDENTIAL
COMMERCIAL
INDUSTRIAL
AUTOMOTIVE
3RD PARTYFILLINGPLANTS
COMPANYFILLING PLANT
SHOPS
3RD PARTYTERMINALS
S.CHINA
DOMESTIC
SGP’sOVERSEA
SUBSIDIARIES
SINGAPOREVIETNAM…………
SOUTHEASTASIA
RE-EXPORT
MID
DLE EA
ST
SGP’s
BU
LK B
REA
KIN
G TER
MIN
AL
IN
SOU
TH C
HIN
A
VLGCRefrigerated LPG(Propane, Butane)
CavernStorage
LOC
AL
REFIN
ERIES Sphere Tanks
Pressurized
Pressurized LPG(Mixed)
Business Model – Zhuhai, South China
TRADERS/3RD PARTY
TERMINALS INTHE REGION
SSGPSSGP
13
MID
DLE EA
ST
VLGCRefrigerated
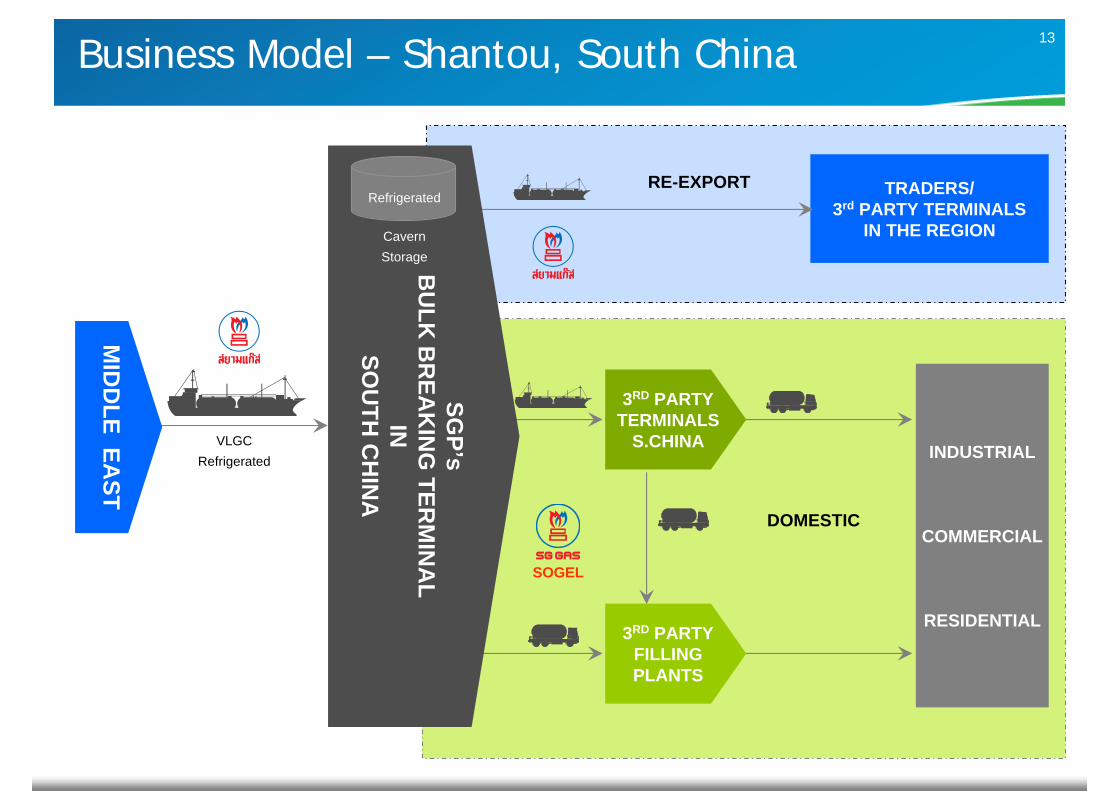
Business Model – Shantou, South China
TRADERS/3rd PARTY TERMINALS
IN THE REGION
RE-EXPORT
INDUSTRIAL
COMMERCIAL
RESIDENTIAL3RD PARTY
FILLINGPLANTS
3RD PARTYTERMINALS
S.CHINA
SOGEL
DOMESTIC
SGP’s
BU
LK B
REA
KIN
G TER
MIN
AL
IN
SOU
TH C
HIN
A
CavernStorage
Refrigerated
14Agenda
• New perspective on SGP
• Current SGP’s major businesses
• Oversea LPG Market Highlights
• Thailand LPG Market Highlights
• Financial Results
• 2012 Business Outlook
• Recent events
• Q & A
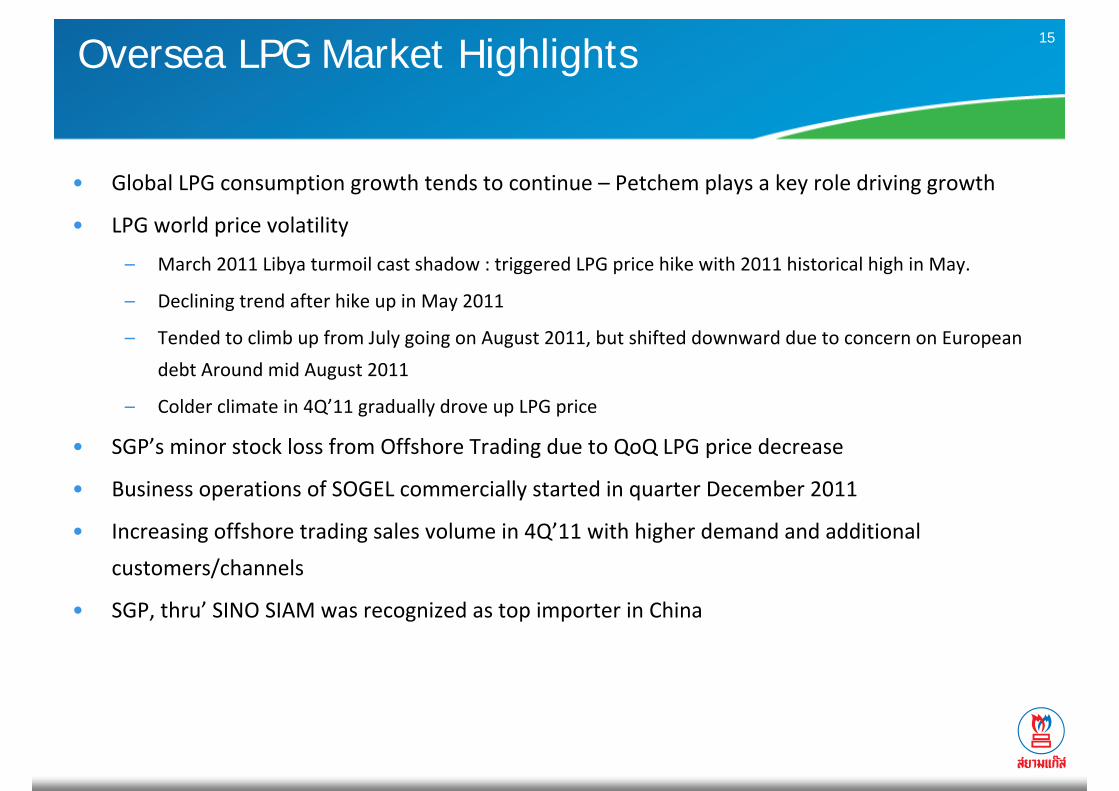
15Oversea LPG Market Highlights
• Global LPG consumption growth tends to continue – Petchem plays a key role driving growth
• LPG world price volatility
– March 2011 Libya turmoil cast shadow : triggered LPG price hike with 2011 historical high in May.
– Declining trend after hike up in May 2011
– Tended to climb up from July going on August 2011, but shifted downward due to concern on European
debt Around mid August 2011
– Colder climate in 4Q’11 gradually drove up LPG price
• SGP’s minor stock loss from Offshore Trading due to QoQ LPG price decrease
• Business operations of SOGEL commercially started in quarter December 2011
• Increasing offshore trading sales volume in 4Q’11 with higher demand and additional
customers/channels
• SGP, thru’ SINO SIAM was recognized as top importer in China

16
Grow
th indications from traders &
major exporters
Room to grow in the growing global market
0
10
20
30
40
50
60
70
80
2009 2010 2011 2012 2013 2014 2015
Mill
ion
Tons
0
5
10
15
20
25
30
35
40
2010 2011 2012 2015
Mill
ion
Tons
World Propane & Butane Trade Outlook
Source : Poten & Partner
Middle East Export O/L (2010-2015)
Source : Poten & Partner
LPG consumption in the world (2010)
Source: Compiled by the Agency for Natural ResourcesFrom data released by the World LP Gas Association (WLPG)
* Total 2010 consumption : 246 million tons* LPG consumption including Petchem
71.56
4.31
5.44
5.99
7.01
9.06
9.16
10.20
12.91
13.25
16.27
25.12
55.92
- 20 40 60 80
Others
Egypt
Thailand
Canada
Brazil
Mexico
South Korea
Russia
Saudi Arabia
India
Japan
China
USA
volume (million tons)
17
0
100
200
300
400
500
600
700
Sino Siam
Sino-Ben
nyNew O
cean
Oriental E
nerg
yTian
shen
gOuhua E
nerg
y
JOVO
Shanghai
GoldenHuaka
iChinag
as
Volu
me
(thou
sand
tons
)
ImportExport
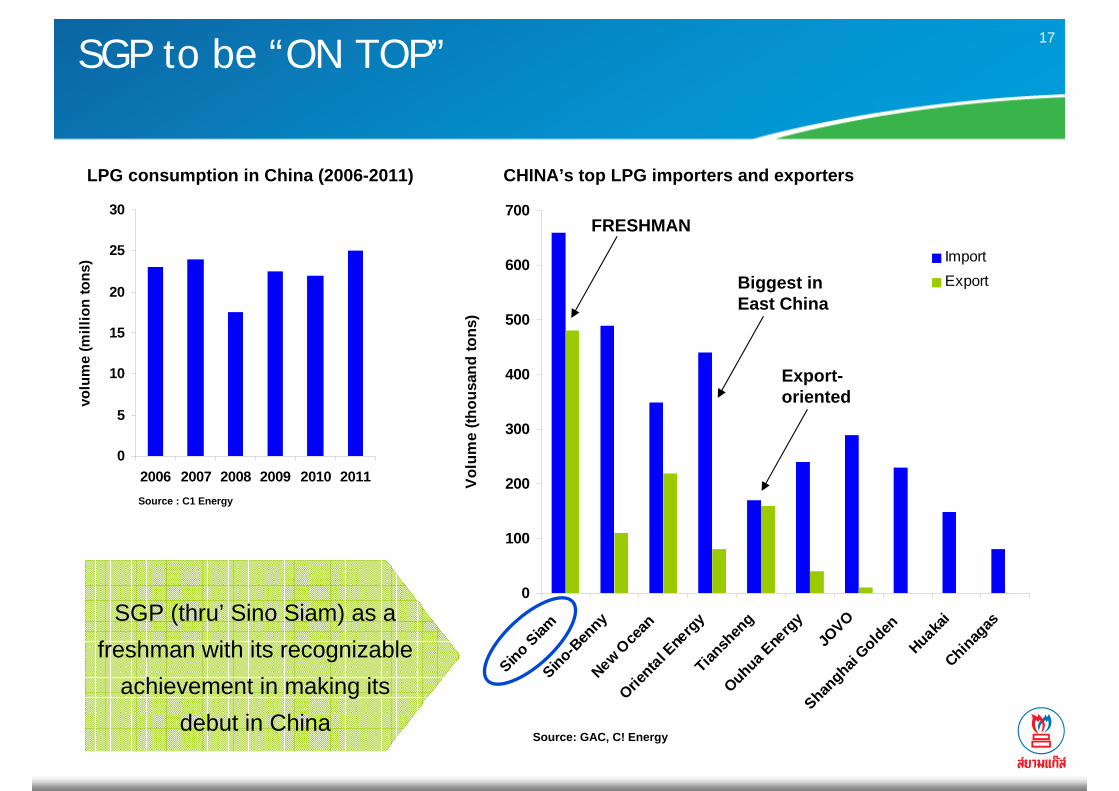
SGP to be “ON TOP”
0
5
10
15
20
25
30
2006 2007 2008 2009 2010 2011
volu
me
(mill
ion
tons
)
Source: GAC, C! Energy
LPG consumption in China (2006-2011)
Source : C1 Energy
CHINA’s top LPG importers and exporters
SGP (thru’ Sino Siam) as a freshman with its recognizable
achievement in making its debut in China
FRESHMAN
Biggest inEast China
Export-oriented
18
-
200
400
600
800
1,000
1,200
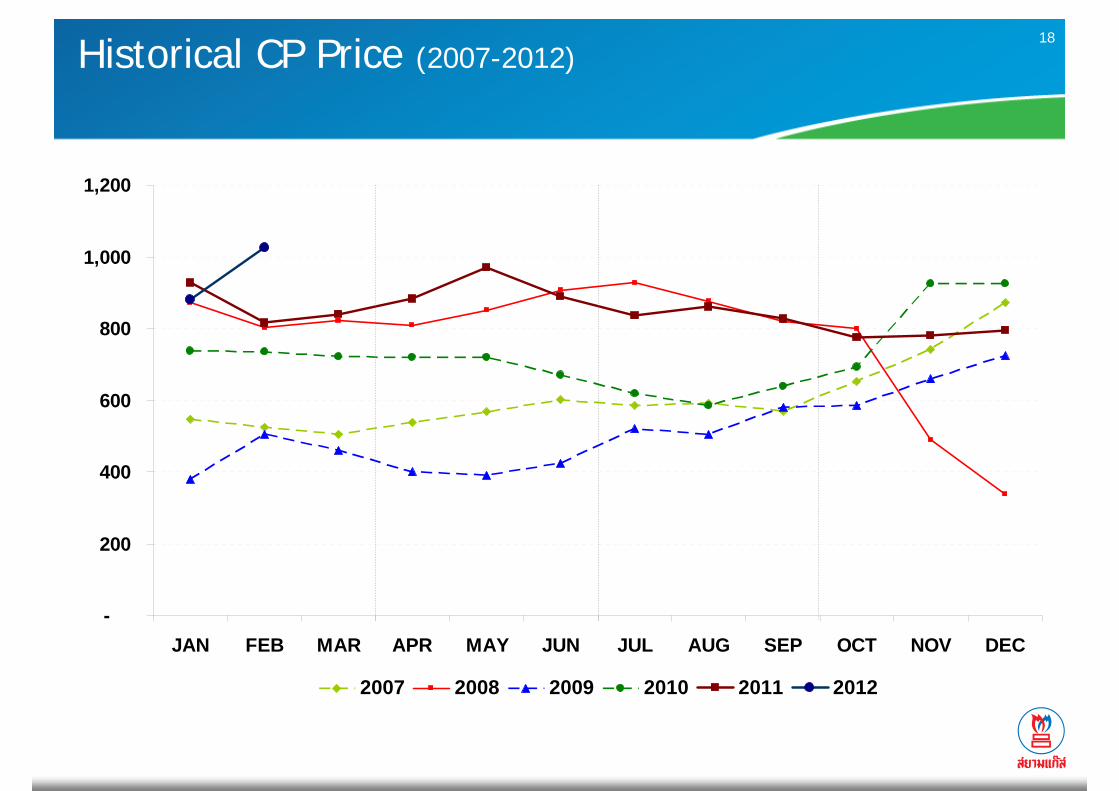
JAN FEB MAR APR MAY JUN JUL AUG SEP OCT NOV DEC
2007 2008 2009 2010 2011 2012
Historical CP Price (2007-2012)
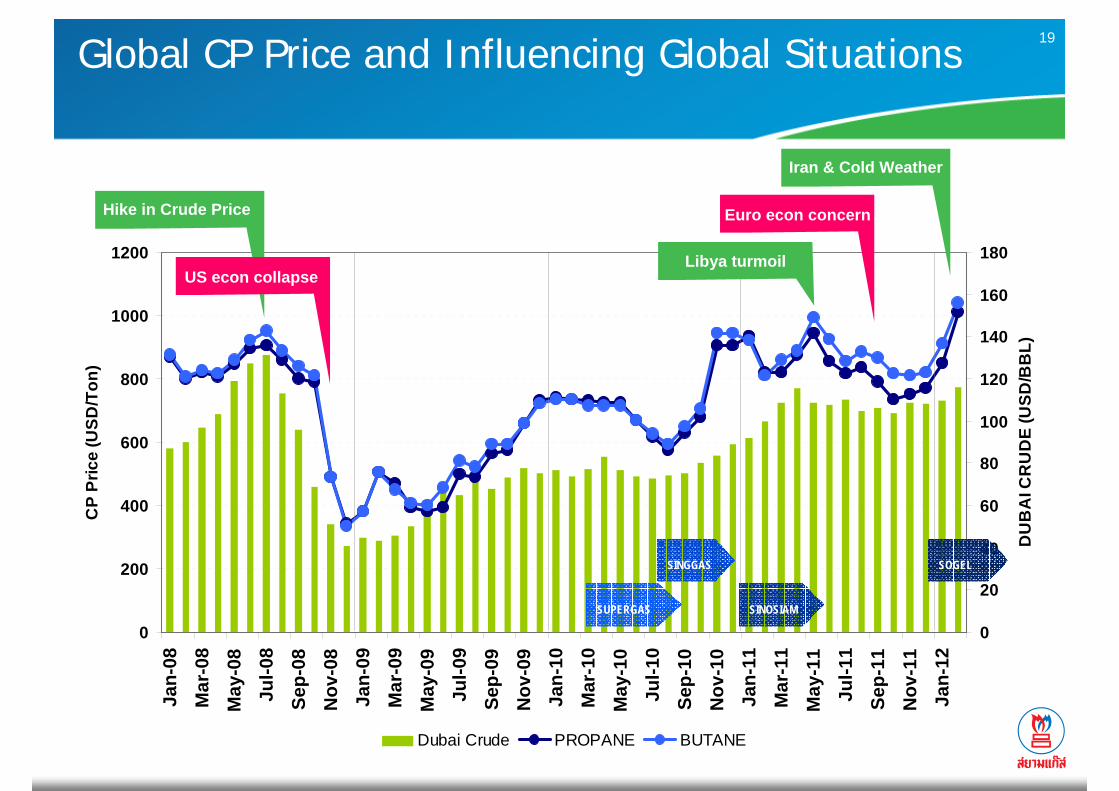
19Global CP Price and Influencing Global Situations
0
200
400
600
800
1000
1200
Jan-
08M
ar-0
8M
ay-0
8Ju
l-08
Sep-
08N
ov-0
8Ja
n-09
Mar
-09
May
-09
Jul-0
9Se
p-09
Nov
-09
Jan-
10M
ar-1
0M
ay-1
0Ju
l-10
Sep-
10N
ov-1
0Ja
n-11
Mar
-11
May
-11
Jul-1
1Se
p-11
Nov
-11
Jan-
12
CP
Pric
e (U
SD/T
on)
0
20
40
60
80
100
120
140
160
180
DU
BA
I CR
UD
E (U
SD/B
BL)
Dubai Crude PROPANE BUTANE
Libya turmoil
Euro econ concern
Iran & Cold Weather
Hike in Crude Price
US econ collapse
SUPERGAS
SINGGAS
SINOSIAM
SOGEL
20
1,165,296
294,529
588,271
897,468
1,186,275
56,906
92,662
207,657
349,685
503,165
-
44,333
69,846
90,340
114,377
1,243,375
441,011
885,663
1,369,739
1,855,513
-
400,000
800,000
1,200,000
1,600,000
2,000,000
2010 3M'2011 6M'2011 9M'2011 2011
Sales Volume (tons) SGP - ThailandSGP - Offshore Trading SINO SIAMVietnam & Singapore Total
503,165
, 75.2%
114,377
, 17.1%
44,368 , 6.6%
7,328 , 1.1%
SGP - Offshore TradingSINO SIAMSOGELVietnam & Singapore
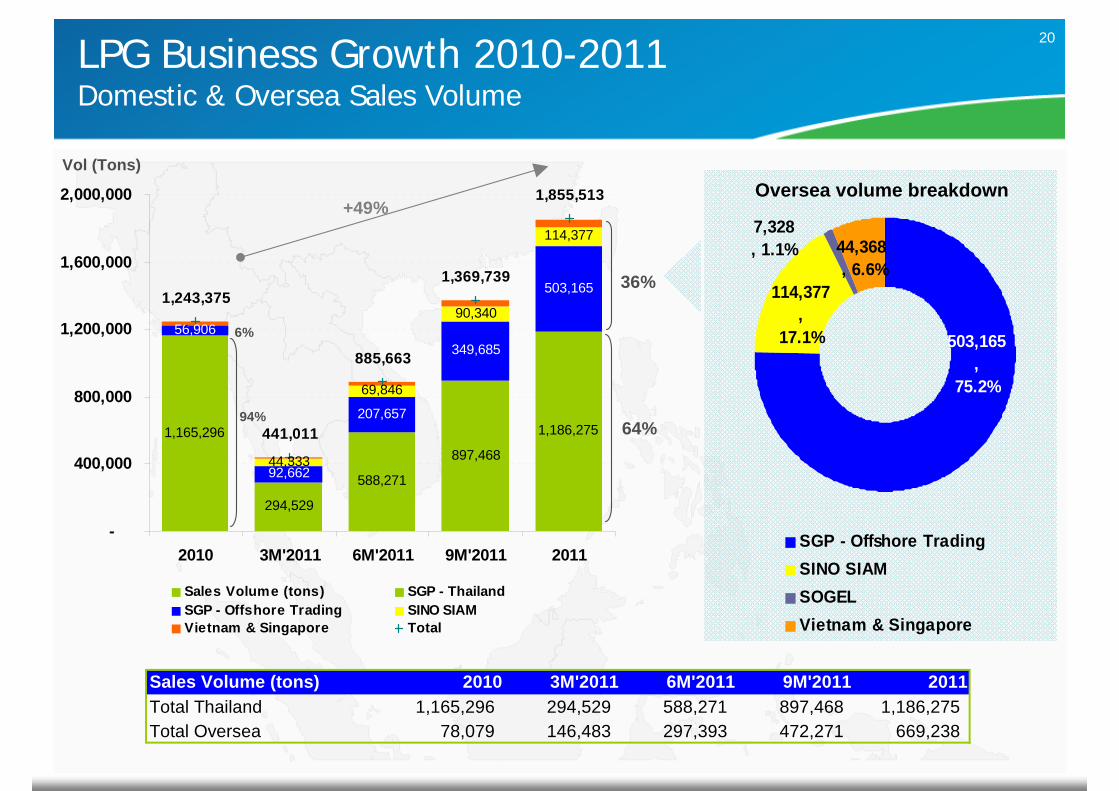
LPG Business Growth 2010-2011Domestic & Oversea Sales Volume
+49%
Vol (Tons)Oversea volume breakdown
36%
64%
6%
94%
Sales Volume (tons) 2010 3M'2011 6M'2011 9M'2011 2011Total Thailand 1,165,296 294,529 588,271 897,468 1,186,275 Total Oversea 78,079 146,483 297,393 472,271 669,238
21Agenda
• New perspective on SGP
• Current SGP’s major businesses
• Oversea LPG Market Highlights
• Thailand LPG Market Highlights
• Financial Results
• 2012 Business Outlook
• Recent events
• Q & A

22Business Model - Thailand
REFIN
ERIES
&
GA
S SEPAR
ATIO
N PLA
NTS
SGP TERMINALS
&DEPOTS
SGP FILLING PLANTS
AGENT FILLING PLANTS
LPGRETAILERS
SGP AUTO-LPGSTATIONS
AGENT AUTO-LPGSTATIONS
MOTORISTS
HOUSEHOLDUSERS
COMMERCIALUSERS
INDUSTRIALUSERS
CO
OK
ING
AU
TOM
OTI
VEIN
DU
ST.
23Thailand LPG Market Highlights
• Economic slow down due to flood which had impact on LPG demand in inundated
areas started in late quarter 3 till quarter 4
• Competition in automotive segment was still intense
• Continuous trend of gasoline price increase (THB 1/lt on average QoQ) and tend to go
on in the following quarter
• Government’s policy in lifting prices of certain energy sources
– Price adjustment for cooking was still on hold
– Government still gave signal of LPG auto‐gas and NGV price increase
• LPG price lifted (monthly) – THB 0.41/lt in Jan’12 and THB 0.41/kg in Feb’12
• NGV price lifted (monthly) – THB 0.50/kg in Jan’12 and THB 0.50/kg in Feb’12
– The government has quarterly raised LPG price for industrial usage by THB 3/kg in Jul’11 and
THB 3/kg in Oct’11, and THB 3/kg in Jan’12 – and final THB 3/kg to go in Apr’12
– LPG price for Petrochemical Feed Stock was also lifted in Jan’12
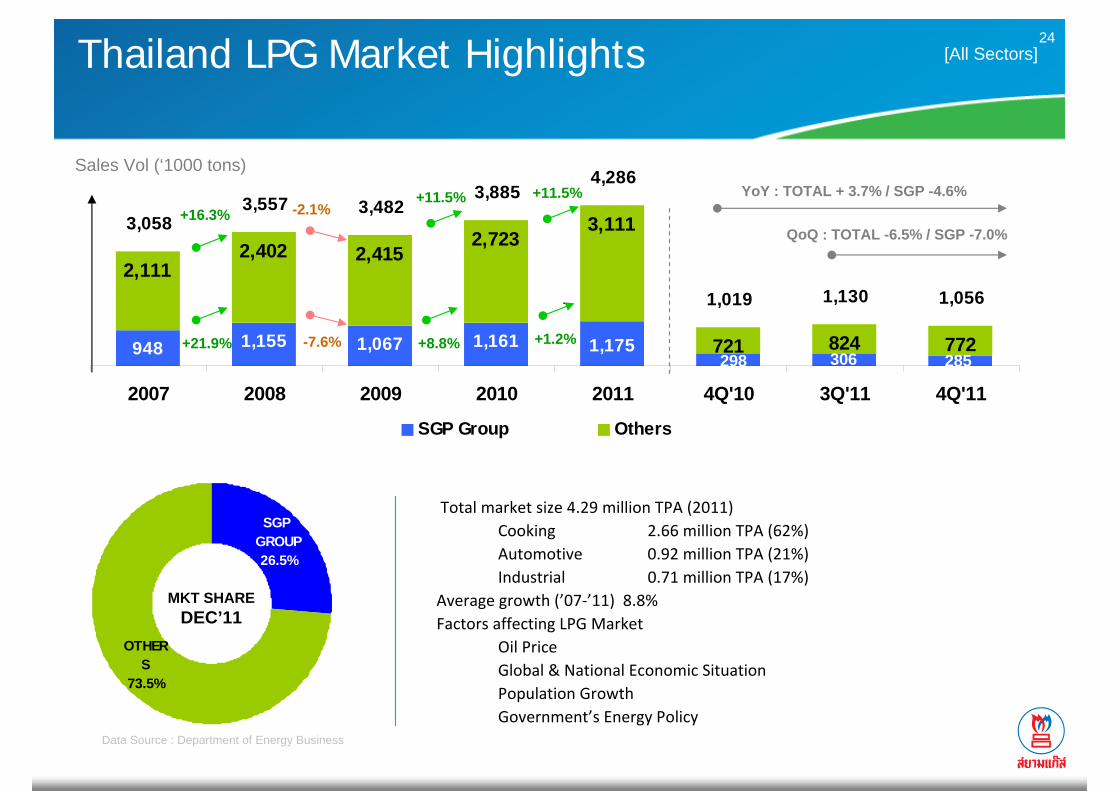
24
OTHERS
73.5%
SGP GROUP26.5%
Total market size 4.29 million TPA (2011)Cooking 2.66 million TPA (62%)Automotive 0.92 million TPA (21%)Industrial 0.71 million TPA (17%)
Average growth (’07‐’11) 8.8%Factors affecting LPG Market
Oil PriceGlobal & National Economic SituationPopulation GrowthGovernment’s Energy Policy
Thailand LPG Market Highlights
948 1,155 1,067 1,161
2,1112,402 2,415
2,7233,111
721 824 772285306298
1,175
1,019 1,130 1,056
3,0583,557 3,482
3,8854,286
2007 2008 2009 2010 2011 4Q'10 3Q'11 4Q'11
SGP Group Others
z
[All Sectors]
MKT SHAREDEC’11
Data Source : Department of Energy Business
Sales Vol (‘1000 tons)YoY : TOTAL + 3.7% / SGP -4.6%
QoQ : TOTAL -6.5% / SGP -7.0%
+8.8%-7.6%+21.9%
+11.5%-2.1%+16.3%
+1.2%
+11.5%
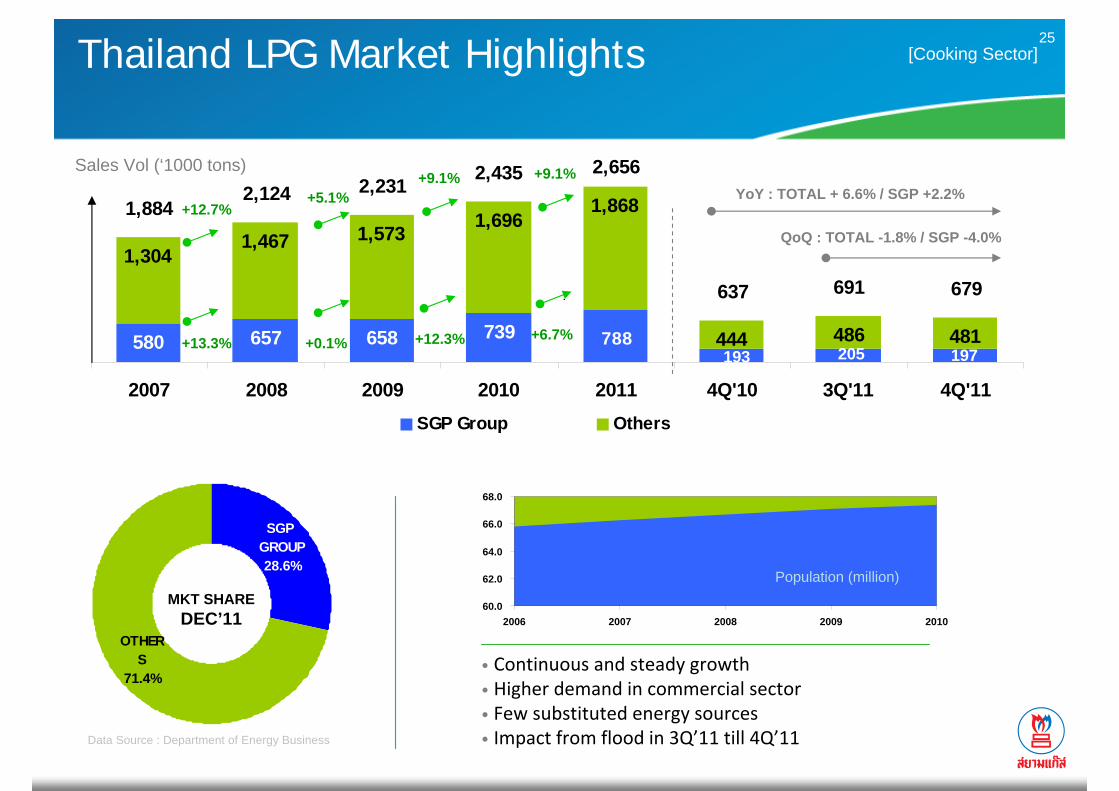
25
OTHERS
71.4%
SGP GROUP28.6%
580 657 658 739
1,3041,467 1,573 1,696
1,868
444 486 481197193 205
788
637 691 679
2,6562,4352,2312,1241,884
2007 2008 2009 2010 2011 4Q'10 3Q'11 4Q'11SGP Group Others
z
Thailand LPG Market Highlights [Cooking Sector]
MKT SHAREDEC’11
• Continuous and steady growth • Higher demand in commercial sector• Few substituted energy sources• Impact from flood in 3Q’11 till 4Q’11
60.0
62.0
64.0
66.0
68.0
2006 2007 2008 2009 2010
Population (million)
Sales Vol (‘1000 tons)
Data Source : Department of Energy Business
+12.3%+0.1%+13.3%
+9.1%+5.1%
+12.7%YoY : TOTAL + 6.6% / SGP +2.2%
QoQ : TOTAL -1.8% / SGP -4.0%
+6.7%
+9.1%

26
ENERGY UNIT RETAIL PRICE
CONS. KM/LT
COST THB/KM
NGV (Lifted THB 1.0/kg) THB/KG 9.50 10.69 0.89 LPG (Lifted THB 0.82/lt) THB/LT 12.12 7.41 1.64 LPG WORLD PRICE THB/LT 23.41 7.41 3.16 E85 THB/LT 23.68 6.13 3.86 GASOHOL 91 (E10) THB/LT 37.88 7.91 4.79 GASOHOL 95 (E10) THB/LT 39.63 7.91 5.01 UGR 91 THB/LT 40.91 8.76 4.67 ULG 95 THB/LT 45.26 8.76 5.17 NGV (After adj THB +6 /kg) THB/KG 14.50 10.69 1.36 LPG (After adj THB +5.75 /lt) THB/LT 17.05 7.41 2.30 LPG WORLD PRICE USD/TON 1,205.00 Mar-12FX THB/USD 30.50 Mar-12
266389
320 306
306
386346 374
193 170627275
277
644
110
185265 232
572
776666 680
920
2007 2008 2009 2010 2011 4Q'10 3Q'11 4Q'11
SGP Group Others
z
OTHERS
74.6%
SGP GROUP25.4%
Thailand LPG Market Highlights [Automotive Sector]
MKT SHAREDEC’11
Sales Vol (‘1000 tons)
• Rising oil price – growing LPG consumption• Competition was still intense.Data Source : Department of Energy Business
-4.4%-17.8%
+46.2%
+2.1%-14.1%+35.6%
-9.5%
+35.3%YoY : TOTAL + 25.3% / SGP -17.5%
QoQ : TOTAL -12.4% / SGP -13.6%

27
101 109 90 117 110
501 548 496
652 599
167 1452930 25121
198 174 146
602 658 585
769 709
2007 2008 2009 2010 2011 4Q'10 3Q'11 4Q'11
SGP Group Others
z
OTHERS
82.0%
SGP GROUP18.0%
Thailand LPG Market Highlights [Industrial Sector]
MKT SHAREDEC’11
Sales Vol (‘1000 tons)
• Price for indust’ usage has been lifted by THB 9/kg as of Mar’11 •Advantages of LPG (e.g.cleaner, lower R&M maintenance) are stillmajor factors affecting growth in spite of price shifted
• Expected continual growth of manufacturing sector • Minor impact on company’s sales from flood in 4Q’11Data Source : Department of Energy Business
+30.4%-18.1%+7.8%
+31.5%
-11.0%+9.3%
-5.5%
-7.8%YoY : TOTAL -26.1% / SGP -16.0%
QoQ : TOTAL -16.0% / SGP -12.7%
ENERGY UNIT PRICE (Exc.VAT)
HEATING VALUE (BTU)
PRICE/ Mil BTU
COAL THB/KG 2.70 23,003 117.38 NG THB/Mil BTU 340.00 1,000,000 340.00 LPG (Lifted by THB 9/kg) THB/KG 26.12 47,300 552.22 FUELOIL THB/LT 24.00 39,600 606.06 LPG WORLD PRICE THB/KG 40.18 47,300 849.52 DIESEL OIL THB/LT 31.73 36,700 864.58 LPG (After THB 12/kg lifted) THB/KG 29.12 47,300 615.64 LPG WORLD PRICE USD/TON 1,205.00 Mar-12FX THB/USD 30.50 Mar-12
28Agenda
• New perspective on SGP
• Current SGP’s major businesses
• Oversea LPG Market Highlights
• Thailand LPG Market Highlights
• Financial Results
• 2012 Business Outlook
• Recent events
• Q & A

29
20,163 19,445 22,000
38,096
5,6589,973 9,598
653
498
653
20,163 19,44522,653
38,594
6,312
9,973 9,598
2008 2009 2010 2011 4Q10 3Q11 4Q11
Core Revenue Gain on Business Acquisition
Financial Highlights - Revenue
REVENUEMillion Baht
-3.6%+16.5%
+70.4%
Core: YoY +69.6%
QoQ – 3.8%
YoY +52.1%
Core:+13.1%
Core:+70.4%
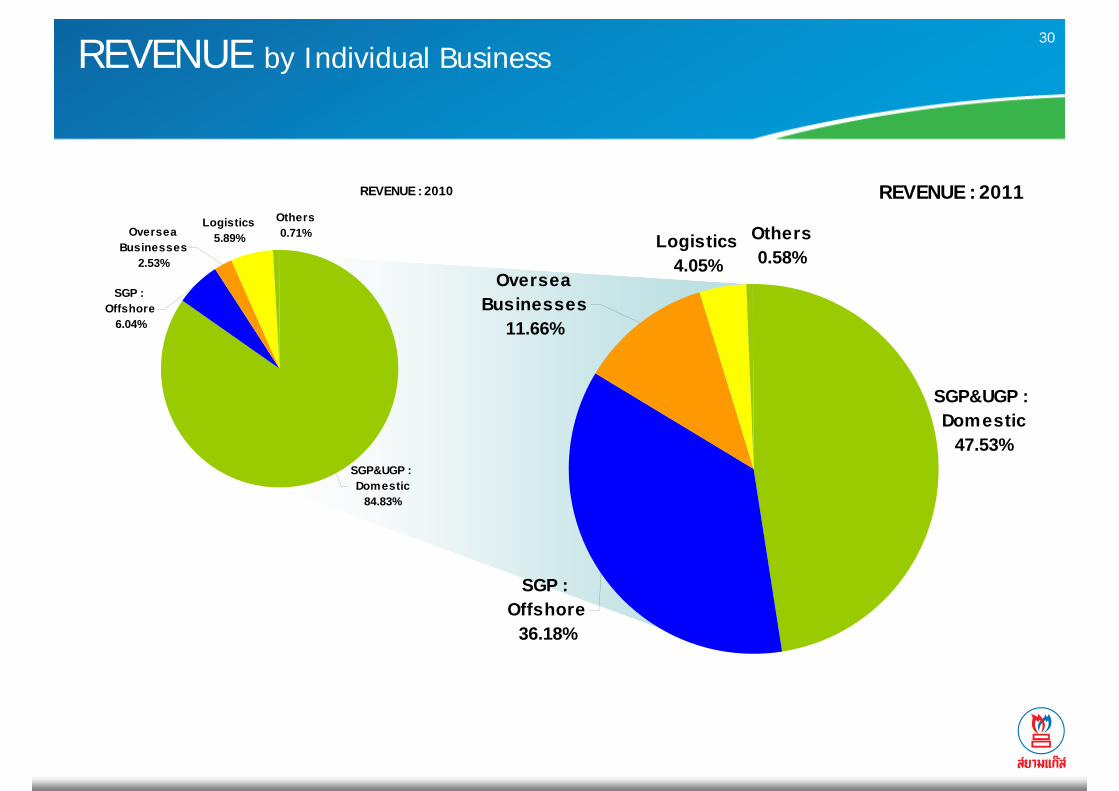
30REVENUE by Individual Business
REVENUE : 2010
SGP&UGP : Domestic
84.83%
Oversea Businesses
2.53%
Logistics5.89%
Others0.71%
SGP : Offshore
6.04%
REVENUE : 2011
SGP : Offshore
36.18%
Others0.58%
Logistics4.05%
Oversea Businesses
11.66%
SGP&UGP : Domestic
47.53%

31
1,9872,229 2,213
1,892
570297 378
653
498
653
1,9872,229
2,866
2,391
1,224
297 378
2008 2009 2010 2011 4Q10 3Q11 4Q11
Core EBITDA Gain on Business Acquisition
Financial Highlights - EBITDA
EBITDAMillion Baht
+12.2%
+28.6%-16.6%
YoY – 69.1%
QoQ +27.2%
Core: YoY – 33.7%-0.7%
-14.5%
32
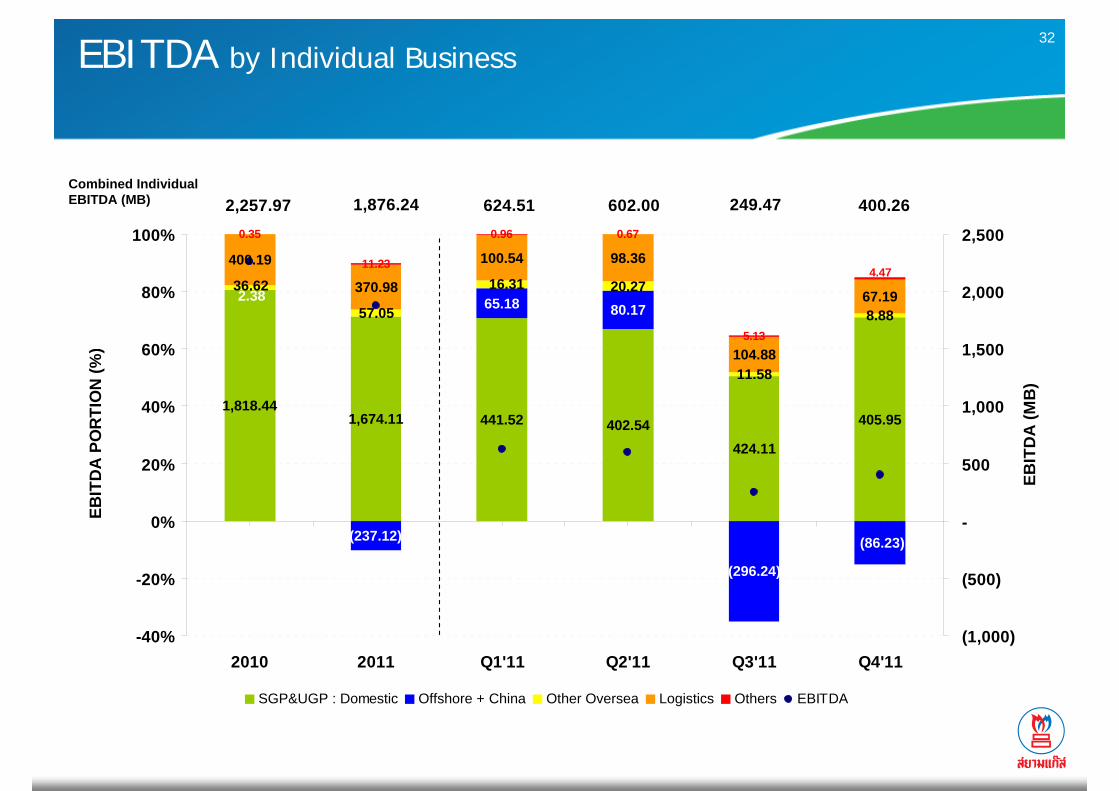
1,818.441,674.11 441.52 402.54
424.11
405.95
65.18 80.17
(86.23)
57.05
20.27
11.58
8.88
400.19
370.98
100.54 98.36
104.88
67.19
0.35
11.23
0.96 0.67
5.13
(296.24)
(237.12)
2.3816.3136.62
4.47
2,257.97 1,876.24 624.51 602.00 249.47 400.26
-40%
-20%
0%
20%
40%
60%
80%
100%
2010 2011 Q1'11 Q2'11 Q3'11 Q4'11
EBIT
DA
PO
RTI
ON
(%)
(1,000)
(500)
-
500
1,000
1,500
2,000
2,500
EBIT
DA
(MB
)
SGP&UGP : Domestic Offshore + China Other Oversea Logistics Others EBITDA
EBITDA by Individual Business
Combined IndividualEBITDA (MB)
33
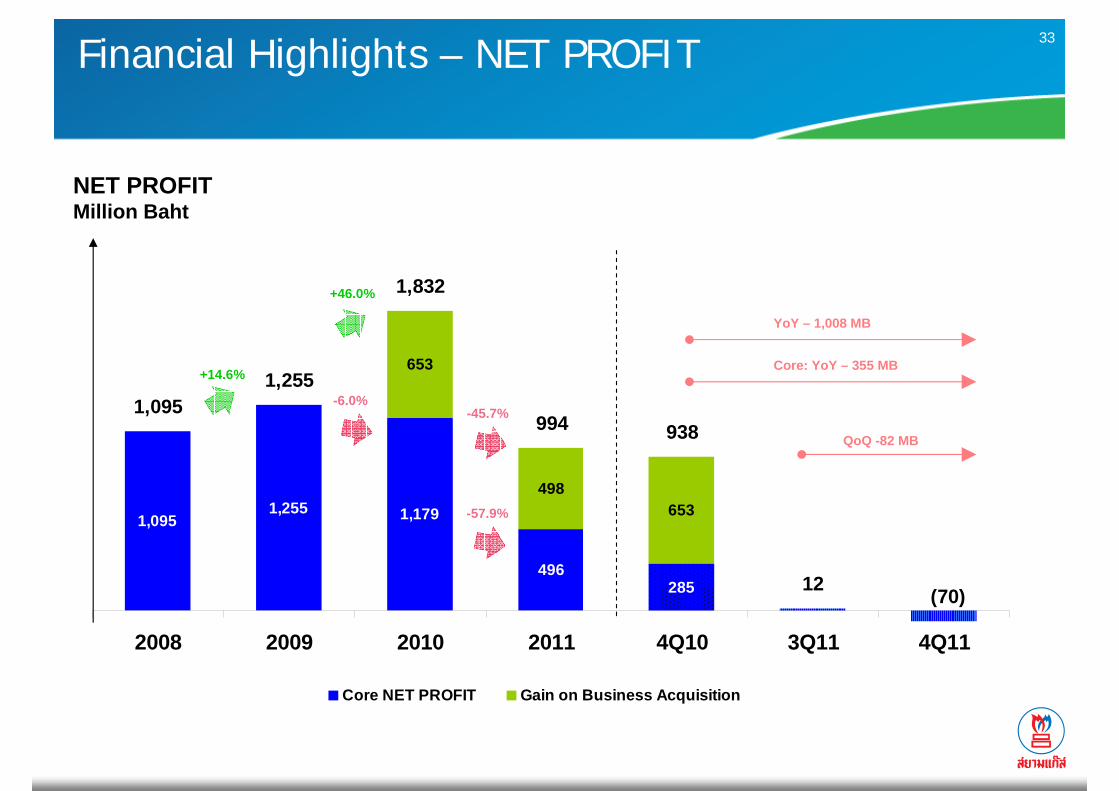
1,0951,255 1,179
496285
653
498653
1,0951,255
1,832
994 938
12 (70)
2008 2009 2010 2011 4Q10 3Q11 4Q11
Core NET PROFIT Gain on Business Acquisition
Financial Highlights – NET PROFIT
NET PROFITMillion Baht
+14.6%
+46.0%
-45.7%
YoY – 1,008 MB
QoQ -82 MB
Core: YoY – 355 MB
-6.0%
-57.9%

34
Changes in Depreciation
369.17 415.90 451.22
671.610.77
0.979.08
51.83
369.94416.87
460.30
723.44
-
300
600
900
2008 2009 2010 2011
Depreciation Amortization
+46.93
MB
+43.43
+263.14
Mar’10 : +Super Gas
Dec’10 : +Sino Siam
Jun’11 : +SOGEL
Nov’10 : +Vessel & VLGC
Feb’09 : +Vessel
Oct’09 : +Vessel
Jun’10 : +Vessel
Jul’10 : +SingGasMajo
r bus
iness
expa
nsion
inve
stmen
t

35
62.20 43.63 66.59
424.93
-
150
300
450
2008 2009 2010 2011
Financial Cost
Changes in Financial Costs
MB
+22.96
+358.34Mar’10 : +Super Gas
Dec’10 : +Sino Siam
Jun’11 : +SOGEL
Nov’10 : +Vessel & VLGC
Feb’09 : +Vessel
Oct’09 : +Vessel
Dec’08 : +Land
Jun’10 : +Vessel
Jul’10 : +SingGas
-18.57
Major busin
ess exp
ansion in
vestm
ent
36
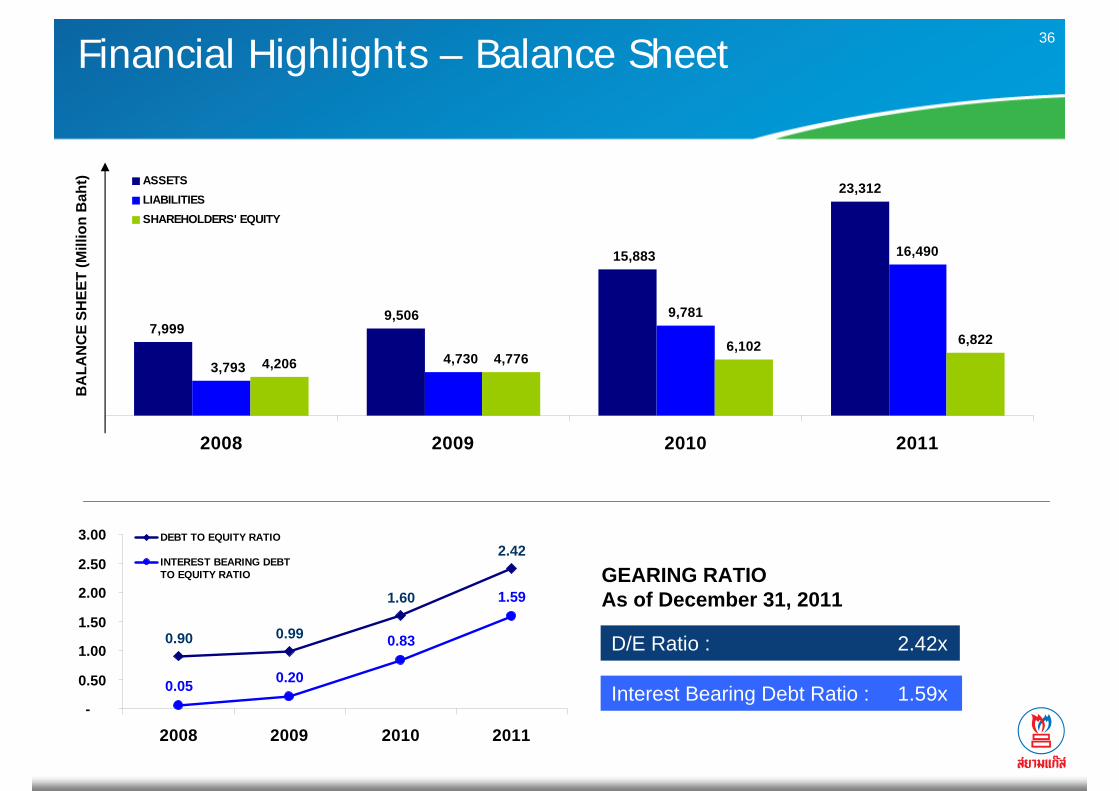
23,312
9,781
16,490
4,206 4,7766,102 6,822
15,883
9,5067,999
3,793 4,730
2008 2009 2010 2011
ASSETSLIABILITIESSHAREHOLDERS' EQUITY
Financial Highlights – Balance SheetB
ALA
NC
E SH
EET
(Mill
ion
Bah
t)
GEARING RATIOAs of December 31, 2011
D/E Ratio : 2.42x
Interest Bearing Debt Ratio : 1.59x
0.90 0.99
1.60
2.42
0.05 0.20
0.83
1.59
-
0.50
1.00
1.50
2.00
2.50
3.00
2008 2009 2010 2011
DEBT TO EQUITY RATIO
INTEREST BEARING DEBTTO EQUITY RATIO

37
• Dividend Policy– Not less than 40% of net profit after corporate income tax of the company’s
financial statement and after deduction of statutory reserve.
• Historical Dividend Payments
Dividend Payment
Interim, 0.15 Interim, 0.20 Interim, 0.20
Interim, 0.15
Final, 0.25
Final, 0.30 Final, 0.30 Final, 0.30
-
0.10
0.20
0.30
0.40
0.50
0.60
2008 2009 2010 2011
Div
iden
d (T
HB
)

38Agenda
• New perspective on SGP
• Current SGP’s major businesses
• Oversea LPG Market Highlights
• Thailand LPG Market Highlights
• Financial Results
• 2012 Business Outlook
• Recent events
• Q & A
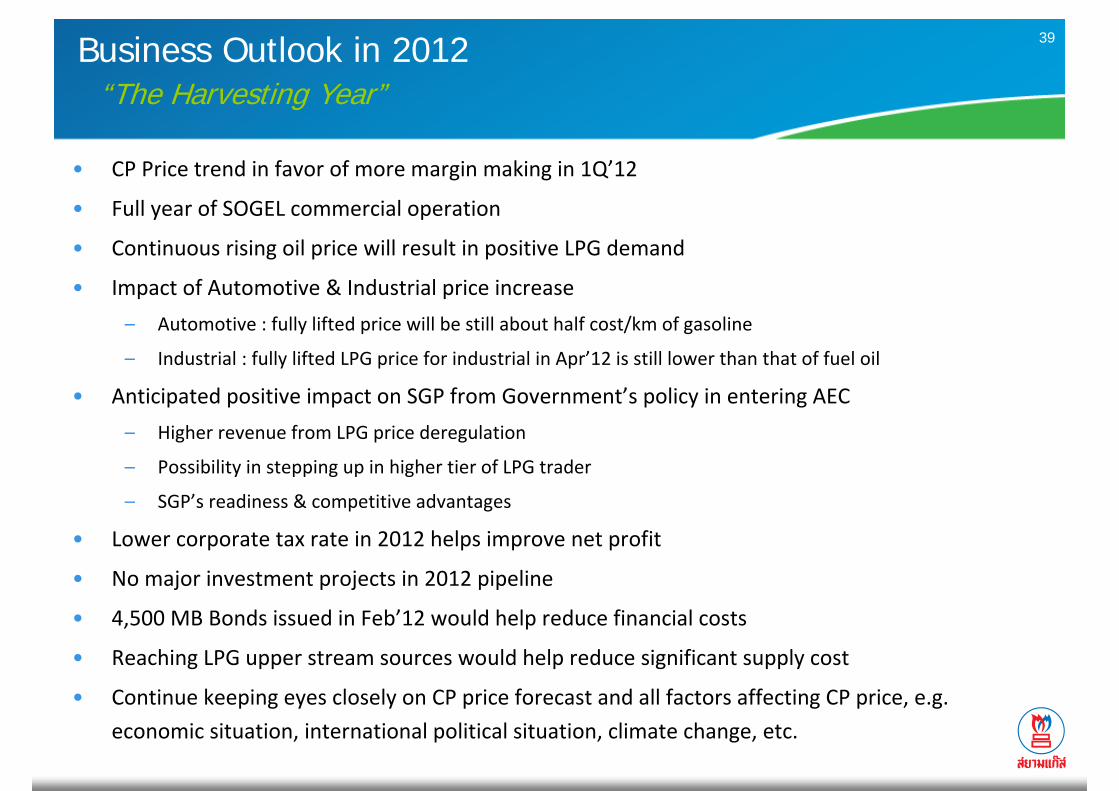
39Business Outlook in 2012“The Harvesting Year”
• CP Price trend in favor of more margin making in 1Q’12
• Full year of SOGEL commercial operation
• Continuous rising oil price will result in positive LPG demand
• Impact of Automotive & Industrial price increase
– Automotive : fully lifted price will be still about half cost/km of gasoline
– Industrial : fully lifted LPG price for industrial in Apr’12 is still lower than that of fuel oil
• Anticipated positive impact on SGP from Government’s policy in entering AEC
– Higher revenue from LPG price deregulation
– Possibility in stepping up in higher tier of LPG trader
– SGP’s readiness & competitive advantages
• Lower corporate tax rate in 2012 helps improve net profit
• No major investment projects in 2012 pipeline
• 4,500 MB Bonds issued in Feb’12 would help reduce financial costs
• Reaching LPG upper stream sources would help reduce significant supply cost
• Continue keeping eyes closely on CP price forecast and all factors affecting CP price, e.g.
economic situation, international political situation, climate change, etc.
40
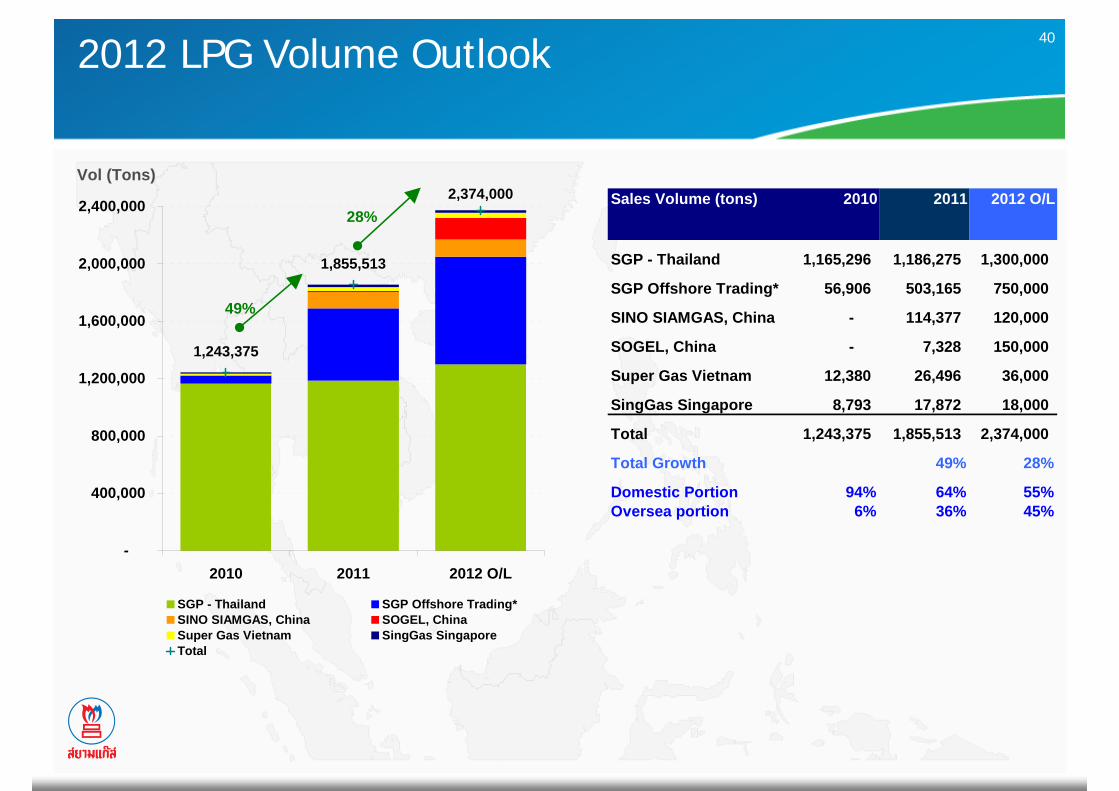
Sales Volume (tons) 2010 2011 2012 O/L
SGP - Thailand 1,165,296 1,186,275 1,300,000
SGP Offshore Trading* 56,906 503,165 750,000
SINO SIAMGAS, China - 114,377 120,000
SOGEL, China - 7,328 150,000
Super Gas Vietnam 12,380 26,496 36,000
SingGas Singapore 8,793 17,872 18,000
Total 1,243,375 1,855,513 2,374,000
Total Growth 49% 28%
Domestic Portion 94% 64% 55%Oversea portion 6% 36% 45%
1,243,375
1,855,513
2,374,000
-
400,000
800,000
1,200,000
1,600,000
2,000,000
2,400,000
2010 2011 2012 O/L
SGP - Thailand SGP Offshore Trading*SINO SIAMGAS, China SOGEL, ChinaSuper Gas Vietnam SingGas SingaporeTotal
28%
49%
2012 LPG Volume Outlook
Vol (Tons)
41Agenda
• New perspective on SGP
• Current SGP’s major businesses
• Oversea LPG Market Highlights
• Thailand LPG Market Highlights
• Financial Results
• 2012 Business Outlook
• Recent events
• Q & A

42SOGEL MOU Signing Ceremony Feb 18’12(SOGEL & Shantou Chenghai Hongsheng Petroleum Gas Co.,Ltd)

43SOGEL Grand Opening Ceremony – Mar 9’12

44
Questions are welcomedQuestions are welcomed !!
45
Investor Relations Contact
Siamgas and Petrochemicals Public Company Limited
498/997-999 Bobae Tower, Dumrongrak Road,
Klong-Mahanak, Pomprab-Satrupai, Bangkok
THAILAND 10100
Telephone : +662 628 1700-10 Ext 1589
Email : [email protected]
Website : www.siamgas.com
: www.facebook.com/siamgas