4q11 disclosure and results
TRANSCRIPT

1
Earnings Release | Conference Call – 4Q11 March 13th, 2012

2
Agenda
Ricardo Ribeiro
COO
Roberto Senna
CEO
Carlos Wollenweber
CFO | IR
4Q11 and 2011 Highlights
Operational Highlights
Financial Highlights

4Q11 2011
Launched PSV% Direcional
R$ million 428 1,447
Contracted PSV% Direcional
R$ million 367 1,230
Sales Over Supply (VSO) % PSV 31.8% 58.8%
Net Revenues R$ million 296 1,072
Adjusted Net Income² R$ million 48 199
Adjusted Net Margin² % 16.2% 18.5%
Main Figures
3
1
1
1. Considering the acquisition of 60% of the residential towers of Parque Ponta Negra project in 2Q11;
2. Adjusted by non-cash expenses (Stock-Options Program).

4
Significant growth with cash burn reduction
+37%
2011
1,072
2010
782
Net Operating Revenue
(R$ million)
Cash Burn¹
(R$ million)
2011
-38%
176
2010
283
1. Cash Burn: measured by the variation of the net debt, less capital increases, dividends and stock repurchase plan.
2011 2010 D %
Net Revenues R$ million 1,072 782 37%
Cash Burn¹ R$ million 176 283 -38%

5
“Residencial Macapaba” “Aterrado do Leme” “Residencial Meu Orgulho” – 2nd Phase
# Units
Segment
Housing PSV
Infrastructure PSV
5,384
MCMV – 1st Layer
R$ 272.6 MM
R$ 40.7 MM
Total PSV R$ 313.4 MM
Location Manaus - AM
Launch 3Q11
1,340
MCMV – 1st Layer
R$ 79.1 MM
R$ 79.1 MM
Rio de Janeiro - RJ
4Q11
2,148
MCMV – 1st Layer
R$ 117.8 MM
R$ 12.2 MM
R$ 130.0 MM
Macapá - AP
4Q11
Minha Casa, Minha Vida 1st Layer
2011: Total PSV of R$ 522.5 million, consisting of 8,872 units
# Units
Segment
Housing PSV
Infrastructure PSV
Total PSV
Location
Launch
# Units
Segment
Housing PSV
Total PSV
Location
Launch

6
Operational Highlights
Launches
Sales
Land Bank
Inventory
Ricardo Ribeiro
Operational Highlights

7
Launches
Launched PSV
(R$ million)
1.447
+36%
428
+3%
2011
793
522
131
2010
1.067
686
380
4Q11
218
209
4Q10
415
225
190
Development
MCMV 1st Layer
Project Acquisition
Launched PSV – Track Record
(R$ million)
783710
176
CAGR +69%
2011
1.447
1.316
131
2010
1.067
2009 2008 2007
Launched PSV
Project Acquisition
Total
(R$'000)
% Direcional
(R$'000)
1 Aterrado do Leme October Rio de Janeiro - RJ 79,060 79,060 1,340 1,340 MCMV 1st Layer
2 Parque Ponta Negra - 4th Phase October Manaus - AM 53,915 53,910 138 820 Upper-Middle
3 Condomínio Parque Silvestre - 2nd Phase October Rio de Janeiro - RJ 13,152 10,785 140 488 RET1
4 Bem Viver Residencial Clube November Ceilândia - DF 62,912 62,849 220 220 Medium
5 Verano Residencial - 2nd Phase November Belém - PA 19,064 19,045 92 539 Medium
6 Residencial Macapaba December Amapá - AP 130,037 130,037 2,148 4,148 MCMV 1st Layer
7 Grand Ville December São Bernardo - SP 53,038 41,104 264 528 Medium
8 Monte Rey December Belo Horizonte - MG 30,766 30,735 128 128 Medium
Total 441,944 427,525 4,470 8,211
# of Units
Launched
Total Units
(All Phases)Segment4Q11 Projects Date City - State
PSV

AM PA
AP
MG
SP RJ
Launches Breakdown
8
DF
13%
36%
40%
16%
29%
2%
49%
5%
30%
28%
1% 2% 8%
44%
46%
8% 7%
36%
4Q11 4Q10 2010 2011
Launches by Segment
(% PSV) 2
7
6
5
4
3
8
1 Launches by Region
(% PSV)
49%
21%
30% 30%
9%
61%
2010 4Q10 2011 4Q11
38%
33%
67%
47%
15%
Southeast North Midwest
Upper-Middle
Commercial MCMV 1st Layer
Low-Income
Medium

9
Sales
Sales by Segment
(% PSV)
2010
1,037
657
380
4Q11
158
209
4Q10
406
217
190
1,230
+19%
367
-10%
2011
619
522
89 Development
MCMV 1st Layer
Project Acquisition
Sales by Region
(% PSV)
661
441
127
CAGR +76%
2011
1,230
1,141
89
2010
1,037
2009 2008 2007
Development
Project Acquisition
13%11%
46%
18%
26%
6% 4%
2010
37%
30%
20%
4Q11
57%
2011
15%
22%
5% 1%
4Q10
47%
16%
25%
1%
MCMV 1st Layer
Low-Income
Medium
Upper-Middle
Commercial
Sales by Segment
(% PSV)
Sales by Region
(% PSV)
4%
37%
4Q10
19%
15%
66%
2011
65%
9%
26%
2010
47%
19%
34%
4Q11
59% Midwest
Southeast
North

10
Sales Speed
4Q11
31.8%
18.5%
3Q11
36.7%
16.0%
2Q11
18.5%
1Q11
22.1%
4Q10
38.3%
27.6%
With MCMV 1st Layer projects
Without MCMV 1st Layer projects
Sales-Over-Supply Ratio (VSO)
(In Total PSV - %)
4Q10 93% 87% 4%
1% 1Q11 81% 48% 21% 9% 3%
2Q11 58% 20% 20% 18%
3Q11 92% 90%
2%
4Q11 85%
3M 6M 9M 12M 15M
10%
17%
4Q11 33%
3Q11
11%
2Q11
25% 1Q11
3% 2010
<2010
Sales by Period of Launching – 4Q11
(% PSV – Ex MCMV 1st Layer)
Sales Speed
(% Units)
67% of sales in 4Q11 refers to sales of inventory;
17% of PSV sold refers to projects launched before 2010.

11
Land Bank
60.7% large scale projects (more than 1,000 units);
53.3% in the North and Midwest regions;
53.0% projects in the low-income segment;
46.6% are eligible for the MCMV program.
R$ 6,9 Billion
66.906 units ES 2%
AM 14%
MG 38%
RO 5%
SP 6%
PA 13%
DF 21%
RJ 1%
Land Bank by Segment
(% PSV)
Low-Income 53%
Upper-Middle
7%
Medium 35%
Commercial 5%
Landbank Changes 2011
(PSV R$ million)
6,948 +191
2011 Launches
805
Review of
Assumptions
416
Acquired
Land Bank
581
2010
6,757
Land Bank by Region
(% PSV)
In 2011, Direcional
acquired six lots with
PSV of R$ 581 million;
Type of Payment
(2011 – % PSV)
Swap
99.76% Cash 0.24%

12
Inventory
7% of PSV are finished units;
89,1% of units under construction have already been sold.
12.2% 2009
<2009 7.3%
7.9%
22.8%
Finished Units
2011
49.7%
2010
64% North
11%
Southeast 25%
Midwest
Inventory by Region
(% PSV)
Inventory by Period of Launching
(% PSV)
Under Construction 668,461 92.7% 3,704 93.7%
Finished Units 52,536 7.3% 247 6.3%
Total Inventory 720,997 100.0% 3,951 100.0%
% Total Units in Inventory % TotalInventoryPSV in Inventory
% Direcional (R$'000)

13
Financial Highlights
Financial Performance
Liquidity Ratios
Cash Burn
Deferred Results
DIRR3 Stock Analysis
Carlos Wollenweber
Financial Highlights

14
Financial Highlights
782
296298263
-0.6%
+12.4%
1,072
37.1%
2011 2010 4Q11 3Q11 4Q10
CAGR +80%
2011
1,072.3
2010
781.9
2009
377.6
2008
263.2
2007
102.3
Net Revenue
(R$ million)
Net Revenues - Track Record
(R$ million)
2115
130%
450%
2011
269
25%
2010
117
14%
4Q11
82
27%
3Q11
72
24%
2Q11
58
23%
1Q11
57
24%
4Q10
48
18%
3Q10
33
15%
2Q10
12%
1Q10
10%
Revenue from Services - Track Record
(R$ million)
MCMV 1st Layer
96.0% Brokerage Fee
1.8%
Management
2.3%
Breakdown of Revenue from Services
(in 2011 - %)
Revenue from Services % Net Revenue
15
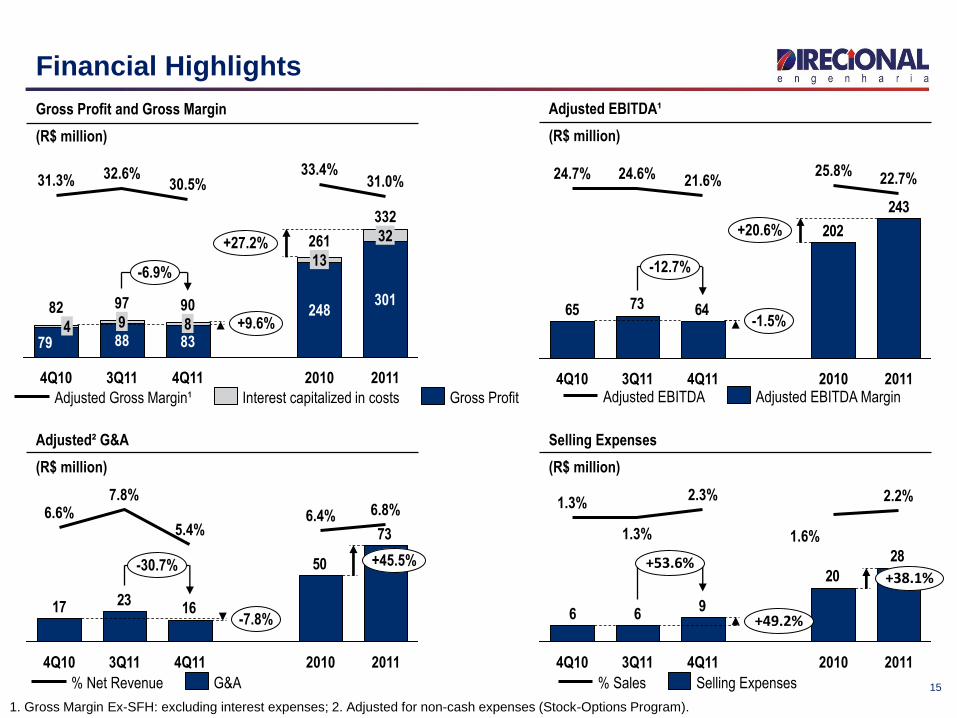
Financial Highlights
1. Gross Margin Ex-SFH: excluding interest expenses; 2. Adjusted for non-cash expenses (Stock-Options Program).
-6.9%
+9.6%
+27.2%
2011
332
301
32
31.0%
2010
261
248
13
33.4%
4Q11
90
83 8
30.5%
3Q11
97
88 9
32.6%
4Q10
82
79 4
31.3%
Gross Profit Interest capitalized in costs Adjusted Gross Margin¹
Gross Profit and Gross Margin
(R$ million)
73
50
162317
-30.7%
-7.8%
+45.5%
2011
6.8%
2010
6.4%
4Q11
5.4%
3Q11
7.8%
4Q10
6.6%
G&A % Net Revenue
28
20
966
+53.6%
+49.2%
+38.1%
2011
2.2%
2010
1.6%
4Q11
2.3%
3Q11
1.3%
4Q10
1.3%
Selling Expenses % Sales
Adjusted² G&A
(R$ million)
Selling Expenses
(R$ million)
243
202
647365
-12.7%
-1.5%
+20.6%
2011
22.7%
2010
25.8%
4Q11
21.6%
3Q11
24.6%
4Q10
24.7%
Adjusted EBITDA Adjusted EBITDA Margin
Adjusted EBITDA¹
(R$ million)

16
Financial Highlights
1. Adjusted by non-cash expenses (Stock-Options Program).
199176
485951
-19.4%
-5.7%
+12.6%
2011
18.5%
2010
22.6%
4Q11
16.2%
3Q11
20.0%
4Q10
19.3%
2011
199
18.5%
2010
176
22.6%
2009
85
22.5%
2008
64
24.5%
2007
22
21.1%
CAGR +74%
Adjusted Net Income¹
(R$ million)
Net Income - Track Record
(R$ million)
Adjusted Net Income Adjusted Net Margin Adjusted Net Income Adjusted Net Margin

17
Cash, Debt and Cash Burn
Net Debt
Without SFH
-285.5
Net Debt
122.0
Cash and Cash
Equivalent
351.1
Gross Debt
473.2
SFH
407.6
65.6
Debt
(R$ million)
SFH 92.6%
FINAME and others
3.0%
Working Capital
4.7%
Loans and Financing Ex-Securitization
(%)
Cash and Debt 4Q11 3Q11 4Q10 D % D %
(R$'000) (a) (b) (c) (a/b) (a/c)
Loans and Financing 473,152 437,708 302,374 8.1% 56.5%
SFH 407,563 372,640 226,056 9.4% 80.3%
Receivables Securitization 31,847 35,273 46,843 -9.7% -32.0%
FINAME and others 13,076 9,480 8,882 37.9% 47.2%
Working Capital 20,666 20,315 20,593 1.7% n/a
Cash and Cash Equivalents 351,112 343,618 190,852 2.2% 84.0%
Net debt 122,040 94,090 111,522 29.7% 9.4%
Net debt / Equity 9.9% 7.9% 13.5% 0.0% 0.0%

18
Cash Burn
2Q11
34.0
1Q11
62.6
4Q10
100.9
3Q10
86.3
2Q10
-46.3%
1Q10
41.2
4Q09
32.7
3Q09
22.5
2Q09
25.3
1Q09
14.5
-72.5%
4Q11
27.7
3Q11
51.6 54.9
-37.9%
2011
175.9
2010
283.3
2011
122.0
Cash
4.9
155.4
Gross Debt
170.8
2010
111.5
351.1
+84%
2011 Operational
4.9
Stock
repurchase
plan
15.8
Dividends
40.3
Net
Follow-on
221.3
2010
190.9
Cash Burn¹
(R$ million)
Net Debt – Track Record
(R$ million)
Change in Cash
(R$ million)
1. Cash Burn: measured by the variation of the net debt, less capital increases, dividends and stock repurchase plan.

19
Deferred Results
Deferred Results Estimated Schedule
(%)
2014
1%
2013
22%
2012
77%
Deferred Results
(R$ million)
+12.1%
560 +34.7%
4Q11
334
226
3Q11
500
329
171
4Q10
416
327
89
Development
MCMV 1st Layer projects
Deferred Results Consolidated (R$'000) 4Q11 3Q11 4Q10 D % D %
(a) (b) (c) (a/b) (a/c)
Deferred results Consolidated (1+2) 560,382 499,703 415,909 12.1% 34.7%
Deferred revenues 1,482,460 1,325,614 1,022,801 11.8% 44.9%
Deferred results - Margin 37.8% 37.7% 40.7% 0.1 p.p. -2.9 p.p.
Deferred results Development (1) 334,100 328,803 326,813 1.6% 2.2%
Deferred revenues 775,531 773,964 751,614 0.2% 3.2%
Deferred results - Margin 43.1% 42.5% 43.5% 0.6 p.p. -0.4 p.p.
Deferred results MCMV 1st Layer projects (2) 226,282 170,899 89,096 32.4% 154.0%
Deferred revenues 706,928 551,651 271,186 28.1% 160.7%
Deferred results - Margin 32.0% 31.0% 32.9% 1.0 p.p. -0.8 p.p.

0
20
40
60
80
100
120
140
160
-
1,000
2,000
3,000
4,000
5,000
6,000
7,000
8,000
9,000
10,000
19
-no
v-0
9
8-d
ez-0
9
28
-dez
-09
15
-jan
-10
3-f
ev-
10
23
-fe
v-1
0
11
-mar
-10
29
-mar
-10
15
-ab
r-1
0
4-m
ai-1
02
0-m
ai-1
0
9-j
un
-10
28
-ju
n-1
0
15
-ju
l-1
0
4-a
go-1
0
24
-ago
-10
20
-set
-10
8-o
ut-
10
27
-ou
t-1
0
18
-no
v-1
0
6-d
ez-1
0
27
-dez
-10
13
-jan
-11
1-f
ev-
11
17
-fe
v-1
1
9-m
ar-1
1
25
-mar
-11
12
-ab
r-1
1
2-m
ai-1
1
18
-mai
-11
3-j
un
-11
21
-ju
n-1
1
8-j
ul-
11
26
-ju
l-1
1
11
-ago
-11
29
-ago
-11
15
-set
-11
3-o
ut-
11
20
-ou
t-1
18
-no
v-1
1
25
-no
v-1
1
13
-dez
-11
29
-dez
-11
17
-jan
-12
3-f
ev-
12
23
-fe
v-1
2
Pre
ço d
a A
ção
Vo
lum
e (
R$
mil)
Volume (R$ '000)
0
20
40
60
80
100
120
140
160
-
1,000
2,000
3,000
4,000
5,000
6,000
7,000
8,000
9,000
10,000
18
-No
v-0
9
7-D
ec-0
9
23
-De
c-0
9
14
-Jan
-10
2-F
eb
-10
22
-Fe
b-1
0
10
-Mar
-10
26
-Mar
-10
14
-Ap
r-1
03
-May
-10
19
-May
-10
8-J
un
-10
25
-Ju
n-1
0
14
-Ju
l-1
0
3-A
ug-
10
23
-Au
g-1
0
15
-Se
p-1
0
7-O
ct-1
02
6-O
ct-1
0
12
-No
v-1
0
3-D
ec-1
0
23
-De
c-1
0
12
-Jan
-11
31
-Jan
-11
16
-Fe
b-1
1
4-M
ar-1
1
24
-Mar
-11
11
-Ap
r-1
1
29
-Ap
r-1
1
17
-May
-11
2-J
un
-11
20
-Ju
n-1
1
7-J
ul-
11
25
-Ju
l-1
1
10
-Au
g-1
1
26
-Au
g-1
11
4-S
ep
-11
30
-Se
p-1
1
19
-Oct
-11
7-N
ov-
11
24
-No
v-1
1
12
-De
c-1
1
28
-De
c-1
1
16
-Jan
-12
2-F
eb
-12
22
-Fe
b-1
2
9-M
ar-1
2
Sto
ck P
erf
orm
ance
Vo
lum
e (
R$
'00
0)
Average Volume (21 days) Ibovespa IMOB Direcional
20
Shares Performance Since IPO

21
Disclosure
This presentation contains certain forward-looking statements concerning the business prospects,
projections of operating and financial results and growth potential of the Company, which are based on
management’s current expectations and estimates of the future performance of the Company. Although the
Company believes such forward-looking statements are based on reasonable assumptions, it can give no
assurance that its expectations will be achieved. Expectations and estimates that are based on the future
prospects of the Company are highly dependent upon market behavior, Brazil’s political and economic
situation, existing and future regulations of the industry and international markets and, therefore, are
subject to changes outside the Company’s and management’s control. The Company undertakes no
obligation to update any information contained herein or to revise any forward-looking statement as a result
of new information, future events or other information.

22
Contacts
Carlos Wollenweber CFO | IR Officer
Lucas Bousas IR Analyst
Paulo Sousa IR Analyst
www.direcional.com.b/ri
(55 31) 3214-6200
(55 31) 3214-6450