service quality evaluation model of automated teller
TRANSCRIPT
Journal of Economics and Management, 2018, Vol. 14, No. 2, 173-190
Service Quality Evaluation Model of Automated
Teller Machines Using Statistical Inference and
Performance Evaluation Matrix
Kuen-Suan Chen
Department of Industrial Engineering and Management, National Chin-Yi
University of Technology, Taiwan
and
Institute of Innovation and Circular Economy, Asia University, Taiwan
Wen-Chih Chiou
Department of Business Administration, National Chin-Yi University of Technology,
Taiwan
Mei-Hua Ko
Department of Business Administration, National Chin-Yi University of Technology,
Taiwan
Automated teller machines (ATMs) provide customers with safe and efficient
financial services round-the-clock, while simultaneously reducing operating costs.
They have consequently become an integral aspect of financial service systems
across the world. Clients’ satisfaction with ATM service is an important concern for
these firms. High-quality service provision necessitates analysis of factors
underlying service failure. This paper uses a questionnaire survey to aggregate
customer responses regarding their use of ATMs and their overall satisfaction
toward this experience, and then employs a simple regression model to explore how
individual service items affect their overall satisfaction. Lastly this paper presents an
influence index which, combined with the satisfaction index, allows for the
construction of a performance evaluation matrix. This paper also uses the mean of
Correspondence to: Department of Industrial Engineering and Management, National Chin-Yi
University of Technology. No.57, Sec. 2, Zhongshan Rd., Taiping Dist., Taichung 41170, Taiwan (R.O.C.);
Tel: +886 4 23924505; Fax: +886 4 23923363; E-mail addresses: [email protected].
174 Journal of Economics and Management
the two indices to create dynamic standards for ongoing quality management.
Statistical inference is conducted to obtain interval estimations regarding both
indices in order to counter the uncertainty of service quality evaluation caused by
sampling error. Using this criterion, financial market operators can determine the
standard of their service quality, as well as outline strategies for improvement.
Keywords: financial service industry, automated teller machine, performance
evaluation matrix, statistical inference
JEL classification: C44
1□Introduction
Since the ban on the establishment of private banks and banking centers in Taiwan
was lifted in 1990, financial institutions have proliferated. This has led to
overbanking, which has made it increasingly difficult for financial institutions to
maintain their profit margins. This fierce competition has led these firms to vie for
the attention of their customers with an ever-wider array of financial services. In
addition, today’s customers are accustomed to the application of web-based and IT
services in the majority of industries, which in turn increases their demand. This has
led to mounting overheads through increasing software and hardware installation
costs, which encourages financial market operators to accelerate orchestration of
these services. The simultaneity and optimized convenience provided by this
web-based platform (i.e., electronic banking) can reduce operating expenses and
increase opportunities for market expansion.
Electronic banking comprises phone banking, mobile banking, internet banking,
and ATM distribution services. According to statistics published by the Banking
Bureau of Financial Supervisory Commission, in 2016 there were 27,240 ATMs
nationwide, which were used approximately 845 million times a year, totaling TWD
10.36 trillion in transactions. In terms of the number of ATMs, frequency of
transactions, and transactional amount, there was a growth of 38% from 2003. This
suggests the highest per capita density of ATMs across Taiwan. The popularity of
ATMs heralds an unprecedented era of convenience in physical financial services
for Taiwanese people, and indicates that Taiwanese consumers rely on ATMs to
Service Quality Evaluation Model of Automated Teller Machines 175
conduct their daily financial affairs. Furthermore, ATMs are installed to enable a
bank’s customers to independently perform transactions, such as cash withdrawals
or deposits, fund transfers, or checking account information without the need for
direct interaction with bank staff, thereby reducing the operating expenses incurred
in a financial institution. According to a result released by the United States
Department of Commerce, a transaction performed via an ATM costs USD 0.27,
whereas an over-the-counter transaction amounts to USD 1.02. ATMs are therefore
cost-effective. However, the principal driving force behind ATMs is the provision of
24-hr service. The brand identity and market exposure of a bank can be thus
enhanced, which contributes toward to an increasing market share and business
sustainability.
Faced with tough competition and a shrinking market, today’s financial
institutions need to employ diversified management strategies in order to achieve
continuous growth and sustainability. According to Ahujaet and Khamba (2008),
Cornuel (2007) and Voehl (2004), quality improvement has recently become a
leading trend for organizational management and a key factor in a firm’s success.
Looking back at the past, in which the industry was focused on manufacturing, we
can see that the concept and technology of product quality expanded from the
manufacturing industry, making pricing to be the most useful weapon in competition.
In contrast, service quality is becoming increasingly important in the
service-oriented industry of today (Vargo and Lusch, 2004) and is regarded as the
key factor to obtaining competitive advantage in servitized industries (Huang et al.,
2017; Lee et al., 2000). In light of current conditions, it is imperative that financial
institutions evaluate customer satisfaction with their ATM experience and determine
which factors lead to inadequate service. This allows for the formulation of
strategies to improve service quality and achieve long-term sustainable
development.
There exists a wide array of quality evaluation tools. Among them, the
performance evaluation matrix proposed by Lambert and Sharma (1990) provides a
useful reference for performance improvement. It has been widely utilized to
appraise service quality. Hung et al. (2003), Tao et al. (2009), Hsia et al. (2009),
Chen (2009), Chen et al. (2010), and Lai (2011) have constructed performance
evaluation matrices to explore which service items are deemed by customers as
176 Journal of Economics and Management
important and currently unsatisfactory. This serves as a reliable reference for the
improvement of service quality. Although the above studies helped firms discover
inadequate service items via the performance evaluation matrix, they failed to
present how individual service items affect customer satisfaction overall. This
impedes efforts to increase service quality, especially within the context of limited
resources. Moreover, these studies collected responses from customers about how
they felt or how much they valued a firm’s performance, which increased error in
the appraisal of firm performance, and led to an elevated risk of unsuitable
improvement strategies.
As mentioned previously, the present paper addressed this problem via
questionnaire survey in which customers self-reported their satisfaction with each
service item provided by ATMs, as well as their overall satisfaction experience.
Obviously, this approach requires one less group of samples to be collected and
increases the willingness of subjects to fill out the questionnaire and therefore the
authenticity of the data they provide. One source of error is eliminated, which
decreases the estimation error for service quality and thereby increased precision. In
addition, we utilized the simple regression model employed by Yu et al. (2016) to
explore the effect of satisfaction toward individual service item on overall
satisfaction levels. These results were used to construct an influence index, which
was combined with the satisfaction index to construct a performance evaluation
matrix. Since the indices were obtained through the collection of customer voices,
we made statistical inferences to obtain interval estimations for the indices, in order
to reduce uncertainty associated with sampling error. The resulting performance
evaluation matrix serves as valuable reference for financial market operators in the
formulation of strategies to enhance service quality. The rest of this paper is
organized as follows. The satisfaction index h
and influence index 1h for
individual service item are shown in Section 2. The interval estimations for h
and
1h are derived in Section 3. In Section 4, the performance evaluation matrix is
constructed to evaluate the service quality of ATMs. A numerical example
application of the model is presented in Section 5. Our conclusions are presented in
the last section.
Service Quality Evaluation Model of Automated Teller Machines 177
2□Evaluation Index
Service quality has long been regarded as a critical factor of optimized sustainable
management and competitive advantage (Lee et al., 2000). Services do not share
attributes with physical products; they are therefore defined and measured
differently. Parasuraman et al. (1985) pointed out that customer service quality can
be measured through customers’ expectations for the service and their perceived
impression (or satisfaction) of this service afterwards. Etzel et al. (2001) similarly
proposed that service quality refers to how one’s actual experience compares to
one’s expectations. In other words, service quality refers to the gap that exists
between customer satisfaction and how much they value the service in terms of
individual service items. A large number of researchers have used the
five-dimensional SERVQUAL, presented by Parasuraman et al. (1988), to gauge the
service quality of industries and institutions.
Conversely, Bolton and Lemon (1999), and Churchill and Surprenant (1982)
declared service quality was a comprehensive attitude held by customers toward
service providers. They stressed the basis of service quality lies in customer
experience, not expectations. Bolton and Drew (1991) also advocated a more direct
method of investigating customers’ perceptions, known as “patron experience”.
Oliver (1981) asserted that customer satisfaction is an emotive response elicited in
customers toward a product or service, which is formed in the process of its
perception. Wang et al. (2015) professed that when patrons are given a questionnaire
survey, they have an expectation of service, the actual experience of service, and a
fixed impression of that experience afterward. In this regard, customer satisfaction
level can be taken as an emotive response and feedback to a service experience.
Fornell (1992) observed that service quality exerts a positive impact on customer
satisfaction, while an increasing number of researchers have confirmed a high
cross-correlation between customer satisfaction and service quality.
To sum up, customer satisfaction is defined as a kind of feedback that involves
customers’ prior expectations and actual experience when that service was rendered.
Mazis et al. (1975) and Woodruff et al. (1983) unanimously recommended using
customer satisfaction as a benchmark to measure firm performance and service
quality. In view of this, this paper adopted customer satisfaction as the gauge for
178 Journal of Economics and Management
ATM service quality. This not only spared us extra efforts to collect one more
sample (guaranteeing customer willingness to fill in the questionnaire and the
authenticity of the information supplied by them), but led to a decrease in the chance
of error in evaluation. Ultimately the inferred value might be more accurate than
before.
2.1□Satisfaction Index
As mentioned earlier, customer satisfaction and service quality are positively
correlated; therefore, the former can be used as a gauge for the latter’s performance.
The mean of customer satisfaction can thus be utilized as a measurement benchmark,
as it has been widely used to perform analyses in social science research. Hence, this
paper utilized the sample mean to develop an index with which to appraise customer
satisfaction with ATM service. Random variable h
X denotes the satisfaction level
for question h , along with a k -point scale measuring customer satisfaction. Our
method is described below:
1
1
h
th
XX
k
.
The expected value, th hE X , of random variable
thX was taken as the
satisfaction index. Therefore, h
is expressed as follows:
1
1
h
hk
, (1)
where h th hE X . To prevent loss of generality, we assumed the number of
randomly sampled individuals to be n , and their satisfaction toward service item
h is 1, , , ,
h hj hnX X X . Clearly
1, , , ,
h hj hnX X X were randomly selected for
random variable h
X , when h
X and hs denote the sample mean and sample
standard deviation, respectively. They are expressed below:
1
1 n
h hj
j
X Xn
, (2)
2
1
1
1
n
h hj h
j
s X Xn
. (3)
Service Quality Evaluation Model of Automated Teller Machines 179
Then, according to Eqs. (2) and (3), the estimate of satisfaction index h
can be
obtained as follows:
1ˆ1
h
h
X
k
. (4)
ˆh
’s expectation value is h
, which suggests that ˆh
acts as the unbiased
estimator for h
. Equation (4) shows that when h
X k , then ˆ 1h
, denoting the
highest level of satisfaction with item h . In comparison, if 1h
X , then ˆ 0h
,
indicating the lowest level of satisfaction with item h . Satisfaction index h
therefore ranges from 0 to 1; i.e., 0 1h
.
2.2□Influence Index
Woodside et al. (1989) proffered that customer satisfaction is the overall attitude
exhibited by customers following consumption. Muller (1991) posited that customer
satisfaction exerts a significant impact on corporate image. Walters (1978) described
corporate image as the overall impression and perception held by customers of a
firm’s activities and performance. Chitturi et al. (2008), and Ha and Janda (2008)
ventured that customer satisfaction increases customers’ willingness to purchase that
product again and prompts these patrons to buy other products from the same
company. All in all, overall satisfaction with a company’s commodities or services
not only exerts a direct influence over corporate image and customer loyalty, but has
an indirect impact on customers’ repurchase intentions, ultimately holding sway
over a firm’s sustainable development and competitive edge.
Therefore customer satisfaction plays a pivotal role in corporate development.
It follows that improved customer satisfaction may increase a firm’s service quality
and operating performance, as well as their market share and competitive advantage.
Because customers have different needs, a company must provide a diversified
range of service items to satisfy their patrons. Customer satisfaction is a
comprehensive rating by customers of the firm (service provider), and thus can be
seen as “total satisfaction” (Chen et al., 2015). In light of this, the questionnaire
survey distributed by this paper was not only aimed at exploring customers’
satisfaction with individual service items, but their total satisfaction as well. By so
180 Journal of Economics and Management
doing, we may further scrutinize how an individual service item affects the rating of
total satisfaction. To address this issue, Chen and Chen (2014) posited that a simple
regression model is more appropriate when there is a high level of relevancy
between independent variables. Yu et al. (2016) developed a simple regression
model of h
X , the satisfaction with item h , and Y , overall satisfaction, all of
which act as influence indices. This was designed to prevent mutual interference
between items. This simple normal error regression model can be written as follows:
0 1j h h hj hjY X , (5)
where 1,2, ,h q ; j
Y is the dependent variable, and hj
X is the independent
variable (and a known constant). 0h
acts as the intercept parameter, and 1h as
the slope parameter, whilst hj acts as a random error, which complies with the
normal distribution meaning zero with a variance 2
h . Hence 2~ 0,
hj hN . From
Eq. (5), it is clear that a high value for 1h means that investing resources in the
service area covered by this item will greatly increase overall satisfaction (j
Y ). For
this reason, we employed 1h as influence index. However,
1h is an unknown
parameter, so the estimate of influence index 1h can be defined as follows:
1
12
1
ˆ
n
hj h j
j
h n
hj h
j
X X Y Y
X X
. (6)
Results from the work of Wang et al. (2015) and Chen et al. (2015) indicate
that when customers are more satisfied with individual service items, their overall
satisfaction is greater. This means that simple regression coefficient h
B must be
positive. The estimated regression equation can be written as below:
0 1ˆ ˆˆ
hj h h hjY X , (7)
where 0 1
ˆ ˆh h h
Y X , and 1
ˆh
complies with the normal distribution of 1h and
2
2
1
n
h hj h
j
X X
. This means
1 1ˆ
h h and
2
2
12
1
ˆ h
h n
hj h
j
X X
.
(8)
Service Quality Evaluation Model of Automated Teller Machines 181
By replacing the parameter 2
h with
hMSE , the unbiased estimator 2
1ˆ
hs
of 2
1ˆ
h can be expressed as follows:
2
12
1
ˆ h
h n
hj h
j
MSEs
X X
,
(9)
where
2
1
ˆ
2
n
j hj
j
h
Y Y
MSEn
, 2
h hE MSE .
3□Interval Estimations
As mentioned previously, the indices, including satisfaction index h
and influence
index 1h , were obtained through collection of customer voices via questionnaire
survey. Sampling error means there exists uncertainty regarding h
and 1h . It is
clear that h
and 1h cannot fully and accurately represent customers’ evaluation
of ATM services. We therefore included the concept of a confidence interval, which
is defined as a reasonable scope for the target value. We used the lower confidence
limit of h
and the upper confidence limit of 1h as a gauge of determining
service quality.
To deduce the lower confidence limit for h
, we employed the following
equation: ˆ1h h h h
Z n k s
. According to central limit theorem (CLT),
as the number of samples n approaches infinity, the sampling distribution of the
mean approaches a normal distribution. Clearly, when n moves toward infinity
( n ), h
Z is distributed as the standardised normal distribution: ~ 0,1h
Z N .
Hence the proposed equation is modified as follows:
0,1a
hP Z a N dz a
. (10)
Equivalently,
ˆ1
1 = h h
h h h
h
n kP Z Z P Z P L
s
, (11)
182 Journal of Economics and Management
where Z
is the
upper quartile of standardised normal distribution, as the
confidence level. Hence,
ˆ
1
h
h h
sL Z
k n
. (12)
Similarly, to deduce the upper confidence limit for 1h , we first proposed
1 1 1ˆ ˆ
h h h hT s
, where
hT follows the t distribution with 2n degrees
of freedom. Then,
1 1
, 2 , 2 1 1
1
ˆ1
ˆh h
h n n h h
h
P T t P t P Us
, (13)
where , 2nt is the upper
quartile of t -distribution complying with 2n .
Hence, the upper confidence limit is given by 1h
U ( 100 1 %1h ):
1 1 , 2
2
1
ˆ h
h h n n
hj h
j
MSEU t
X X
.
(14)
4□Performance Evaluation Matrix
The performance evaluation matrix was developed by Lambert and Sharma (1990).
Firm performance serves as the horizontal axis and the importance of customer
expectations is represented on the vertical axis. This tool has been used globally by
scholars to assess the performance of industrial institutions. In addition, it is a
representation that is easily visualized, which makes it accessible to a range of users
(Friendly, 2008). Graphics are widely used as an analytical instrument in
performance management.
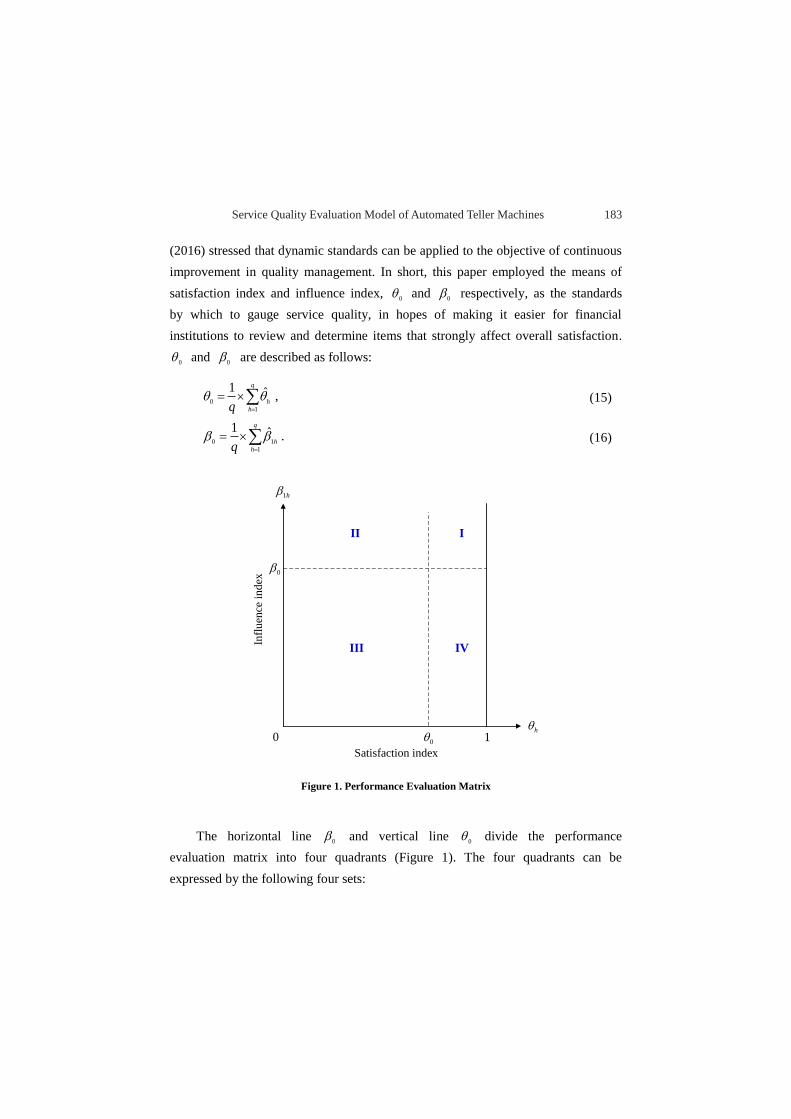
This paper utilized satisfaction index h
as the horizontal axis and the
influence index 1h as the vertical axis to establish the performance evaluation
matrix shown in Figure 1. If customers are generally pleased with most of the
service items, then the mean of the satisfaction index is set as a criterion for future
improvement. Thus, when the satisfaction level of individual service items drops
below the mean, it is an indication that action must be taken (Chen, 2009). Yu et al.
Service Quality Evaluation Model of Automated Teller Machines 183
(2016) stressed that dynamic standards can be applied to the objective of continuous
improvement in quality management. In short, this paper employed the means of
satisfaction index and influence index, 0
and 0
respectively, as the standards
by which to gauge service quality, in hopes of making it easier for financial
institutions to review and determine items that strongly affect overall satisfaction.
0 and
0 are described as follows:
0
1
1 ˆq
h
hq
, (15)
0 1
1
1 ˆq
h
hq
. (16)
0h
0
0 1
III
III IV
1h
Satisfaction index
Infl
uen
ce i
nd
ex
Figure 1. Performance Evaluation Matrix
The horizontal line 0
and vertical line 0
divide the performance
evaluation matrix into four quadrants (Figure 1). The four quadrants can be
expressed by the following four sets:

184 Journal of Economics and Management
I 1 0 0 1, 1,
h h h hA ,
II 1 0 0 1, 0 ,
h h h hA ,
III 1 0 1 0, 0 ,0
h h h hA ,
IV 1 0 1 0, 1,0
h h h hA .
As Yu et al. (2016) observed that the philosophy of quality management lies in
continuous improvement, when the satisfaction index of each item drops below the
average, then it might require improvement. To increase the reliability of h
and
1h , we decided to use
h as a lower confidence limit and
1h as an upper
confidence limit. We use the satisfaction index h
of item h to define the
coordinates 1,
h h h hp p L U in the performance evaluation matrix. The
location of h
p indicates the priority ranking of item h according to the following
guidelines:
1. In the event that the lower confidence limith
L falls below 0
(0h
L ),
then h
p falls within quadrant II or III. Hence this service item requires
improvement.
2. If the upper confidence limit 1h
U of influence index 1h is higher than the
mean 0
(i.e., 1 0h
U ), then h
p falls within quadrant II. This quadrant
has a greater impact on total satisfaction than quadrant III; therefore, these
items take priority.
3. When more than one service item falls within quadrant II, then it is advised to
use upper confidence limit 1h
U of influence index 1h to determine a
priority ranking. When financial institutions have limited resources, it is
advised to focus on items within quadrant II with larger upper confidence limit
1hU of influence index
1h .
This paper presents an evaluation process to determine the order of priority in
terms of quality improvement for service items of ATMs. This model is suitable for
ongoing quality management. The process is represented by the following steps:
Step 1: We randomly selected a group of n customers for our questionnaire survey,
and then used Eqs. (4) and (6) to obtain ˆh
and 1
ˆh
for each service
item.
Service Quality Evaluation Model of Automated Teller Machines 185
Step 2: We obtained the lower confidence limit h
L of h
and the upper
confidence limit 1h
U of 1h based upon Eqs. (12) and (14).
Step 3: We utilized satisfaction index h
as the horizontal axis and the influence
index 1h as the vertical axis to establish a performance evaluation
matrix aimed at exploring how customers feel about ATM service quality.
We obtained the means of the abovementioned indices using Eqs. (15) and
(16) to serve as the criteria for service quality and the benchmark for
ongoing total quality management.
Step 4: The location 1,
h h h hp p L U in the performance evaluation matrix
can be utilized to decide which items require improvement. Items that fall
within quadrant II with a larger upper confidence limit 1h
U of influence
index 1h take the highest priority.
5□A Numerical Example
In this section, we take a numerical example which illustrates the above concepts
and the applicability of the proposed service quality evaluation model for ATMs.
Thus, to gauge the service quality of ATMs at bank, this study assume that the
questionnaire employs five-point scale and contains 10 items and one overall
satisfaction. For each service item, the linguistic terms were divided into very
dissatisfied, dissatisfied, slightly satisfied, satisfied, and very satisfied. The subjects
of the questionnaire survey comprised all the customer users of the ATMs and 255
valid questionnaires were recovered. Furthermore, the reliability and validity of the
questionnaire meet standard of further analysis. Table 1 presents h
X , hs and the
estimator ˆh
and 1
ˆh
are presented for these 255 measurements of each service
item. This enables the calculation of the 95% lower confidence limit h
L and
upper confidence limit 1h
U . We then plotted the 1,
h hL U coordinates of each
service item on the performance evaluation matrix, as shown in Figure 2.
186 Journal of Economics and Management
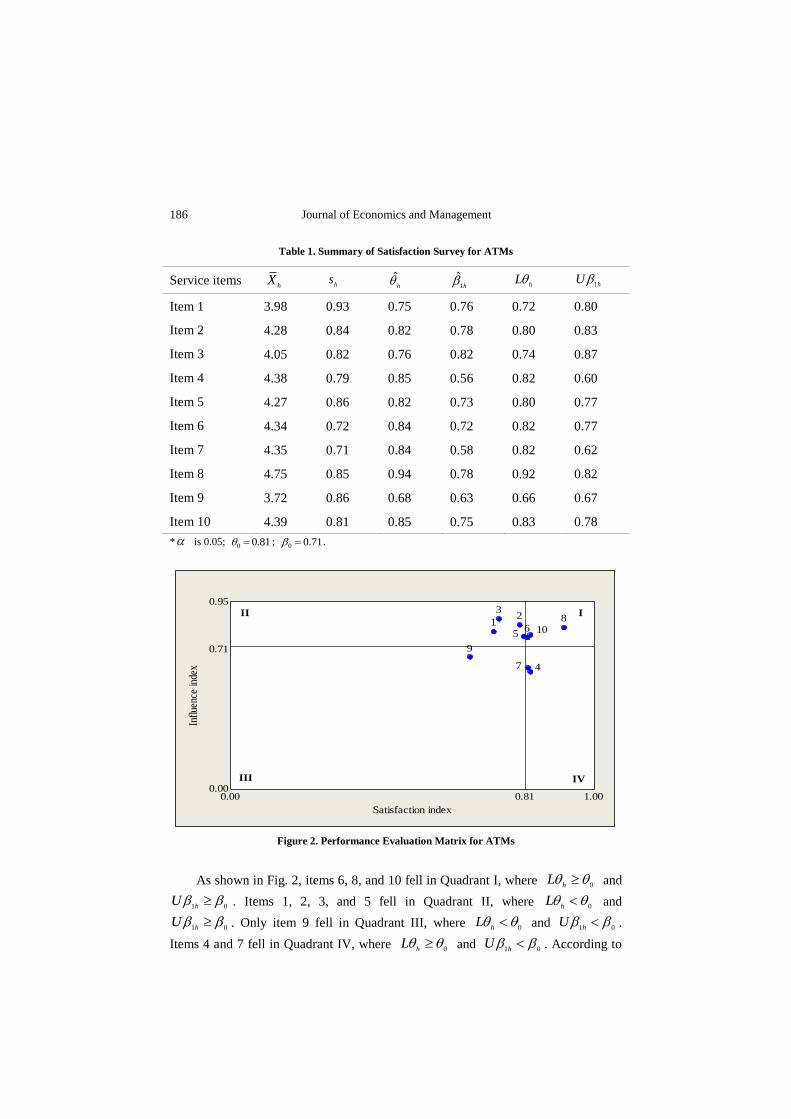
Table 1. Summary of Satisfaction Survey for ATMs
Service items h
X hs ˆ
h
1ˆ
h h
L 1h
U
Item 1 3.98 0.93 0.75 0.76 0.72 0.80
Item 2 4.28 0.84 0.82 0.78 0.80 0.83
Item 3 4.05 0.82 0.76 0.82 0.74 0.87
Item 4 4.38 0.79 0.85 0.56 0.82 0.60
Item 5 4.27 0.86 0.82 0.73 0.80 0.77
Item 6 4.34 0.72 0.84 0.72 0.82 0.77
Item 7 4.35 0.71 0.84 0.58 0.82 0.62
Item 8 4.75 0.85 0.94 0.78 0.92 0.82
Item 9 3.72 0.86 0.68 0.63 0.66 0.67
Item 10 4.39 0.81 0.85 0.75 0.83 0.78
* is 0.05; 0 0.81 ; 0 0.71 .
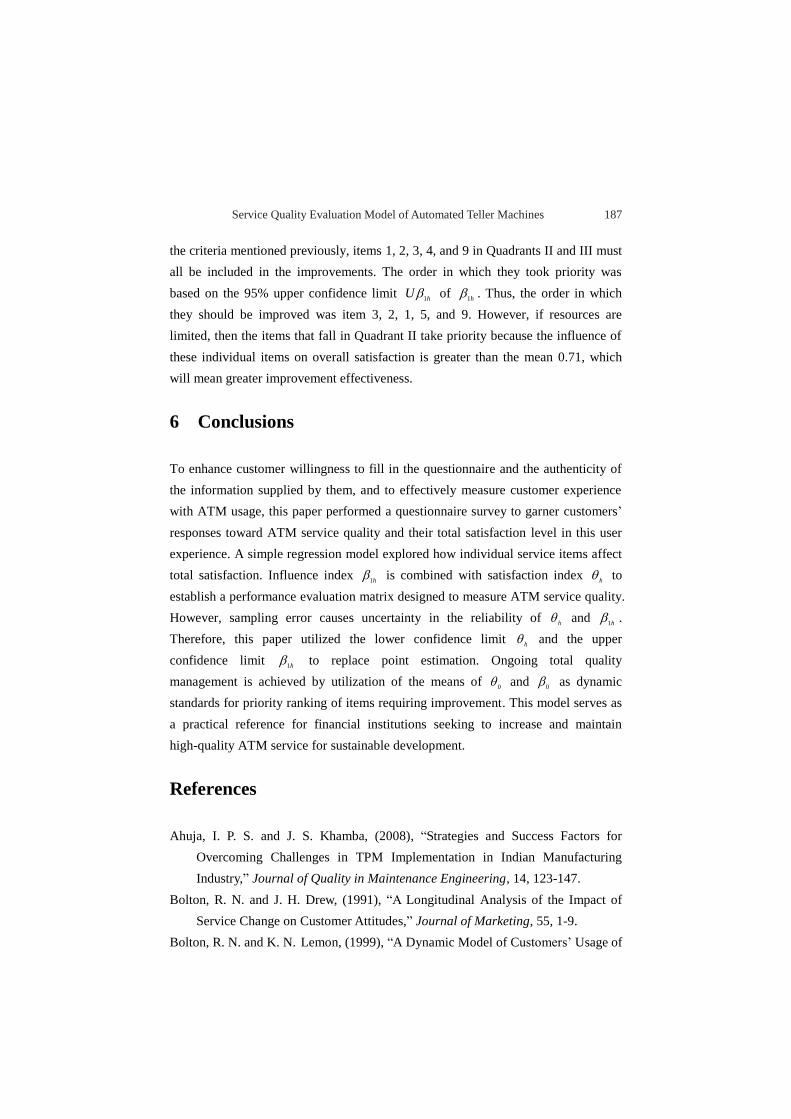
Figure 2. Performance Evaluation Matrix for ATMs
As shown in Fig. 2, items 6, 8, and 10 fell in Quadrant I, where 0hL and
1 0hU . Items 1, 2, 3, and 5 fell in Quadrant II, where 0h
L and
1 0hU . Only item 9 fell in Quadrant III, where 0h
L and 1 0hU .
Items 4 and 7 fell in Quadrant IV, where 0hL and 1 0h
U . According to
1.000.810.00
0.95
0.71
0.00
Satisfaction index
Infl
uenc
e in
dex
10
9
8
7
65
4
32
1III
III IV
Service Quality Evaluation Model of Automated Teller Machines 187
the criteria mentioned previously, items 1, 2, 3, 4, and 9 in Quadrants II and III must
all be included in the improvements. The order in which they took priority was
based on the 95% upper confidence limit 1h
U of 1h . Thus, the order in which
they should be improved was item 3, 2, 1, 5, and 9. However, if resources are
limited, then the items that fall in Quadrant II take priority because the influence of
these individual items on overall satisfaction is greater than the mean 0.71, which
will mean greater improvement effectiveness.
6□Conclusions
To enhance customer willingness to fill in the questionnaire and the authenticity of
the information supplied by them, and to effectively measure customer experience
with ATM usage, this paper performed a questionnaire survey to garner customers’
responses toward ATM service quality and their total satisfaction level in this user
experience. A simple regression model explored how individual service items affect
total satisfaction. Influence index 1h is combined with satisfaction index
h to
establish a performance evaluation matrix designed to measure ATM service quality.
However, sampling error causes uncertainty in the reliability of h
and 1h .
Therefore, this paper utilized the lower confidence limit h
and the upper
confidence limit 1h to replace point estimation. Ongoing total quality
management is achieved by utilization of the means of 0
and 0
as dynamic
standards for priority ranking of items requiring improvement. This model serves as
a practical reference for financial institutions seeking to increase and maintain
high-quality ATM service for sustainable development.
References
Ahuja, I. P. S. and J. S. Khamba, (2008), “Strategies and Success Factors for
Overcoming Challenges in TPM Implementation in Indian Manufacturing
Industry,” Journal of Quality in Maintenance Engineering, 14, 123-147.
Bolton, R. N. and J. H. Drew, (1991), “A Longitudinal Analysis of the Impact of
Service Change on Customer Attitudes,” Journal of Marketing, 55, 1-9.
Bolton, R. N. and K. N. Lemon, (1999), “A Dynamic Model of Customers’ Usage of
188 Journal of Economics and Management
Services: Usage as an Antecedent and Consequence of Satisfaction,” Journal of
Marketing Research, 36, 171-186.
Chen, H. C., K. S. Chen, T. L. Chang, and C. H. Hsu, (2010), “An Application of Six
Sigma Methodology to Enhance Leisure Service Quality,” Quality & Quantity,
44, 1151-1164.
Chen, K. S. and H. T. Chen, (2014), “Applying Importance-performance Analysis
with Simple Regression Model and Priority Indices to Assess Hotels’ Service
Performance,” Journal of Testing and Evaluation, 42, 455-466.
Chen, K. S., K. J. Wang, and T. C. Chang, (2015), “A Novel Approach Based on
Performance Influence for Evaluating Criteria of Service Quality,” Journal of
Testing and Evaluation, 43, 191-200.
Chen, S. H., (2009), “Establishment of a Performance-evaluation Model for Service
Quality in the Banking Industry,” The Service Industries Journal, 29, 235-247.
Chitturi, R., R. Raghunathan, and V. Mahajan, (2008), “Delight by Design: The Role
of Hedonic versus Utilitarian Benefits,” Journal of Marketing, 72, 48-63.
Churchill, G. A. and C. Surprenant, (1982), “An Investgation into the Determinants of
Customer Satisfaction,” Journal of Marketing Research, 19, 491-504.
Cornuel, E., (2007), “Challenges Facing Business Schools in the Future,” The
Journal of Management Development, 26, 87-92.
Etzel, M. J., B. J. Walker, and W. J. Stanton, (2001), Marketing Management, 12th
edition, Boston, Massachusetts: McGraw Hill-Irwin.
Fornell, C., (1992), “A National Customer Satisfaction Barometer: The Swedish
Experience,” Journal of Marketing, 56, 6-21.
Friendly, M., (2008), “A Brief History of Data Visualization,” Handbook of Data
Visualization, 15-56.
Ha, H. Y. and S. Janda, (2008), “An Empirical Test of a Proposed Customer
Satisfaction Model in E-services,” The Journal of Services Marketing, 22,
399-408.
Hsia, T. C., S. C. Chen, and K. S. Chen, (2009), “Enhancement of Service Quality in
Internet Marketing through Application of the Six Sigma Process,” Journal of
Chinese Institute of Industrial Engineering, 26, 11-21.
Huang, P. L., B. C. Y. Lee, C. S. Wang, and C. T. Sun, (2017), “Relative Importance
of the Factors under the ISO-10015 Quality Management Guidelines that
Service Quality Evaluation Model of Automated Teller Machines 189
Influence the Service Quality of Certification Bodies,” Journal of Economics
and Management, 13, 105-137.
Hung, Y. H., M. L. Huang, and K. S. Chen, (2003), “Service Quality Evaluation by
Service Quality Performance Matrix,” Total Quality Management & Business
Excellence, 14, 79-89.
Lai, J. H. K., (2011), “Comparative Evaluation of Facility Management Services for
Housing Estates,” Habitat International, 35, 391-397.
Lambert, D. M. and A. Sharma, (1990), “A Customer-based Competitive Analysis for
Logistics Decisions,” International Journal of Physical Distribution and
Logistics Management, 20, 17-24.
Lee, H., Y. Lee, and D. Yoo, (2000), “The Determinants of Perceived Service
Quality and Its Relationship with Satisfaction,” The Journal of Services
Marketing, 14, 217-231.
Mazis, M. B., O. T. Antola, and R. E. Klippel, (1975), “A Comparison of Four
Multi-attribute Models in the Prediction of Consumer Attitudes,” Journal of
Consumer Research, 2, 38-52.
Muller, W., (1991), “Gaining Competitive Advantage through Customer
Satisfaction,” European Management Journal, 9, 201-211.
Oliver, R. L., (1981), “Measurement and Evaluation of Satisfaction Process Inertial
Settings,” Journal of Retailing, 57, 25-48.
Parasuraman, A., V. A. Zeithaml, and L. L. Berry, (1985), “A Conceptual Model of
Service Quality and Its Implications for Future Research,” Journal of Marketing,
49, 41-50.
Parasuraman, A., V. A. Zeithaml, and L. L. Berry, (1988), “SERVQUAL:A
Multi-item Scale for Measuring Consumer Perceptions of Service Quality,”
Journal of Retailing, 64, 12-40.
Tao, C. J., S. C. Chen, and L. Chang, (2009), “Apply 6-sigma Methodology in
Measuring the Competition Quality of Satisfaction Performance—An Example
of ISP Industry,” Quality & Quantity, 43, 677-694.
Vargo, S. and R. L. Lush, (2004), “Evolving to a New Dominant Logic for
Marketing,” Journal of Marketing, 68, 1-17.
Voehl, F., (2004), “Six Sigma Community Improvement Projects,” Annual Quality
Congress Proceedings, 58, 351-363.
190 Journal of Economics and Management
Walters, C. G., (1978), Consumer Behavior: Theory and Practice, 3rd edition,
Homewood, Ⅲ.: Richard D., Irwin, Inc.
Wang, K. J., T. C. Chang, and K. S. Chen, (2015), “Determining Critical Service
Quality from the View of Performance Influence,” Total Quality Management &
Business Excellence, 26, 368-384.
Woodruff, R., E. R. Cadotte, and R. L. Jenkins, (1983), “Modeling Consumer
Satisfaction Processes Using Experience-based Norms,” Journal of Marketing
Research, 20, 296-304.
Woodside, A. G., L. L. Frey, and R. T. Daly, (1989), “Linking Service Quality,
Customer Satisfaction, and Behavioral Intentions,” Journal of Health Care
Marketing, 9, 5-17.
Yu, C. M., H. T. Chang, and K. S. Chen, (2016), “Developing a Performance
Evaluation Matrix to Enhance the Learner Satisfaction of an E-learning System,”
Total Quality Management & Business Excellence, doi:
10.1080/14783363.2016.1233809 (forthcoming).