determinants of automated teller machine deployment: the
TRANSCRIPT
DSpace Institution
DSpace Repository http://dspace.org
Accounting and Finance Thesis and Dissertations
2020-10-20
Determinants of Automated Teller
Machine Deployment: The case of
commercial banks of Ethiopia
Mahilet Demissie
http://hdl.handle.net/123456789/11430
Downloaded from DSpace Repository, DSpace Institution's institutional repository
i
Determinants of Automated Teller Machine Deployment: The case
of commercial banks of Ethiopia
A Thesis Submitted to Bahir Dar University in Partial Fulfillment of the
Requirement for Degree of Masters of Science in Accounting and Finance
Bahir Dar University
College of Business and Economics
Department of Accounting and Finance
BY: Mahilet Demissie Adane
Advisor: Teramaje Wale (Dr.)
February, 2018
Bahir Dar, Ethiopia

ii
Statement of declaration
This is to certify that the thesis work by Mahilet Demissie entitled as “Determinants of Automated
teller machine Deployment in Commercial Banks of Ethiopia”. A Thesis Submitted to Bahir Dar
University in Partial Fulfillment of the Requirement for Degree of Masters of Science in
Accounting and Finance. Compilies with the regulations of the university and meets the accepted
standard with respect to originality and quality.
Approved by the examining committee
Advisor: -------------------------------- Signature-----------------Date--------------------
External Examiner:----------------------Signature ----------------Date-----------------
Internal Examiner: -------------------------Signature--------------Date-----------------
Chair person :--------------------------------Signature--------------Date---------------

iii
Acknowledgement
First of all, I would like to thank the Almighty God and his mother for their entire help trough
out my life. Next, I would like to thank my advisor Teramaje Wale (Dr.) for his unreserved
advice for the completion of this thesis. My grateful thanks also go to National Bank of Ethiopia,
head office of each bank for their positive cooperation in giving the relevant data for the study.
I would like to pass my deepest gratitude to my family for their moral and material support
throughout my life.
Lastly but not the least, my heartfelt grateful also extends to my brother Mr. Eshetie Woretaw
(Lecturer in school of Economics, University of Gondar) for his unceasing, unwearyingly,
helpful supports and encouragements from the commencement to the completion of the study.
You really deserved special thanks for your unconditional love too. You are always there to
support me. Thank you so much!!!
iv
Table of Contents
Contents page
Table of contents ............................................................................................................................. ii
List of Tables .............................................................................................................................................. vii
List of Figures ............................................................................................................................................. vii
List of Acronyms ....................................................................................................................................... viii
Abstract ......................................................................................................................................................... x
Chapter One ................................................................................................................................................ 1
1. Introduction ............................................................................................................................................. 1
1.1. Background of the Study .................................................................................................... 1
1.2. Statement of the Problem ..................................................................................................... 2
1.3. Objective of the Study ......................................................................................................... 4
1.3.1. General objective .................................................................................................................. 4
1.3.2 Specific Objectives ............................................................................................................... 4
1.4 Research questions ............................................................................................................... 4
1.5 Research Hypothesis ............................................................................................................ 4
1.6. Significant of the Study ....................................................................................................... 5
1.7. Delimitation and Limitation of the study ............................................................................. 5
1.8. Organization of the Study .................................................................................................... 5
1.9. Ethical Considerations ......................................................................................................... 6
Chapter Two ................................................................................................................................................ 7
2. Literature Review ................................................................................................................................... 7
2.1. Introduction .......................................................................................................................... 7
2.2 . Theoretical Literature Review .......................................................................................... 7
2.2.1. Definition of electronic banking ................................................................................................. 7
2.2.2. Types of E-banking ............................................................................................................... 8
2.2.3. E-banking in Global Perspective ........................................................................................... 9
2.2.4. E-banking Practice in Ethiopian Commercial banks .......................................................... 10
2.2.5. Definition and Concepts of ATM ....................................................................................... 11
v
2.2.6. What ATMs Do? ................................................................................................................. 12
2.2.7. Reasons for Introduction of Automated Teller Machines (ATM) by the bank ................... 13
2.2.8. The Benefits of ATM .......................................................................................................... 13
2.2.9. Deployment of ATMs ......................................................................................................... 14
2.2.10. Determinants of ATM deployment ..................................................................................... 14
2.3. Empirical Literature Review .............................................................................................. 16
I. Cost efficiency on ATM deployment ................................................................................ 20
II. Bank Size on ATM deployment ........................................................................................ 20
III. Deposit Ratio on ATM deployment ................................................................................... 21
IV. Bank Profitability on ATM deployment ............................................................................ 21
Chapter Three ........................................................................................................................................... 22
3.Methodology of the Research ................................................................................................................ 22
3.1 Introduction ........................................................................................................................ 22
3.2. Study Area Profile.............................................................................................................. 22
3.3. Research Approaches ......................................................................................................... 23
3.3.1. Quantitative research approach ........................................................................................... 23
3.4. Research Design................................................................................................................. 24
3.4.1. Explanatory Research ......................................................................................................... 25
3.5. Target Population and Sampling ..................................................................................................... 25
3.6. Variables and its Measurement .......................................................................................... 26
3.6.1. Dependent Variable and Measurement .................................................................................. 26
3.6.2. Independent Variables and Measurements .......................................................................... 26
3.7. Nature of Data and Instruments of Data Collection........................................................... 28
3.8. Model Specification ........................................................................................................... 28
3.9. Method of data Analysis .................................................................................................. 30
Chapter Four ............................................................................................................................................. 31
4. Results and Discussion .......................................................................................................................... 31
4.1. Descriptive Statistics .......................................................................................................... 31
4.1.1. Analysis for Automated Teller Machine Trend from 2012-2016 .................................. 32
4.2. Model Specification Test ................................................................................................... 33
4.3. Diagnostic Tests for Classical Linear Regression Model Assumptions ............................ 36
vi
4.3.1. Multicolinearity ................................................................................................................... 36
4.3.2. Linearity test ....................................................................................................................... 36
4.3.3. Heteroscedasticity ............................................................................................................... 37
4.3.4. Autocorrelation ................................................................................................................... 37
4.3.5. Normality ............................................................................................................................ 38
4.4. Empirical Results of Regression Analysis and Discussion................................................ 39
Chapter Five .............................................................................................................................................. 43
5. Conclusion and Recommendation ....................................................................................................... 43
5.1. Conclusion ........................................................................................................................ 43
5.2. Recommendation .............................................................................................................. 45
References ................................................................................................................................................... 46
Appendix ..................................................................................................................................................... 53
vii
List of Tables
Tables Page
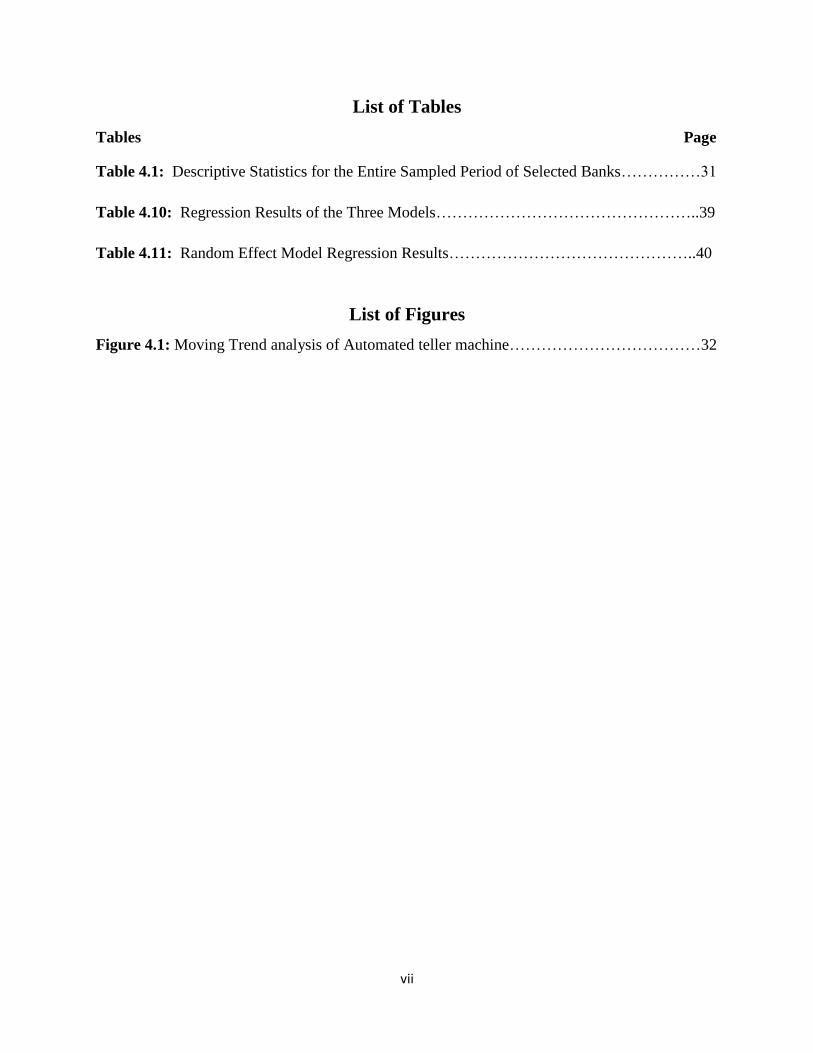
Table 4.1: Descriptive Statistics for the Entire Sampled Period of Selected Banks……………31
Table 4.10: Regression Results of the Three Models…………………………………………..39
Table 4.11: Random Effect Model Regression Results………………………………………..40
List of Figures
Figure 4.1: Moving Trend analysis of Automated teller machine………………………………32
viii
List of Acronyms
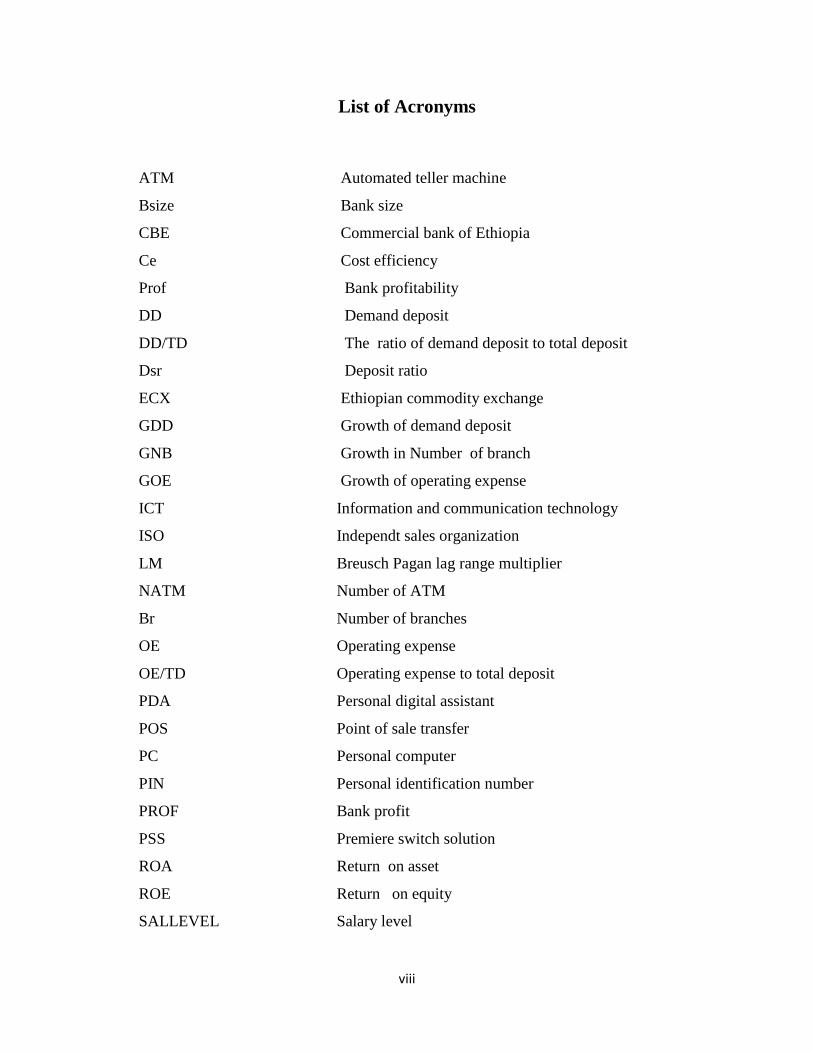
ATM Automated teller machine
Bsize Bank size
CBE
Ce
Commercial bank of Ethiopia
Cost efficiency
Prof Bank profitability
DD
DD/TD
Dsr
ECX
Demand deposit
The ratio of demand deposit to total deposit
Deposit ratio
Ethiopian commodity exchange
GDD Growth of demand deposit
GNB Growth in Number of branch
GOE Growth of operating expense
ICT Information and communication technology
ISO Independt sales organization
LM Breusch Pagan lag range multiplier
NATM Number of ATM
Br Number of branches
OE
OE/TD
PDA
POS
PC
Operating expense
Operating expense to total deposit
Personal digital assistant
Point of sale transfer
Personal computer
PIN Personal identification number
PROF Bank profit
PSS Premiere switch solution
ROA Return on asset
ROE Return on equity
SALLEVEL Salary level
ix
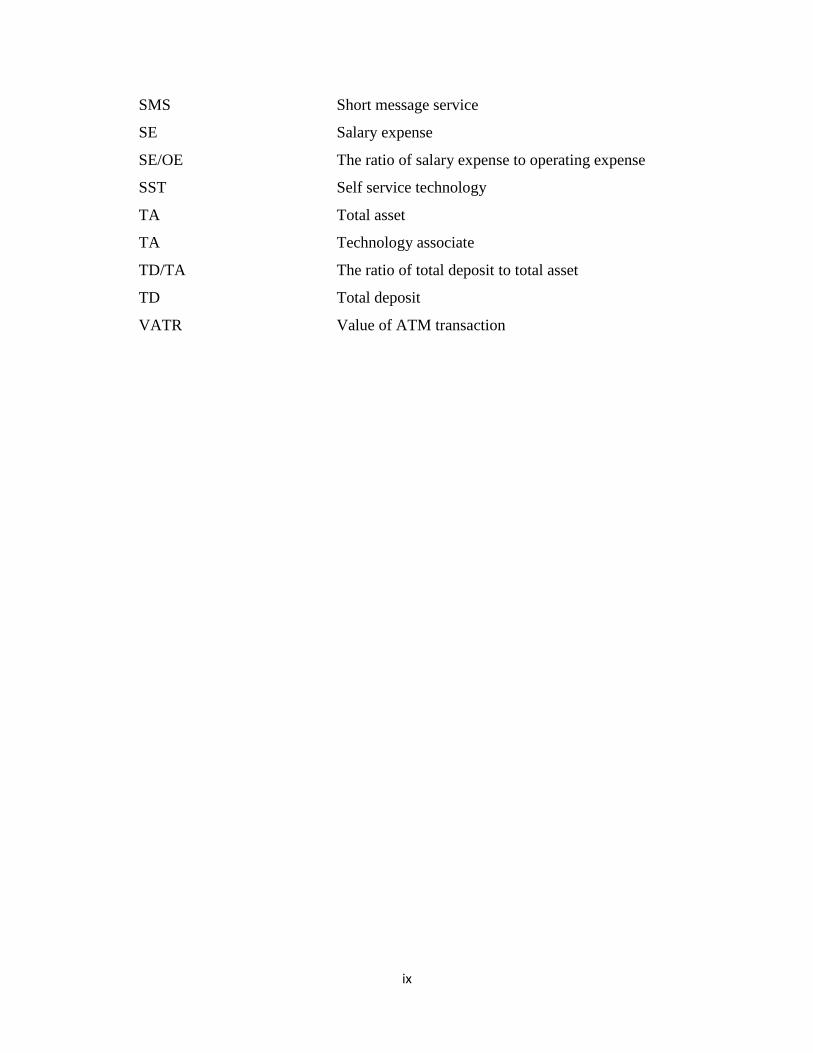
SMS Short message service
SE
SE/OE
Salary expense
The ratio of salary expense to operating expense
SST Self service technology
TA Total asset
TA
TD/TA
Technology associate
The ratio of total deposit to total asset
TD Total deposit
VATR
Value of ATM transaction
x
Abstract
The growing trend of information technology investment especially Automated Teller Machine
(ATM) in Ethiopia banking industry is below customers demand (Ayana, 2012). The availability
and deployment of ATM in Ethiopia is low level compared to the fast growing urban population.
Thus, the main objective of this study is to examine the determinants of ATM deployment in
commercial banks of Ethiopia. In order to achieve the objective, secondary sources of data were
gathered from thirteen commercial banks of Ethiopia in the sample period covering from 2012 to
2016. The collected data is analyzed using descriptive statistics and panel data econometric
regression analysis. The random effect model is employed as an appropriate model for this study
and interpretations of estimates were made based on this model. The result of the descriptive
analysis indicated that the trend of ATM deployment in commercial banks of Ethiopia is up-ward
sloping over the sample time period. The results of random effect regression analysis revealed
that bank size, bank profitability and deposit ratio were statistically significant and has positive
impact on ATM deployment in commercial banks of Ethiopia. Mean while, cost efficiency and
number of branches have statistically insignificant relationship with ATM deployment. Based on
the finding investigated, it is recommended that the commercial banks of Ethiopia or concerned
bodies need to take account the most important determinants of ATM deployment.
Key words: Automated Teller Machine (ATM), Commercial Banks of Ethiopia, Deployment
1
Chapter One
1. Introduction
1.1. Background of the Study
Information and Communication Technology (ICT) has become a very critical aspect of recent
banking and financial services delivery in the world at large and Ethiopia in particular.
Automated Teller Machine (ATM) is one of a major indicator for this technology by banks
(Otukoya, 2014). Now a day, this technology is adopted and is still being adopted by banks with
in the globe. They provide benefits for both banks and their depositors or customers. This
machine can be able to withdraw, transfer and exchange the currency or cash at convince place
and time than through face to face interaction only at banking hour (Olatokun, 2009).
The motive behind to have a bank machine which is automatically dispensed cash and other
activities to customer is came in 1930s by George simijan a Turkish born but it is not successful
version. For trail purpose he came with the idea of money hole in the wall machine that enables
customer to make financial transaction. Until 1960s, the concept of ATM is seen again by John
Shepherd UK born and he came with the idea of cash. Many people perceive that John is
inventing the ATM but the world‟s first ATM is installed in Barclays in 1967 (Miller, 2006 ).
Banks have become the major deplorers of ATMs as the cost of a single transaction performed
by ATM is potentially a lesser amount than the cost of a transaction conducted from a teller and
as ATMs are able to conduct or handle many transactions with few time than tellers (Laderman,
1990). The most favorable deployment strategies of ATM offer the occasion to provide greater
convince and attract more customers by covering the money market with adequate ATM
facilities. Moreover, these favorable strategies can provide greater cost efficiency by finding the
optimal number of ATMs to be installed. It can also provide greater profitability through
increasing the users of ATM to earn more transaction and service fee (Huang, 2012).
Turning to Ethiopia, the growth of ATM banking service is through gradual development and the
time where the deployment of ATM started in Ethiopia moved back to the late 2001. The largest
state owned bank, Commercial Bank of Ethiopia has introduced ATMs to deliver different
services to customer among this cash withdrawal, foreign exchange to domestic users and
2
payment of bill etc (Gardachewetal, 2015). ATMs have become the most competitive instrument
to commercial banks of Ethiopia (WaleAbdual, 2011). Thus, adequate ATM deployment policies
are highly required to increase the number of ATM and quality of the services offered. However,
in Ethiopia, the deployment of ATMs is still low level compared to other Sub-Saharan Africa.
For instance, the deployment of ATM in Nigeria is 150,000 ATMs per 100,000 persons
(Amefrele, 2012 ). But, in Ethiopia the ratio of ATM to urban population is 1922 to 20,202,815.
In Ethiopia, a considerable number of researchers‟ (Yiheyis, 2015) have been studied on
evaluation of customer satisfaction regarding Premiere switch solution automated teller machine
(ATM) banking services in Addis Ababa. (Balcha, 2015), studied aggressive branch expansion
versus ATM and POS machine in Awash International bank in Addis Ababa. However,
empirical evidences on the issue of the determinants of ATM deployment in commercial banks
of Ethiopia have been rarely available. To the researcher knowledge, there is no rigorous
research conducted so far that attempt to look thoughtfully about the determinants of ATM
deployment. Thus, this study aims to fill the knowledge and policy gaps by identifying the
determinants of ATM deployment in commercial banks of Ethiopia.
1.2. Statement of the Problem
Automated teller machine is a device that provides access to customer in financial transaction
and many other activities or duties without the need of human or teller on banking and financial
institution. In the modern time, customers are identified by the machine through inserting plastic
ATM card that contains unique card number and some security information such as expiration
date and security number or personal identification number (PIN) (Solomon, 2010).
Commercial banks have automated their services by the use of ATM. The aim has been to
schedule employees‟ duties with ease, reduce the building up of queues and increase employees‟
efficiency. Other reasons for adopting ATMs include; reduction of customer service delivery
time, improvement of quality of service, bringing services closer to customers and cutting on
cost of operations. Thence, the overall aim is to achieve the highest possible level of profits
(Hussein, 2017).
3
In the year 2016, the number of commercial banks of Ethiopia has reached 18, out of which 16
are private, and the remaining 2 are state owned. The total branches in the country have reached
to 3,023. The number of ATMs to urban population becomes 1922 to 20,202,815. Besides, the
numbers of population by this year reached 101,853,268 of which 81,650,453 are living in rural
areas where financial institutions have not yet reached to majority of those people whereas, the
remaining 20,202,815 are live in urban areas which have reached this service to some extent
(NBE, 2015/2016). Thus, the deployment of ATM in Ethiopia is low level compared to the fast
growing urban population.
Moreover, ATMs should not be installed only inside the location of banks, but also in locations
of shopping centers/malls, airports, grocery stores, gas stations and restaurants where large
numbers of people reach on (Steve, 2002). However, in Ethiopia ATMs are placed mostly near
or inside the premises of commercial banks. As a result, the deployment of ATMs in shopping
center, airports, grocery stores, petrol stations, restaurants and any other places are rare or scanty
available.
The determinants of ATM deployment were investigated in different countries of the globe. For
instance, (Adewoye, 2013) studied that wage rate (salary level), firm size, competitive pressure
value of ATM transactions and profitability of the bank could significantly determined ATM
investment in commercial banks of Nigeria. In Taiwan, (Liu, 2009) indicated that operating
scale, banking deposit service and operating cost were all significant determinants of ATM
investment in the Taiwan banking. According to Hannan (1984) wage rate and firm size has
positive effects on the decision to adopt ATM. That is in regions of higher wage rates, banks
tend to install more ATM to replace expensive labor and also in case of the economic scale
theory, larger banks tend to introduce more ATM than small banks do. In Ethiopia, a
considerable number of researchers‟ (Abrehe, 2015), (Gemechu, 2012) and (Takele, 2013 ) have
been conducted so far on ATM adoption of customers in commercial bank of Ethiopia , adoption
of electro banking system in Ethiopia banking industry: barriers and drivers , analysis of factors
influencing customers intention of E-banking in Bahir dar city respectively. To the best of the
researcher knowledge, empirical findings on the determinants of ATMs deployment in Ethiopia
are rarely available. They were mainly focused on the issue after deployment of ATMs. Thus,
this study is intended to fill the gap by investigating the determinants of ATMs deployment in
commercial banks of Ethiopia.
4
1.3. Objective of the Study
1.3.1. General objective
The main objective of the study is to examine the determinants of ATM deployment in
commercial banks of Ethiopia.
1.3.2 Specific Objectives
The specific objectives of this study are
To examine the trends of ATM deployment in commercial banks of Ethiopia.
To examine the relationship between ATM deployment and its determinants.
To identify the most important determinants of ATM deployment in commercial banks of
Ethiopia.
1.4 Research questions
Based on the aforementioned problems, the following research questions have been forwarded.
What seems like the trends of ATM deployment in commercial banks of Ethiopia?
What are the relationship between ATM deployment and its determinants in commercial
banks of Ethiopia?
What are the most important determinants of ATM deployment?
1.5 Research Hypothesis
According to Oyerinde (2013), on his paper bank size, bank profitability, deposit ratio, cost efficiency and
numbers of branches are significant effect on ATM deployment. The researcher is developed
hypothesis to examine the relationship between ATM deployment and its determinants in
commercial banks of Ethiopia.
H1: Bank size has a significant effect on ATM deployment in commercial banks of Ethiopia
H2: Bank profitability has a significant effect on ATM deployment in commercial banks of
Ethiopia.
H3: Deposit ratio has a significant effect on ATM deployment in commercial banks of Ethiopia.
H4: Cost efficiency has a significant effect on ATM deployment in commercial banks of
Ethiopia.
5
H5: Number of branches has a significant effect on ATM deployment in commercial banks of
Ethiopia.
1.6. Significant of the Study
This study investigated the deployment of ATM by identifying its determinants. From this
study, the following benefits are expected to be reaped or gained. For policy makers: identifying
the determinants of ATM deployment in commercial banks of Ethiopia can give policy makers
insights for future courses of action and understanding the role by ascertaining the driving factor
for the deployment of ATM can play in expanding the installation of ATM. For the next
researcher: it put base line information who would like to conduct further detailed and
comprehensive studies related to determinants of ATM deployment by filling the previous
researcher knowledge gap.
1.7. Delimitation and Limitation of the study
Drawing boundaries is an important component in undertaking a research. Stating what the
researcher are not going to do is often just as important as expressing what the researcher is
going to do. The study is confined only the thirteen selected commercial banks of Ethiopia or
does not consider the other financial sector in Ethiopia. The issue that the researcher tries to
study is delimited to examine the determinants of ATM deployment in commercial banks of
Ethiopia. Thus, the study did not considered customers side ATM deployment and any other
forms of electronic payment. The limitation of the study is lack of data for the initially selected
years or for longer period of time as ATMs are recently installed machine.
1.8. Organization of the Study
The paper is organized as follows. Chapter one elaborates about the introduction, statement of
the problem, objective and significance of the study. The second chapter of this study is devoted
on various concepts related to ATM; that is a brief review of ATM, determinants of ATM
deployment with empirical literature is done. Methodology that includes data and methods is
discussed in chapter three of the paper. Fourth chapter is about result and discussion. Finally,
conclusion and recommendation are included in chapter five.

6
1.9. Ethical Considerations
Ethical clearance is obtained from department of accounting and finance, Bahir dar university
and a written consent is sought from the banks financial statement other material and concerned
government bodies. As much as possible, the data is collected based on banks freely volunteered.
7
Chapter Two
2. Literature Review
2.1. Introduction
This chapter presents both theoretical and empirical review of studies conducted related to ATM
and the purpose of the empirical literature review is to identify what has been done or what has
not been done so far by previous researcher, how it has been done (methodological approaches),
the results obtained and the way forwarded. This turns paramount significant for identifying the
gaps in policy, knowledge and methodology.
2.2 . Theoretical Literature Review
2.2.1. Definition of electronic banking
E-banking has been defined in many ways by different scholars; (Daniel, 1999) defines
electronic banking as the delivery of banks‟ information and services by banks to customers via
different delivery platforms that can be used with different terminal devices such as personal
computers and mobile phone with browser or desktop software, telephone or digital television;
(Noreen, 2006) defined it as any use of information and communication technology and
electronic means by a bank to conduct transactions and have interaction with stakeholders;
(Magemhe, 2002) also defined electronic banking (e-banking) is nothing but e-business in
banking industry. E-banking is a generic term for delivery of banking services and products
through electronic channels, such as the telephone, internet, cell phone, etc.
E-banking is a form of banking service where funds are transferred through an exchange of
electronic signal between financial institutions, rather than exchange of cash, checks, or other
negotiable instruments (Kamrul, 2009 ).
E-banking can be also defined as a variety of platforms such as internet banking or online
banking, TV-based banking, mobile phone banking and PC (personal computer) banking (or
offline banking) whereby customers access these services using an intelligent electronic device
like PC, personal digital assistant (PDA), ATMs, POS, kiosk, or touch tone telephone
(Alagheband, 2006) .
8
2.2.2. Types of E-banking
Among the many e-banking delivery channels to provide banking service to customers ATM,
POS, Mobile banking, agent banking and internet banking are the most widely used and
discussed below.
Automated Teller Machine (ATM)
It is a machine where cash withdrawal can be made over the machine without going in to the
banking hall. It also sells recharge cards and transfer fund, it can be accessed 24 hours/7 days
with account balance enquiry. ATM is same as teller point but it run automatically through
identity like card and password (Fenuga, 2010).
Internet Banking
Internet banking allows customers of a financial institution to conduct financial transactions on a
secure website operated by the institution, which can be a retail or virtual bank, credit union or
society. It may include any of transactions related to online usage. Banks increasingly operate
websites through which customers are able not only to inquire about account balances, interest
and exchange rates but also to conduct a range of transactions. Unfortunately, data on Internet
banking are scarce and differences in definitions make cross country comparisons difficult
(Alabar, 2012).
Point of Sale Transfer Terminals (POS)
POS also sometimes referred to as point of purchase (POP) or checkout is the location where a
transaction occurs. A "checkout" refers to a POS terminal or more generally to the hardware and
software used for checkouts, the equivalent of an electronic cash register. A POS terminal
manages the selling process by a salesperson accessible interface. The same system allows the
creation and printing of the receipt. POS systems record sales for business and tax purposes
(Shittu, 2010) .
Mobile Banking
Mobile banking also known as M-Banking is a term used for performing balance checks, account
transactions, payments, credit applications and other banking transactions through a mobile
9
device such as a mobile phone. The earliest mobile banking services were offered over Short
Message Service (SMS), a service known as SMS banking. Mobile banking is used in many
parts of the world with little or no infrastructure especially remote and rural areas. This aspect of
mobile commerce is also popular in countries where most of their population is unbanked. In
most of these places, banks can only be found in big cities, and customers have to travel
hundreds of miles to the nearest bank. The scope of offered services may include facilities to
conduct bank and stock market transactions to administer accounts and to access customized
information (Tiwari, 2007 ).
Agent Banking
A banking agent is a retail or postal outlet contracted by a financial institution or a mobile
network operator to process clients‟ transactions. Rather than a branch teller, it is the owner or an
employee of the retail outlet who conducts the transaction and lets clients deposit, withdraw, and
transfer funds, pay their bills, inquire about an account balance, or receive government benefits
or a direct deposit from their employer. Banking agents can be pharmacies, supermarkets,
convenience stores, lottery outlets, post office and many more (Wikimania, 2015).
2.2.3. E-banking in Global Perspective
The advent of internet has initiated an electronic revolution in the global banking sector. The
dynamic and flexible nature of this communication channel as well as its everywhere reach has
helped in leveraging a variety of banking activities. E-banking technologies have proliferated in
recent years and the availability of a wide range of products has led to increasing adoption
among customers. These technologies include direct deposit, computer banking stored value card
and debit cards (Kaesther, 2008 ).
Growth of electronic banking in a country depends on many factors such as success of internet
access, new online banking features, household growth of internet usage, legal and regulatory
framework. E-banking can offer speedier, quicker and dependable services to the customers for
which they may be relatively satisfied than that of manual system of banking. E-banking system
not only generates latest viable return it can get its better dealings with customers. New banking
intermediaries offering entirely new types of banking services have emerged as a result of
innovative e-business models.
10
The internet has emerged as one of the major distribution channels of banking products and
services for the banks in US and in the European countries. Initially, banks promoted their core
capabilities i.e., products, services and advice through internet. More recently, due to advances in
internet security and the advent of relevant protocols banks have discovered that they can play
their primary role as financial intermediate„s and facilitators of complete commercial
transactions via electronic networks especially through the internet. Some banks have chosen a
route of establishing a direct web presence while others have opted for either being an owner of
financial services centric electronic marketplace or being participants of a non financial services
centric electronic marketplace (Foley, 2000).
2.2.4. E-banking Practice in Ethiopian Commercial banks
Certainly the banking industry in Ethiopia is underdeveloped and therefore, there is an all
immediate need to embark on capacity building arrangements and modernize the banking system
by employing the state of the art technology being used anywhere in the world. With a growing
number of import-export businesses, increased international trades and international relations,
the current banking system is short of providing efficient and dependable services and therefore
all banks operating in Ethiopia should recognize the need for introducing electronic banking
system to satisfy their customers and meet the requirements of rapidly expanding domestic and
international trades, increasing international banking services. Undeniably the largest state
owned bank, Commercial Bank of Ethiopia is the pioneer in introducing ATM service for local
users in 2001 with its fleet of eight ATMs located in Addis Ababa. Moreover, CBE has Visa
membership since November 14, 2005. However, due to lack of appropriate infrastructure it
failed to reap the fruit of its membership. Despite, being the pioneer in introducing ATM based
payment system and acquired Visa membership CBE lagged behind (Gardachew, 2010).
Dashen Bank, which worked aggressively to maintain its lead in electronic payment systems.
Dashen bank, a forerunner in introducing e-banking in Ethiopia, has installed ATMs at
convenient locations for its own cardholders. The Dashen Bank ATM is available 24 hours a
day, seven days a week and 365 days a year providing service to Dashen debit cardholders and
international visa cardholders coming to the country. At the end of June 2009, Dashen bank has
installed more than 40 ATMs in its area branches, university compounds, shopping malls,
restaurants and hotels (Dashen bank, 2011).
11
The first ever electronic banking gateway was signed between Ethiopian Commodity Exchange
(ECX), Dashen Bank and CBE. The electronic banking system being developed with both banks
is designed to give a secure electronic data sharing gateway between clients, banks and ECX,
facilitating a smooth transaction (Demilew, 2008 ).
As the CBE continues to move at a snail's pace in its turnkey solution for card based payment
system, Dashen Bank remains so far the sole player in the field of electronic banking since 2006.
The agreements signed by other private banks to introduce e-banking are welcoming and further
steps towards realizing those agreements should be taken. Now in Ethiopia electronic banking is
highly growing from which mobile banking service provider banks in Ethiopia are Wegagen,
Commercial Bank of Ethiopia, United international bank, Dashen, Abay and Cooperative bank
of Oromia. Internet banking service provider includes united international, Wegagen, Dashen,
Abay, Nib international and Commercial Bank of Ethiopia. Agent bank service provider includes
united international, Dashen, Abay, Anbessa and cooperative bank of Ethiopia. In the year
2014/2015 National bank of Ethiopia give ATM ( Automatic teller machine) license permission
to Abay international bank, Anbesa international bank, Nib international bank and Cooperative
banks of Oromia (NBE, 2015).
2.2.5. Definition and Concepts of ATM
Automated teller machine are abbreviated as ATM and it is an electronic device that gives out or
receive cash deposit from account holder through using smart card to initiate and complete a
transaction with this machine. Simply by putting ATM card as widely called electronic chip that
identifies each customer with respect to corresponding account belongs to the customer
(Odewale, 2008).
Just like other data terminal ATM is terminal with two inputs and four output devices, it is used
to connect and communicate through a host processor. This processor is analogous to an internal
service provider in that it is the gate way through which all the various ATM networks are a
veiled to the card holder (Fawcett, 2001). It is connected to a computer terminal, record keeping
system and cash vault in one unit that permits a customer to enter personal identification number
(PIN) or by punching a special code number into the computer terminal that is linked to the
bank‟s computerized records. The initiative behind ATM was to automate or to make easy the
task of a bank teller which subsequently removed the face to face interaction between customer
12
and bank teller, in the service sector such as banks the ATM technology is used to regulate
service by way of reducing the employee/customer interaction and are expected to provide the
same service where ever the customer goes and also expected that service provided by ATM
from one customer to the other should be consistent. Depending on their location ATM may be
either on premises or off premises. On premises if ATM are located only inside the bank
premises and are typically more advanced they are also multi-function to complement the
capabilities of an ideal bank branch are usually expensive. Off premises if ATM is located other
than the location of the bank at places like shopping malls, super market and filling station are
usually less expensive mono function devises (Humphery, 1993). ATM (Automatic Teller
Machine) is a device which offers a range of services to users that are authorized by using a PIN
code. From a cash ATM, user is able to make payments, withdraw money or view account
information (Myllynen, 2009). Automated teller machines have reduced costs per transactions to
almost one fourth as compared to the branches. ATMs support a variety of transactions such as
cash withdrawal, cash deposits, cherub deposits and placement of service requests including the
request for a new cheque book. New technology has facilitated the installation of in wall ATMs
which are weather proof and can be established in shopping malls or busy commercial localities
and have further reduced the transactions and operations costs for banks (Sambamurthy, 2010).
An automated teller machine or automatic teller machine (ATM) also known as an automated
banking machine is a computerized telecommunications device that provides the clients of a
financial institution with access to financial transactions in a public space without the need for a
cashier, human clerk or bank teller. On most modern ATMs the customer is identified by
inserting a plastic ATM card with a magnetic stripe or a plastic smart card with a chip that
contains a unique card number and some security information (Humphery, 2004).
2.2.6. What ATMs Do?
ATMs provide many of the most demanded deposit services. ATM services include cash
withdrawals, cash or check deposits, transfers among deposit accounts and bill payments.
The ATMs can and could more often in the future dispense physical goods to consumers.
Already, some ATMs dispense stamps, lottery tickets and gift cards etc (Wikimania, 2015).
Many banks employ tellers who handle basic transactions and senior level associates who help
customers open accounts and handle more complex transactions. Tellers can cash checks, make
13
deposits and withdrawals, provide account balance information and issue money orders. ATMs
serve many of the same functions, accepting checks and cash for deposit, displaying account
information and most popularly issuing cash (Dennis, 2014).
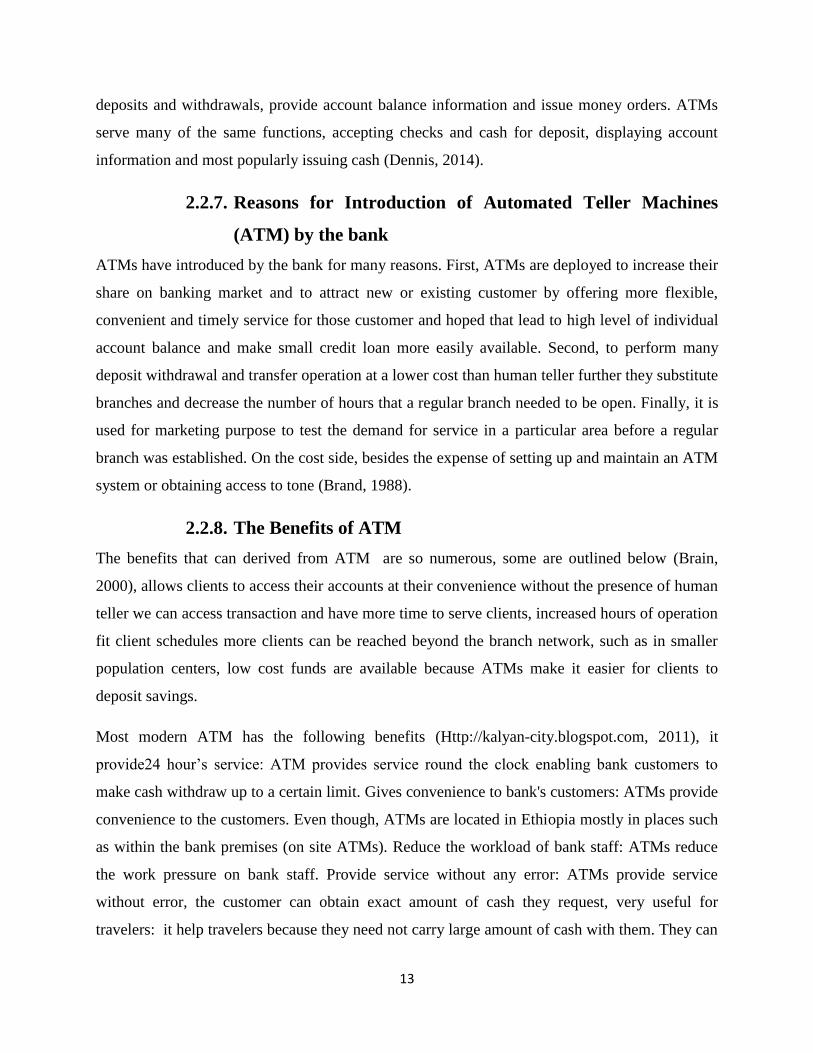
2.2.7. Reasons for Introduction of Automated Teller Machines
(ATM) by the bank
ATMs have introduced by the bank for many reasons. First, ATMs are deployed to increase their
share on banking market and to attract new or existing customer by offering more flexible,
convenient and timely service for those customer and hoped that lead to high level of individual
account balance and make small credit loan more easily available. Second, to perform many
deposit withdrawal and transfer operation at a lower cost than human teller further they substitute
branches and decrease the number of hours that a regular branch needed to be open. Finally, it is
used for marketing purpose to test the demand for service in a particular area before a regular
branch was established. On the cost side, besides the expense of setting up and maintain an ATM
system or obtaining access to tone (Brand, 1988).
2.2.8. The Benefits of ATM
The benefits that can derived from ATM are so numerous, some are outlined below (Brain,
2000), allows clients to access their accounts at their convenience without the presence of human
teller we can access transaction and have more time to serve clients, increased hours of operation
fit client schedules more clients can be reached beyond the branch network, such as in smaller
population centers, low cost funds are available because ATMs make it easier for clients to
deposit savings.
Most modern ATM has the following benefits (Http://kalyan-city.blogspot.com, 2011), it
provide24 hour‟s service: ATM provides service round the clock enabling bank customers to
make cash withdraw up to a certain limit. Gives convenience to bank's customers: ATMs provide
convenience to the customers. Even though, ATMs are located in Ethiopia mostly in places such
as within the bank premises (on site ATMs). Reduce the workload of bank staff: ATMs reduce
the work pressure on bank staff. Provide service without any error: ATMs provide service
without error, the customer can obtain exact amount of cash they request, very useful for
travelers: it help travelers because they need not carry large amount of cash with them. They can

14
withdraw cash from any city or state, across the country and even from outside their country.
ATMs may give customers new currency notes: Customers may get brand new currency notes
from ATMs the monies loaded into ATMs are often new and intact, this is because torn and
soiled monies normally jam the machine, provide privacy in banking transactions to the customer
He/she was not shy to withdraw a very small amount of money from the machine as compared to
withdrawing that same amount of money from the teller and ATM technology has reduced paper
work because it does not require a customer to fill cash withdrawal slips or cheques in order to
withdraw money.
2.2.9. Deployment of ATMs
The motivation behind deploying ATM by the bank and share with the customer are areas that
economists have investigated (Humphrey, 1993) examine that the motives for deploying ATM
are based on cost saving. He investigates that the cost of banking in U.S and how the cost are
influenced by the deployment of ATM. He finds that substantial scale economics in the
production of ATM service and that ATM transaction cost about half an amount that the same
transaction would cost if it were conducted in a branch of bank. However, no saving was realized
from significant expansion of ATM service. So the deployment of ATM at convenience place
can increased the number of transactions, leaving total bank cost roughly and also satisfying
consumer demand.
The deployment of ATMs by individual banks prior to the advent of sharing ATMs in the U.S by
considering the size of the bank and the geographic dispersion of the bank‟s depositors, they are
able to detect a significant network effect in the demand for ATM services by bank customers.
They examine a dynamic model of investment banks whose customers have a higher willingness
to pay for a service will invest in providing that service sooner than another bank that is similar
in other respects. Saloner and Shepard find that banks that have a more extensive branch network
adopted ATMs sooner than other large banks, as their customers could take better advantage of
the geographic diversity of ATM sites (usually provided at a bank‟s branches) in meeting their
demands for cash (Shepard, 1995).
2.2.10. Determinants of ATM deployment
(Ou et al. 2009) constructs a framework on determinants of ATM investment. Their framework
suggests that the ATM investments are influenced by bank scale, cost efficiency, and deposit
15
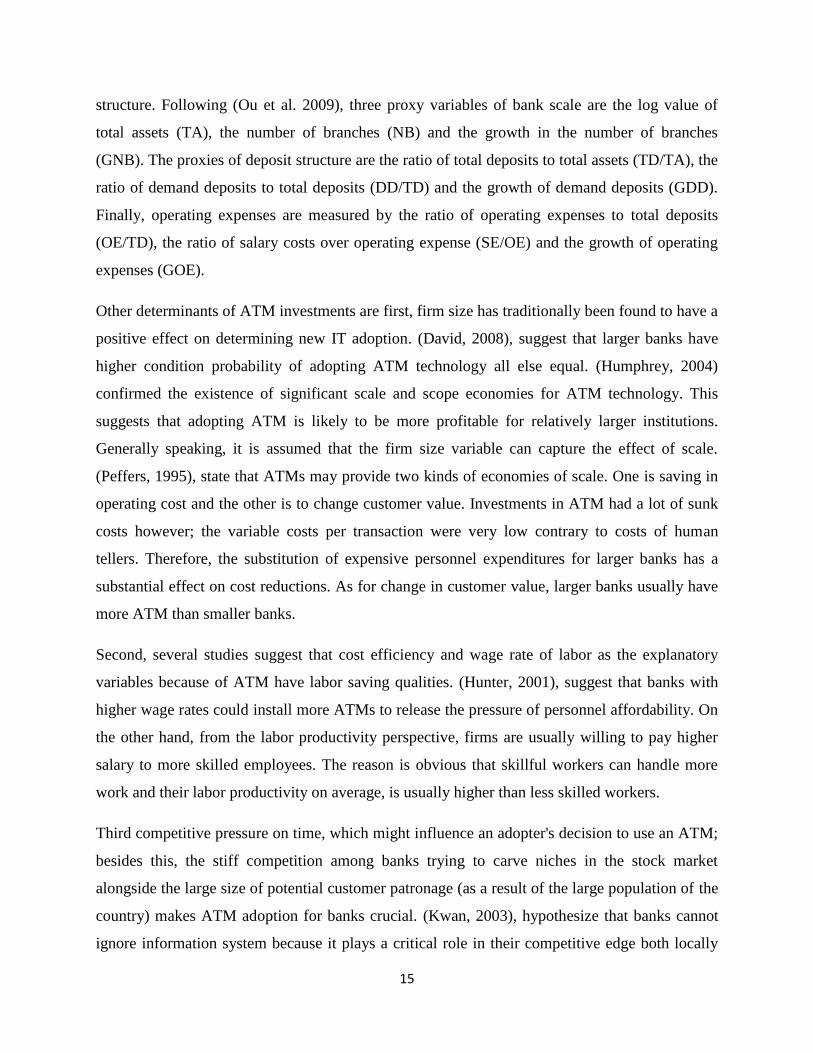
structure. Following (Ou et al. 2009), three proxy variables of bank scale are the log value of
total assets (TA), the number of branches (NB) and the growth in the number of branches
(GNB). The proxies of deposit structure are the ratio of total deposits to total assets (TD/TA), the
ratio of demand deposits to total deposits (DD/TD) and the growth of demand deposits (GDD).
Finally, operating expenses are measured by the ratio of operating expenses to total deposits
(OE/TD), the ratio of salary costs over operating expense (SE/OE) and the growth of operating
expenses (GOE).
Other determinants of ATM investments are first, firm size has traditionally been found to have a
positive effect on determining new IT adoption. (David, 2008), suggest that larger banks have
higher condition probability of adopting ATM technology all else equal. (Humphrey, 2004)
confirmed the existence of significant scale and scope economies for ATM technology. This
suggests that adopting ATM is likely to be more profitable for relatively larger institutions.
Generally speaking, it is assumed that the firm size variable can capture the effect of scale.
(Peffers, 1995), state that ATMs may provide two kinds of economies of scale. One is saving in
operating cost and the other is to change customer value. Investments in ATM had a lot of sunk
costs however; the variable costs per transaction were very low contrary to costs of human
tellers. Therefore, the substitution of expensive personnel expenditures for larger banks has a
substantial effect on cost reductions. As for change in customer value, larger banks usually have
more ATM than smaller banks.
Second, several studies suggest that cost efficiency and wage rate of labor as the explanatory
variables because of ATM have labor saving qualities. (Hunter, 2001), suggest that banks with
higher wage rates could install more ATMs to release the pressure of personnel affordability. On
the other hand, from the labor productivity perspective, firms are usually willing to pay higher
salary to more skilled employees. The reason is obvious that skillful workers can handle more
work and their labor productivity on average, is usually higher than less skilled workers.
Third competitive pressure on time, which might influence an adopter's decision to use an ATM;
besides this, the stiff competition among banks trying to carve niches in the stock market
alongside the large size of potential customer patronage (as a result of the large population of the
country) makes ATM adoption for banks crucial. (Kwan, 2003), hypothesize that banks cannot
ignore information system because it plays a critical role in their competitive edge both locally

16
and internationally, they pointed out that most fortune banks' cash flow is linked to their
adoption of information system. Competitive pressure in the banking industry can be explained
based on the number of banks competing in the market.
(Hwang et al.2009) suggest that competitiveness of environment as an organizational
characteristic among other factors is crucial in determining adoption of IT. Also found that
among other factors competitive pressure affect the adoption of data warehouse technology.
Fourth, value of ATM transactions the increased usage of ATMs is attributed to the increase in
number of ATMs in the country, awareness and ease as well as convenience of operating system.
This suggests that the value and volume of ATM transactions were influenced by the number of
ATM in the country. One would have expected the reverse suggesting that the deployment of
ATMs should have been in response of the increase value and volume of ATM transactions.
Finally, bank profitability past studies found inconclusive relationship between IT investments
and the profitability of banks. The relationship can be seen to be insignificant especially in the
short run due to high costs of investments in ICT (Saythe, 2000) , (Siam, 2006 ). However latest
studies seems to find a positive relationship between ICT and profitability. (Milne, 2006) ,
support this view when he stated that modernization of IT has set the stage for extraordinary
improvement in banking procedure throughout the world. The study reveals that IT brings down
the operational costs of the banks. Internet technology facilitates and speed up banks procedures
to accomplished standardized and low value added transactions. Past studies in developing
countries did not reflect any significant empirical relationship between ICT investment and
banks profitability. Previous studies in Nigeria don't show any significant empirical relationship
between ICT investments and the profitability of banks in Nigeria (Adewoye, 2007).
2.3. Empirical Literature Review
This section of the study is devoted to review papers investigated by different authors.
(Adriaine, 2000), examine a study on technology diffusion specifically ATM. The main
objective of the paper is to investigate the role of firm and industry specific factors in the
diffusion of ATM in UK financial sector. To achieve this goal the author has used panel data set
over the period of 1972-1997. The variables used under investigation were endogenous learning,
cumulative learning by doing effect, firm size, growth profitability and price expectation. Of the
included variables, growth profitability and price expectation were the main factors affecting the

17
diffusion of new technology. However, the role of stock has little evidence on the diffusion
process and recommended that to be robust across a number of specifications of baseline hazard
function.
(Jonathan, 2013), conduct a research on the impact of ATM on cost efficiency of banks in
Nigeria. The main objective is to analyze the impact of the intensity of ATM deployment on cost
efficiency and the specific objectives are to ascertain the determinants of ATM and to evaluate
the effect of ATM deployment on cost efficiency of Nigerian banks. Panel data is collected on
twenty two commercial banks for five years financial report and internal operational record. The
variables considered by the author as determinants of ATM deployment were bank size, bank
profitability, salary level, number of banks and value of ATM transaction. Finally, the finding
revealed that only bank size, salary level and value of ATM transaction were the key
determinants of ATM deployment.
(Chia, 2012), has investigated on the relationship between self service technology investment
and firm‟s financial performance. The prime objective of the study is to estimate the
determinants of ATM investment and then to estimate the impact of ATM on bank financial
performance. A time series data on eight categories of banking industry in Taiwan for one and
two period lag were gathered. The variables used under investigation are bank scale (log value
total asset, number of branches and change in number of branches), deposit structure (the ratio of
total deposit to total asset, ratio of demand deposit to total deposit and change in demand
deposit) and cost efficiency (ratio of operating expense to total deposit, ratio of salary expense to
operating expense and change in operating expense). The author found that there were significant
positive relationship between the independent variables and ATM investment thus,
recommended that not only use self service technology to enhance financial performance but
also use some other means.
A study is also conducted by Adewoye (2013), on the determinants of ATM deployment in
Nigerian banks. The main objective of the study is to examine the determinants of ATM
deployment in Nigerian banks using panel data set on twenty two commercial banks quoted by
Nigerian stock exchange market for the year 2007-2011. The variables under consideration were
employee‟s salary level, asset base, profitability, number of banks ,degree of competition and
value of ATM transaction. Among these variables only bank size, salary level and value of ATM
18
transaction were the key determinants of ATM deployment and recommended that banks in
Nigeria should continue to deploy ATM as a strategic tool to improve banks‟ efficiency.
(Hussein, 2017), undertook study on the effect of ATMs usage on operational performance of
commercial banks in Nakuru country, Kenya. The main objective of the study is to evaluate the
effect of ATMs usage on operational performance of commercial banks in Kenya. The study has
employed theories namely diffusion of innovation and theories of reasoned action. The authors
have used a correlation crossectional research design for 56 employees of the 28 commercial
banks were selected through simple random sampling technique. The variables used in the study
were ATMs usage and operational performance. The finding indicated that ATMs usage has
significant and positive relationship with operational performance and the authors recommended
that managements of commercial banks should highly invest on ATMs as it positively influences
operational performance.
(Aijaz, 2012), conduct a research on ATM fraud, the case of commercial banks in Pakistan. The
aim of the study is to investigate a mapping flaw bug in ATM controller commonly known as
financial middle ware. The methodology used is exploratory research design based on secondary
data since financial year 2006 for the state bank of Pakistan technology partners and ATM
switch operator. Banks internal control, lack of understanding of higher management on the
system and procedures of ATM infrastructure were the variables considered in the study. The
result reveals that banks internal control system has failed to detect the implementation of
mapping bug. Finally, the authors recommended that strong internal control implementation over
the payment system applications and detailed review of fraud screening strategy to ensure that
the security tool for the bank.
(Sultan, 2009), has investigated on impact of ATM on customer satisfaction: The case of three
major banks of India. The objective of the study is to examine the scenario of ATM in three
major banks, state bank of India, Housing Development Finance Corporation and industrial
credit and Investment Corporation of India. The methodology used by the author is analytical
and exploratory nature of design through primary and secondary data collection method for 360
respondents equally representing each bank by questionnaire. The variables were fee charged,
problem faced, post purchase behavior generally included by the martial customer satisfaction
level and abstract customer satisfaction level. The result shows that martial customer satisfaction

19
level is highest in state bank of India followed by industrial credit and Investment Corporation of
India, and Housing Development Finance Corporation. This is due to the size of the respective
bank and years of establishment.
Turning back to our country Ethiopia, a host of researches have been envisaged by previous
scholars with regard to electronic payments and issues related to customer‟s adoption of ATM.
Here are the studies that tried to assess adoption of ATM machines and others.
A research conducted by Balcha (2015), on aggressive branch expansion versus ATM and POS
machine use in awash international bank, Addis Ababa city. The main objective of the study is to
examine whether aggressive branch expansion of AIB is advisable or not. To achieve the
objective, the author employed descriptive research design and to gather qualitative and
quantitative data, both primary and secondary collection method for five branches were deemed.
The variables considered were gender, age, marital status and monthly income; the result shows
that aggressive branch expansion is not advantageous for AIB while, moderate branch expansion
along ATM /POS expansions is better for AIB from profit perspective.
(Addis, 2015), investigate the evaluation of customers‟ satisfaction regarding PSS primary
switch solution) ATM banking services in Addis Ababa. The main objective of the study is to
evaluate the extent of customers‟ satisfaction in using PSS ATM banking services. The
methodology used to achieve this objective is explanatory research design and cross sectional
data set covering five years period for 384 respondents of survey data. The result indicated that
most of PSS member bank customers‟ were satisfied with PSS ATM service. Finally, the author
recommended that PSS ATM service delivery system should be more flexible and more tailored
to enhance customers‟ satisfaction.
(Fyery, 2015), studied about ATM adoption of users in Commercial Bank of Ethiopia in Mekelle
branch. The general objective of the study is „ATM usage practice of ATM Customers in
Commercial Bank of Ethiopia; The Case of Mekelle Branch‟. A sample of 123 ATM adopters is
taken through convenience sampling for the study. Data is also collected using structured
questionnaire and analyzed through SPSS version 20 using descriptive statistical tools. The result
has shown that ATM adopters in the bank used only limited types of services predominantly cash
withdrawals. Lastly, the study recommended that the bank has to increase its promotion by
20
focusing on improving customers‟ awareness towards the technology and the different types of
services it provides.
Coming to conclusion, all the researches undertaken in Ethiopia were mainly focused on
assessing or evaluating customer side of ATMs and any other form of electronic payments
employed by commercial banks. There is no studies conducted so far that attempt to look
thoughtfully about the determinants of ATM deployments. Thus, this study aims to fill the
knowledge and policy gaps by identifying the determinants of ATM deployment: the case of
commercial banks of Ethiopia.
The above discussion indicated the impact of each explanatory variable on IT investment in
general and ATM investment decision in particular and most of the variables deemed as
determinants were significant to affect the deployment of ATMs. The following are some of the
variables given strong emphasis by previous scholars.
I. Cost efficiency on ATM deployment
Cost efficiency is three proxy variables, the ratio of operating expenses to total deposits
(OE/TD), the ratio of salary costs over operating expense (SE/OE) and the growth of operating
expenses (DOE). The bank with higher operating expense burdens to invest more ATMs in an
attempt to reduce their cost burdens because of reducing operating cost is one of the important
drivers for banks to invest in innovation of IT such as ATM. In general, the results suggested that
banks invest in ATMs to satisfy customers‟ needs for deposit related services and to improve
cost performance and have significant positive impact on ATM investment (Stump, 2004).
II. Bank Size on ATM deployment
The actual bank size has been found to have a positive effect in determining new IT such as
ATM deployment (Mcdowell, 1984) in examining the relationship between the decision of new
IT adoption and size of the bank found out that consistent with the economic scale theory; it
conclude that larger banks tend to introduce more ATM than small banks do. (Hwang et al,
2004) also examine the critical factors influencing the adoption of data warehouse technology in
the Taiwan banking industry and also found out that bank size affect the adoption of data
warehouse technology. (Chinet al, 2009) hypothesize also that larger banks invest more on ATM.
21
III. Deposit Ratio on ATM deployment
The coefficients of (TD/TA) and (DD/TD) or the proxies of deposit ratio are significantly
positive, indicating that banks with higher customer demand for deposit services and demand
deposit services tend to invest more on ATMs (Ou, 2009).
IV. Bank Profitability on ATM deployment
In line with the work of (Humphrey, 1994) and (Hung, 2009), the coefficients of bank
profitability are negative and are not statistically significant. The implication is that the extent of
ATM deployment is not really dependent on the bank profitability. But in recent studies
(Oyerinde, 2013) investigated that there is positive relationship between ATM deployment and
bank profitability and the coefficient of bank profitability is statistically significant.
Conclusions
This chapter discussed both the theortical and empirical literature review. The first section is
devoted to the theortical part: the concept, types of electronic banking and its practice in the
world at large and Ethiopia in particular. Besides, the concept, benefit, deployment and
determinants of ATMs have been explained. Meanwhile, empirical literature is dealt on the
second section: Different scholars have done a study in different aspect of ATM by using
different methodologies. Finally, the researcher is identified what has not been done earlier.
22
Chapter Three
3. Methodology of the Research
3.1. Introduction
Research methodology is the technique and procedures used to obtain or analyze research data
and finally help to achieve the desired objectives (Saunders, 2007). This chapter consists of the
study area profile, research approach that are used in the study, research design, target population
and sampling, variables and its measurement, sources and instruments of data collection, model
specification and method of data analysis.
3.2. Study Area Profile
The expansion of ATM banking service in Ethiopia is through progress and its emergence in
Ethiopia moved back to the late 2001, when the largest state owned or Commercial Bank of
Ethiopia (CBE) introduced ATM to deliver service to the local users (Gardachew et.al, 2010).
Though, due to lack of modern technology consciousness and appropriate infrastructure is
unsuccessful to provide capable service. Dashen Bank was the subsequent bank that has been
installed ATMs at suitable locations for its own customers since 2006 (Ibid). Both banks tried to
develop the ATM system by designing in the way to provide a secure electronic data-sharing
gateway between clients and banks by facilitating a smooth transaction (Abiy, 2012). Wegagen
Bank has signed an agreement with Technology Associates (TA), a Kenyan based information
technology (IT) firm for the development of the solutions for the card payment system and
installation of a network of ATMs on December 30, 2008 (Asrat, 2010). In February 2009, the
three private commercial banks; Nib International Bank, Awash International Bank and United
Bank have established separate entity under the name of Premiere Switch Solutions (PSS) with
165 million birr capitals (Amanayehu, 2008). The main objective of PSS formation is for the
common ATM operational function and control. This policy agreement signed to avoid possible
underutilization of the ATM system and to improve electronic card payment system in Ethiopia.
This agreement is the first significant cooperation between competing banks in Ethiopia, which
others should be encouraged to follow as there is no single bank in Ethiopia that can pay for
providing wide geographical coverage and access (Binyam, 2009).
23
3.3. Research Approaches
3.3.1. Quantitative research approach
Quantitative research is grounded in the post-positivism knowledge claim that primarily reflects
the scientific method of the natural sciences. This paradigm adopts a deductive approach to the
research process. The researcher gathers data from the real world setting and then analyses the
data statistically to support or reject the hypotheses (Babbie, 1995). Researchers who adopt a
more deductive approach use theory to guide the design of the study and the interpretation of the
results. In line with this, the overall objective of quantitative research is to test or verify a theory
rather than to develop one. Therefore, the theory offers a conceptual framework for the entire
study and it also serves as an organizing model for the entire data collection procedure.
(Churchill, 2005), has seen quantitative techniques as an attempt to test a hypothesis by
incorporating it into the research design and responding to it by measuring its strength and
weaknesses that give numerical measurements to the data collected. Quantitative researchers put
their emphasis on procedures, methodologies and statistics. As a result, it relies on statistical
techniques aided by computational algorithms and software packages for analysis the problem
under study. Quantitative research is one in which the investigator primarily uses positivist
claims for developing knowledge and its strategies of inquiries are associated with experimental
and survey research methods.
(Creswell, 2009), mentioned that experimental research seeks to determine if a specific treatment
influence an outcome. This impact is assessed by providing a specific treatment to one group and
withholding it from another and then determining how both groups scored on an outcome.
Therefore, pure experiment enables the researcher to manipulate an independent variable in order
to see the effect on the dependent variable with the random assignment of subjects to treatment
conditions while quasi experiments uses non randomized designs and it is a single subjects
design whereas, survey research provides quantitative or numeric description of research trends
attitudes or opinions of a population by studying a sample of population. It includes cross-
sectional (data will be collected in one point in time) and longitudinal studies (data will be
collected through time with different interval) using questionnaires, structured interviews and
documentary reviews for data collection with the intent of generalizing from the sample to the
population.
24
The well planned and implemented quantitative research has the merit of being able to make
generalizations, for a broader population, based on findings from the sample. To enhance the
generalization of findings quantitative research methods follow at least theoretically,
standardized procedures in sample selection, instrument design, implementation and analysis.
This standardization in turn increases the duplicability of procedures and the reliability of
findings and also can mitigate the impact of interviewer (if administered through direct
interviews) and interviewee biases (Ibid).
Notwithstanding the above advantage, quantitative research design has a number of limitations.
First, it belittles human individuality and the ability to think. Second, it fails to provide the
researcher with information on the context of the situation where the studied phenomenon
occurs. Third, it will have limited outcomes to only those outlined in the original research
proposal due to closed type questions and the structured format and finally, quantitative research
appears to lack flexibility in design which may be crucial when additional information revealed
through data collection needs further exploration for knowledge (Ibid).
In general, according to Mckerchar (2008), the choice among the three research approaches is
guided by mainly the research problem apart from the underlying philosophy of each research
method. That is, whether the research problem is based on a framework developed deductively
through a review of the literature and prefigured information to be collected in advance of the
study or to allow it to emerge from participants in the project or both. In light of the research
objective and hypotheses presented at the beginning of the chapter along with the underlying
philosophy of each research approach. In this study, the researcher adopted quantitative approach
as the objectives of the study is to quantify data by generalizing results from sample to
population and the data were presented in the form of numbers and statistics. In addition, both
the dependent and independent variables are continuous (Bhattacherjee, 2012).
3.4. Research Design
The choice of research design depends on objectives that researcher want to achieve (Alemayhu,
2009).
25
3.4.1. Explanatory Research
Seeks explanations of observed phenomena, problems or behaviors and seeks answers to why
and how types of questions. Attempt to connect the dots in research, by identifying causal factors
and outcomes of the target phenomenon. It involves: Explaining things not just reporting why?
Elaborating and enriching a theory's explanation, determining which of several explanations is
best, determining the accuracy of the theory, test a theory's predictions and also examines the
cause and effect relationships between dependent and independent variable (Kothari, 2004). As a
result, the study is employed explanatory research design and panel data set to address a broader
range of issues and tackle more complex problems, to examine the relationship between the
dependant and in dependant variables changes dynamically (over time). Panel data structured the
model in an appropriate way it can improve the impact of certain forms of omitted variables bias
in regression results (Brook, 2014 ). It is a data set in which the behavior of entities is observed
across time because of panel data allows the researcher to control variables that cannot observe
than pure time series or pure cross sectional data alone (Baltagi, 2008) .
3.5. Target Population and Sampling
The target populations for this study were both private and state owned commercial banks of
Ethiopia. According to the national bank of Ethiopia (2015/16) report, there are 18 banks in
Ethiopia. Using non-probability sampling technique that is purposive judgmental sampling, the
researcher has selected thirteen banks out of eighteen banks. The purposively chosen banks were
Bank of Abyssinia, Commercial Bank of Ethiopia, Wegagen Bank, Awash International Bank,
Dashen Bank, United Bank, Nib International Bank, Lion International Bank, Zemen Bank,
Berhan International bank, Abay Bank, Oromia International Bank and Cooperative Bank of
Oromia for the period 2012-2016 G.C. This period is selected to get well organized data as ATM
is a recent phenomenon. The remaining banks were not considered as part of this study since
they did not fulfill the judgment or criteria outlined by the researcher. Hence, for these banks, it
is hardly possible to find data on the outcome variable (ATM deployment) even for the chosen
time period.
26
3.6. Variables and its Measurement
The interest variable employed in the study is ATM deployment. It is measured in terms of
number of ATM deployed by banks. Bank size, bank profitability, deposit ratio, cost efficiency
and branch expansion are the explanatory variables for this study. Including more than one
explanatory variable in the model never indicates the absence of missed variables from the model
(Brooks, 2014). Thus, to minimize the effect of missed variables from the model, the researcher
is included disturbance term in this study.
3.6.1. Dependent Variable and Measurement
ATM deployment means the number of ATM that is deployed by banks. The motive for
deploying ATMs are based on cost saving and it is measured by natural logarithm of the number
of ATM. Natural logarithm is used to scale down the value of the variable if there is higher digit
and to easily interpret the coefficient with elasticity.
3.6.2. Independent Variables and Measurements
Independent variables are explanatory variables that explain the dependent variable. The
independent variables for this study were bank size (Bsize), bank Profitability (Prof), deposit
ratio (Dsr), cost efficiency (Ce) and number of branch (Br). All of the above variables are
adopted from previous studies, for instance from Chin etal, (2009), Hannan and Mcdowell
(1984) and others based on the degree of their effect on ATM deployment.
Bank Size
The actual bank size has been found to have encouraging effect in determining new IT such as
ATM deployment. By examining the relationship between the decision of new IT adoption and
its determinants, (Hwang etal, 2004), found consistent results with economic scale theory; larger
banks tend to introduce more ATM than small banks do. They also examined the critical factors
influencing the adoption of data warehouse technology in the Taiwan banking industry and also
found that bank size affect the adoption of data warehouse technology opined that operating
scale which is represented by total assets, number of branches as well as growth in branches
were positive and significant. They posited also that larger banks invest more on ATMs. Bank
size is measured by natural logarithm of total asset.

27
Bank Profitability
Profitability could be measured in terms of return on equity (ROE) or return on Assets. ROE
measures the return to share holder capital while ROA indicates or measures income earned on
each asset unit and ROE is not most favorable measure of profitability even if the degree of
capitalization often established by regulatory authority. In the study of Adewoye (2013), ROA is
the key measure of profitability for banks. Hence, in this paper, ROA (the ratio of net income
after tax to its total asset) is used as the measure of profitability. Profitable bank would invest
more in asset acquisition including ICT investment. Past studies found inconclusive relationship
between IT investments and the profitability of banks. The relationship can be seen to be
insignificant especially in the short run due to high costs of investments in ICT (Huang, 2012).
However, most recent studies found that there is a positive relationship between ICT and
profitability. (Milne, 2006) state that modernization of IT has set the stage for extraordinary
improvement in banking procedure throughout the world.
Deposit ratio
According to Yen (2011), the bank with higher customer demand for deposit service tend to
invest more on ATM because the banks invest on modern technology particularly ATM to
increase customer satisfaction and thereby to attract deposits. It is measured by the ratio of total
deposit to total asset.
Cost efficiency
The bank with higher operating expense burdens to invest more on ATM in an attempt to reduce
their cost burdens because the bank invest on ATM to improve cost performance. Thus, the
relationship between operating expense and ATMs investment are positive. Cost efficiency is
measured by the ratio of operating expense to total deposit (Ou, 2009) .
Branch expansion
When the bank expands the number of branches it may also expand the technology like ATM to
convince and attract customers in line with the branch. The main reason to expand the branch is
deposit mobilization and this variable is measured by the number of branches (Ou, 2009).
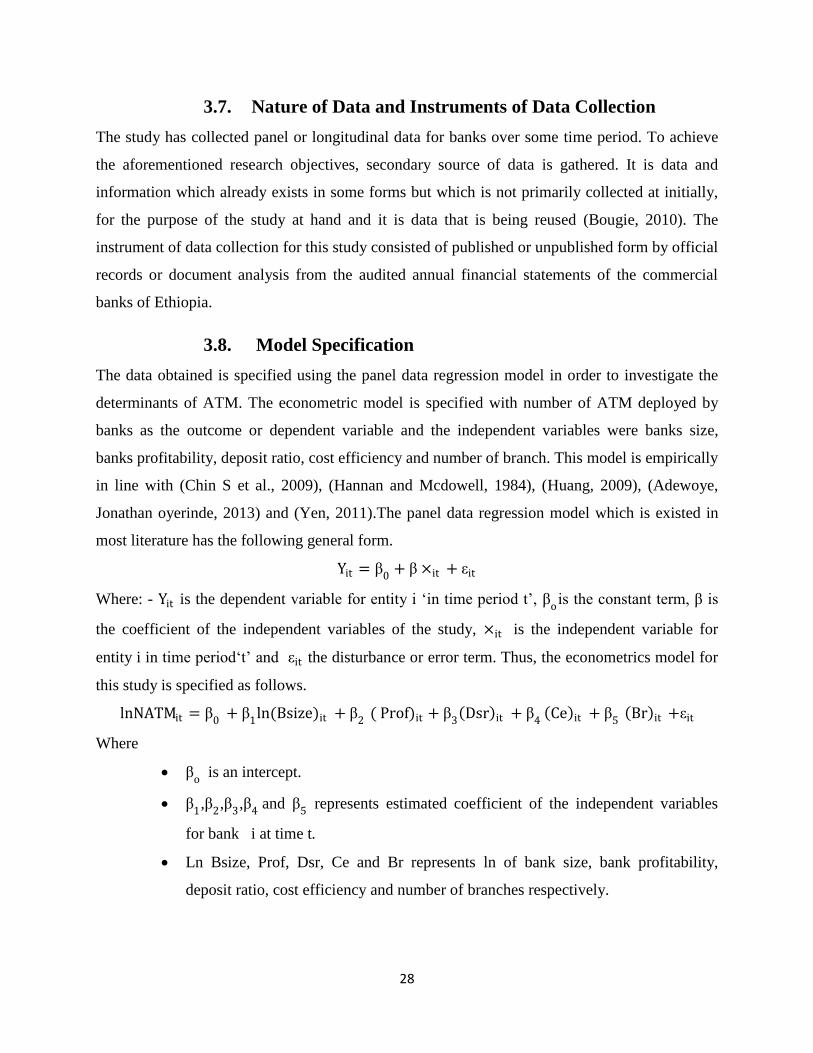
28
3.7. Nature of Data and Instruments of Data Collection
The study has collected panel or longitudinal data for banks over some time period. To achieve
the aforementioned research objectives, secondary source of data is gathered. It is data and
information which already exists in some forms but which is not primarily collected at initially,
for the purpose of the study at hand and it is data that is being reused (Bougie, 2010). The
instrument of data collection for this study consisted of published or unpublished form by official
records or document analysis from the audited annual financial statements of the commercial
banks of Ethiopia.
3.8. Model Specification
The data obtained is specified using the panel data regression model in order to investigate the
determinants of ATM. The econometric model is specified with number of ATM deployed by
banks as the outcome or dependent variable and the independent variables were banks size,
banks profitability, deposit ratio, cost efficiency and number of branch. This model is empirically
in line with (Chin S et al., 2009), (Hannan and Mcdowell, 1984), (Huang, 2009), (Adewoye,
Jonathan oyerinde, 2013) and (Yen, 2011).The panel data regression model which is existed in
most literature has the following general form.
Yit = β0
+ β ×it + εit
Where: - Yit is the dependent variable for entity i „in time period t‟, βois the constant term, β is
the coefficient of the independent variables of the study, ×it is the independent variable for
entity i in time period„t‟ and εit the disturbance or error term. Thus, the econometrics model for
this study is specified as follows.
lnNATMit = β0
+ β1
ln(Bsize)it + β2
( Prof)it + β3 Dsr it + β
4 Ce it + β
5 Br it +εit
Where
βo
is an intercept.
β1,β
2,β
3,β
4 and β
5 represents estimated coefficient of the independent variables
for bank i at time t.
Ln Bsize, Prof, Dsr, Ce and Br represents ln of bank size, bank profitability,
deposit ratio, cost efficiency and number of branches respectively.

29
εit represents error terms for intentionally/ un intentionally omitted variables. It
has zero mean, constant variance and non auto correlated.
The estimators in econometrics model are pooled OLS, Random effect and fixed effect.
Comparisons of Pooled OLS vs Panel model estimators
The researcher is employed LM (Breusch-Pagan Lagrange multiplier) to know whether the
pooled OLS or random effect model is preferred. The same observations are used over time and
unobserved heterogeneity can be controlled in panel data where as in pooled OLS data it cannot
control unobserved heterogeneity and has the problem of omitted variables. The panel frame
work explains that there are K regressor in Xit with no constant term whereas, pooled OLS is
very basic process that use when it have a panel data, pool the data and estimate OLS regression.
So relating to the basic framework above if zi has a constant term, OLS is consistent and
efficient estimate of α and the slope vector β (Green, 2012)
The null hypothesis in the LM test is variance across entities is zero or there is no significant
difference across units (no panel effect) that mean pooled OLS are appropriate using command
xttest0 (William, 2008).
The researcher also used F-test to identify whether pooled OLS or fixed effect is appropriate
model for the study. The null hypothesis under this test is that pooled OLS is appropriate for the
study while rejecting the null hypothesis is that fixed effect model is appropriate (Green, 2012).
Comparisons of Fixed vs Random effect model
Fixed effect (within estimator) design is that it allows for the unit specific effect (unobserved
heterogeneity or omitted) to be correlated with the regressor where as the random effect
(covariance model) assumes that the unit‐specific effect is uncorrelated with the regressor. The
researcher is used Hausman test to decide whether random effect or fixed effect model is fit the
data well using command husman fixed random. The null hypothesis is that the preferred model
is random effects that means there is no correlation between regressor and un observed effects
whereas, the alternative hypothesis says fixed effects model is preferred meaning there is
correlation between them (James, 2007 ).
30
Specification test
Various diagnostic tests such as linearity, heteroscedasticity, serial autocorrelation, normality
and multicolinearity test are conducted to decide whether the model used in the study is
appropriate and to fulfill the assumption of classical linear regression model. Thus, in order to
examine the possible degree of multicolinearity among variables variance inflation factor is used.
Heteroscedasticity is tested by using group wise heteroscedasticity using command xttest3, the
null is homoscedasticity (or constant variance) and reject the null or alternative hypothesis is
heteroscedasticity. Serial correlation tested by Wooldridge autocorrelation using command
xtserial, The null is no serial correlation, fail to reject the null means the researcher concluded
that data does not have first-order autocorrelation .Whereas, the remaining test that are linearity
and normality can be tested by Ramsey reset test and Shapiro W / Normality P-P plot
respectively (Wooldridge, 2002).
3.9. Method of data Analysis
As noted by (Kothari, 2004), data has to be analyzed in line with the purpose of the research plan
after data collection. Thus, the study employed descriptive and panel model econometric analysis
based on panel data collected from thirteen banks for the period 2012-2016. The data collected
from secondary sources are coded, checked and entered to simple excel program to make the
data ready for analysis. Then the collected data is entered and analyzed through STATA version
12 software packages. For descriptive analysis; table and graph are used to analyze the data.
Besides, results of the descriptive statistics such as mean, standard deviation, minimum and
maximum values were reported to describe the characteristics of variables under investigation.
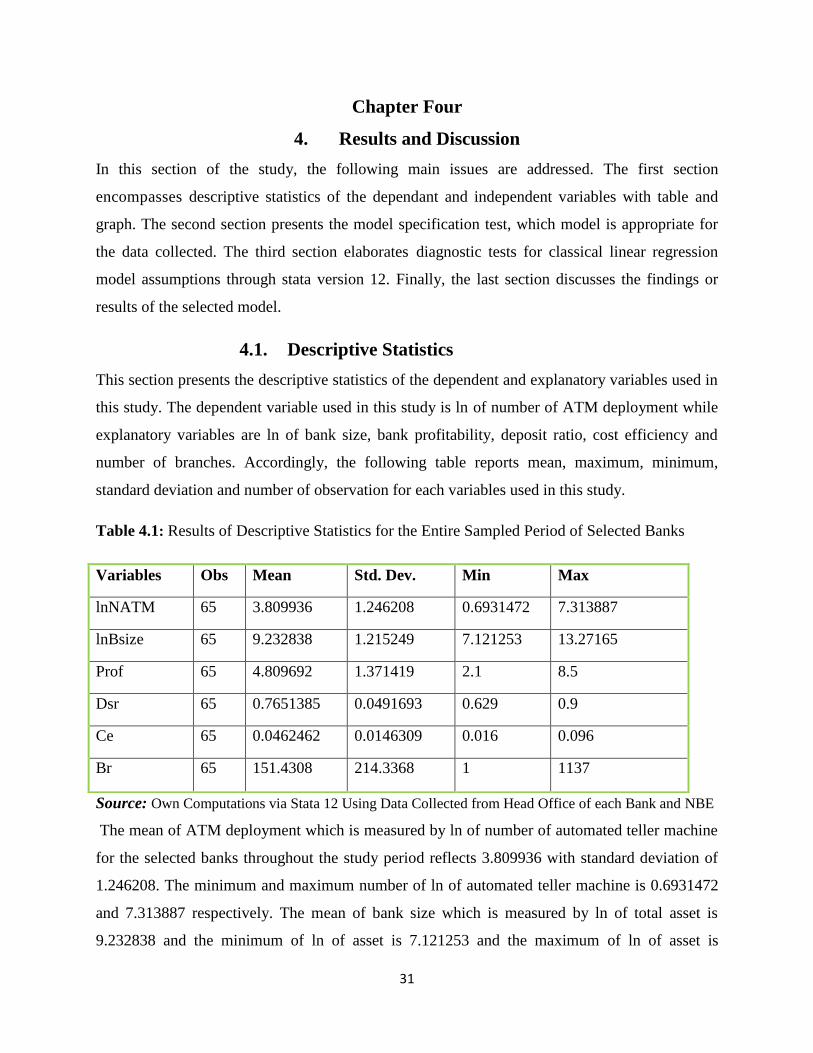
31
Chapter Four
4. Results and Discussion
In this section of the study, the following main issues are addressed. The first section
encompasses descriptive statistics of the dependant and independent variables with table and
graph. The second section presents the model specification test, which model is appropriate for
the data collected. The third section elaborates diagnostic tests for classical linear regression
model assumptions through stata version 12. Finally, the last section discusses the findings or
results of the selected model.
4.1. Descriptive Statistics
This section presents the descriptive statistics of the dependent and explanatory variables used in
this study. The dependent variable used in this study is ln of number of ATM deployment while
explanatory variables are ln of bank size, bank profitability, deposit ratio, cost efficiency and
number of branches. Accordingly, the following table reports mean, maximum, minimum,
standard deviation and number of observation for each variables used in this study.
Table 4.1: Results of Descriptive Statistics for the Entire Sampled Period of Selected Banks
Source: Own Computations via Stata 12 Using Data Collected from Head Office of each Bank and NBE
The mean of ATM deployment which is measured by ln of number of automated teller machine
for the selected banks throughout the study period reflects 3.809936 with standard deviation of
1.246208. The minimum and maximum number of ln of automated teller machine is 0.6931472
and 7.313887 respectively. The mean of bank size which is measured by ln of total asset is
9.232838 and the minimum of ln of asset is 7.121253 and the maximum of ln of asset is
Variables Obs Mean Std. Dev. Min Max
lnNATM 65 3.809936 1.246208 0.6931472 7.313887
lnBsize 65 9.232838 1.215249 7.121253 13.27165
Prof 65 4.809692 1.371419 2.1 8.5
Dsr 65 0.7651385 0.0491693 0.629 0.9
Ce 65 0.0462462 0.0146309 0.016 0.096
Br 65 151.4308 214.3368 1 1137
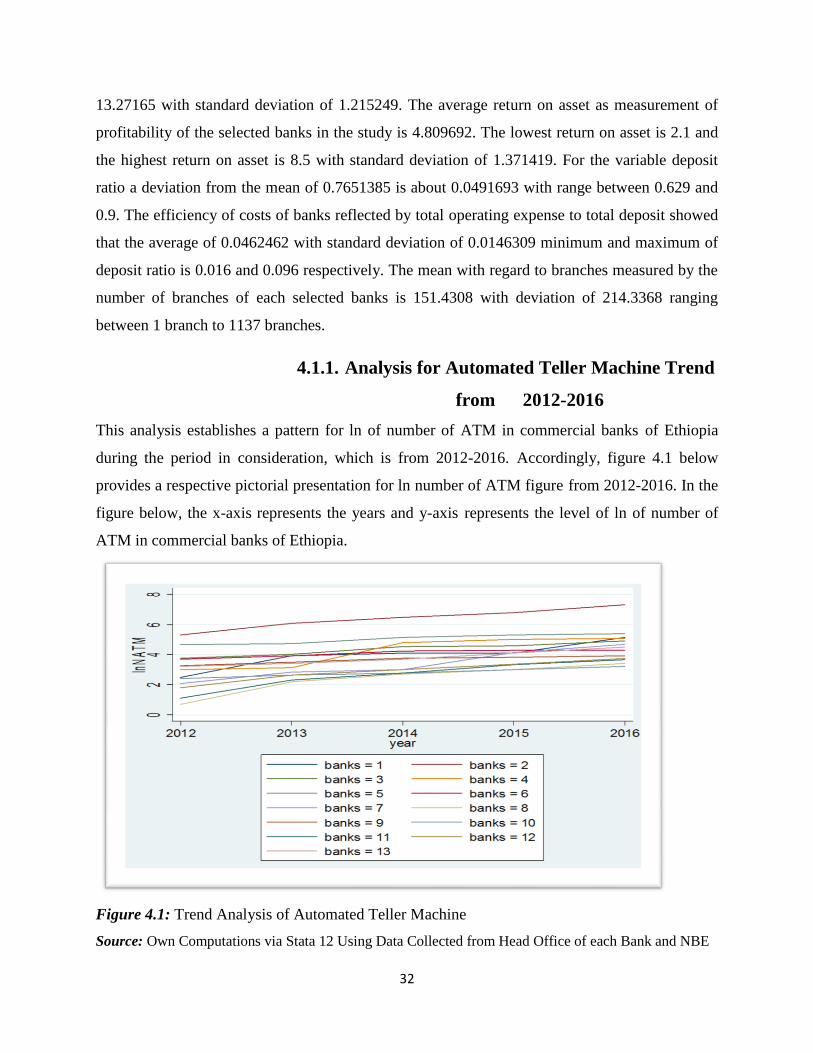
32
13.27165 with standard deviation of 1.215249. The average return on asset as measurement of
profitability of the selected banks in the study is 4.809692. The lowest return on asset is 2.1 and
the highest return on asset is 8.5 with standard deviation of 1.371419. For the variable deposit
ratio a deviation from the mean of 0.7651385 is about 0.0491693 with range between 0.629 and
0.9. The efficiency of costs of banks reflected by total operating expense to total deposit showed
that the average of 0.0462462 with standard deviation of 0.0146309 minimum and maximum of
deposit ratio is 0.016 and 0.096 respectively. The mean with regard to branches measured by the
number of branches of each selected banks is 151.4308 with deviation of 214.3368 ranging
between 1 branch to 1137 branches.
4.1.1. Analysis for Automated Teller Machine Trend
from 2012-2016
This analysis establishes a pattern for ln of number of ATM in commercial banks of Ethiopia
during the period in consideration, which is from 2012-2016. Accordingly, figure 4.1 below
provides a respective pictorial presentation for ln number of ATM figure from 2012-2016. In the
figure below, the x-axis represents the years and y-axis represents the level of ln of number of
ATM in commercial banks of Ethiopia.
Figure 4.1: Trend Analysis of Automated Teller Machine
Source: Own Computations via Stata 12 Using Data Collected from Head Office of each Bank and NBE
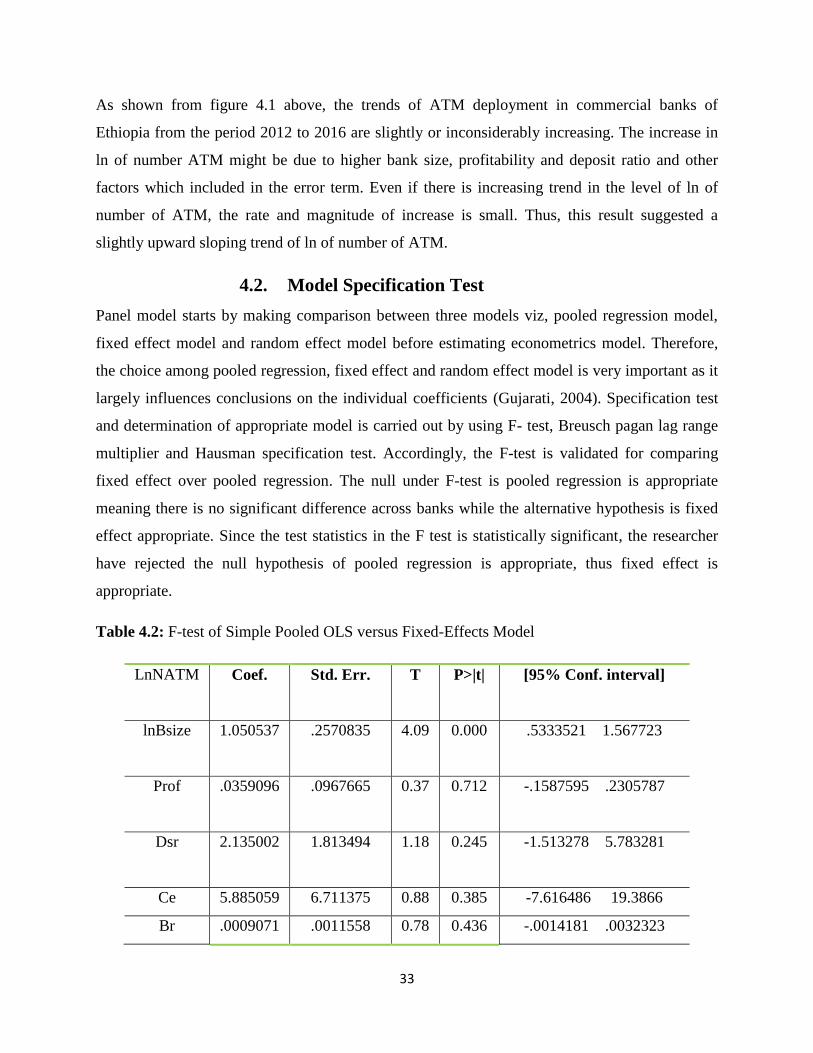
33
As shown from figure 4.1 above, the trends of ATM deployment in commercial banks of
Ethiopia from the period 2012 to 2016 are slightly or inconsiderably increasing. The increase in
ln of number ATM might be due to higher bank size, profitability and deposit ratio and other
factors which included in the error term. Even if there is increasing trend in the level of ln of
number of ATM, the rate and magnitude of increase is small. Thus, this result suggested a
slightly upward sloping trend of ln of number of ATM.
4.2. Model Specification Test
Panel model starts by making comparison between three models viz, pooled regression model,
fixed effect model and random effect model before estimating econometrics model. Therefore,
the choice among pooled regression, fixed effect and random effect model is very important as it
largely influences conclusions on the individual coefficients (Gujarati, 2004). Specification test
and determination of appropriate model is carried out by using F- test, Breusch pagan lag range
multiplier and Hausman specification test. Accordingly, the F-test is validated for comparing
fixed effect over pooled regression. The null under F-test is pooled regression is appropriate
meaning there is no significant difference across banks while the alternative hypothesis is fixed
effect appropriate. Since the test statistics in the F test is statistically significant, the researcher
have rejected the null hypothesis of pooled regression is appropriate, thus fixed effect is
appropriate.
Table 4.2: F-test of Simple Pooled OLS versus Fixed-Effects Model
LnNATM Coef. Std. Err. T P>|t| [95% Conf. interval]
lnBsize
1.050537 .2570835 4.09 0.000 .5333521 1.567723
Prof
.0359096 .0967665 0.37 0.712 -.1587595 .2305787
Dsr
2.135002 1.813494 1.18 0.245 -1.513278 5.783281
Ce 5.885059 6.711375 0.88 0.385 -7.616486 19.3866
Br .0009071 .0011558 0.78 0.436 -.0014181 .0032323
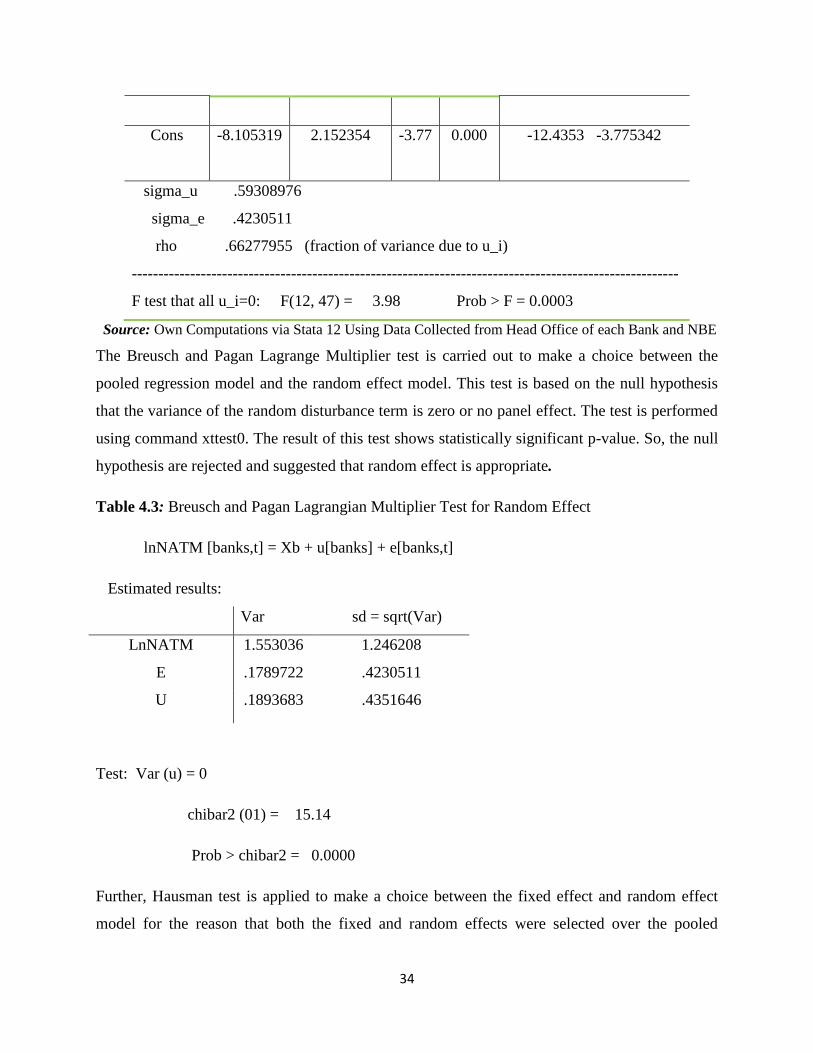
34
Cons
-8.105319 2.152354 -3.77 0.000 -12.4353 -3.775342
sigma_u .59308976
sigma_e .4230511
rho .66277955 (fraction of variance due to u_i)
-------------------------------------------------------------------------------------------------------
F test that all u_i=0: F(12, 47) = 3.98 Prob > F = 0.0003
Source: Own Computations via Stata 12 Using Data Collected from Head Office of each Bank and NBE
The Breusch and Pagan Lagrange Multiplier test is carried out to make a choice between the
pooled regression model and the random effect model. This test is based on the null hypothesis
that the variance of the random disturbance term is zero or no panel effect. The test is performed
using command xttest0. The result of this test shows statistically significant p-value. So, the null
hypothesis are rejected and suggested that random effect is appropriate.
Table 4.3: Breusch and Pagan Lagrangian Multiplier Test for Random Effect
lnNATM [banks,t] = Xb + u[banks] + e[banks,t]
Estimated results:
Var sd = sqrt(Var)
LnNATM 1.553036 1.246208
E .1789722 .4230511
U .1893683 .4351646
Test: Var (u) = 0
chibar2 (01) = 15.14
Prob > chibar2 = 0.0000
Further, Hausman test is applied to make a choice between the fixed effect and random effect
model for the reason that both the fixed and random effects were selected over the pooled
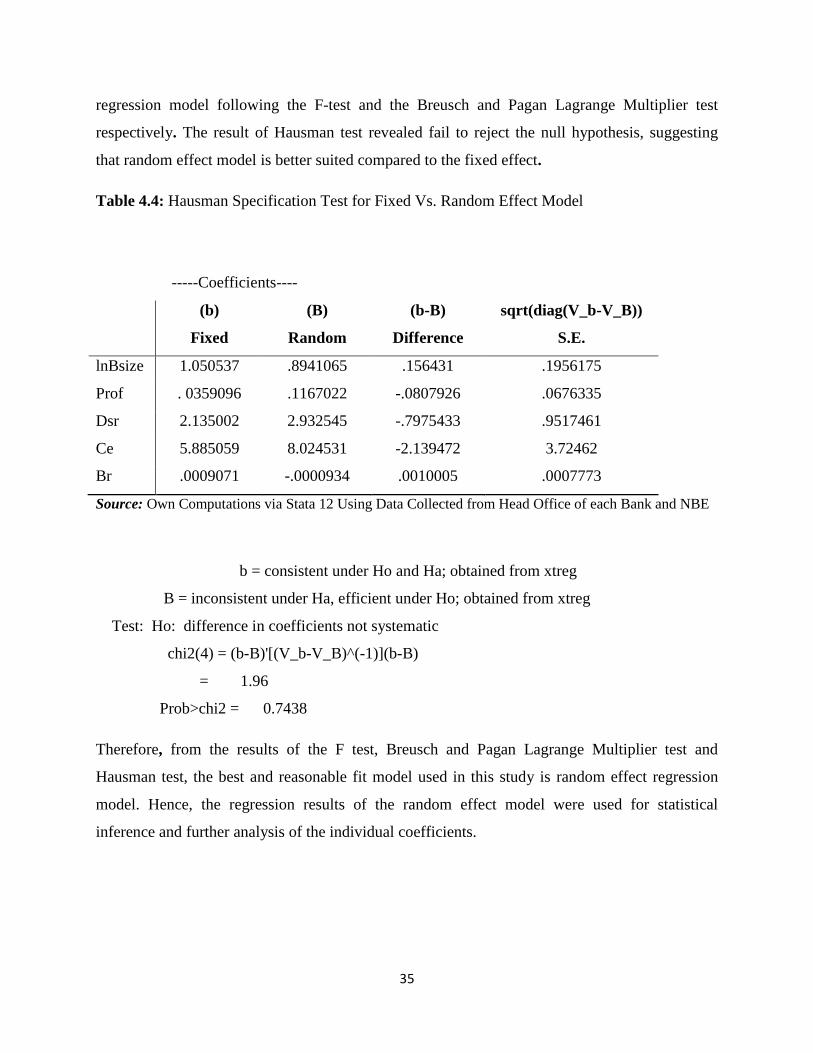
35
regression model following the F-test and the Breusch and Pagan Lagrange Multiplier test
respectively. The result of Hausman test revealed fail to reject the null hypothesis, suggesting
that random effect model is better suited compared to the fixed effect.
Table 4.4: Hausman Specification Test for Fixed Vs. Random Effect Model
-----Coefficients----
(b)
Fixed
(B)
Random
(b-B)
Difference
sqrt(diag(V_b-V_B))
S.E.
lnBsize 1.050537 .8941065 .156431 .1956175
Prof . 0359096 .1167022 -.0807926 .0676335
Dsr 2.135002 2.932545 -.7975433 .9517461
Ce 5.885059 8.024531 -2.139472 3.72462
Br .0009071 -.0000934 .0010005 .0007773
Source: Own Computations via Stata 12 Using Data Collected from Head Office of each Bank and NBE
b = consistent under Ho and Ha; obtained from xtreg
B = inconsistent under Ha, efficient under Ho; obtained from xtreg
Test: Ho: difference in coefficients not systematic
chi2(4) = (b-B)'[(V_b-V_B)^(-1)](b-B)
= 1.96
Prob>chi2 = 0.7438
Therefore, from the results of the F test, Breusch and Pagan Lagrange Multiplier test and
Hausman test, the best and reasonable fit model used in this study is random effect regression
model. Hence, the regression results of the random effect model were used for statistical
inference and further analysis of the individual coefficients.

36
4.3. Diagnostic Tests for Classical Linear Regression
Model Assumptions
4.3.1. Multicolinearity
This assumption states that explanatory variables are not correlated with one another. A problem
occurs when the explanatory variables are very highly correlated with each other, and this
problem is known as multicolinearity. If problems of near multicolinearity is present but ignored,
R2 will be high but the individual coefficients will have high standard errors, so that the
regression looks good as a whole, but the individual variables are not significant (Brooks, 2014).
The severity of the problem of multicolinearity across the independent variables is detected
through variance inflation factors (VIF). According to (Gujarati, 2004), as a rule of thumb
variables are considered as highly collinear if the VIF exceeds 10. In this study, the result shows
that mean VIF of 3.08 which is lower than 10 and suggested that there is no severe
multicolinearity problem in the estimated model.
Table 4.5: Test of Multicolinearity using Variance Inflation Factor (VIF)
Variables VIF 1/VIF
LnBsize 6.32 0.158110
Br 4.75 0.210344
Ce 1.54 0.649743
Prof 1.46 0.682779
Dsr 1.32 0.757257
Mean VIF 3.08
4.3.2. Linearity test
One of the classical linear regression models assumptions is that the appropriate functional form
is linear. This means that the appropriate model is assumed to be linear in the parameters and that
in the bivariate case, the relationship between y and x can be represented by a straight line
(Brook, 2014). For this study, the Ramsey reset test is performed for linearity with the null
hypothesis of model has no omitted variables. As the result shows, p-value is statistically
insignificant supporting the null hypothesis of the functional form is linear.
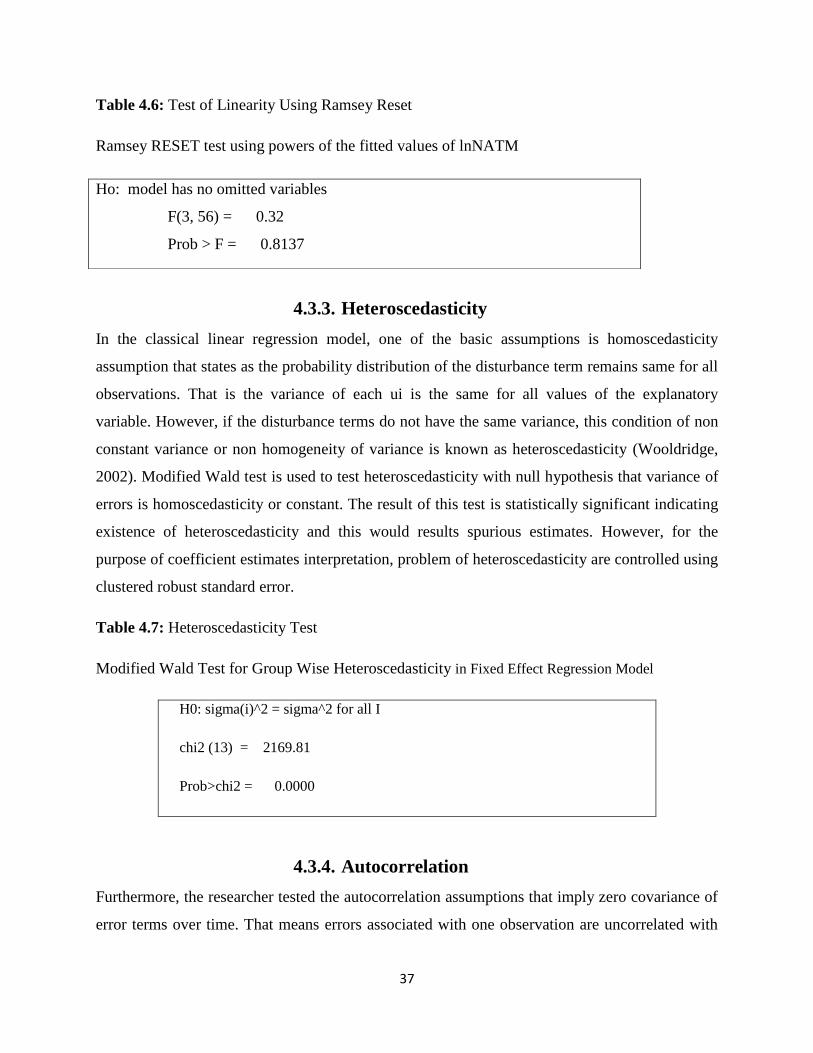
37
Table 4.6: Test of Linearity Using Ramsey Reset
Ramsey RESET test using powers of the fitted values of lnNATM
4.3.3. Heteroscedasticity
In the classical linear regression model, one of the basic assumptions is homoscedasticity
assumption that states as the probability distribution of the disturbance term remains same for all
observations. That is the variance of each ui is the same for all values of the explanatory
variable. However, if the disturbance terms do not have the same variance, this condition of non
constant variance or non homogeneity of variance is known as heteroscedasticity (Wooldridge,
2002). Modified Wald test is used to test heteroscedasticity with null hypothesis that variance of
errors is homoscedasticity or constant. The result of this test is statistically significant indicating
existence of heteroscedasticity and this would results spurious estimates. However, for the
purpose of coefficient estimates interpretation, problem of heteroscedasticity are controlled using
clustered robust standard error.
Table 4.7: Heteroscedasticity Test
Modified Wald Test for Group Wise Heteroscedasticity in Fixed Effect Regression Model
H0: sigma(i)^2 = sigma^2 for all I
chi2 (13) = 2169.81
Prob>chi2 = 0.0000
4.3.4. Autocorrelation
Furthermore, the researcher tested the autocorrelation assumptions that imply zero covariance of
error terms over time. That means errors associated with one observation are uncorrelated with
Ho: model has no omitted variables
F(3, 56) = 0.32
Prob > F = 0.8137
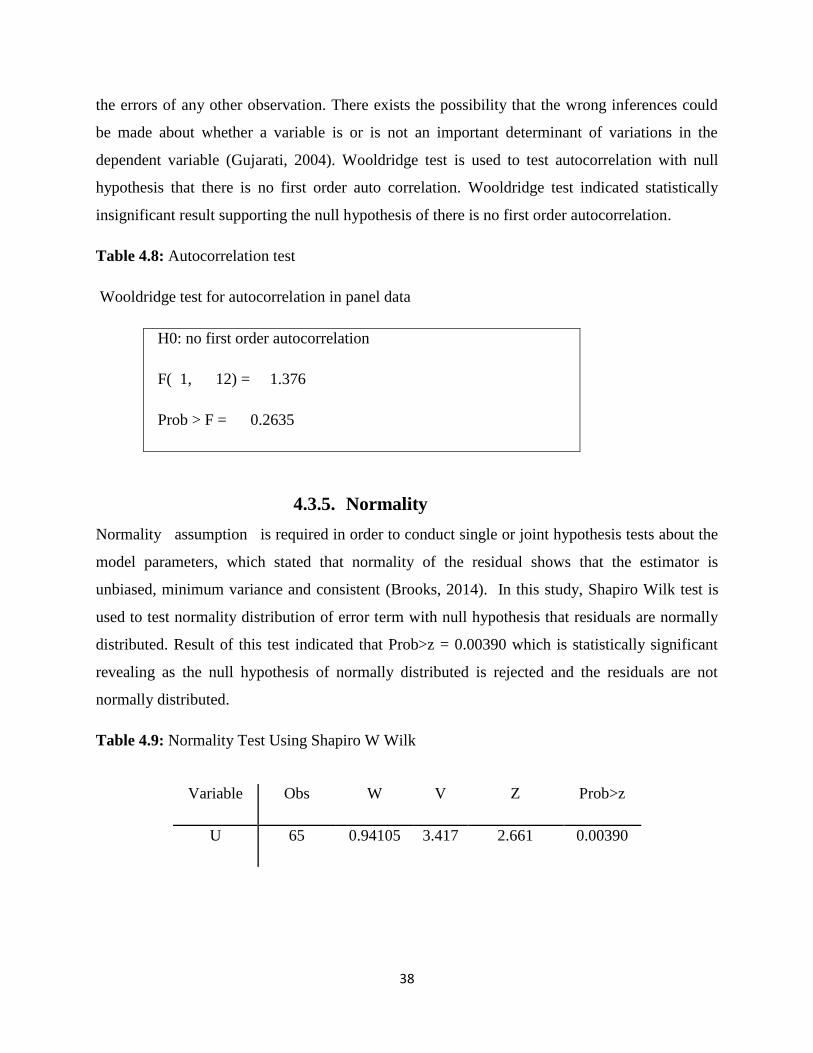
38
the errors of any other observation. There exists the possibility that the wrong inferences could
be made about whether a variable is or is not an important determinant of variations in the
dependent variable (Gujarati, 2004). Wooldridge test is used to test autocorrelation with null
hypothesis that there is no first order auto correlation. Wooldridge test indicated statistically
insignificant result supporting the null hypothesis of there is no first order autocorrelation.
Table 4.8: Autocorrelation test
Wooldridge test for autocorrelation in panel data
H0: no first order autocorrelation
F( 1, 12) = 1.376
Prob > F = 0.2635
4.3.5. Normality
Normality assumption is required in order to conduct single or joint hypothesis tests about the
model parameters, which stated that normality of the residual shows that the estimator is
unbiased, minimum variance and consistent (Brooks, 2014). In this study, Shapiro Wilk test is
used to test normality distribution of error term with null hypothesis that residuals are normally
distributed. Result of this test indicated that Prob>z = 0.00390 which is statistically significant
revealing as the null hypothesis of normally distributed is rejected and the residuals are not
normally distributed.
Table 4.9: Normality Test Using Shapiro W Wilk
Variable Obs W V Z Prob>z
U 65 0.94105 3.417 2.661 0.00390
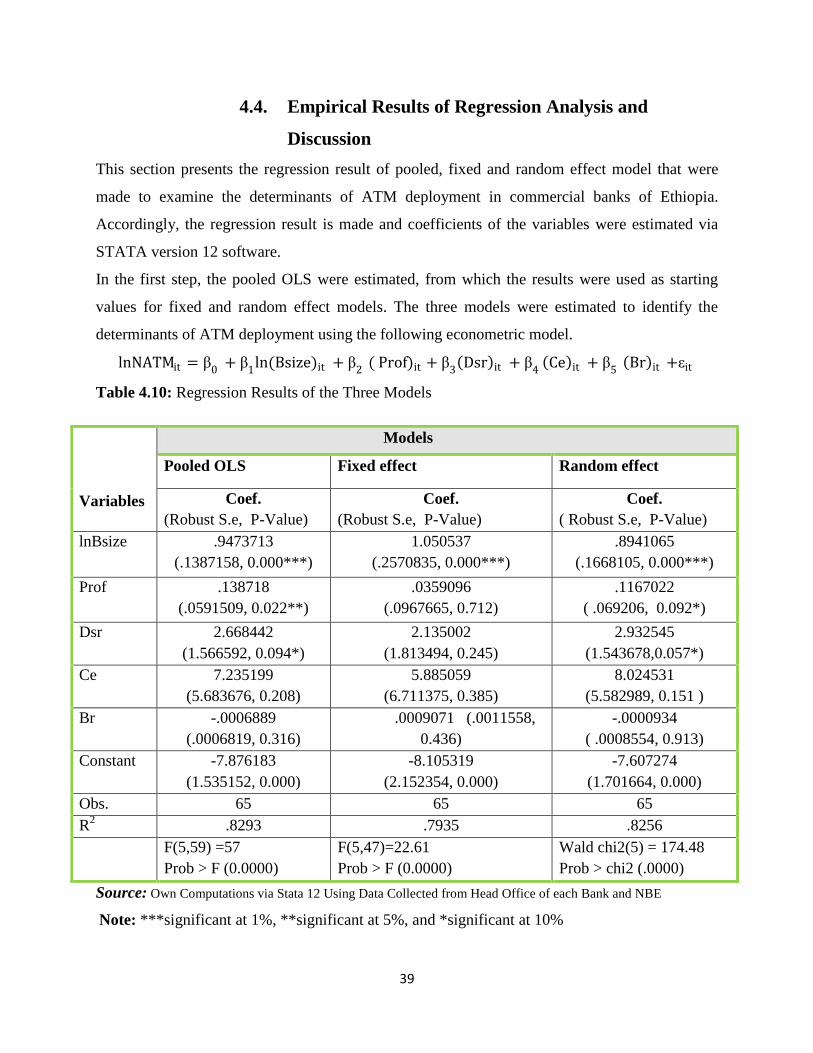
39
4.4. Empirical Results of Regression Analysis and
Discussion
This section presents the regression result of pooled, fixed and random effect model that were
made to examine the determinants of ATM deployment in commercial banks of Ethiopia.
Accordingly, the regression result is made and coefficients of the variables were estimated via
STATA version 12 software.
In the first step, the pooled OLS were estimated, from which the results were used as starting
values for fixed and random effect models. The three models were estimated to identify the
determinants of ATM deployment using the following econometric model.
lnNATMit = β0
+ β1
ln(Bsize)it + β2
( Prof)it + β3 Dsr it + β
4 Ce it + β
5 Br it +εit
Table 4.10: Regression Results of the Three Models
Source: Own Computations via Stata 12 Using Data Collected from Head Office of each Bank and NBE
Note: ***significant at 1%, **significant at 5%, and *significant at 10%
Variables
Models
Pooled OLS Fixed effect Random effect
Coef.
(Robust S.e, P-Value)
Coef.
(Robust S.e, P-Value)
Coef.
( Robust S.e, P-Value)
lnBsize .9473713
(.1387158, 0.000***)
1.050537
(.2570835, 0.000***)
.8941065
(.1668105, 0.000***)
Prof .138718
(.0591509, 0.022**)
.0359096
(.0967665, 0.712)
.1167022
( .069206, 0.092*)
Dsr 2.668442
(1.566592, 0.094*)
2.135002
(1.813494, 0.245)
2.932545
(1.543678,0.057*)
Ce 7.235199
(5.683676, 0.208)
5.885059
(6.711375, 0.385)
8.024531
(5.582989, 0.151 )
Br -.0006889
(.0006819, 0.316)
.0009071 (.0011558,
0.436)
-.0000934
( .0008554, 0.913)
Constant -7.876183
(1.535152, 0.000)
-8.105319
(2.152354, 0.000)
-7.607274
(1.701664, 0.000)
Obs. 65 65 65
R2 .8293 .7935 .8256
F(5,59) =57
Prob > F (0.0000)
F(5,47)=22.61
Prob > F (0.0000)
Wald chi2(5) = 174.48
Prob > chi2 (.0000)
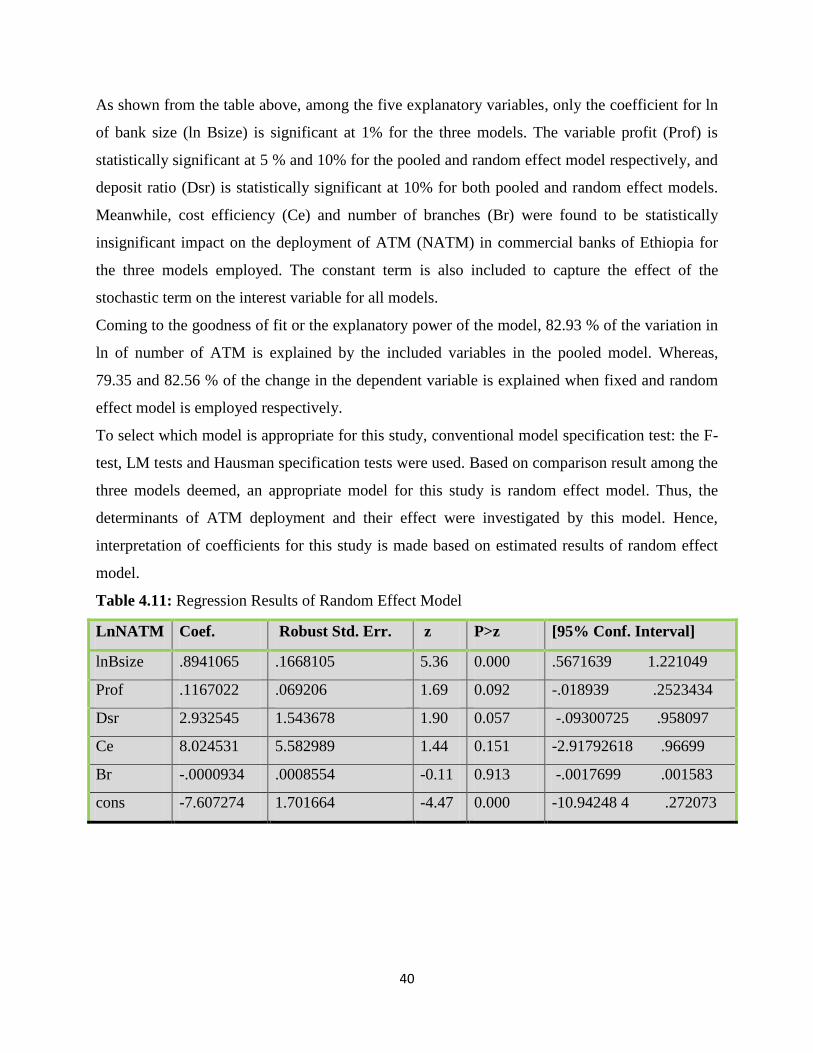
40
As shown from the table above, among the five explanatory variables, only the coefficient for ln
of bank size (ln Bsize) is significant at 1% for the three models. The variable profit (Prof) is
statistically significant at 5 % and 10% for the pooled and random effect model respectively, and
deposit ratio (Dsr) is statistically significant at 10% for both pooled and random effect models.
Meanwhile, cost efficiency (Ce) and number of branches (Br) were found to be statistically
insignificant impact on the deployment of ATM (NATM) in commercial banks of Ethiopia for
the three models employed. The constant term is also included to capture the effect of the
stochastic term on the interest variable for all models.
Coming to the goodness of fit or the explanatory power of the model, 82.93 % of the variation in
ln of number of ATM is explained by the included variables in the pooled model. Whereas,
79.35 and 82.56 % of the change in the dependent variable is explained when fixed and random
effect model is employed respectively.
To select which model is appropriate for this study, conventional model specification test: the F-
test, LM tests and Hausman specification tests were used. Based on comparison result among the
three models deemed, an appropriate model for this study is random effect model. Thus, the
determinants of ATM deployment and their effect were investigated by this model. Hence,
interpretation of coefficients for this study is made based on estimated results of random effect
model.
Table 4.11: Regression Results of Random Effect Model
LnNATM Coef. Robust Std. Err. z P>z [95% Conf. Interval]
lnBsize .8941065 .1668105 5.36 0.000 .5671639 1.221049
Prof .1167022 .069206 1.69 0.092 -.018939 .2523434
Dsr 2.932545 1.543678 1.90 0.057 -.09300725 .958097
Ce 8.024531 5.582989 1.44 0.151 -2.91792618 .96699
Br -.0000934 .0008554 -0.11 0.913 -.0017699 .001583
cons -7.607274 1.701664 -4.47 0.000 -10.94248 4 .272073
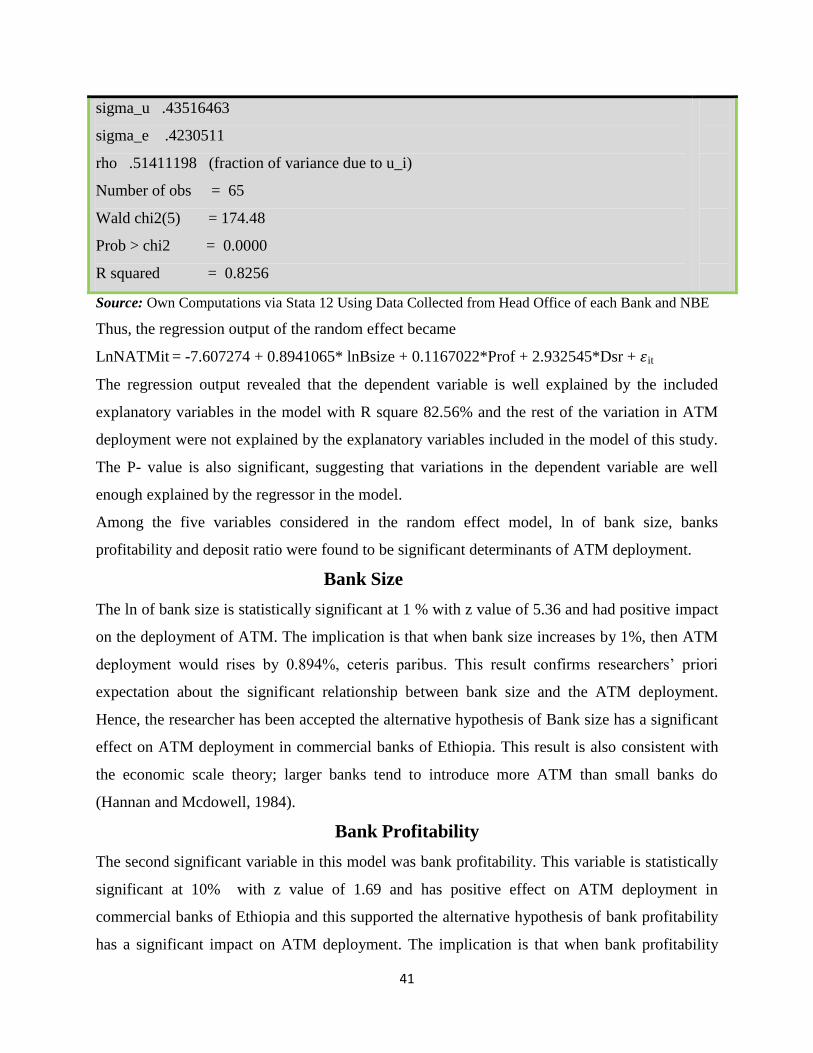
41
sigma_u .43516463
sigma_e .4230511
rho .51411198 (fraction of variance due to u_i)
Number of obs = 65
Wald chi2(5) = 174.48
Prob > chi2 = 0.0000
R squared = 0.8256
Source: Own Computations via Stata 12 Using Data Collected from Head Office of each Bank and NBE
Thus, the regression output of the random effect became
LnNATMit = -7.607274 + 0.8941065* lnBsize + 0.1167022*Prof + 2.932545*Dsr + 𝜀it
The regression output revealed that the dependent variable is well explained by the included
explanatory variables in the model with R square 82.56% and the rest of the variation in ATM
deployment were not explained by the explanatory variables included in the model of this study.
The P- value is also significant, suggesting that variations in the dependent variable are well
enough explained by the regressor in the model.
Among the five variables considered in the random effect model, ln of bank size, banks
profitability and deposit ratio were found to be significant determinants of ATM deployment.
Bank Size
The ln of bank size is statistically significant at 1 % with z value of 5.36 and had positive impact
on the deployment of ATM. The implication is that when bank size increases by 1%, then ATM
deployment would rises by 0.894%, ceteris paribus. This result confirms researchers‟ priori
expectation about the significant relationship between bank size and the ATM deployment.
Hence, the researcher has been accepted the alternative hypothesis of Bank size has a significant
effect on ATM deployment in commercial banks of Ethiopia. This result is also consistent with
the economic scale theory; larger banks tend to introduce more ATM than small banks do
(Hannan and Mcdowell, 1984).
Bank Profitability
The second significant variable in this model was bank profitability. This variable is statistically
significant at 10% with z value of 1.69 and has positive effect on ATM deployment in
commercial banks of Ethiopia and this supported the alternative hypothesis of bank profitability
has a significant impact on ATM deployment. The implication is that when bank profitability
42
increases by one birr per year, ATM deployment rises by 0.116%. Suggesting profitable bank
would invest more in asset acquisition including ICT investment. Past studies found inconclusive
relationship between IT investments and the profitability of banks but recent studies including
this study found significant relationship between bank profitability and ATM deployment (
Milne, 2006).
Deposit Ratio
The results of this study also revealed that the ratio of total deposit to total asset is statistically
significant at 10% with z value of 1.90 and positively related to ATM deployment. The
implication is that when banks deposit ratio increase by one birr per year, ATM deployment
raises by 2.93% indicating that the greater the ratio of deposit, the better the deployment of ATM
in commercial banks of Ethiopia. This suggested that banks with higher customer demand for
deposit service tend to invest more on ATM because banks investment on modern technology
particularly ATM can increase customer satisfaction and thereby to attract deposits (Yen, 2011).
This result is also consistent with researcher expectation of significant effect on ATM
deployment.
Generally, among the three significant variables bank size has most important determinants of
ATM deployment in commercial banks of Ethiopia. Because, it is significant at 1%.
From the result of random effect regression model, taking variability in ATM deployment as the
dependent variable, it is observed that the p-value of cost efficiency and number of branches
were statistically insignificant. This indicated that ATM deployment varies across individual
bank depending on their ln of bank size, bank profitability and deposit ratio. Whereas, the
variation in ATM deployment do not basically different across banks based on their cost
efficiency and number of branches. Thus, the variables cost efficiency and numbers of branches
have no effect on ATM deployment. This result is not supported the alternative hypothesis of
both have significant effect on ATM deployment in commercial banks of Ethiopia, hence failed
to reject the null hypothesis of no significant effect on ATM deployment. This result is
inconsistent with the finding investigated by (Ou et al., 2009), found both cost efficiency and
number of branches have significant impact on ATM deployment.
43
Chapter Five
5. Conclusion and Recommendation
This chapter comprises of conclusions made based on the findings and the way forwarded to
concerned bodies. Accordingly, the first section is devoted for the conclusion part of the study.
Meanwhile, the second section presents the policy implication or recommendation of the result
of this paper.
5.1. Conclusion
The growing trend of information technology investment especially ATM in Ethiopia banking
industry is below customers demand (Ayana, 2012). The availability and deployment of ATM in
Ethiopia is low level compared to the fast growing urban population.
Thus, the main objective of this study is to examine the determinants of ATM deployment in
commercial banks of Ethiopia based on a balanced panel data analysis for the time period
beginning from 2012 to 2016 G.C. This study has passed various model specification tests and
random effect model is selected among fixed effect and pooled OLS regression analysis. The
collected data is analyzed using random effect model and interpretations of estimates were made
based on this model. Descriptive statistics and econometric method is employed as methods of
analysis. The result of the descriptive analysis indicated a slight increase in ATM deployment in
commercial banks of Ethiopia over the time period of the study.
The results of empirical evidence from the econometric regression analysis of random effect
model revealed that independent variables: bank size, bank profitability and deposit ratio were
statistically significant to explain the number of automated teller machine in commercial banks
of Ethiopian. The directions of influence for the aforementioned significant variables were
positive with researcher priori intuition. Specifically, the finding indicated that bank size
measured by total asset has positive and statistically significant impact on ATM deployment.
This result is consistent with the economic scale theory. The implication is that larger banks tend
to introduce more ATM than small banks do (Hannan, 1984).
Similarly, the study also found out that bank profitability measured by ROA has positive and
statistically significant impact on deployment of ATM in commercial banks of Ethiopia. The
implication is that banks with higher ROA have better ATM deployment. This result is
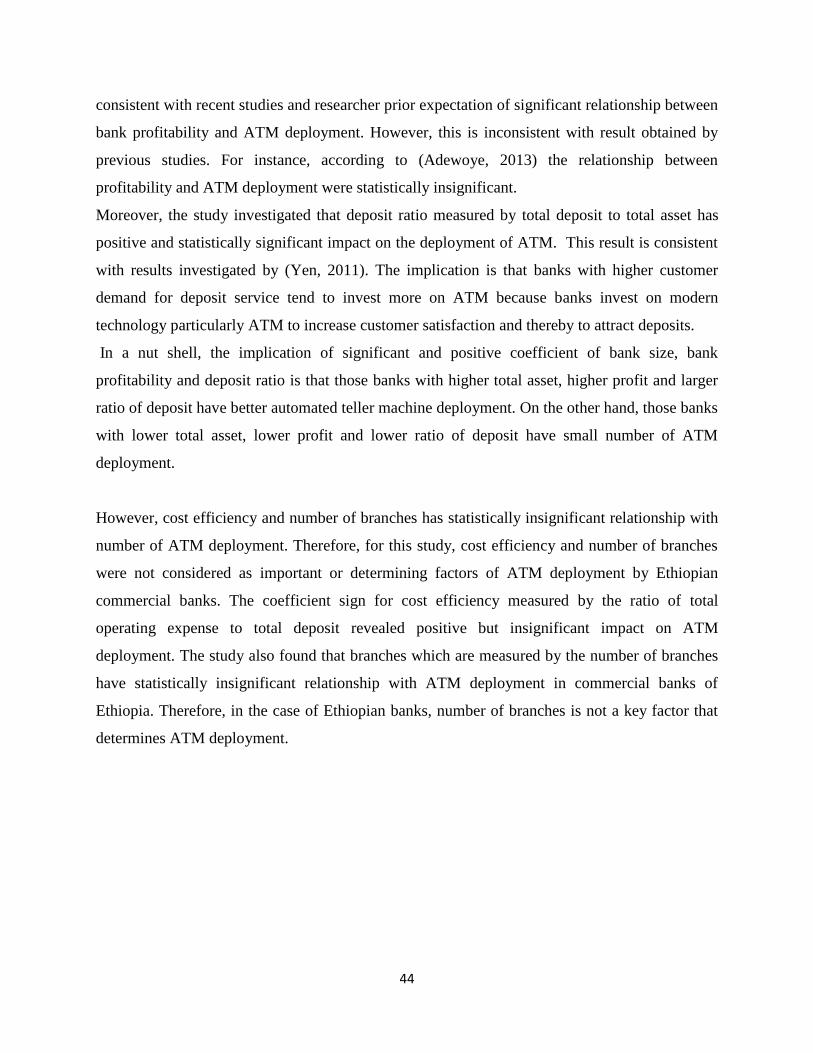
44
consistent with recent studies and researcher prior expectation of significant relationship between
bank profitability and ATM deployment. However, this is inconsistent with result obtained by
previous studies. For instance, according to (Adewoye, 2013) the relationship between
profitability and ATM deployment were statistically insignificant.
Moreover, the study investigated that deposit ratio measured by total deposit to total asset has
positive and statistically significant impact on the deployment of ATM. This result is consistent
with results investigated by (Yen, 2011). The implication is that banks with higher customer
demand for deposit service tend to invest more on ATM because banks invest on modern
technology particularly ATM to increase customer satisfaction and thereby to attract deposits.
In a nut shell, the implication of significant and positive coefficient of bank size, bank
profitability and deposit ratio is that those banks with higher total asset, higher profit and larger
ratio of deposit have better automated teller machine deployment. On the other hand, those banks
with lower total asset, lower profit and lower ratio of deposit have small number of ATM
deployment.
However, cost efficiency and number of branches has statistically insignificant relationship with
number of ATM deployment. Therefore, for this study, cost efficiency and number of branches
were not considered as important or determining factors of ATM deployment by Ethiopian
commercial banks. The coefficient sign for cost efficiency measured by the ratio of total
operating expense to total deposit revealed positive but insignificant impact on ATM
deployment. The study also found that branches which are measured by the number of branches
have statistically insignificant relationship with ATM deployment in commercial banks of
Ethiopia. Therefore, in the case of Ethiopian banks, number of branches is not a key factor that
determines ATM deployment.
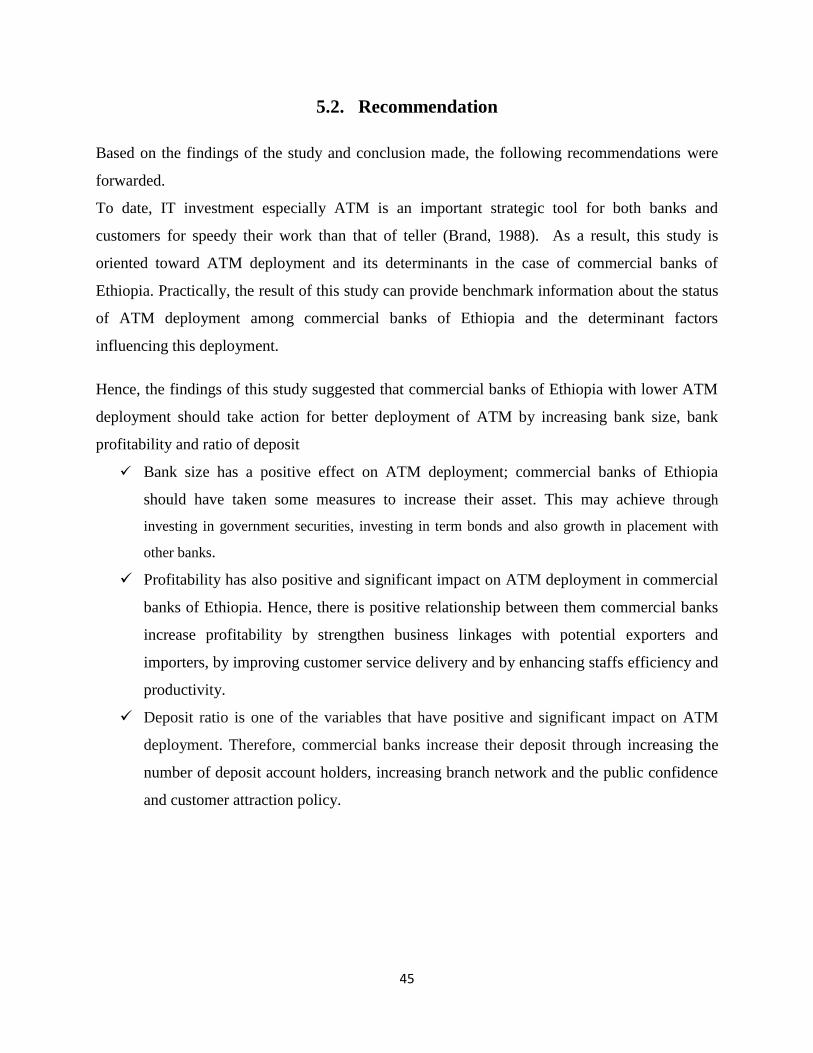
45
5.2. Recommendation
Based on the findings of the study and conclusion made, the following recommendations were
forwarded.
To date, IT investment especially ATM is an important strategic tool for both banks and
customers for speedy their work than that of teller (Brand, 1988). As a result, this study is
oriented toward ATM deployment and its determinants in the case of commercial banks of
Ethiopia. Practically, the result of this study can provide benchmark information about the status
of ATM deployment among commercial banks of Ethiopia and the determinant factors
influencing this deployment.
Hence, the findings of this study suggested that commercial banks of Ethiopia with lower ATM
deployment should take action for better deployment of ATM by increasing bank size, bank
profitability and ratio of deposit
Bank size has a positive effect on ATM deployment; commercial banks of Ethiopia
should have taken some measures to increase their asset. This may achieve through
investing in government securities, investing in term bonds and also growth in placement with
other banks.
Profitability has also positive and significant impact on ATM deployment in commercial
banks of Ethiopia. Hence, there is positive relationship between them commercial banks
increase profitability by strengthen business linkages with potential exporters and
importers, by improving customer service delivery and by enhancing staffs efficiency and
productivity.
Deposit ratio is one of the variables that have positive and significant impact on ATM
deployment. Therefore, commercial banks increase their deposit through increasing the
number of deposit account holders, increasing branch network and the public confidence
and customer attraction policy.

46
References
Abiy. (2012, Feburary 14). Capital weekly news paper. Retrieved Feburary 14, 2015, from
Http//:WW.capital.com.
Abrehe, F. (2015). ATM adoption of customer in commercial bank of Ethiopia . Journal of
business management and social sciences .
Addis. (2015). Evaluation of customers' satisfaction regarding primary swicth solution
Automated teller machines banking services in Addis Ababa. Journal of technology .
Adewoye. (2013). Determinants of Automated teller machine deployment in Nigerian banks .
Journal of computer technology and application .
Adewoye. (2007). Impact of IT investment on banking operations in Nigeria. Journal of
international business management , 70 - 78.
Adriaine. (2000). The determinants of technology difussion: Specfically Automated teller
machine ournal of information technology .
Aijaz. (2012). Automated teller machines fraud ,the case of commercial banks in Pakistan.
Journal of business and management .
Alabar. (2012). Electronic banking service and customer satisfaction in the Nigerian banking
industry . International journal of business and management .
Alagheband. (2006). Adoption of electronic banking service by Iranian customers .
Alemayhu. (2009). Introduction to research methods. Addis abeba: Addis abeba University.
Amanayehu. (2008, Feburary 15). Addis fortune news . Retrieved 2015, from
Http//:WWW.Addis fortune .com.
Amefrele. (2012 , March 13). Brand world,http ://business worldng.com/web/article. Retrieved
from Will cashless Nigeria boost brand loyalty.
Asrat. (2010, July 22). Reporter weekly news paper . Retrieved Feburary 14, 2015, from
Http//:www.reporter.com.
47
Ayana. (2012). Adoption of electronic banking system in Ethiopian banking industry :Barriers
and Drivers. Journal of information tecnology .
Babbie. (1995). The practice of Social Research. London : London Wadsworth.
Balcha. (2015). Aggersive branch expansion versus Automated teller machine and poit of sale
machine use , the case of Awash internatinal bank in Addis abeba. Journal of Information
technolgy .
Baltagi. (2008). Econometrics analysiisis published in united state .
Bhattacherjee, A. (2012). Social science research principle ,method and practices . South Florida
: Global text project .
Binyam. (2009, January 23). Daily monitor. Retrieved Feburary 14, 2015, from
Http//:WWW.dailymonitor .com.
Bougie. ( 2010). Research Methods for Business ,Fifth Edition.
Brain. (2000). The measuement of white collarcrime using uniform crime reporting. Fderal
bureau of investigation .
Brand, B. a. (1988). The law of electronic fund transfer system. In W. Gorahm.
Brook. (2014 ). Introductory Econometrics for Finance 3rd edition . Cambridge: Cambridge
University Press.
Chia. (2012). Empherical study of the relationship between self servie technology investment
and firm financial performance . Journal of information technology .
Churchill. (2005). Marketing Research : Methodological foundations,9th edition . Thomson
South Western : Thomson South Western USA.
Creswell. (2009). Research design : Qualitative and quantitative approches ,3 rd edition . London
: London UK.
Daniel. (1999). Provision of electronic banking in UK and republic of Ireland . International
journal of bank marketing , 72-82.
48
Dashen bank, (2011). annual report retrived from http://www.dashenbank.com.
David. (2008). Can Automatic Teller Machine investment improve bank cost effeciency ?
Journal of information management .
Demilew, A. (2008 ). Capital weakly news paper .
Dennis. (2014). Automated teller machine versus bank teller relation ship.
Fawcett. (2001). Defining Automated teller machine. Newyork world bank publication .
Fenuga. (2010). The effect of electronic payment on customers service delivery . International
journal of economic development research .
Foley, J. A. (2000). Changes in the banking sector ,the case of internet banking in the UK.
Journal of electronic networking applications and policy , 19-30.
Fyery. (2015). ATM adoption of customers in commercial banks of Ethiopia , Mekelle. Journal
of business management and social sciences.
Gardachew et al. (2010). Electronic banking in Ethiopia :Practices,opportunites and challanges .
Journal of internet banking and commerce .
Gardachewetal. (2015, may 20). Electrobanking in Ethiopia ,practice ,opportunities and
challanges . Journal of internet banking and commerce .
Gemechu. (2012). Adoption of electro banking system in Ethiopia banking industry barriers and
drivers . journa of information system .
Green. (2012). Econometric analysis . New York : published by New York University.
Gujarati. (2004). Basic econometrics. fourth edition published in London .
Hannan, T. A. (1984). Determinant of tecnology adoption the case of banking firm Rand. Journal
of economics , 328-335.
Http://kalyan-city.blogspot.com. (2011). Retrieved from Automated teller machine advantage
html .
49
Huang, C. s. (2012). Determinant of information tecnology investment . Journal of enegneering
and tecnology managmment .
Humphery. (1993). Delivering deposit service Automated teller machine versus branch .
Humphery. (2004). Electronic payment and ATMs,changing technolgy and cost .
Hung, C. Y. (2009). Determinant of information tecnology investment . Advances in
international accounting .
Hunter. (2001). Deregulation and effeciency : The case of private Korean banks . Journal of
Economics and Business. , 237-254.
Hussein. (2017). Effect of Automated teller machines usage on operational performance of
commercial banks in Nakuru country ,Kenya . International journal of Economics ,Finance and
Management sciences. , 162-167.
James. (2007 ). Introduction to econometrics in Boston : published by Pearson Addison wesley .
Jonathan. (2013). Emphirical evaluation of the effect of ATM on cost efficency of banks in
nigeria. Journal of internet banking and commerce .
Kaesther, S. A. (2008 ). Consumer financial literacy and the impact of online banking on the
financial behaviour of lower income bank customers . Journal of consumer affairs .
Kamrul. (2009 ). E-banking in Bangladeshi : The future of banking schools of business studies .
Kothari. (2004). Research Methodology : Methods and Techniques. New age international (P)
Ltd.: New age international (P) Ltd, publisher.
Kwan. (2003). Operating performance of banks among Asian economies : An international and
time series comparision . Journal of Banking and Financial. , 471- 489.
Laderman. (1990). The Public Imlication of State Law Pertaning to Automated Teller Machine.
Liu, C. (2009). Deteminant of information tecnology investment . Journal of internet banking
and commerce , 278-283.
50
Magemhe. (2002). Challanges and opportunites for adopting electronic commerce in developing
countries . Iaabd . Botswanna: Port Elizabeth.
Mckerchar. (2008). Philosophical paradigms , inquiry strategies andknowledge claims :
Applying the principles of research design and conduct to taxation. E- Journal of Tax research , 5
- 22.
Miller. (2006 ). Who invented the ATM machine. Automated teller history .
Milne. (2006). What is in it for us ? network effects and bank payment innovation. Journal of
banking and finance. , 1613 - 1630.
Myllynen. (2009). Modern banking solution changing businessand people . 22-25.
NBE (2015/2016). National Bank of Ethiopia Report.
NBE (2015). Electronic banking users of commercial banks.
Noreen, A. A. (2006). An exporatory research on adoption of E-banking among customers and
commercial banks in Pakistain . 1-31.
Odewale. (2008). Decision Frame work for Automated teller machine. Application to the
Nigerian sector
Olatokun. (2009). Adoption of Automated teller machine in Nigeria. Information science and
information technology .
Otukoya, S. (2014). The role of information tecnology on commercial bank in Nigeria . Banker
enterprenurial training .
Ou. (2009). Determinants of information technology investments :The case of ATM in
anemerging economy. Advance in international Journal of accounting,278-283.
Oyerinde, J. (2013). Impact of automated teller machine on costefficency of Nigeria. Journal of
internet banking and commerce .
Peffers. (1995). Rewards to investors in innovative information technology applications: First
movers and early followers in ATM. Journal of organization science. , 241-259.
51
Sambamurthy. (2010). Tecnology in banking sector of Nigeria.
Saunders. (2007). Research methods in social scince.
Saythe. (2000). The impact of internet banking on performance and risk profits, evidence from
Australian credit union. Journal of information technology. , 163 - 174.
Shepard, S. a. (1995). Adoption of tecnology with network effect. Journal of economics , 479-
501.
Shittu. (2010). The impacts of electronic banking in Nigeria banking system .
Siam. (2006 ). Role of electronic banking service on the profit of Jordan banks. Journal of
applied science , 1999 - 2004 .
Solomon, A. (2010). Challanges of automated teller machine usage and fraud in Nigeria . Journal
of internet banking and commerce .
Steve. (2002). Automated teller machiens CGAP staff and exchange. CGAP IT innovations
series Los Angles .
Stump. (2004). Information tecnology investment in purchasing an empirical investigation of
communiation , relation ship and performance out come. 41-55.
Sultan. (2009). Impact of Automated teller machine on customers satisfaction ,the case of three
major Indianbanks. . Journal of business intelligence .
Takele. (2013 ). Analysis of factors influencing customers intention to the adoption of E banking
. European scientific journal .
Tiwari (2007 ). The mobile commerce prospects :Astratagic analysis of opportunites in the
banking sector ,Hamburg university press.
WaleAbdual. (2011). Market based study of optimal ATM deployment . International journal of
machine learning and computing .
Wikimania (2015, March 29). History of banking retrieved from Avilable on line from
:<http://en.Wikipeda.org/wiki/banking agent>.
52
William, G. (2008). Econometrics analysis . Prentice Hall.
Wooldridge. (2002). Econoerics analysis of cross section and panel data. London, England.
Yap, T. a. (1995). CEO,organizationa characterstics and information tecnology adoption . 429-
442.
Yen. (2011). Emphirical study of relation between self service technology investment and firm
financial performance . Journal of technology management .
Yiheyis, A. (2015, Feburary). Evaluation of customer satisfaction regarding PSSAutomated teller
machine banking service.
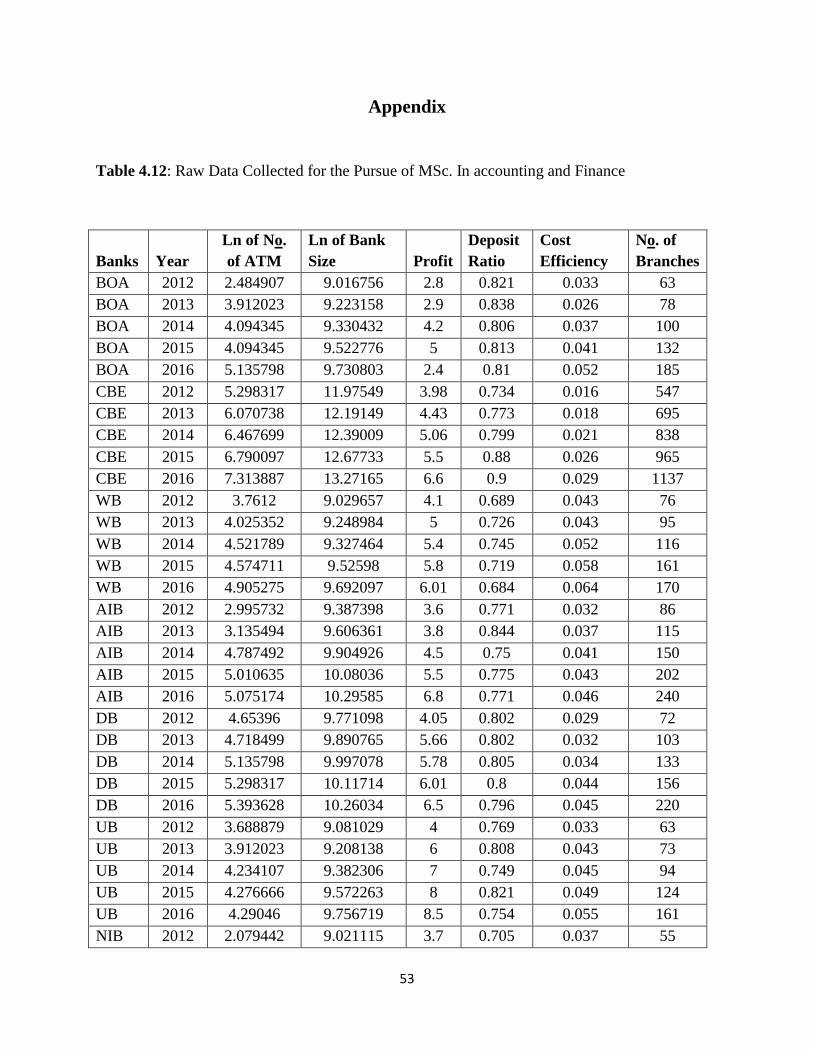
53
Appendix
Table 4.12: Raw Data Collected for the Pursue of MSc. In accounting and Finance
Banks Year
Ln of No.
of ATM
Ln of Bank
Size Profit
Deposit
Ratio
Cost
Efficiency
No. of
Branches
BOA 2012 2.484907 9.016756 2.8 0.821 0.033 63
BOA 2013 3.912023 9.223158 2.9 0.838 0.026 78
BOA 2014 4.094345 9.330432 4.2 0.806 0.037 100
BOA 2015 4.094345 9.522776 5 0.813 0.041 132
BOA 2016 5.135798 9.730803 2.4 0.81 0.052 185
CBE 2012 5.298317 11.97549 3.98 0.734 0.016 547
CBE 2013 6.070738 12.19149 4.43 0.773 0.018 695
CBE 2014 6.467699 12.39009 5.06 0.799 0.021 838
CBE 2015 6.790097 12.67733 5.5 0.88 0.026 965
CBE 2016 7.313887 13.27165 6.6 0.9 0.029 1137
WB 2012 3.7612 9.029657 4.1 0.689 0.043 76
WB 2013 4.025352 9.248984 5 0.726 0.043 95
WB 2014 4.521789 9.327464 5.4 0.745 0.052 116
WB 2015 4.574711 9.52598 5.8 0.719 0.058 161
WB 2016 4.905275 9.692097 6.01 0.684 0.064 170
AIB 2012 2.995732 9.387398 3.6 0.771 0.032 86
AIB 2013 3.135494 9.606361 3.8 0.844 0.037 115
AIB 2014 4.787492 9.904926 4.5 0.75 0.041 150
AIB 2015 5.010635 10.08036 5.5 0.775 0.043 202
AIB 2016 5.075174 10.29585 6.8 0.771 0.046 240
DB 2012 4.65396 9.771098 4.05 0.802 0.029 72
DB 2013 4.718499 9.890765 5.66 0.802 0.032 103
DB 2014 5.135798 9.997078 5.78 0.805 0.034 133
DB 2015 5.298317 10.11714 6.01 0.8 0.044 156
DB 2016 5.393628 10.26034 6.5 0.796 0.045 220
UB 2012 3.688879 9.081029 4 0.769 0.033 63
UB 2013 3.912023 9.208138 6 0.808 0.043 73
UB 2014 4.234107 9.382306 7 0.749 0.045 94
UB 2015 4.276666 9.572263 8 0.821 0.049 124
UB 2016 4.29046 9.756719 8.5 0.754 0.055 161
NIB 2012 2.079442 9.021115 3.7 0.705 0.037 55
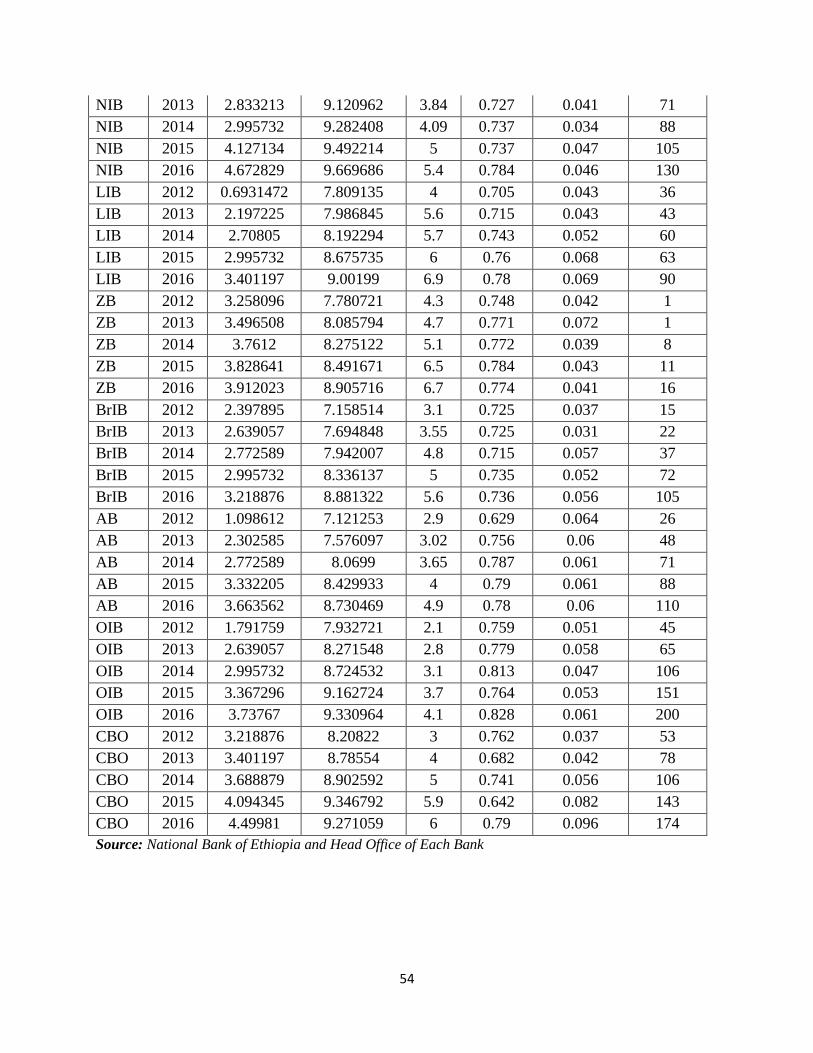
54
NIB 2013 2.833213 9.120962 3.84 0.727 0.041 71
NIB 2014 2.995732 9.282408 4.09 0.737 0.034 88
NIB 2015 4.127134 9.492214 5 0.737 0.047 105
NIB 2016 4.672829 9.669686 5.4 0.784 0.046 130
LIB 2012 0.6931472 7.809135 4 0.705 0.043 36
LIB 2013 2.197225 7.986845 5.6 0.715 0.043 43
LIB 2014 2.70805 8.192294 5.7 0.743 0.052 60
LIB 2015 2.995732 8.675735 6 0.76 0.068 63
LIB 2016 3.401197 9.00199 6.9 0.78 0.069 90
ZB 2012 3.258096 7.780721 4.3 0.748 0.042 1
ZB 2013 3.496508 8.085794 4.7 0.771 0.072 1
ZB 2014 3.7612 8.275122 5.1 0.772 0.039 8
ZB 2015 3.828641 8.491671 6.5 0.784 0.043 11
ZB 2016 3.912023 8.905716 6.7 0.774 0.041 16
BrIB 2012 2.397895 7.158514 3.1 0.725 0.037 15
BrIB 2013 2.639057 7.694848 3.55 0.725 0.031 22
BrIB 2014 2.772589 7.942007 4.8 0.715 0.057 37
BrIB 2015 2.995732 8.336137 5 0.735 0.052 72
BrIB 2016 3.218876 8.881322 5.6 0.736 0.056 105
AB 2012 1.098612 7.121253 2.9 0.629 0.064 26
AB 2013 2.302585 7.576097 3.02 0.756 0.06 48
AB 2014 2.772589 8.0699 3.65 0.787 0.061 71
AB 2015 3.332205 8.429933 4 0.79 0.061 88
AB 2016 3.663562 8.730469 4.9 0.78 0.06 110
OIB 2012 1.791759 7.932721 2.1 0.759 0.051 45
OIB 2013 2.639057 8.271548 2.8 0.779 0.058 65
OIB 2014 2.995732 8.724532 3.1 0.813 0.047 106
OIB 2015 3.367296 9.162724 3.7 0.764 0.053 151
OIB 2016 3.73767 9.330964 4.1 0.828 0.061 200
CBO 2012 3.218876 8.20822 3 0.762 0.037 53
CBO 2013 3.401197 8.78554 4 0.682 0.042 78
CBO 2014 3.688879 8.902592 5 0.741 0.056 106
CBO 2015 4.094345 9.346792 5.9 0.642 0.082 143
CBO 2016 4.49981 9.271059 6 0.79 0.096 174
Source: National Bank of Ethiopia and Head Office of Each Bank