seismic performance of high-rise rc wall-type buildings in...
TRANSCRIPT
Seismic Performance of
High-rise RC Wall-type
Buildings in Korea
December 12th, 2014
Han Seon Lee
Professor, Korea University, Seoul, Korea
Structural Concrete Engineering Lab.
2
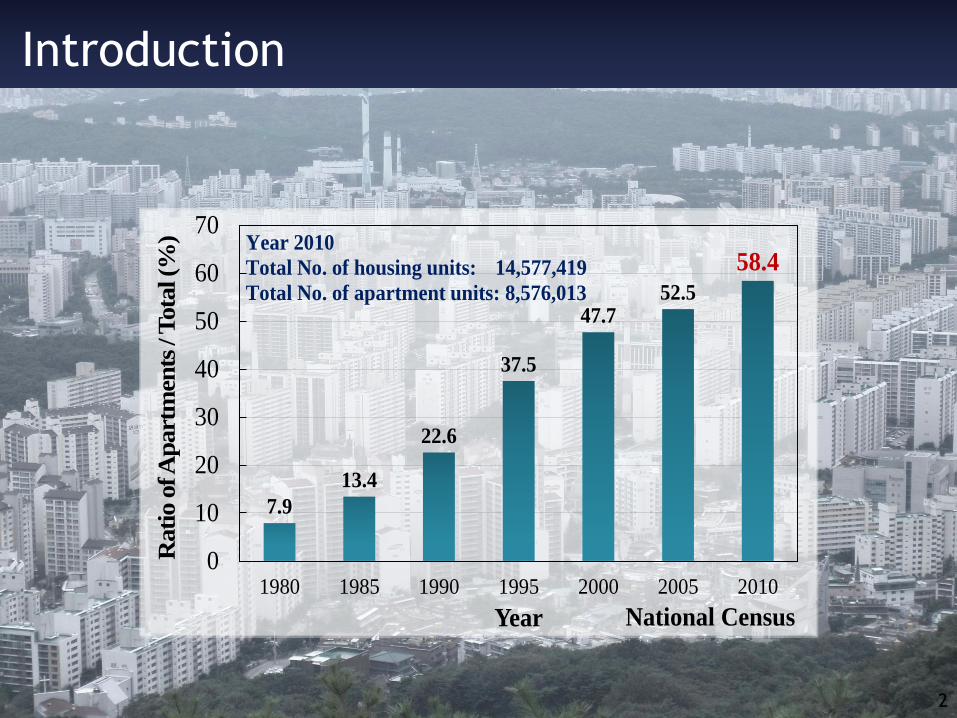
Introduction
7.9
13.4
22.6
37.5
47.752.5
58.4
0
10
20
30
40
50
60
70
1980 1985 1990 1995 2000 2005 2010
Rati
o o
f A
part
men
ts / T
ota
l (%
)
Year
Year 2010
Total No. of housing units: 14,577,419
Total No. of apartment units: 8,576,013
National Census
3
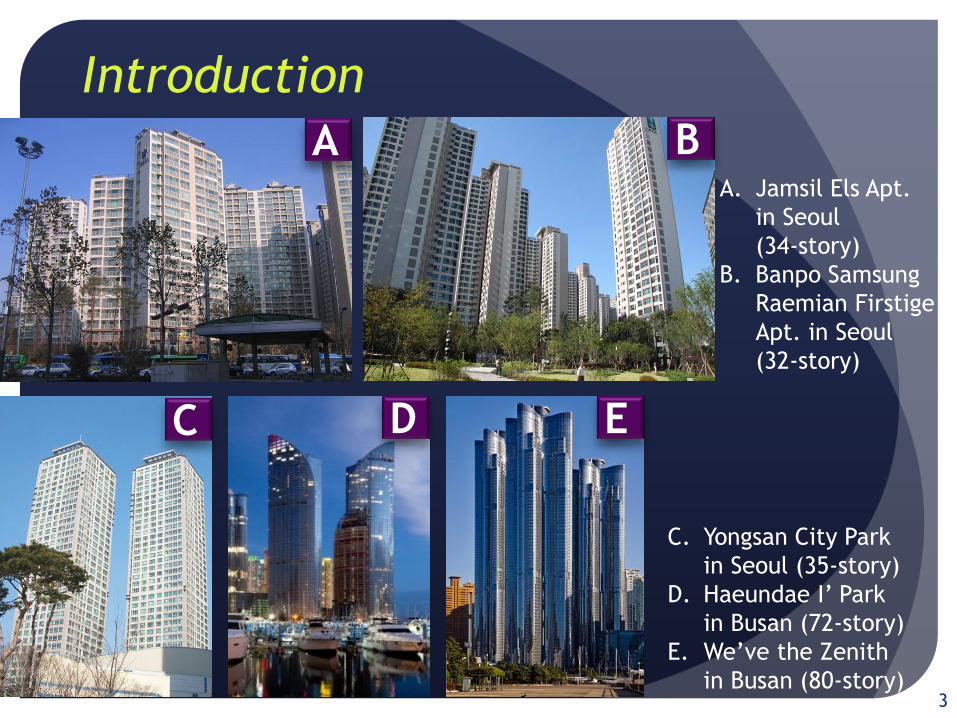
Introduction
A. Jamsil Els Apt.
in Seoul
(34-story)
B. Banpo Samsung
Raemian Firstige
Apt. in Seoul
(32-story)
C. Yongsan City Park
in Seoul (35-story)
D. Haeundae I’ Park
in Busan (72-story)
E. We’ve the Zenith
in Busan (80-story)
A B
C D E
4
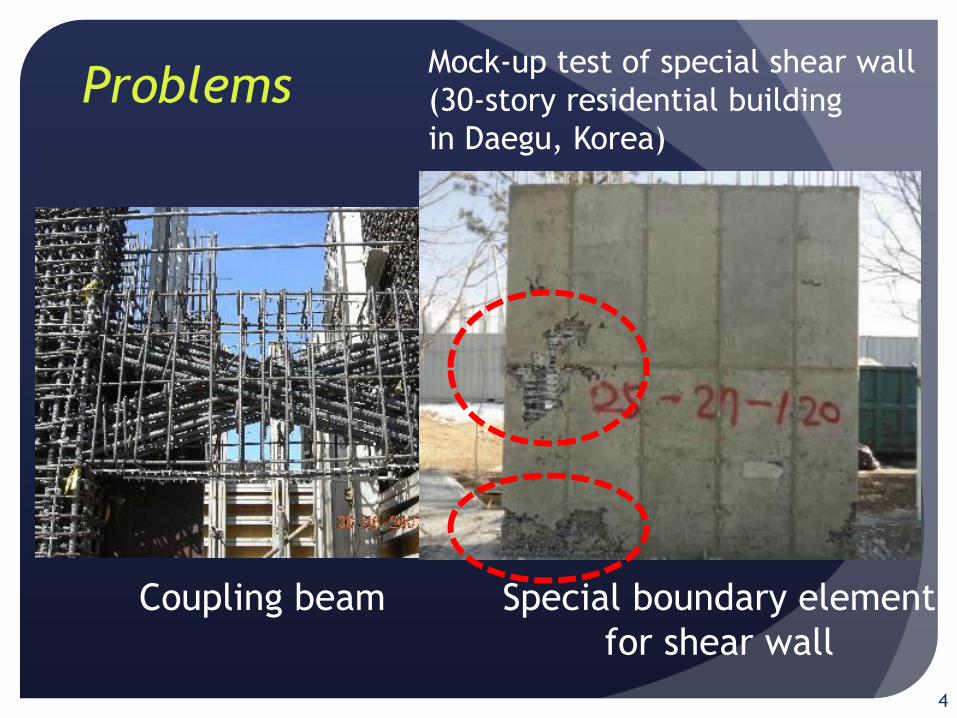
Problems
Coupling beam Special boundary element
for shear wall
Mock-up test of special shear wall
(30-story residential building
in Daegu, Korea)
5
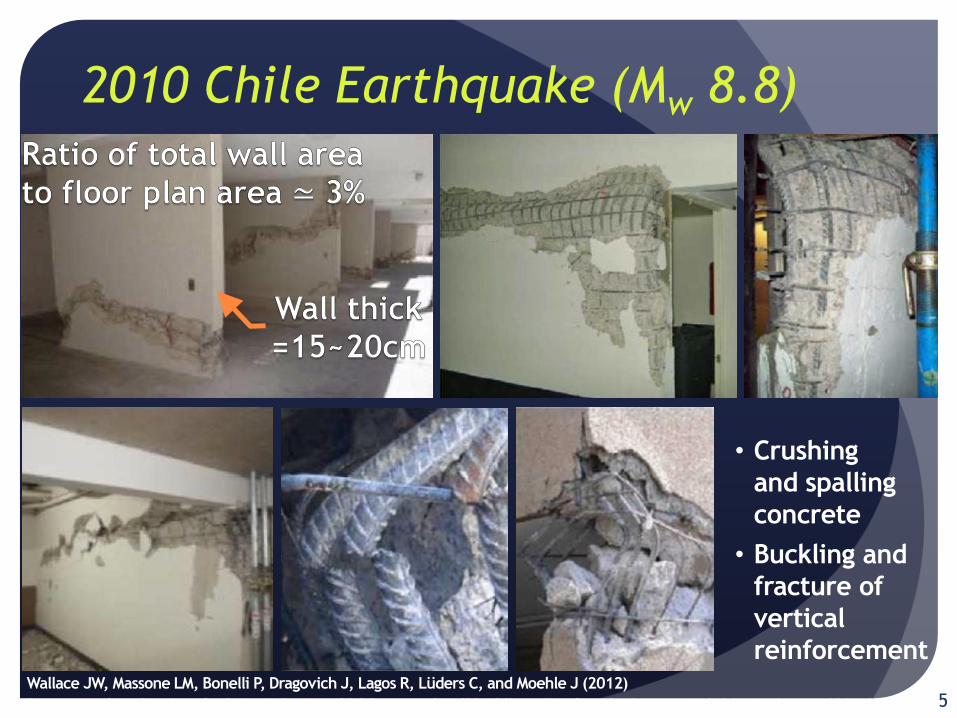
2010 Chile Earthquake (Mw 8.8)
S2 Compression
6
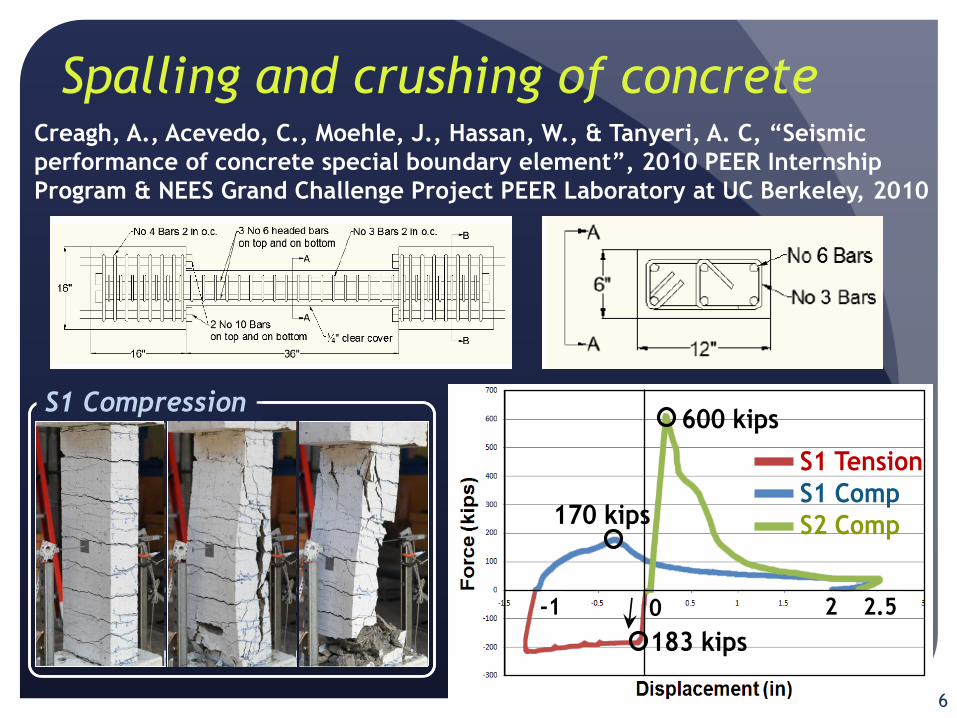
Spalling and crushing of concrete Creagh, A., Acevedo, C., Moehle, J., Hassan, W., & Tanyeri, A. C, “Seismic
performance of concrete special boundary element”, 2010 PEER Internship
Program & NEES Grand Challenge Project PEER Laboratory at UC Berkeley, 2010
0
600 kips
170 kips
183 kips
S1 Tension
S1 Comp
S2 Comp
2.52-1
S1 Compression

7
Spalling and crushing of concrete Yuniarsyah, E., Taleb, R., Kono, S., & Tani, M., “An experimental study on
confined RC wall boundary regions under uniaxial monotonic and cyclic reversal
loadings”, SEEBUS, 2014
Long: 10-D10
(ρg = 3.38%)
Trans: 3-D4@80
(ρw = 0.21%)
0.03m/m
9.33MPa
0.004m/m
33.3MPa
8
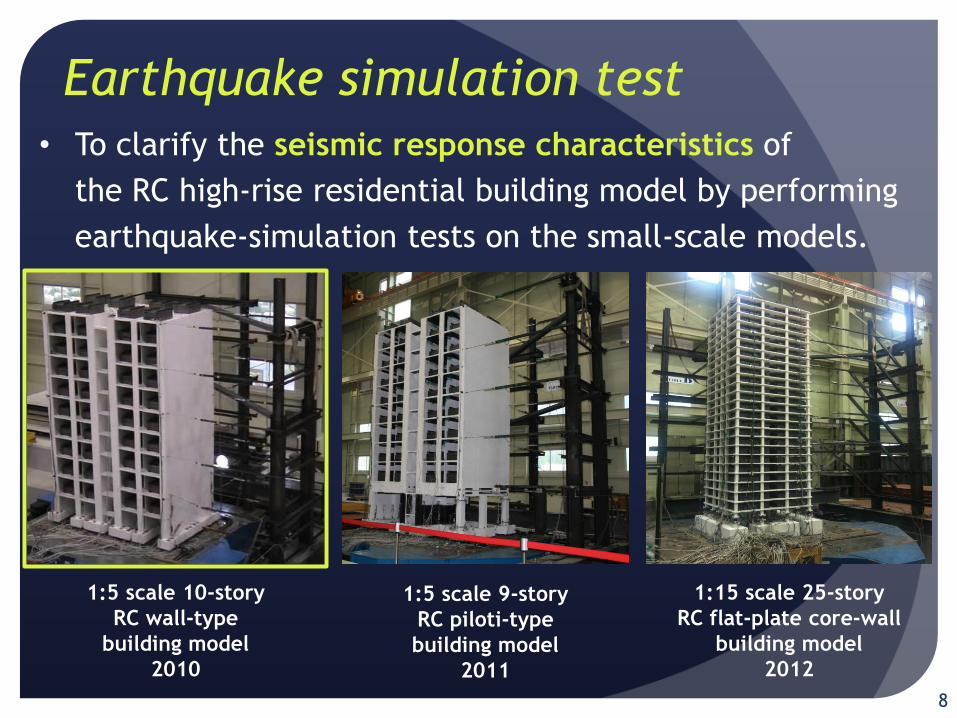
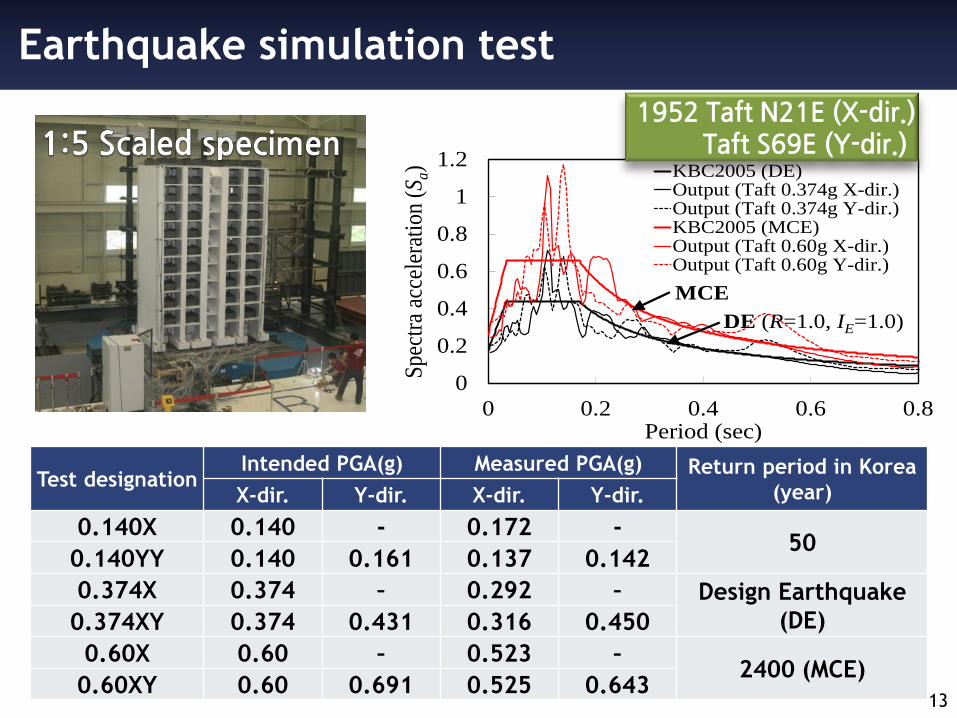
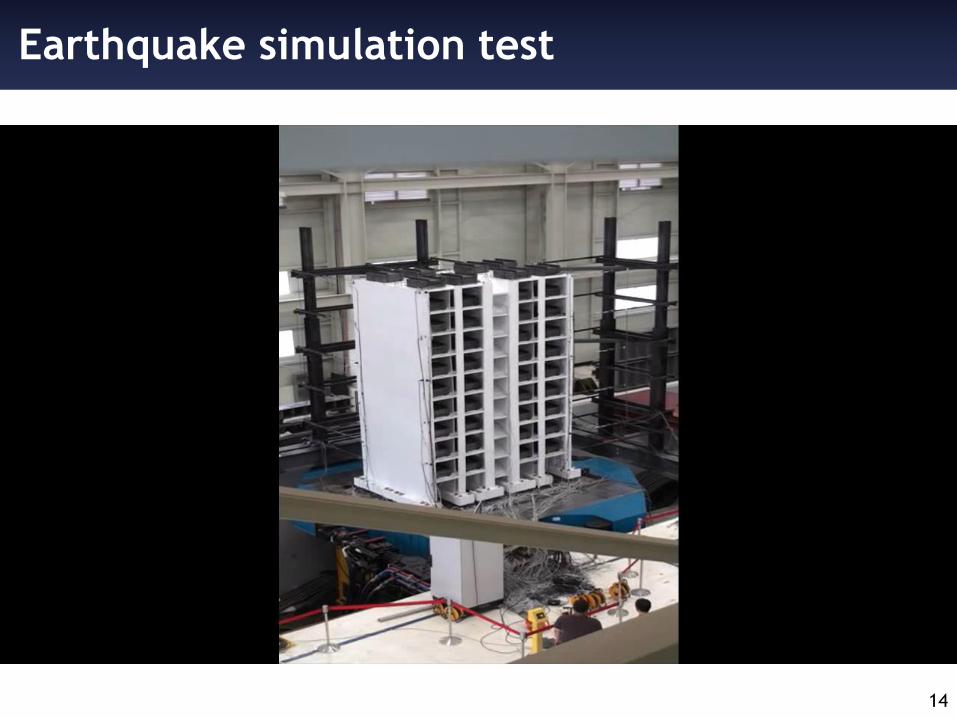
Earthquake simulation test
1:5 scale 10-story
RC wall-type
building model
2010
1:5 scale 9-story
RC piloti-type
building model
2011
1:15 scale 25-story
RC flat-plate core-wall
building model
2012
• To clarify the seismic response characteristics of
the RC high-rise residential building model by performing
earthquake-simulation tests on the small-scale models.
9
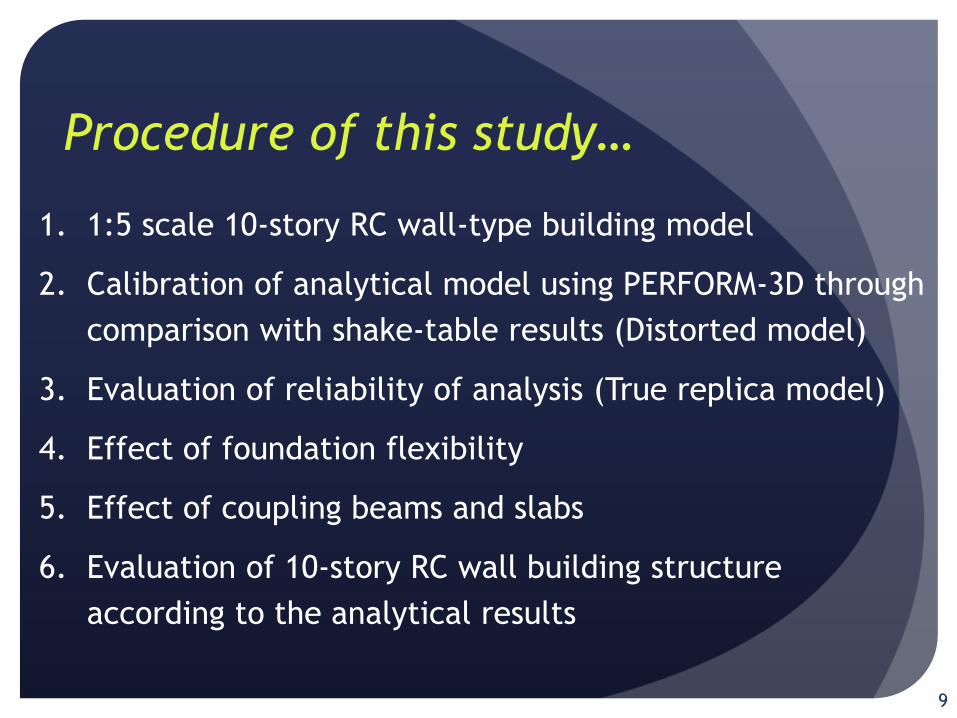
Procedure of this study…
1. 1:5 scale 10-story RC wall-type building model
2. Calibration of analytical model using PERFORM-3D through
comparison with shake-table results (Distorted model)
3. Evaluation of reliability of analysis (True replica model)
4. Effect of foundation flexibility
5. Effect of coupling beams and slabs
6. Evaluation of 10-story RC wall building structure
according to the analytical results

Prototype structures
10
Elevation Plan
• Design code: AIK2000
• Height: 27m(10-story)
• Weight: 21,270 kN
• Wall thick: 180/160mm
• Slab thick: 200mm
• Aw/Af (X-dir.) = 2.7%
• Aw/Af (Y-dir.) = 4.7%
• f’c = 24 MPa
• fy = 400 MPa
Ta = Ct (hn)3/4 = 0.865sec (X-dir.) and 0.580sec (Y-dir.)
V = Cs W = 1,530kN (X-dir.) and 2,300kN (Y-dir.)
117.0=/
dir.)-(Y .1080 and dir.)-(X 072.0=)/(
=1
E
DS
aE
D
S IR
S
TIR
SC ≤
W: weight, SD1, SDS: spectral accelerations at period 1sec and 0.2sec, respectively (0.234, 0.439),
R: response modification factor (4.5), IE: importance factor (1.2),
Ct = 0.073 (X-dir.): RC moment resisting frame (MRF), Ct = 0.049 (Y-dir.): other structures,
hn: height of structure (27m).
Base shear,
Base shear coefficient,
Fundamental period,

1:5 scale experimental model
11
Items
(unit: kN)
Total
Weight
Self
Weight
Added
Weight
Prototype 21,300 18,200 3,110
True
Replica
Model
(1:5)
851 145 705
Distorted
Model
(1:5) 425 145 280
PGA = 0.156g 54.4 sec-0.4
-0.2
0
0.2
0.4
0 10 20 30 40 50 60
Acc
el. (g
)
Time (sec)
Original Taft N21E (X-dir.)
PGA = 0.156g24.3 sec
-0.4
-0.2
0
0.2
0.4
0 10 20 30 40 50 60
Acc
el. (g
)
Time (sec)
True Replica Model (1:5 scale)
PGA = 0.311g17.2 sec
-0.4
-0.2
0
0.2
0.4
0 10 20 30 40 50 60
Acc
el. (g
)
Time (sec)
Distorted Model (1:5 scale)
Time × 1/√5
Accel. × 1
Time×1/√10
Accel.×2
1/2
* Maximum pay-load capacity of the shaking table = 600kN

Experimental setup
12
Shaking Table
Steel blocks
Reference Frame
LVDTs
Accelerometer
A2A1
A4A3
A6A5
A8A7
A10A9
A12A11
D15,D16,D29
D17,D18
D19,D20
D21,D22,D27
D23,D24
D25,D26
D28
D30
Independent Post
Shaking Table
Reference Frame
Independent Post
D1, D2
D3, D4
D5, D6
D7, D8
D9, D10
D11, D12
D14
D13
A13 A14
A15 A16
A17 A18
A19 A20
A21 A22
A23 A24
LVDTsSteel blocks
View A View B
Loadcell
Displacement transducers and accelerometers Footings and load cells at base
70mm x 70mm Plate
22mm Thread Bolt
Load Cell
Wall
Base Plate12mm bolt
Footing 170
D12
170
15
15D8
70
20
40
170
D12
170
15
15
80
15
40
100
120
80
90
75
55
D6
170
D12
170
15
15
80
15
40
90
60
50
D4
LC Type I LC Type II LC Type III
Earthquake simulation test
13
Test designation Intended PGA(g) Measured PGA(g) Return period in Korea
(year) X-dir. Y-dir. X-dir. Y-dir.
0.140X 0.140 - 0.172 - 50
0.140YY 0.140 0.161 0.137 0.142
0.374X 0.374 – 0.292 – Design Earthquake
(DE) 0.374XY 0.374 0.431 0.316 0.450
0.60X 0.60 – 0.523 – 2400 (MCE)
0.60XY 0.60 0.691 0.525 0.643
0
0.2
0.4
0.6
0.8
1
1.2
0 0.2 0.4 0.6 0.8S
pect
ra a
ccel
erat
ion
(Sa)
Period (sec)
KBC2005 (DE)Output (Taft 0.374g X-dir.)Output (Taft 0.374g Y-dir.)KBC2005 (MCE)Output (Taft 0.60g X-dir.)Output (Taft 0.60g Y-dir.)
MCE
DE (R=1.0, IE=1.0)
1952 Taft N21E (X-dir.) Taft S69E (Y-dir.)
14
Earthquake simulation test
15
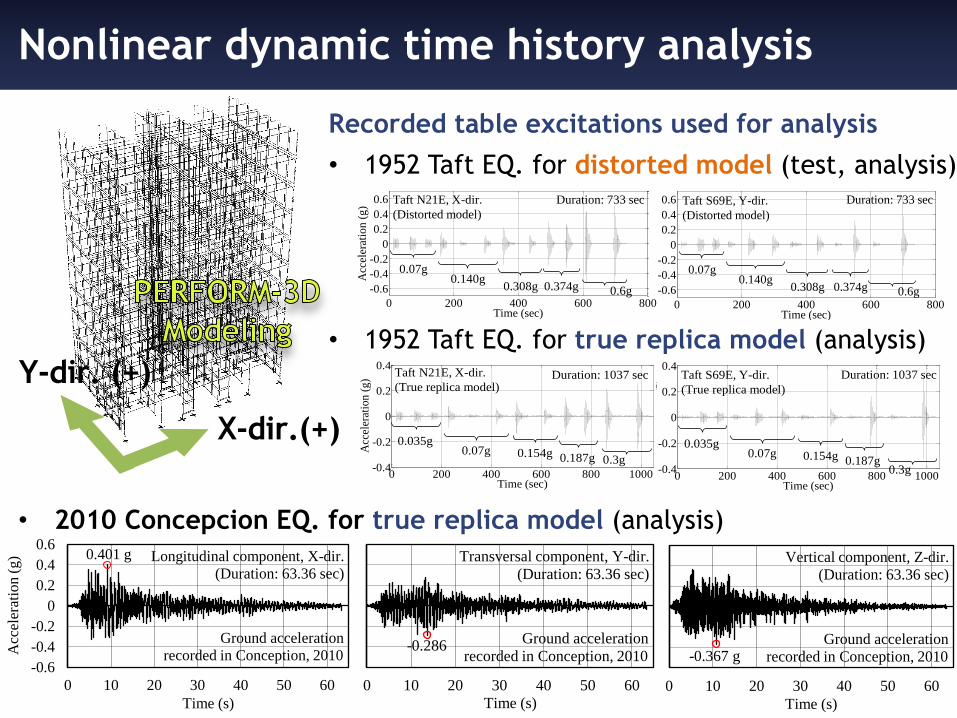
Nonlinear dynamic time history analysis
X-dir.(+)
Y-dir. (+)
0 200 400 600 800
-0.6
-0.4
-0.2
0
0.2
0.4
0.6
Time (sec)
Acc
eler
atio
n (
g)
0.07g0.140g
0.308g 0.374g 0.6g
Taft S69E, Y-dir.
(Distorted model)
Duration: 733 sec
0 200 400 600 800 1000-0.4
-0.2
0
0.2
0.4
Time (sec)
Acc
eler
atio
n (
g)
0.035g0.07g 0.154g 0.187g
0.3g
Taft S69E, Y-dir.
(True replica model)
Duration: 1037 sec
0.401 g
-0.6
-0.4
-0.2
0
0.2
0.4
0.6
0 10 20 30 40 50 60
Acc
eler
atio
n (
g)
Time (s)
Ground acceleration
recorded in Conception, 2010
Longitudinal component, X-dir.
(Duration: 63.36 sec)
-0.286
-0.6
-0.4
-0.2
0
0.2
0.4
0.6
0 10 20 30 40 50 60
Acc
eler
atio
n (
g)
Time (s)
Ground acceleration
recorded in Conception, 2010
Transversal component, Y-dir.
(Duration: 63.36 sec)
-0.367 g-0.6
-0.4
-0.2
0
0.2
0.4
0.6
0 10 20 30 40 50 60
Acc
eler
atio
n (
g)
Time (s)
Ground acceleration
recorded in Conception, 2010
Vertical component, Z-dir.
(Duration: 63.36 sec)
0 200 400 600 800
-0.6
-0.4
-0.2
0
0.2
0.4
0.6
Time (sec)
Acc
eler
atio
n (
g)
0.07g0.140g
0.308g 0.374g 0.6g
Taft N21E, X-dir.
(Distorted model)
Duration: 733 sec
0 200 400 600 800 1000-0.4
-0.2
0
0.2
0.4
Time (sec)
Acc
eler
atio
n (
g)
0.035g0.07g 0.154g 0.187g 0.3g
Taft N21E, X-dir.
(True replica model)Duration: 1037 sec
Recorded table excitations used for analysis
• 1952 Taft EQ. for distorted model (test, analysis)
• 1952 Taft EQ. for true replica model (analysis)
• 2010 Concepcion EQ. for true replica model (analysis)
16
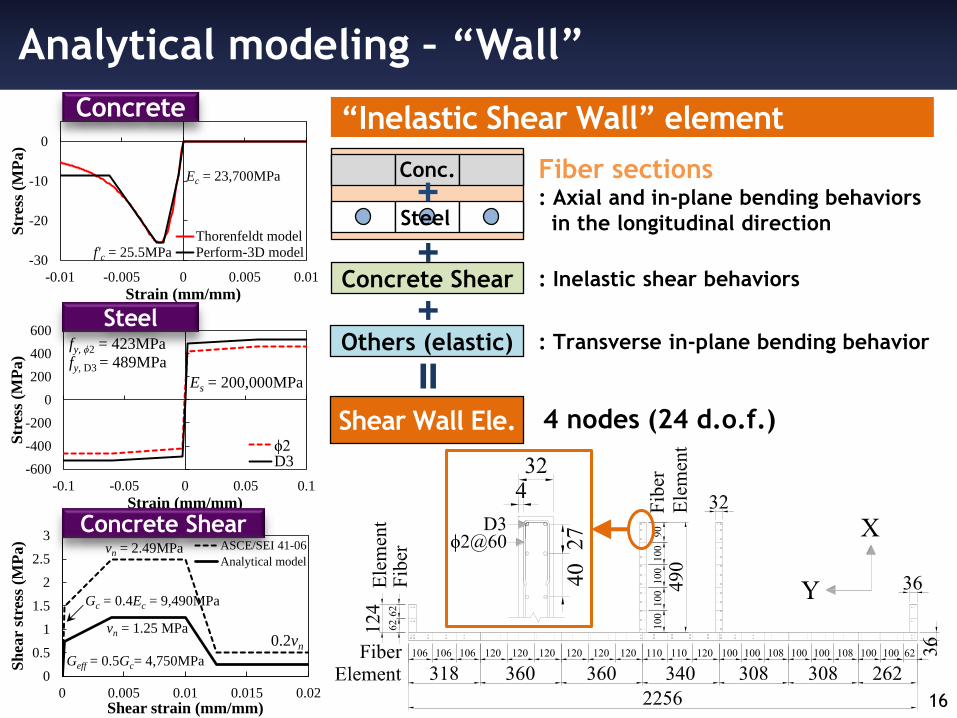
Analytical modeling – “Wall”
-30
-20
-10
0
-0.01 -0.005 0 0.005 0.01
Str
ess
(MP
a)
Strain (mm/mm)
Thorenfeldt model
Perform-3D model
Ec = 23,700MPa
f'c = 25.5MPa
-600
-400
-200
0
200
400
600
-0.1 -0.05 0 0.05 0.1
Str
ess
(MP
a)
Strain (mm/mm)
ϕ2D3
Es = 200,000MPa
fy, ϕ2 = 423MPa
fy, D3 = 489MPa
0
0.5
1
1.5
2
2.5
3
0 0.005 0.01 0.015 0.02
Sh
ear
stre
ss (
MP
a)
Shear strain (mm/mm)
ASCE/SEI 41-06
Analytical modelvn = 2.49MPa
Gc = 0.4Ec = 9,490MPa
0.2vn
Geff = 0.5Gc= 4,750MPa
vn = 1.25 MPa
Concrete
Steel
Concrete Shear
Concrete Shear
Others (elastic)
Conc.
Steel
Fiber sections : Axial and in-plane bending behaviors
in the longitudinal direction
: Inelastic shear behaviors
: Transverse in-plane bending behavior
Shear Wall Ele. 4 nodes (24 d.o.f.)
“Inelastic Shear Wall” element
17
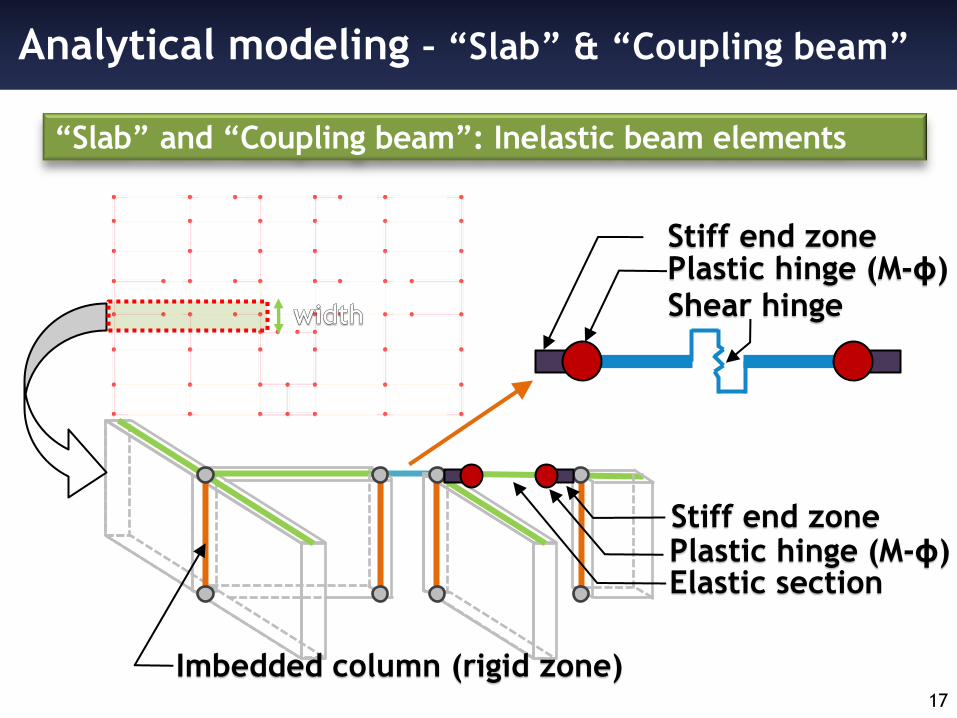
Analytical modeling – “Slab” & “Coupling beam”
“Slab” and “Coupling beam”: Inelastic beam elements
Imbedded column (rigid zone)
Plastic hinge (M-ϕ) Elastic section
Stiff end zone
Plastic hinge (M-ϕ) Shear hinge
Stiff end zone
18
Calibration of Analytical Model
-0.3
-0.15
0
0.15
0.3
0 2 4 6 8 10
V/W
Time (sec)
EXP. Anal.
Base shear / Building weight, V/W (X-dir.)
-0.3
-0.15
0
0.15
0.3
0 2 4 6 8 10
V/W
Time (sec)
EXP. Anal.
Base shear / Building weight, V/W (Y-dir.)
-0.6
-0.3
0
0.3
0.6
0 2 4 6 8 10
Roof
dri
ft (
%)
Time (sec)
EXP. Anal.
Roof drift (X-dir.)
-0.6
-0.3
0
0.3
0.6
0 2 4 6 8 10
Roof
dri
ft (
%)
Time (sec)
EXP. Anal.
Roof drift (Y-dir.)
-1000
-500
0
500
1000
0 2 4 6 8 10
OT
M (
kN
m)
Time (sec)
EXP. Anal.
Overturning moment in X-dir.
-1000
-500
0
500
1000
0 2 4 6 8 10
OT
M (
kN
m)
Time (sec)
EXP. Anal.
Overturning moment in Y-dir.
-0.3
-0.15
0
0.15
0.3
0 2 4 6 8 10
V/W
Time (sec)
EXP. Anal.
Base shear / Building weight, V/W (X-dir.)
-0.3
-0.15
0
0.15
0.3
0 2 4 6 8 10
V/W
Time (sec)
EXP. Anal.
Base shear / Building weight, V/W (Y-dir.)
-0.6
-0.3
0
0.3
0.6
0 2 4 6 8 10
Roof
dri
ft (
%)
Time (sec)
EXP. Anal.
Roof drift (X-dir.)
-0.6
-0.3
0
0.3
0.6
0 2 4 6 8 10
Roof
dri
ft (
%)
Time (sec)
EXP. Anal.
Roof drift (Y-dir.)
-1000
-500
0
500
1000
0 2 4 6 8 10
OT
M (
kN
m)
Time (sec)
EXP. Anal.
Overturning moment in X-dir.
-1000
-500
0
500
1000
0 2 4 6 8 10
OT
M (
kN
m)
Time (sec)
EXP. Anal.
Overturning moment in Y-dir.
Desi
gn E
art
hquake (
DE)
in K
ore
a
Maxim
um
Consi
dere
d E
art
hquake (
MCE)
in K
ore
a
19
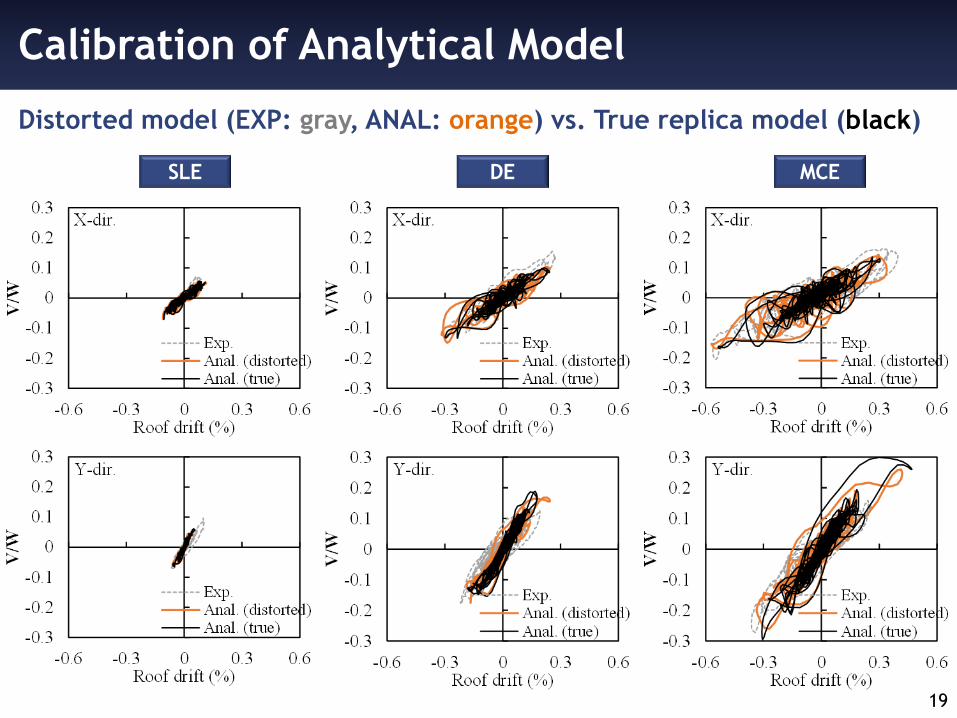
Calibration of Analytical Model
MCE DE SLE
Distorted model (EXP: gray, ANAL: orange) vs. True replica model (black)

Analytical modeling – foundation flexibility
Type of
load cell
Axial stiffness (kN/mm)
Tension Compression
LC Type I 690 1380
LC Type II 1,630 3,260
LC Type III 5,030 10,060
1
Axial Stiffness of Load cells Soil-Structural Interaction Class C: very dense soil and soft rock vs: shear wave velocity (500m/s), G0 : initial soil shear modulus (510 MPa),
ν: Poisson ratio (0.3 for sand). ρs: soil mass density (20kN/m3/g)
G = αG0 = αvs2ρs
= 317 MPa
ASCE 41-13
Kend = 1,580kN/mm
(LC 1)
21
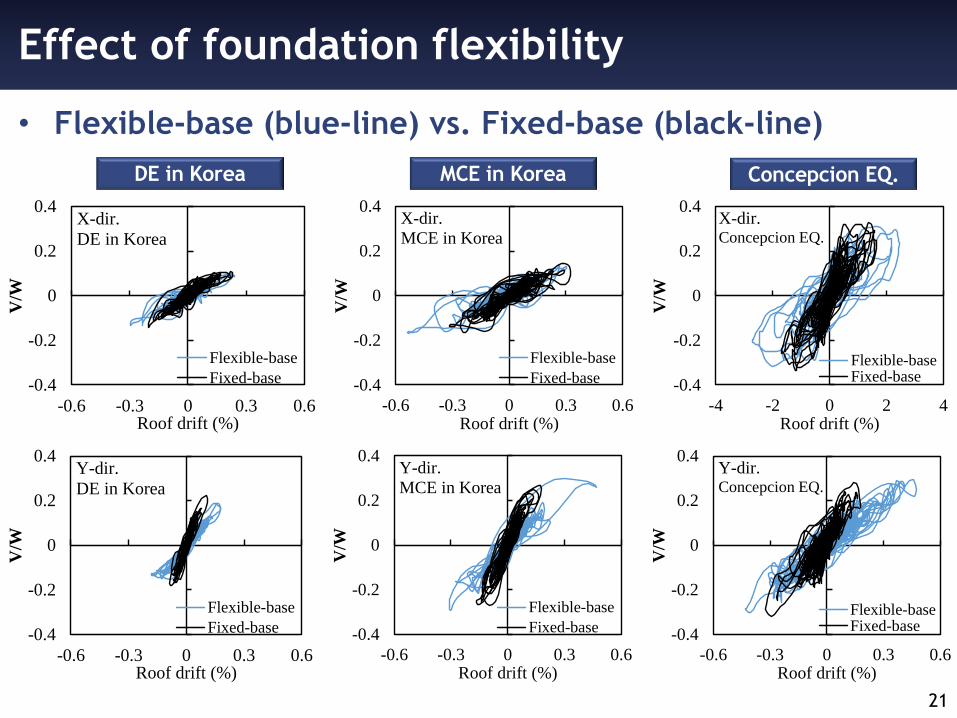
Effect of foundation flexibility
Concepcion EQ. MCE in Korea DE in Korea
-0.4
-0.2
0
0.2
0.4
-0.6 -0.3 0 0.3 0.6
V/W
Roof drift (%)
Flexible-base
Fixed-base
X-dir.
DE in Korea
-0.4
-0.2
0
0.2
0.4
-0.6 -0.3 0 0.3 0.6
V/W
Roof drift (%)
Flexible-base
Fixed-base
X-dir.
MCE in Korea
-0.4
-0.2
0
0.2
0.4
-4 -2 0 2 4
V/W
Roof drift (%)
Flexible-baseFixed-base
X-dir. Concepcion EQ.
-0.4
-0.2
0
0.2
0.4
-0.6 -0.3 0 0.3 0.6
V/W
Roof drift (%)
Flexible-base
Fixed-base
Y-dir.
MCE in Korea
-0.4
-0.2
0
0.2
0.4
-0.6 -0.3 0 0.3 0.6V
/WRoof drift (%)
Flexible-baseFixed-base
Y-dir.Concepcion EQ.
-0.4
-0.2
0
0.2
0.4
-0.6 -0.3 0 0.3 0.6
V/W
Roof drift (%)
Flexible-base
Fixed-base
Y-dir.
DE in Korea
• Flexible-base (blue-line) vs. Fixed-base (black-line)
22
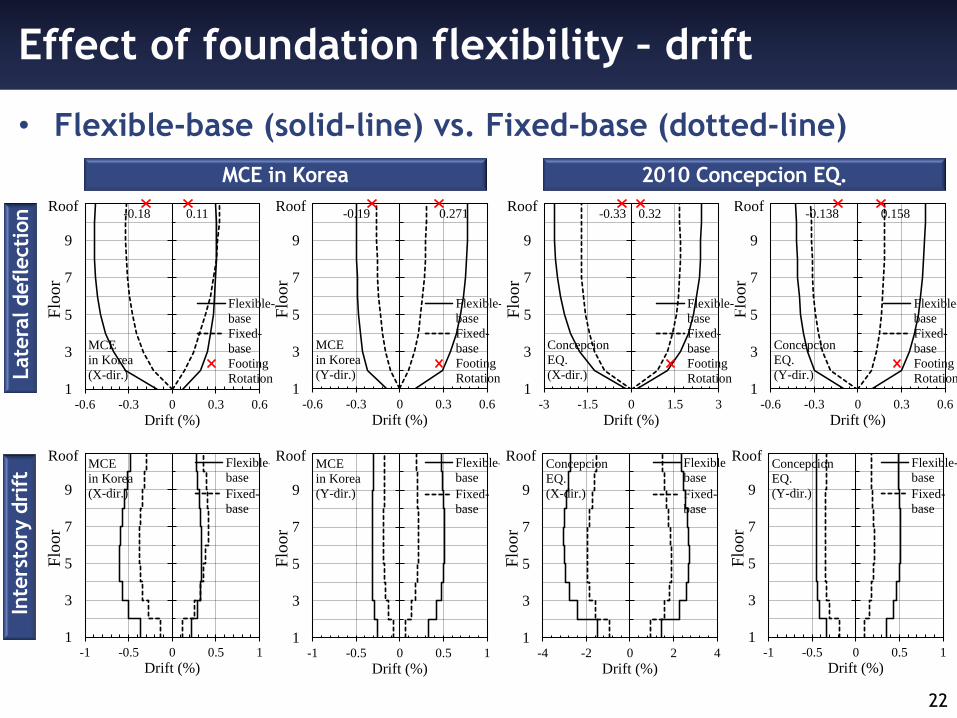
Effect of foundation flexibility – drift
• Flexible-base (solid-line) vs. Fixed-base (dotted-line)
0.271-0.19
1
3
5
7
9
11
-0.6 -0.3 0 0.3 0.6
Flo
or
Drift (%)
Flexible-
base
Fixed-
base
Footing
Rotation
Roof
MCE
in Korea
(Y-dir.)
Roof0.11-0.18
1
3
5
7
9
11
-0.6 -0.3 0 0.3 0.6
Flo
or
Drift (%)
Flexible-
base
Fixed-
base
Footing
Rotation
Roof
MCE
in Korea
(X-dir.)
Roof
MCE in Korea
1
3
5
7
9
11
-1 -0.5 0 0.5 1
Flo
or
Drift (%)
Flexible-
base
Fixed-
base
RoofMCE
in Korea
(X-dir.)
Roof
1
3
5
7
9
11
-1 -0.5 0 0.5 1
Flo
or
Drift (%)
Flexible-
base
Fixed-
base
RoofMCE
in Korea
(Y-dir.)
Roof
0.158-0.138
1
3
5
7
9
11
-0.6 -0.3 0 0.3 0.6
Flo
or
Drift (%)
Flexible-
base
Fixed-
base
Footing
Rotation
Roof
Concepcion
EQ.
(Y-dir.)
Roof0.32-0.33
1
3
5
7
9
11
-3 -1.5 0 1.5 3
Flo
or
Drift (%)
Flexible-
base
Fixed-
base
Footing
Rotation
Roof
Concepcion
EQ.
(X-dir.)
Roof
2010 Concepcion EQ.
1
3
5
7
9
11
-4 -2 0 2 4
Flo
or
Drift (%)
Flexible-
base
Fixed-
base
RoofConcepcion
EQ.
(X-dir.)
Roof
1
3
5
7
9
11
-1 -0.5 0 0.5 1
Flo
or
Drift (%)
Flexible-
base
Fixed-
base
RoofConcepcion
EQ.
(Y-dir.)
Roof
Late
ral defl
ecti
on
Inte
rsto
ry d
rift
23
Effect of foundation flexibility – drift
• Flexible-base vs. Fixed-base models
MCE in Korea
1
2
3
4
5
6
7
8
9
10
-300 -150 0 150 300
Sto
ry
Shear force (kN)
TotalPor. 1+6Por. 2+5+7+9Por. 3+4+8
Fixed-base
MCE
in Korea
at max.
base shear
(X-dir.)
1
2
3
4
5
6
7
8
9
10
-300 -150 0 150 300
Sto
ry
Shear force (kN)
TotalPor. 1+6Por. 2+5+7+9Por. 3+4+8
Fixed-base
MCE
in Korea
at max.
base shear
(Y-dir.)
Fixed-base Flexible-base
1
2
3
4
5
6
7
8
9
10
-300 -150 0 150 300
Sto
ry
Shear force (kN)
TotalPor. 1+6Por. 2+5+7+9Por. 3+4+8
Flexible-base
MCE
in Korea
at max.
base shear
(X-dir.)
1
2
3
4
5
6
7
8
9
10
-300 -150 0 150 300
Sto
ry
Shear force (kN)
TotalPor. 1+6Por. 2+5+7+9Por. 3+4+8
Flexible-base
MCE
in Korea
at max.
base shear
(Y-dir.)
2010 Concepcion EQ.
1
2
3
4
5
6
7
8
9
10
-300 -150 0 150 300
Sto
ry
Shear force (kN)
TotalPor. 1+6Por. 2+5+7+9Por. 3+4+8
Fixed-base
MCE
in Korea
at max.
base shear
(X-dir.)
1
2
3
4
5
6
7
8
9
10
-300 -150 0 150 300
Sto
ry
Shear force (kN)
TotalPor. 1+6Por. 2+5+7+9Por. 3+4+8
Fixed-base
MCE
in Korea
at max.
base shear
(Y-dir.)
Fixed-base Flexible-base
1
2
3
4
5
6
7
8
9
10
-300 -150 0 150 300
Sto
ry
Shear force (kN)
TotalPor. 1+6Por. 2+5+7+9Por. 3+4+8
Flexible-base
MCE
in Korea
at max.
base shear
(X-dir.)
1
2
3
4
5
6
7
8
9
10
-300 -150 0 150 300
Sto
ry
Shear force (kN)
TotalPor. 1+6Por. 2+5+7+9Por. 3+4+8
Flexible-base
MCE
in Korea
at max.
base shear
(Y-dir.)
X-d
ir.
Y-d
ir.

24
Damage Pattern of the Wall and Slab in Experiment
Third
Floor
upper
side
Third
Floor
lower
side
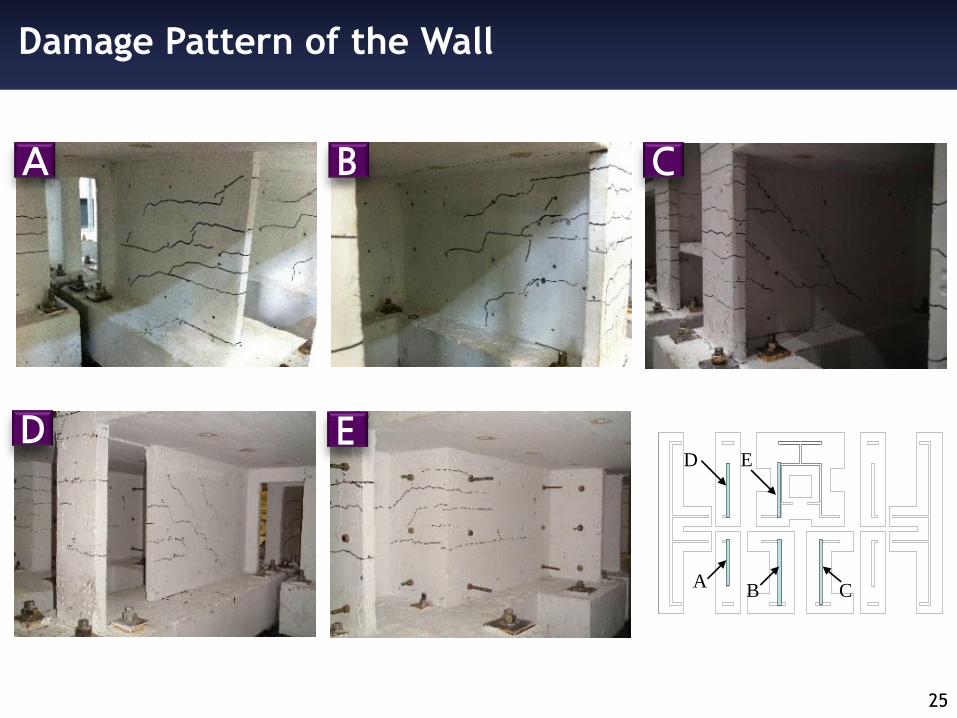
25
Damage Pattern of the Wall
AB C
ED
A B C
D E
26
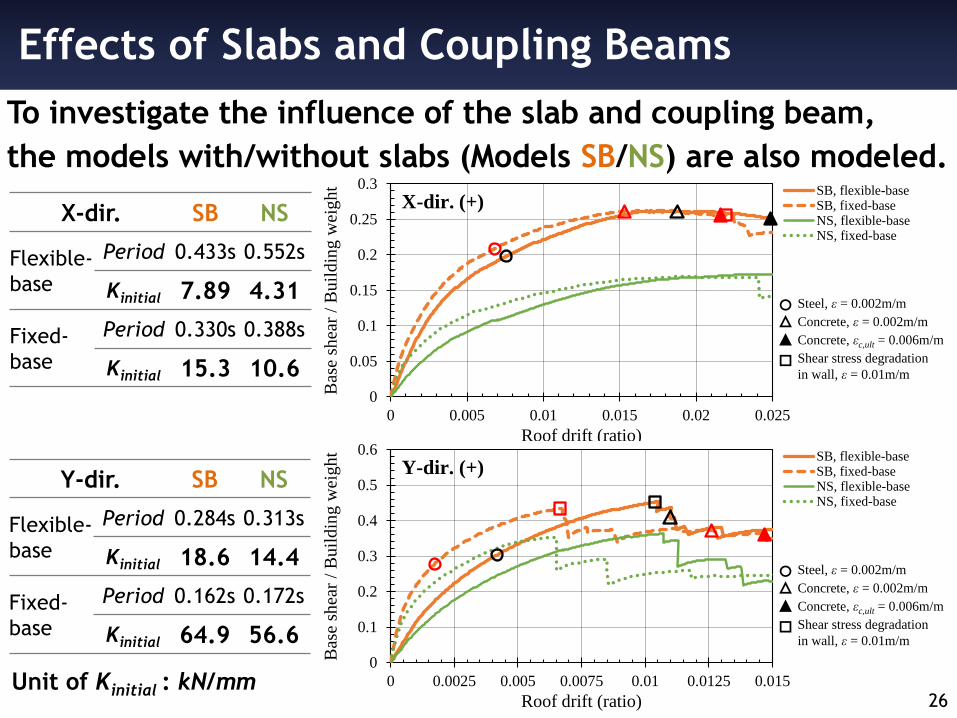
Effects of Slabs and Coupling Beams
To investigate the influence of the slab and coupling beam,
the models with/without slabs (Models SB/NS) are also modeled.
0
0.05
0.1
0.15
0.2
0.25
0.3
0 0.005 0.01 0.015 0.02 0.025
Bas
e sh
ear
/ B
uil
din
g w
eig
ht
Roof drift (ratio)
SB, flexible-baseSB, fixed-baseNS, flexible-baseNS, fixed-base
X-dir. (+)
Steel, ε = 0.002m/m
Shear stress degradation
in wall, ε = 0.01m/m
Concrete, ε = 0.002m/m
Concrete, εc,ult = 0.006m/m
0
0.1
0.2
0.3
0.4
0.5
0.6
0 0.0025 0.005 0.0075 0.01 0.0125 0.015
Bas
e sh
ear
/ B
uil
din
g w
eig
ht
Roof drift (ratio)
SB, flexible-baseSB, fixed-baseNS, flexible-baseNS, fixed-base
Y-dir. (+)
Steel, ε = 0.002m/m
Shear stress degradation
in wall, ε = 0.01m/m
Concrete, ε = 0.002m/m
Concrete, εc,ult = 0.006m/m
X-dir. SB NS
Flexible-
base
Period 0.433s 0.552s
Kinitial 7.89 4.31
Fixed-
base
Period 0.330s 0.388s
Kinitial 15.3 10.6
Y-dir. SB NS
Flexible-
base
Period 0.284s 0.313s
Kinitial 18.6 14.4
Fixed-
base
Period 0.162s 0.172s
Kinitial 64.9 56.6
Unit of Kinitial : kN/mm
27
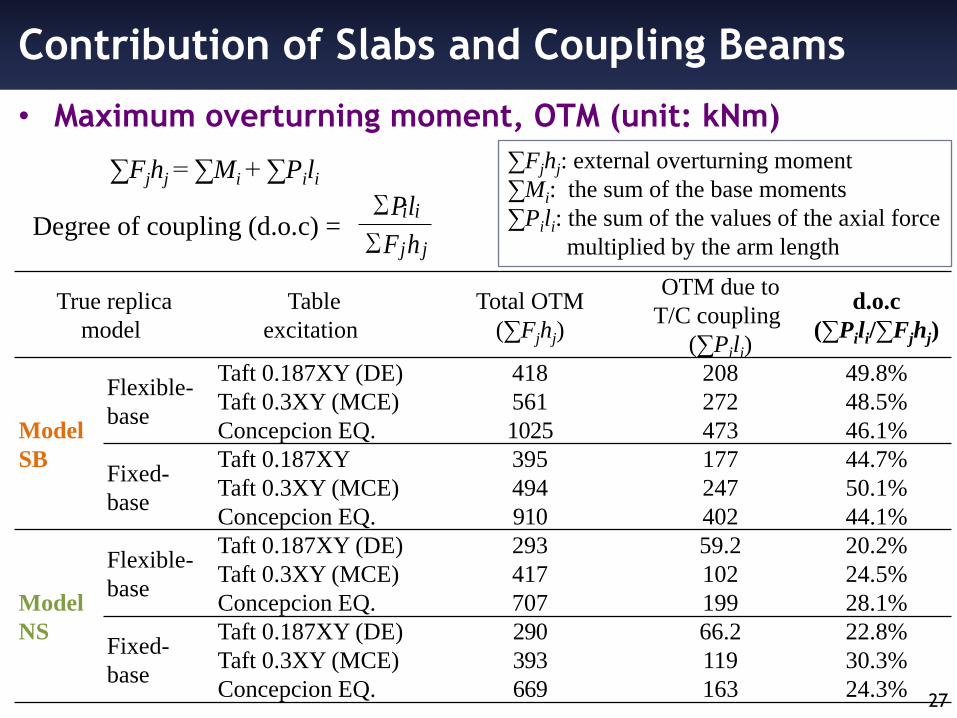
Contribution of Slabs and Coupling Beams
∑Fjhj = ∑Mi + ∑Pili
Degree of coupling (d.o.c) = ∑
∑
jj
ii
hF
lP
True replica
model
Table
excitation
Total OTM
(∑Fjhj)
OTM due to
T/C coupling
(∑Pili)
d.o.c
(∑Pili/∑Fjhj)
Model
SB
Flexible-
base
Taft 0.187XY (DE) 418 208 49.8%
Taft 0.3XY (MCE) 561 272 48.5%
Concepcion EQ. 1025 473 46.1%
Fixed-
base
Taft 0.187XY 395 177 44.7%
Taft 0.3XY (MCE) 494 247 50.1%
Concepcion EQ. 910 402 44.1%
Model
NS
Flexible-
base
Taft 0.187XY (DE) 293 59.2 20.2%
Taft 0.3XY (MCE) 417 102 24.5%
Concepcion EQ. 707 199 28.1%
Fixed-
base
Taft 0.187XY (DE) 290 66.2 22.8%
Taft 0.3XY (MCE) 393 119 30.3%
Concepcion EQ. 669 163 24.3%
• Maximum overturning moment, OTM (unit: kNm)
∑Fjhj: external overturning moment
∑Mi: the sum of the base moments
∑Pili: the sum of the values of the axial force
multiplied by the arm length
28
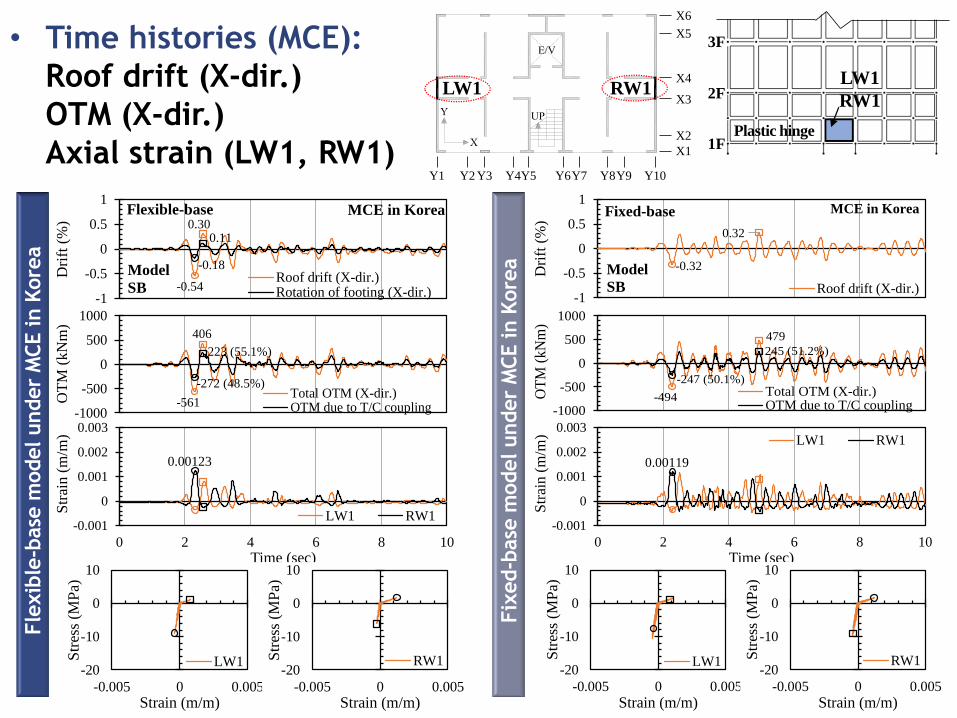
0.30
-0.54
0.11
-0.18
-1
-0.5
0
0.5
1
0 2 4 6 8 10
Dri
ft (
%)
Time (sec)
Roof drift (X-dir.)Rotation of footing (X-dir.)
MCE in KoreaFlexible-base
Model
SB
406
-561
223 (55.1%)
-272 (48.5%)
-1000
-500
0
500
1000
0 2 4 6 8 10
OT
M (
kN
m)
Time (sec)
Total OTM (X-dir.)OTM due to T/C coupling
0.00123
-0.001
0
0.001
0.002
0.003
0 2 4 6 8 10
Str
ain
(m
/m)
Time (sec)
LW1 RW1
-20
-10
0
10
-0.005 0 0.005
Str
ess
(MP
a)
Strain (m/m)
LW1-20
-10
0
10
-0.005 0 0.005
Str
ess
(MP
a)
Strain (m/m)
RW1
Fle
xib
le-b
ase
model under
MCE in K
ore
a 0.32
-0.32
-1
-0.5
0
0.5
1
0 2 4 6 8 10
Dri
ft (
%)
Time (sec)
Roof drift (X-dir.)
MCE in KoreaFixed-base
Model
SB
479
-494
245 (51.2%)
-247 (50.1%)
-1000
-500
0
500
1000
0 2 4 6 8 10
OT
M (
kN
m)
Time (sec)
Total OTM (X-dir.)OTM due to T/C coupling
0.00119
-0.001
0
0.001
0.002
0.003
0 2 4 6 8 10S
trai
n (
m/m
)
Time (sec)
LW1 RW1
-20
-10
0
10
-0.005 0 0.005
Str
ess
(MP
a)
Strain (m/m)
LW1-20
-10
0
10
-0.005 0 0.005
Str
ess
(MP
a)
Strain (m/m)
RW1
Fix
ed-b
ase
model under
MCE in K
ore
a
• Time histories (MCE):
Roof drift (X-dir.)
OTM (X-dir.)
Axial strain (LW1, RW1)
LW1 RW1
Y1 Y2 Y3 Y4Y5 Y7Y6 Y8Y9 Y10
X1
X2
X3
X4
X5
X6
Plastic hinge
2F
3F
1F
LW1
RW1
0.0122
-20
-10
0
10
-0.01 0 0.01 0.02 0.03
Str
ess
(MP
a)
Strain (m/m)
LW1
0.0144
-20
-10
0
10
-0.01 0 0.01 0.02 0.03
Str
ess
(MP
a)
Strain (m/m)
RW1
0.0112
-20
-10
0
10
-0.01 0 0.01 0.02 0.03
Str
ess
(MP
a)
Strain (m/m)
LW1
0.0103
-20
-10
0
10
-0.01 0 0.01 0.02 0.03
Str
ess
(MP
a)
Strain (m/m)
RW1
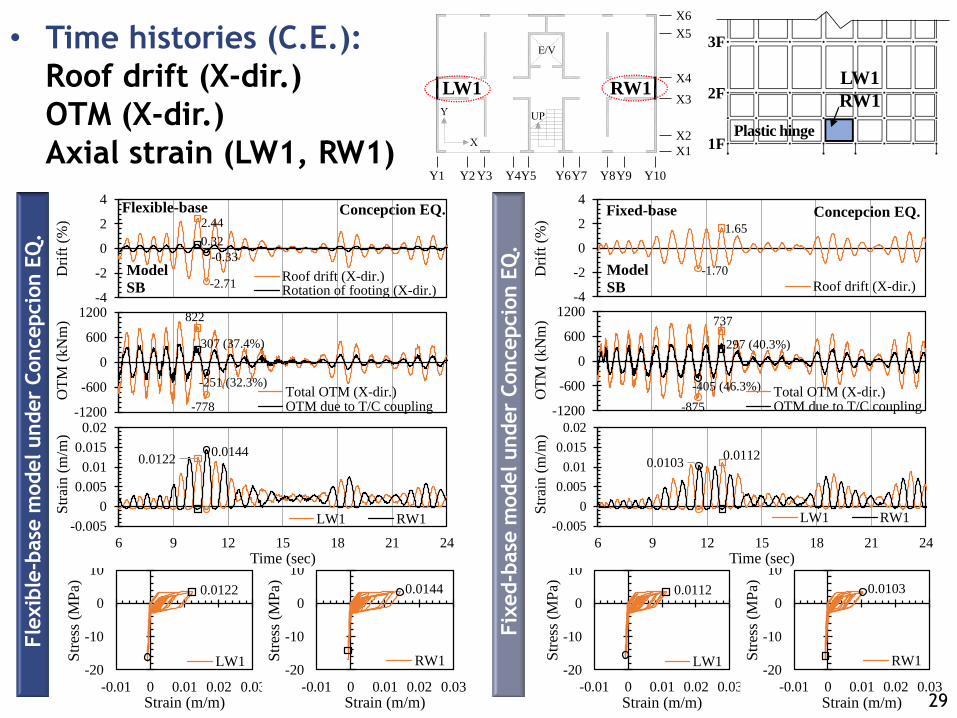
2.44
-2.71
0.32
-0.33
-4
-2
0
2
4
6 9 12 15 18 21 24
Dri
ft (
%)
Time (sec)
Roof drift (X-dir.)Rotation of footing (X-dir.)
Concepcion EQ.Flexible-base
Model
SB
822
-778
307 (37.4%)
-251 (32.3%)
-1200
-600
0
600
1200
6 9 12 15 18 21 24
OT
M (
kN
m)
Time (sec)
Total OTM (X-dir.)OTM due to T/C coupling
0.0122 0.0144
-0.005
0
0.005
0.01
0.015
0.02
6 9 12 15 18 21 24
Str
ain
(m
/m)
Time (sec)
LW1 RW1
1.65
-1.70
-4
-2
0
2
4
6 9 12 15 18 21 24
Dri
ft (
%)
Time (sec)
Roof drift (X-dir.)
Concepcion EQ.Fixed-base
Model
SB
737
-875
297 (40.3%)
-405 (46.3%)
-1200
-600
0
600
1200
6 9 12 15 18 21 24
OT
M (
kN
m)
Time (sec)
Total OTM (X-dir.)OTM due to T/C coupling
0.0112 0.0103
-0.005
0
0.005
0.01
0.015
0.02
6 9 12 15 18 21 24S
trai
n (
m/m
)
Time (sec)
LW1 RW1
29
Fle
xib
le-b
ase
model under
Concepcio
n E
Q.
Fix
ed-b
ase
model under
Concepcio
n E
Q.
• Time histories (C.E.):
Roof drift (X-dir.)
OTM (X-dir.)
Axial strain (LW1, RW1)
LW1 RW1
Y1 Y2 Y3 Y4Y5 Y7Y6 Y8Y9 Y10
X1
X2
X3
X4
X5
X6
Plastic hinge
2F
3F
1F
LW1
RW1
-0.00089
0.00528
-20
-10
0
10
-0.006 0 0.006
Str
ess
(MP
a)
Strain (m/m)
X6Y1
0.00381
-0.00076 -20
-10
0
10
-0.006 0 0.006
Str
ess
(MP
a)
Strain (m/m)
X6Y6
30
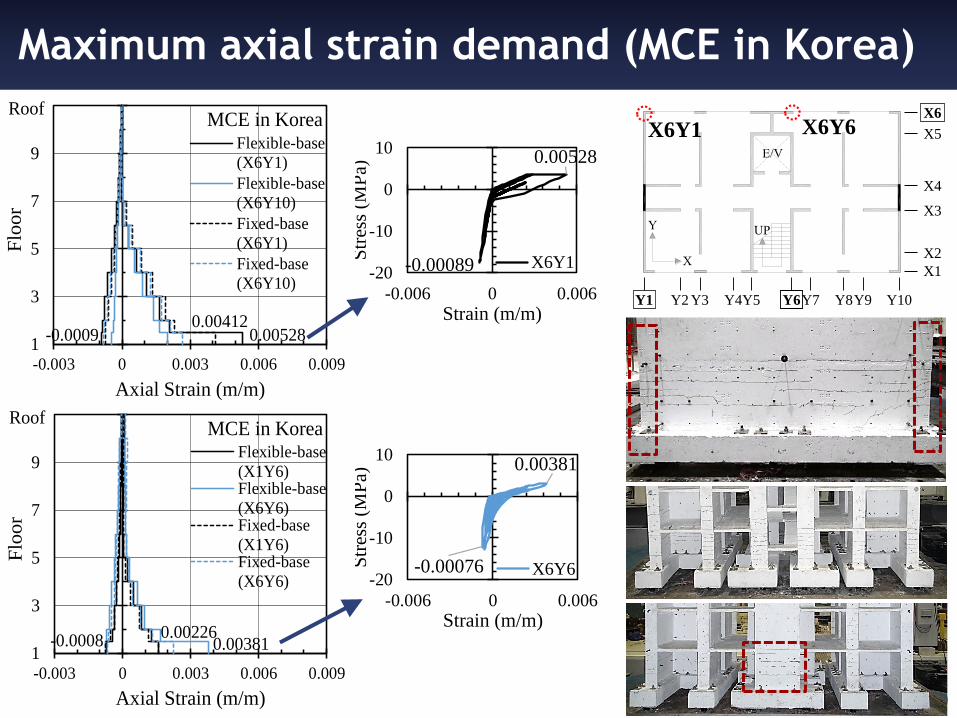
Maximum axial strain demand (MCE in Korea)
0.00528 0.00412
-0.0009 1
3
5
7
9
11
-0.003 0 0.003 0.006 0.009
Flo
or
Axial Strain (m/m)
Flexible-base
(X6Y1)
Flexible-base
(X6Y10)
Fixed-base
(X6Y1)
Fixed-base
(X6Y10)
MCE in KoreaRoof
0.00381 0.00226
-0.0008 1
3
5
7
9
11
-0.003 0 0.003 0.006 0.009
Flo
or
Axial Strain (m/m)
Flexible-base
(X1Y6)Flexible-base
(X6Y6)Fixed-base
(X1Y6)Fixed-base
(X6Y6)
MCE in KoreaRoof
Y1 Y2 Y3 Y4Y5 Y7Y6 Y8Y9 Y10
X1
X2
X3
X4
X5
X6
X6Y1 X6Y6
-0.0013
0.0243
-20
-10
0
10
-0.01 0 0.01 0.02 0.03
Str
ess
(MP
a)
Strain (m/m)
X6Y1
0.0252
-0.00686 -20
-10
0
10
-0.01 0 0.01 0.02 0.03
Str
ess
(MP
a)
Strain (m/m)
X6Y6
0.0128 0.0217 0.0243
0.0196
-0.00134 1
3
5
7
9
11
-0.01 0 0.01 0.02 0.03
Flo
or
Axial Strain (m/m)
Flexible-base
(X6Y1)
Flexible-base
(X6Y10)
Fixed-base
(X6Y1)
Fixed-base
(X6Y10)
Concepcion EQ.Roof
0.0252 0.0161 -0.0069
1
3
5
7
9
11
-0.01 0 0.01 0.02 0.03
Flo
or
Axial Strain (m/m)
Flexible-base
(X1Y6)Flexible-base
(X6Y6)Fixed-base
(X1Y6)Fixed-base
(X6Y6)
Concepcion EQ.Roof
31
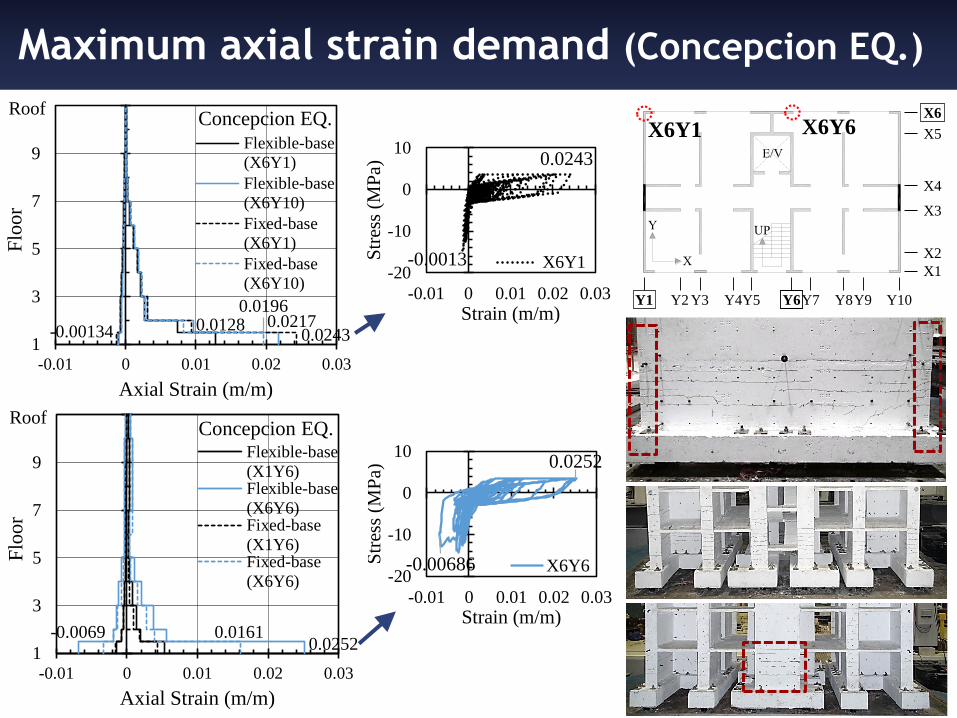
Maximum axial strain demand (Concepcion EQ.)
Y1 Y2 Y3 Y4Y5 Y7Y6 Y8Y9 Y10
X1
X2
X3
X4
X5
X6
X6Y1 X6Y6
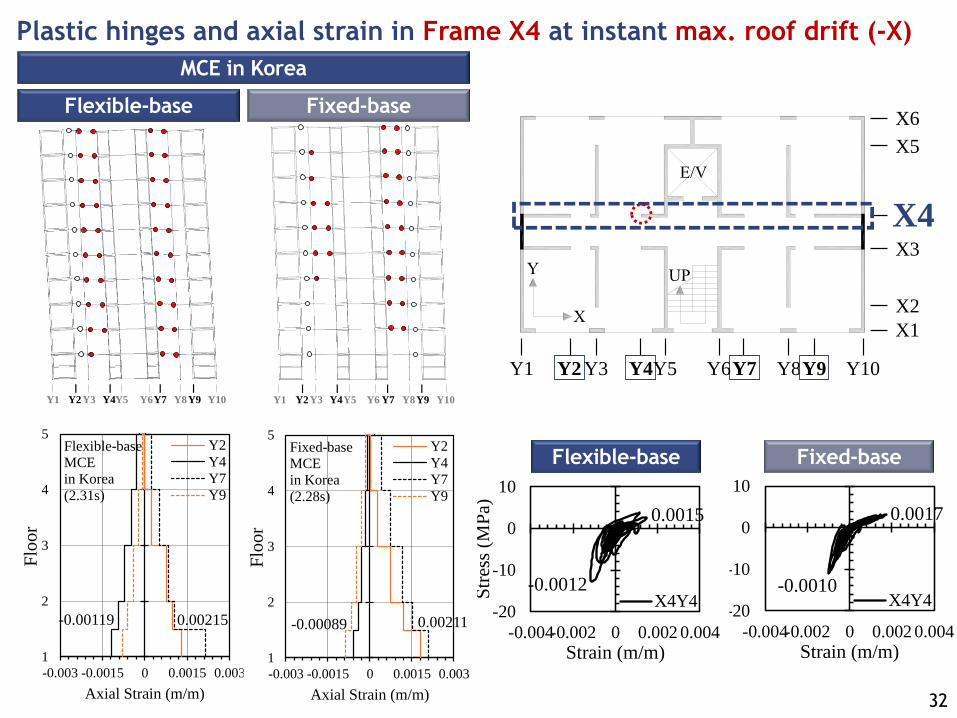
-0.0010
0.0017
-20
-10
0
10
-0.004-0.002 0 0.002 0.004
Str
ess
(MP
a)
Strain (m/m)
X4Y4-0.0012
0.0015
-20
-10
0
10
-0.004-0.002 0 0.002 0.004
Str
ess
(MP
a)
Strain (m/m)
X4Y4
32
Model SB, Flexible-base
Instant: 2.31s (max. roof drift (-X))
under MCE in Korea
Y1 Y2Y3 Y4Y5 Y6Y7 Y8Y9 Y10
Model SB, Fixed-base
Instant: 2.28s (max. roof drift (-X))
under MCE in Korea
Y1 Y2Y3 Y4Y5 Y6 Y7 Y8Y9 Y10
-0.00119 0.00215
1
2
3
4
5
-0.003 -0.0015 0 0.0015 0.003
Flo
or
Axial Strain (m/m)
Y2
Y4
Y7
Y9
Flexible-base
MCE
in Korea
(2.31s)
0.00211 -0.00089
1
2
3
4
5
-0.003 -0.0015 0 0.0015 0.003
Flo
or
Axial Strain (m/m)
Y2
Y4
Y7
Y9
Fixed-base
MCE
in Korea
(2.28s)
MCE in Korea
Fixed-base Flexible-base
Fixed-base Flexible-base
Y1 Y2 Y3 Y4Y5 Y7Y6 Y8Y9 Y10
X1
X2
X3
X4
X5
X6
Plastic hinges and axial strain in Frame X4 at instant max. roof drift (-X)

Y1 Y2Y3 Y4Y5 Y6Y7 Y8Y9 Y10
Model SB, Flexible-base
Instant: 10.81s (max. roof drift (-X))
under 2010 Concepcion earthquake
Y1 Y2Y3 Y4Y5 Y6Y7 Y8 Y9 Y10
Model SB, Fixed-base
Instant: 11.55s (max. roof drift (-X))
under 2010 Concepcion earthquake
-0.0154 0.0236
1
2
3
4
5
-0.03-0.02-0.01 0 0.01 0.02 0.03
Flo
or
Axial Strain (m/m)
Y2
Y4
Y7
Y9
Flexible-base
Concepcion
EQ.
(10.81s)
0.0161 -0.0080
1
2
3
4
5
-0.03-0.02-0.01 0 0.01 0.02 0.03
Flo
or
Axial Strain (m/m)
Y2
Y4
Y7
Y9
Fixed-base
Concepcion
EQ.
(11.55s)
2010 Concepcion EQ.
Fixed-base Flexible-base
33
-0.0092
0.0153
-20
-10
0
10
-0.03-0.015 0 0.015 0.03
Str
ess
(MP
a)
Strain (m/m)
X4Y4-0.0155
0.0250
-20
-10
0
10
-0.03-0.015 0 0.015 0.03
Str
ess
(MP
a)
Strain (m/m)
X4Y4
Fixed-base Flexible-base
Y1 Y2 Y3 Y4Y5 Y7Y6 Y8Y9 Y10
X1
X2
X3
X4
X5
X6
Plastic hinges and axial strain in Frame X4 at instant max. roof drift (-X)
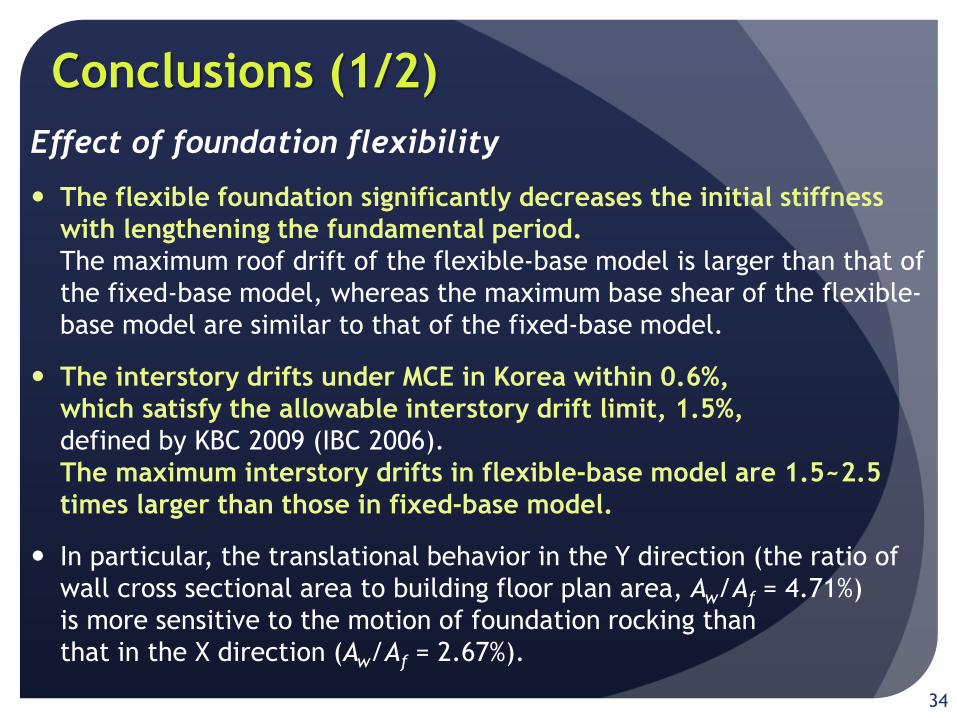
Effect of foundation flexibility
The flexible foundation significantly decreases the initial stiffness
with lengthening the fundamental period.
The maximum roof drift of the flexible-base model is larger than that of
the fixed-base model, whereas the maximum base shear of the flexible-
base model are similar to that of the fixed-base model.
The interstory drifts under MCE in Korea within 0.6%,
which satisfy the allowable interstory drift limit, 1.5%,
defined by KBC 2009 (IBC 2006).
The maximum interstory drifts in flexible-base model are 1.5~2.5
times larger than those in fixed-base model.
In particular, the translational behavior in the Y direction (the ratio of
wall cross sectional area to building floor plan area, Aw/Af = 4.71%)
is more sensitive to the motion of foundation rocking than
that in the X direction (Aw/Af = 2.67%).
Conclusions (1/2)
34
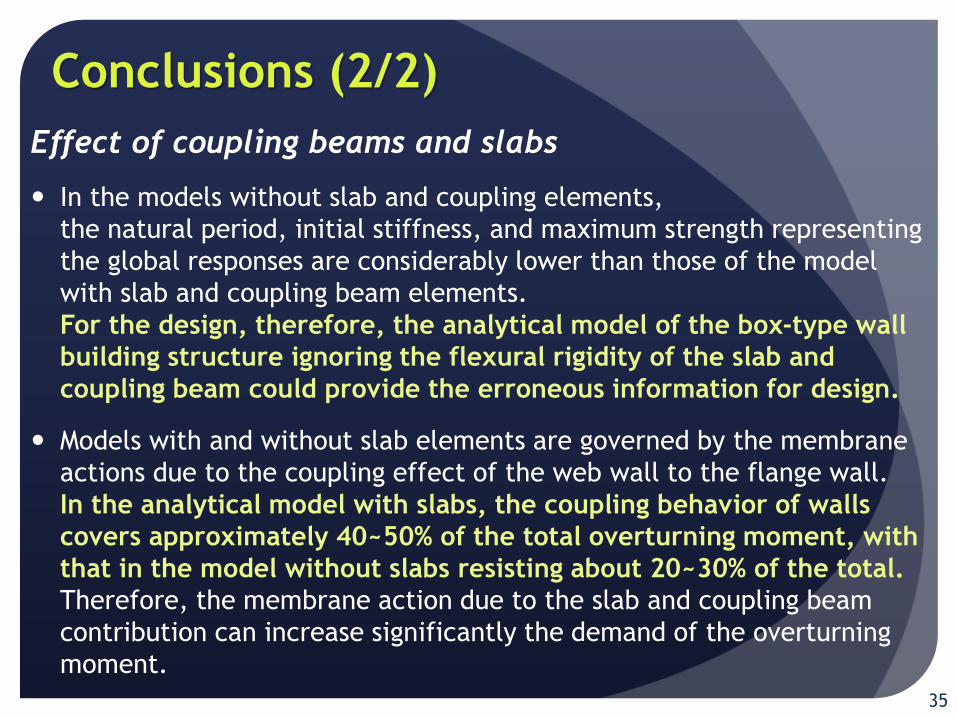
Effect of coupling beams and slabs
In the models without slab and coupling elements,
the natural period, initial stiffness, and maximum strength representing
the global responses are considerably lower than those of the model
with slab and coupling beam elements.
For the design, therefore, the analytical model of the box-type wall
building structure ignoring the flexural rigidity of the slab and
coupling beam could provide the erroneous information for design.
Models with and without slab elements are governed by the membrane
actions due to the coupling effect of the web wall to the flange wall.
In the analytical model with slabs, the coupling behavior of walls
covers approximately 40~50% of the total overturning moment, with
that in the model without slabs resisting about 20~30% of the total.
Therefore, the membrane action due to the slab and coupling beam
contribution can increase significantly the demand of the overturning
moment.
Conclusions (2/2)
35

Thank you
for your attention!
The research presented herein was supported by the National Research Foundation
of Korea (NRF-2009-0078771) and Architecture & Urban Development Research
Program funded by Ministry of Land, Infrastructure and Transport of Korean
government (13AUDP-B066083-01). The writers are grateful for this support.
36