seismic modelling and ava - archivo digital...
TRANSCRIPT

İSTANBUL TECHNICAL UNIVERSITY
FACULTY OF MINES
DEPARTMENT OF GEOPHYSICAL ENGINEERING
SEISMIC MODELLING AND AVASEISMIC MODELLING AND AVA ANALYSIS OF HIDROCARBON TRAPS
Prepared By RICARDO J. FARO GÓMEZ
990102702
Advisorİ ĞAssist. Prof. Dr. NESLİHAN OCAKOĞLU
İSTANBUL, MAY 2011

INDEXINDEX
• INTRODUCTION• SEISMIC MODELINGSEISMIC MODELING• AVA ANALYSIS• CONCLUSIONS• REFERENCESREFERENCES
INTRODUCTION
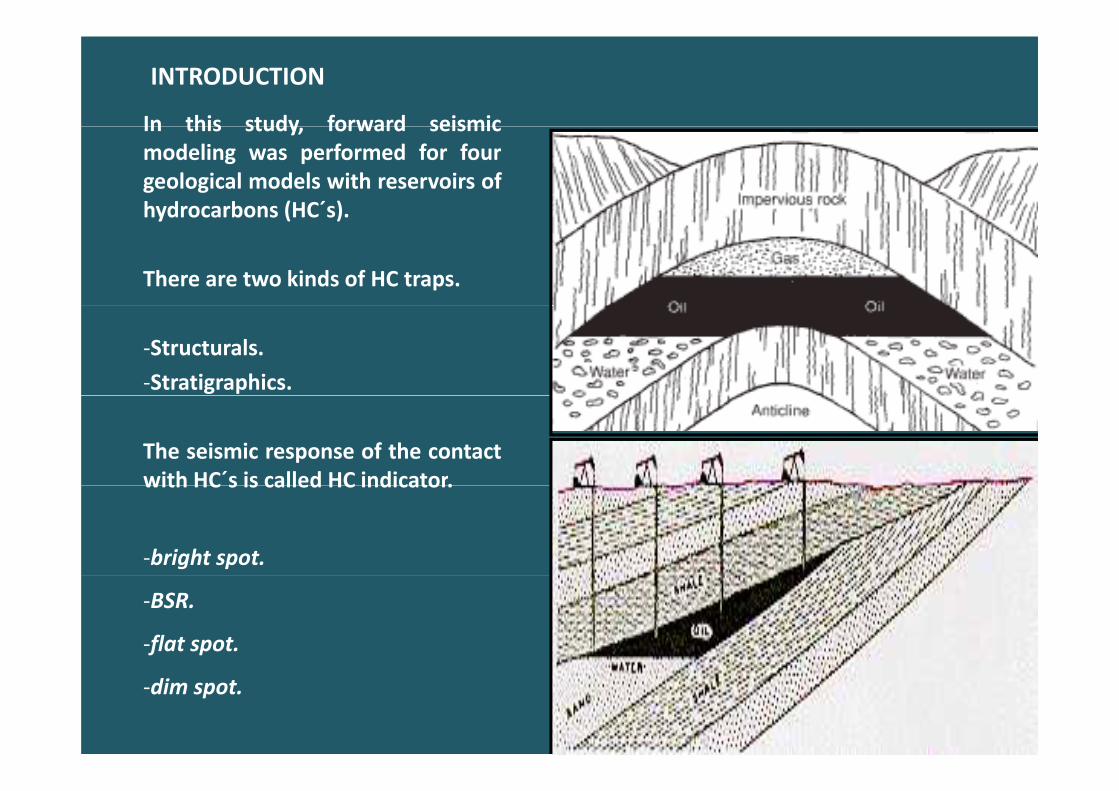
In this study forward seismicIn this study, forward seismicmodeling was performed for fourgeological models with reservoirs ofhydrocarbons (HC´s).hydrocarbons (HC s).
There are two kinds of HC traps.
‐Structurals.‐Stratigraphics.
The seismic response of the contactwith HC´s is called HC indicator.with HC s is called HC indicator.
‐bright spot.
‐BSR.
‐flat spot.
‐dim spot.

SEISMIC MODELING
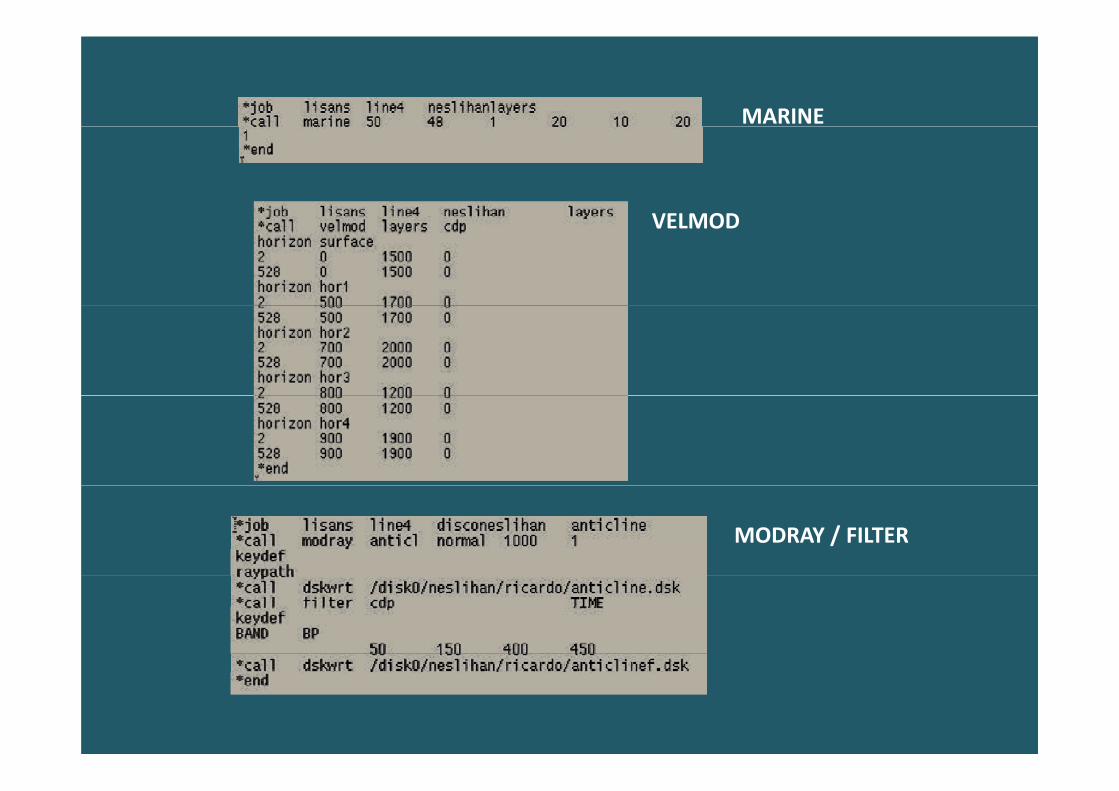
The seismic modeling was performed with DISCO/FOCUS program version 5.0 under Linux/Unix operating system
Parameters should be introduced by DISCO modules
MARINE generates the geometry of a conventional marine line.
VELMOD defines the geological models with the velocity and depth of each layer.VELMOD defines the geological models with the velocity and depth of each layer.
MODRAY performes the ray tracing modeling to create the seismic response.
FILTER designes time and spatially varying filters and applies them to seismic data.
DSKWRT writes seismic traces and their headers and stores them in a disk file.
MARINE
VELMODVELMOD
MODRAY / FILTER

PARALEL LAYERS ANTICLINE‐1
ANTICLINE‐2 PINCH OUT

BSR Shale
Gas sand
Oil sand
Gas hydrate
Free gas
BRIGHT SPOTFLAT SPOTWater sand
g
FLAT SPOT
DIM SPOT
ShaleShale
Gas sand
Gas saturated sand
Gas sand
BRIGHT SPOT
Water saturated sand

AVA ANALYSIS (Amplitude versus Angle Analysis)
It i t h l t t d f i i th t th f thIt is necessary to have a complementary study focusing in the strength of thereflection amplitudes
AVA analysis examines the changes in seismic wave amplitudes with the variation ofAVA analysis examines the changes in seismic wave amplitudes with the variation ofthe angle of incidence of seismic wave
Zoeppritz equations govern the behavior of the wave dictating the determination ofZoeppritz equations govern the behavior of the wave dictating the determination ofreflection and transmission coefficients or amplitudes for both p‐ and s‐waves as afunction of angle of incidence.
Rpp, Rps, Tpp and Tps are the reflection (R) and refraction (T) coefficients
AVA ANALYSIS (Amplitude versus Angle Analysis)
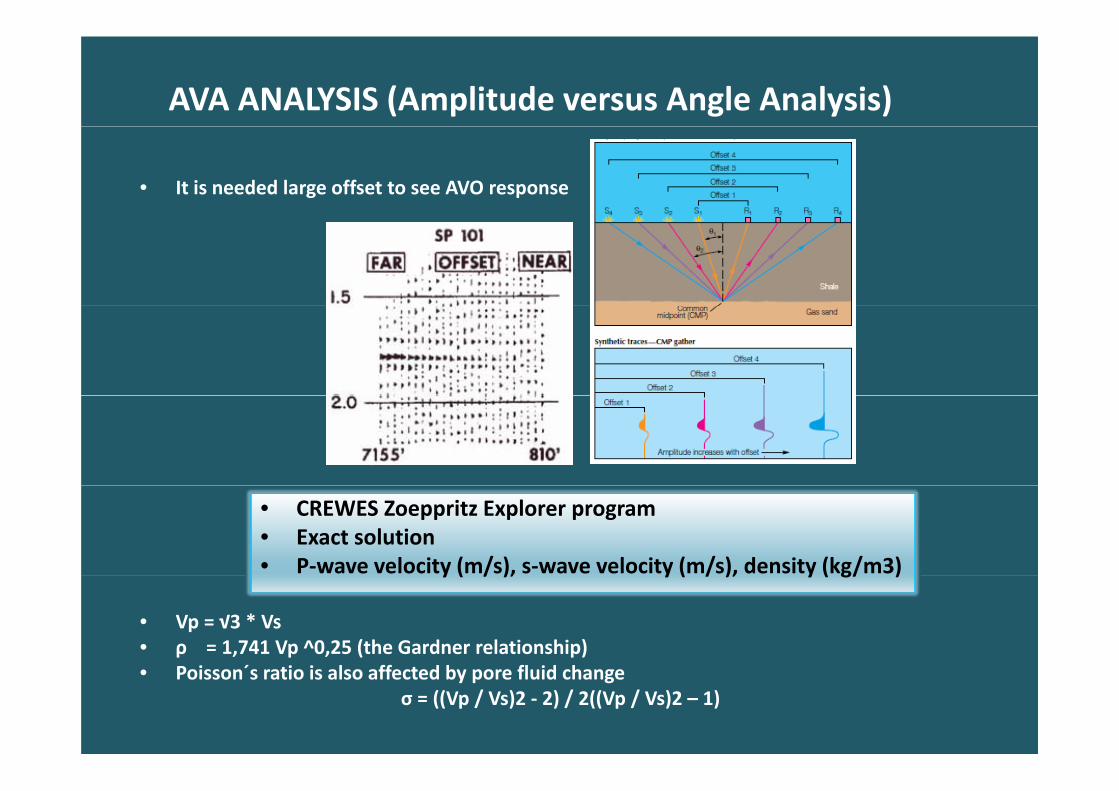
• It is needed large offset to see AVO response
• CREWES Zoeppritz Explorer program• Exact solution• P‐wave velocity (m/s), s‐wave velocity (m/s), density (kg/m3)
• Vp = √3 * Vs• ρ = 1,741 Vp ^0,25 (the Gardner relationship)
´ l ff d b fl d h
y ( / ), y ( / ), y ( g/ )
• Poisson´s ratio is also affected by pore fluid changeσ = ((Vp / Vs)2 ‐ 2) / 2((Vp / Vs)2 – 1)

Gas hydrate – Free gas (Parallel layers)
Shale – Gas sand(Anticline‐1)BSR BRIGHT SPOT
AVA curves of HC contacts in each model
Shale – Gas sand(Anticline‐2) DIM SPOT
Oil sand – Water sand(Anticline‐1)
FLAT SPOT

Models Poisson ratio Layer above Layer bellow
Shale –Gas sand(Anticline‐Contact 1) σ 0.314 0.299
Gas hydrate ‐Free gasGas hydrate Free gas(Parallellayers–Contact 3) σ 0.283 0.242
Gas sand –Oil sand(Anticline‐Contact2) σ 0.299 0.283
Oil sand –Water sand(Anticline‐Contact3) σ 0.283 0.312(Anticline Contact3) σ 0.283 0.312
Shale –Gas sand(Pinchout‐Contact 1) σ 0.314 0.299
Gas sand ‐Shale(Pinch out‐Contact 2) σ 0.299 0.314
Watersand–Shale(Pinchout‐Contact 4) σ 0.312 0.314
S di 2Freegas–Sediments2(Parallellayers‐Contact 4) σ 0.242 0.308

CONCLUSIONS• Generally the seismic response is different from the real geology because of the p‐wave velocity change.
When the p‐wave velocity is lower the wave takes longer to through the layer
• The most important parameter during the modeling is the P‐wave velocity
• Generally, in the seismic response, the strongest reflections are coming from Shale – Gas (BRIGHT SPOT) andGas hydrate Free gas zone (BSR) with negative reflection amplitudeGas hydrate – Free gas zone (BSR) with negative reflection amplitude
• BSR shows the bottom of the gas hydrate in the medium. If there is no gas below Gas hydrate (in parallellayers model) probably it is not possible to see BSR reflection
• It is possible to observe the weak signal of the Dim spot in the Anticline‐2 model
• Generally, flat spots show liquid/liquid contacts such as oil/water, gas/water. The contact Gas – Water in theAntcline‐2 is the strongest oneg
• The strongest zero offset reflection amplitude and the most amplitude change versus angle of incidence haveseen in Shale – Gas sand (BRIGHT SPOT) and the Gas hydrate – Free gas (BSR) contacts
• When the velocity decrease, the critical angle does not occur and reflections get negative values but whenvelocity increases with depth, critical angle occurs and all reflections get positive amplitude values
• Poisson´s ratio is very sensitive to the changes of seismic velocities of the layers
• When the pores in the rock are filled of gas the Poisson´s ratio use to low anomalously

REFERENCESREFERENCESP tt C C F lti k D S 1997 F ti l ti t b• Potter, C.C., Foltinek, D.S., 1997. Formation elastic parameters byderiving S wave velocity logs. CREWES Research Report 1997, Vol. 9,1-13.
• Yilmaz, Özdogan, 1987. Seismic data processing. Society ofExploration Geophysicists 1987.
Gadallah Mamdouh R Fisher Ray L 2005 Applied Seismology: a• Gadallah, Mamdouh R., Fisher, Ray L., 2005. Applied Seismology: acomprehensive guide to seismic theory and application. Penn WellCorporation, 1st American ed. 2005.
• Fagin, Stuart W., 1991. Seismic Modeling of Geologic Structures.Geophysical Development Series, vol. 2, 3-43.