electrical engineering (industrial...
TRANSCRIPT

“ I hereby declare that I have read through this report entitle “Study the Characteristic of
Current Distribution On Water Due To Short Medium Spark Gap” and
found that it has comply the partial fulfillment for awarding the degree of Bachelor of
Electrical Engineering (Industrial Power)”
Signature : .......................................................
Supervisor’s Name : ZIKRI ABADI BAHARUDIN
Date : ......................................................

STUDY ON THE CHARACTERISTIC OF CURRENT DISTRIBUTION ON
WATER DUE TO SHORT MEDIUM SPARK GAP
MUHAMMAD SYAFIQ BIN MOHD KAMAL
A report submitted in partial fulfillment of the requirements for the degree of
Bachelor of Electrical Engineering (Industrial Power)
Faculty of Electrical Engineering
UNIVERSITI TEKNIKAL MALAYSIA MELAKA
2013

iv
I declare that this report entitle “ Study on the Characteristic Distribution On Water Due
To Short Medium Spark Gap” is the result of my own research except
as cited in the references. The report has not been accepted for any degree and is not
concurrently submitted in candidature of any other degree.
Signature : ...........................................................
Name : MUHAMMAD SYAFIQ BIN MOHD KAMAL
Date : .............................................................

v
ACKNOWLEDGEMENT
First of all, I would like to I would like to express my deepest appreciation to all
those who provided me the possibility to complete this report. A special gratitude I give to
my final year project supervisor, Mr. Zikri Abadi Baharudin, whose contribution in
stimulating suggestions and encouragement, helped me to coordinate my project. Secondly,
I would also like to thank my family and friends who helped me a lot in finalizing this
project and keep supporting in completing this report.

vi
ABSTRACT
Electric current distribution on water is a phenomena that occur when any electric
current source present on water and distribute the current in all possible way. As an
example, the lightning strike on water, leaking under water cable and wet polluted
insulator. The current that distribute on water could not only caused a lot danger to the life,
but also to the equipment and material. Tidal wave generator safety are the main concern if
the lightning strike at the sea. However, current discharge on water also could give benefit
on water treatment.Current distribution on water depend on the water conductivity itself, as
the higher salt concentration on water, the higher magnitude current could be draw. The
experiment that has been set to observed current distribution on water consist of impulse
voltage generator and water tank equipped with iron electrode. The tested water are tap
water and saline solutions. The imitation of lightning are created using the impulse
generator and the discharge are pointed at the water. The current measured by using
Rogowski coil. The result show that current distribute by sprouting into a water , and the
underwater current distribution is more higher than surface distribution. The dissolve salt
in the liquid could also draw a higher magnitude of current. The measurement and
observation could be improved by implementing high speed camera for observation
purpose, and also the addition of Rogowski coil quantity could give more consistent and
higher accuracy reading.

vii
ABSTRAK
Penyebaran arus elektrik di dalam air adalah satu fenomena yang berlaku apabila
mana-mana sumber arus elektrik wujud di kawasan berair dan arus akan tersebar dalam
semua arah yang mungkin.Sebagai contoh, pancaran kilat di air, kebocoran kabel bawah
air dan penebatan yang basah.Penyebaran arus elektrik di air bukan hanya berbahaya pada
kehidupan, tapi juga pada peralatan. Keselamatan pada penjana ombak pasang surut adalah
menjadi kebimbangan jika kilat menyambar pada air laut.Penyebaran arus elektrik pada ar
bergantung pada kekonduksian air itu sendiri,dimana semakin tinggi kandungan garam
dalam air, semakin tinggi arus yang boeh melalui air terbabit. Eksperimen yang ingin
dijalankan adalah untuk melihat penyebaran arus elektrik di dalam air, menggunakan
penjana voltan impuls dan tangki air yang siap dipasang elektrod.Fungsi penjana voltan
impuls adalah untuk menghasilkan kilat tiruan dan mengaplikasikanya pada permukaan
air.Dua jenis air akan dikaji tahap penyebaran arus ke atasnya,iaitu air paip dan air larutan
garam.Penyebaran arus akan diukur menggunkan gelung Rogowski. Hasil eksperimen
menunjukkan arus elektrik dalam air tersebar secara bercambah dan sebaran arus di bawah
air lebih tinggi nilainya dari di permukaan.Nilai arus di dalam air yg dilarutkan garam juga
dilaporkan lebih tinggi. Pemerhatian dan pengukuran semasa eksperimen boleh ditambah
baik lagi dengan menggunakan kamera berkelajuan tinggi untuk pemerhatian,dan juga
penambahan kuantiti Rogowski coil untuk mendapatkan bacaan yang lebih jitu dan
konsisten.

viii
TABLE OF CONTENT
CHAPTER TITLE PAGE
ACKNOWLEDGEMENT iv
ABSTRACT v
TABLE OF CONTENT vii
LIST OF TABLES xi
LIST OF FIGURES xii
LIST OF APPENDICES xv
1 INTRODUCTION 1
1.1 Motivation 1
1.2 Problem Statement 2
1.3 Objectives 2
1.4 Scope 3
2 LITERATURE REVIEW 4
2.1 Introduction 4
2.2 Current Distribution On Water Due to Lightning. 4
2.3Water Conductivity 5

ix
CHAPTER TITLE PAGE
2 2.4 Electrical Discharge Application on Water Treatment 5
2.4.1 Water Electrode Ozone Generator 5
2.4. 2 A Latest Development on Water Treatment using
Electrical Discharges in Water
7
2.5 Local Discharge on Wet Polluted Insulator 8
2.6 Rogowski Coil 9
2.7 Impulse Voltage Generator 10
2.7.1 Impulse Voltage 10
2.7.2 Standard Impulse Waveform 11
2.7.3 Impulse Voltage Generator 12
3 METHODOLOGY 13
3.1 Introduction 13
3.2 Project Flow Chart 14
3.3 Gathering All Related Information Regarding The
Current Distribution on Water.
15
3.4 Recognized and get used with the possible
experiment apparatus.
15
3.4.1 Experiment apparatus description 16
3.4.1.1 Regulating transformer 16
3.4.1.2 Single phase AC voltage test
transformer
17
3.4.1.3 HV Rectifier 17
3.3.1.4 Parallel (wave tail) resistor ( RE ) 18
3.4.1.5 Smoothing capacitor 18
3.4.1.6 Series (Wave front) Resistor 19
3.4.1.7 Sphere gap 19
3.4.1.8 Remote controlled switch (grounding
switch)
20

x
CHAPTER TITLE PAGE
3.3.1.9 Pearson Current Monitor (Rogowski
Coil)
20
3.4.1.10 Low Voltage Divider 21
3.4.1.11 Tektronik DPO4000 Mixed Signal
Oscilloscope
21
3.3.1.12 DMI 551 Digital Measuring Unit 22
3.4.1.13 OT 276 Operating Terminal 23
3.5 Planning and Modeling The Experiment Design 24
3.5.1 The Experiment Design 24
3.5.2 The Water Tank 26
3.5.3 The Electrode System 27
3.5.4 Electrode Numbering 29
3.5.5 Electrode Design 29
3.6 Setup and Run An Experiment 30
3.7 Analyze The Experiment Data 33
3.8 Verification of The Experiment Result Towards
Desired Project Outcome
33
3.9 Preparation for Final Report 33
4 RESULT AND DISCUSSION 34
4.1 Introduction 34
4.1 The Input Voltages 35
4.2 Input Current 36
4.3 Current Distribution Measurement Data 37
4.4 Current Tabulated at The Electrodes 38
4.6 Samples for Analysis 39

xi
CHAPTER TITLE PAGE
4.7 Current Waveform 40
4.7.1 Tap Water Current Waveform 40
4.7.2 Saline Solution Current Waveform 44
4.8 Analysis and Discussion 48
4.8.1 The Waveform Analysis 48
4.8.2 Current Distribution Graph 49
4.8.3 The Conductivity Effect 51
4.8.4 The Distribution Analysis 52
4.8.4.1 Sprouting Distribution 52
4.8.4.2 The Distance Between Electrodes
52
5 CONCLUSION AND RECOMMENDATION 53
5.1 Conclusion 53
5.2 Recommendation 54

xii
LIST OF TABLES
TABLE TITLE PAGE
Table 2.1 Water Conductivity table 5
Table 4.1 Current Distribution Measurement Data 37
Table 4.2 Distance between Electrodes 8 to Others Samples 40

xiii
LIST OF FIGURES
FIGURES TITLE PAGE
Figure 1 Water Electrode Ozone Generator 6
Figure 2 Experiment setup for bubble on electrical discharge 7
Figure 3 Electrode system 8
Figure 4 Rogowski coil construction with electronic comparator 10
Figure 5 (a) Standard lightning impulse waveform 11
Figure 5 (b) standard switching impulse waveform 11
Figure 6 Impulse Voltage Generator Schematic 12
Figure 7 Project Flow Chart 14
Figure 8 Regulating Transformer 16
Figure 9 Single phase AC voltage test transformer 17
Figure 10 HV Rectifier 17
Figure 11 Parallel (wave tail) resistor ( RE ) 18
Figure 12 Smoothing Capacitor 18
Figure 13 Series (Wave front) Resistor 19
Figure 14 Sphere Gap 19
Figure 15 Remote controlled switch (grounding switch 20
Figure 16 Pearson Current Monitor (Rogowski Coil) 20
Figure 17 Low Voltage Divider 21
Figure 18 Tektronik DPO4000 Mixed Signal Oscilloscope 21
Figure 19 DMI 551 Digital Measuring Unit 22
Figure 20 OT 276 Operating Terminal 23
Figure 21 Experiment Design 24
Figure 22 Impulse Generator Schematic 25
Figure 23 The Implementation of Impulse Voltage Generator to the
Water
25

xiv
Figure 24 Water Tank 26
Figure 25 The Plane Electrode Placement on the Tank 27
Figure 26 Plane electrode distance at the base of tank 27
Figure 27 Side view of the water tank 28
Figure 28 Electrode Numbering 29
Figure 29 Plane Electrode 29
Figure 30 Experiment configuration 30
Figure 31 (a) Input Voltage Waveform 35
Figure 31 (b) Input Current Waveform 36
Figure 32 Tap Water Current Tabulation 38
Figure 33 Saline Solution Current Tabulation 38
Figure 34 Samples of Electrodes 39
Figure 35 Electrode 8 Current Waveform (Tap Water) 40
Figure 36 Electrode 7 Current Waveform (Tap Water) 41
Figure 37 Electrode 6 Current Waveform (Tap Water) 41
Figure 38 Electrode 3 Current Waveform (Tap Water) 42
Figure 39 Electrode 12 Current Waveform (Tap Water) 42
Figure 40 Electrode 11 Current Waveform (Tap Water) 43
Figure 41 Electrode 19 Current Waveform (Tap Water) 43
Figure 42 Electrode 8 Current Waveform (Saline Solution) 44
Figure 43 Electrode 7 Current Waveform (Saline Solution) 44
Figure 44 Electrode 6 Current Waveform (Saline Solution) 45
Figure 45 Electrode 3 Current Waveform (Saline Solution) 45
Figure 46 Electrode 12 Current Waveform (Saline Solution) 46
Figure 47 Electrode 11 Current Waveform (Saline Solution) 46
Figure 48 Electrode 19 Current Waveform (Saline Solution) 47
Figure 49 (a) Current and Voltage at Electrode 8 (Tap Water) 48
Figure 49 (b) Current and Voltage at Electrode 8 (Saline Solution) 49
Figure 50 (a) Tap Water current distribution graph 49
Figure 50 (a) Saline Solutions current distribution graph 50
Figure 50 (a) Comparison between Tap Water and Saline Solution current
distribution
50

xv
LIST OF APPENDICES
APPENDIX A 58

1
CHAPTER 1
INTRODUCTION
1.1 Motivation
The protection and precaution on current distribution in water is still does not
consider a important things nowadays, although this phenomena is quite dangerous. A
current could distribute on water from a lightning strike, leakage underwater cable, and
even a existent of moisture on a insulators also could draw a current to travel through it,
such as a corona effect. This incident could put a safety of living things and equipment at a
risk, since a huge surge of current flow could lead to a death and huge equipment damages.
To avoid that, a research regarding to this field must be done more and more, as it will
provide steady data and analysis, for future development.

2
1.2 Problem Statement
Recently, the studies and information regarding the current distribution on water is
available, but still lacking, if there are any. The focus more to the sea water current
distribution analysis. Lightning strike is the common source that lead to current presence
on the water, and it can caused a huge danger to the living things and any object. People
that on the sea for swimming and equipment such as tidal wave generator exposed to
lightning strike since it totally available on the water. Unfortunately, lightning does not
strike on sea water only. It can be any type of water, since the water itself conduct
electricity. Different water type has a different electric conductivity. Analysis on current
distribution for different type of water is necessary, since this will provide a pathway to
precautionary and protection act to avoid any accident and damages to occurs.
Furthermore, application on current distribution also can be wider in industry and
environment application such as water treatment and wet polluted insulator.
1.3 Objectives
The objectives of this project are :
To develop a small scale model for monitoring and demonstrating a current
distribution on water for analysis and learning purpose.
To investigate the current distribution characteristic on the two different type of
water
To analyze the current distribution on water data base on the actual experiment and
measurement.

3
1.4 Scope
The scope of this project is to analyze the current distribution on two different type
of water. The small scale model is planned to be set up base on impulse voltages generator,
that are connected to a water tank, as to monitor and measure a current distribution on
water. Impulse voltages generator functioned is to generate imitation of the lightning
strike. The impulse generator will generate up to 16 kV high voltage pulse and set to be
strike on the water. The current distribution is set to be tested on two different type of
water which is tap water and saline solution, which is a saline solution is prepared by
dissolving salt into a water .The current is measured by using current measuring device
(Rogowski coil) and experiment data will be presented by using digital oscilloscope with 8
bits resolution. The analysis is based on the experiment result and the observation during
the experiment.

4
CHAPTER 2
LITERATURE REVIEW
2.1 Introduction
Current distribution in water studies is become important and its purposed can be
useful in various applications. Several research and development show that current
distribution process could be valuable for human, and also it could be exist in unexpected
ways.
2.2 Current Distribution On Water Due to Lightning.
Lightning strike is the most common things that lead to the current distribute on
water, as the lightning tend to strikes water surface as the water is a good electric
conductor [2].This scenario exposing the people that in the water, such as a swimmer, to
the electric shock that could causing a death [2]. Furthermore, lightning strike on the sea
water also dangerous to tidal wave generator as it will damage the generator equipment, as
the lightning strike will distribute a high surge current to all direction in water. However,
the current will dissipate after a certain distance from the striking point, but the distance to
dissipate is depend on water conductivity [2].
5
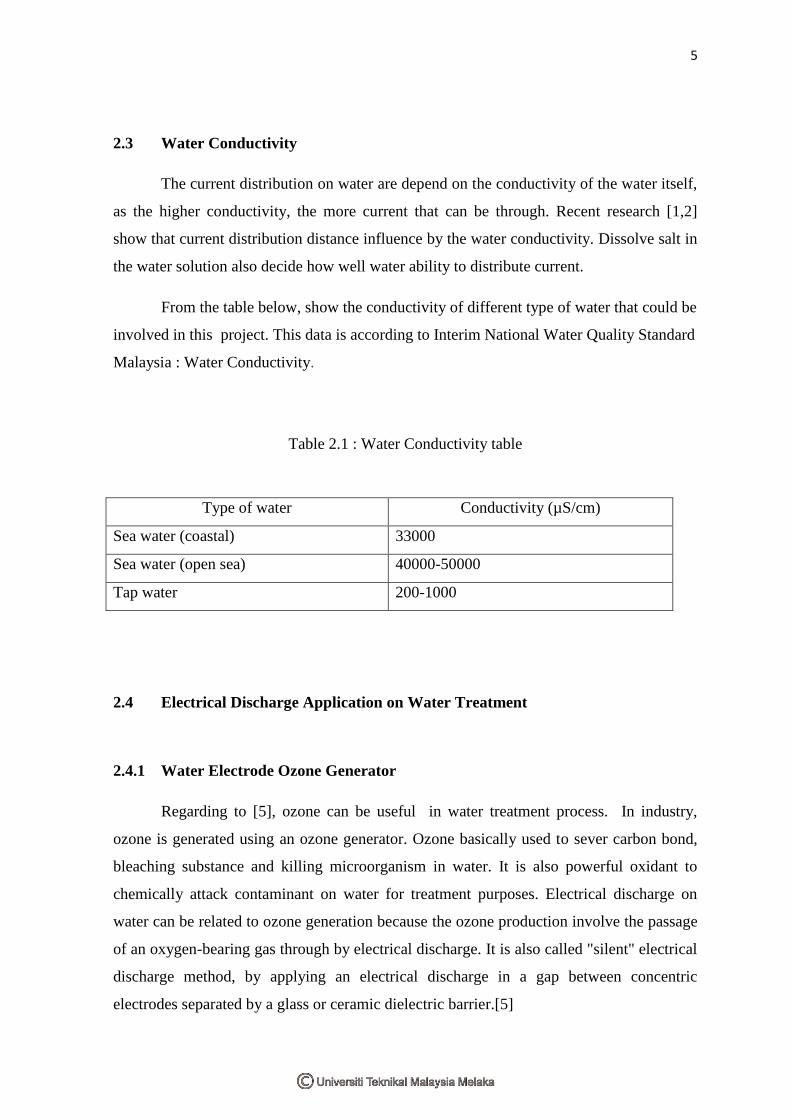
2.3 Water Conductivity
The current distribution on water are depend on the conductivity of the water itself,
as the higher conductivity, the more current that can be through. Recent research [1,2]
show that current distribution distance influence by the water conductivity. Dissolve salt in
the water solution also decide how well water ability to distribute current.
From the table below, show the conductivity of different type of water that could be
involved in this project. This data is according to Interim National Water Quality Standard
Malaysia : Water Conductivity.
Table 2.1 : Water Conductivity table
2.4 Electrical Discharge Application on Water Treatment
2.4.1 Water Electrode Ozone Generator
Regarding to [5], ozone can be useful in water treatment process. In industry,
ozone is generated using an ozone generator. Ozone basically used to sever carbon bond,
bleaching substance and killing microorganism in water. It is also powerful oxidant to
chemically attack contaminant on water for treatment purposes. Electrical discharge on
water can be related to ozone generation because the ozone production involve the passage
of an oxygen-bearing gas through by electrical discharge. It is also called "silent" electrical
discharge method, by applying an electrical discharge in a gap between concentric
electrodes separated by a glass or ceramic dielectric barrier.[5]
Type of water Conductivity (µS/cm)
Sea water (coastal) 33000
Sea water (open sea) 40000-50000
Tap water 200-1000

6
The ozone production relatively simple process is when the air is drawn into the
ozone generator, the electrical discharges that been applied will split the air oxygen (O2)
molecules into single atom O. O2 is a molecules from the combination of 2 atoms (O)
.However, some of the O atoms will react to another available O2 molecules to form an
ozone (O3).
Figure 1 : Water Electrode Ozone Generator [5]
7
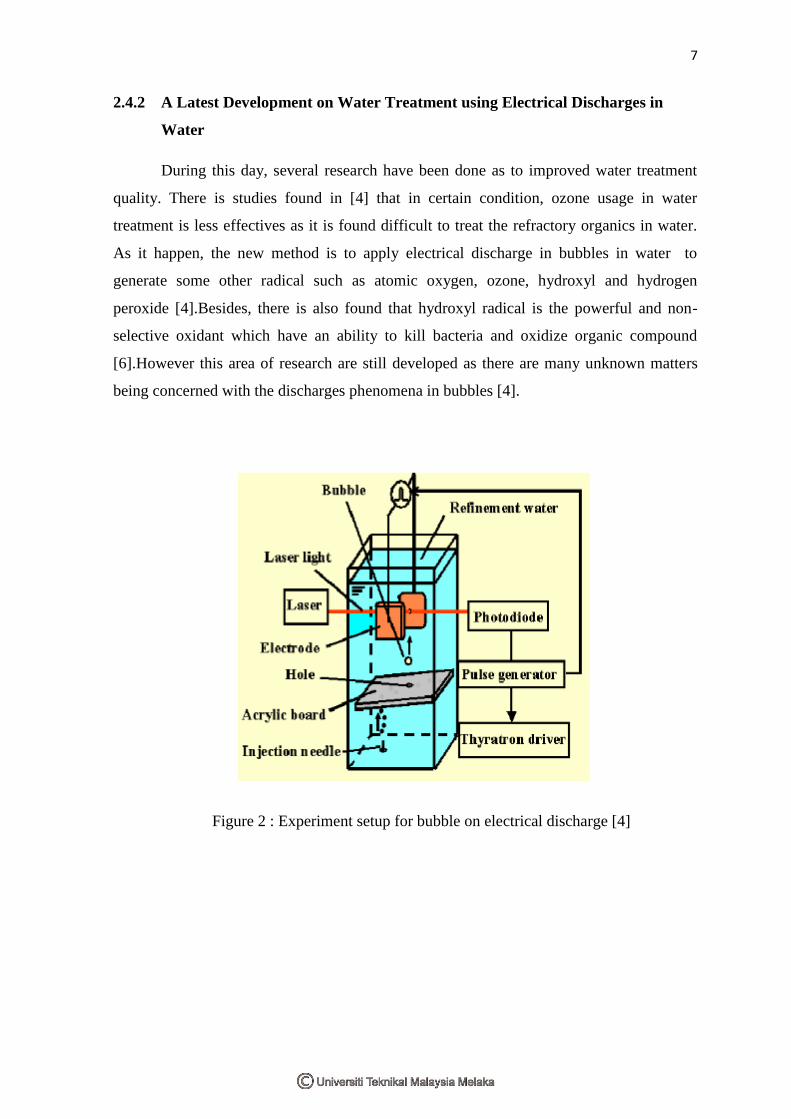
2.4.2 A Latest Development on Water Treatment using Electrical Discharges in
Water
During this day, several research have been done as to improved water treatment
quality. There is studies found in [4] that in certain condition, ozone usage in water
treatment is less effectives as it is found difficult to treat the refractory organics in water.
As it happen, the new method is to apply electrical discharge in bubbles in water to
generate some other radical such as atomic oxygen, ozone, hydroxyl and hydrogen
peroxide [4].Besides, there is also found that hydroxyl radical is the powerful and non-
selective oxidant which have an ability to kill bacteria and oxidize organic compound
[6].However this area of research are still developed as there are many unknown matters
being concerned with the discharges phenomena in bubbles [4].
Figure 2 : Experiment setup for bubble on electrical discharge [4]

8
2.5 Local Discharge on Wet Polluted Insulator
According to [7], local discharge could be happen on the electrical insulators that
exposed in a wet condition or a moisture. It is also called as wet polluted insulator. As an
example, the wet transmission lines insulator and polluted transformer oil. It is known that
local discharge propagates on wet polluted surface without drying the surface[7].Its mean,
the discharge will be maintain, as the insulator is kept wet. An experiment in [7] has been
conducted to gather information regarding local discharge on wet polluted insulator. The
test is done by applying voltage on the electrolytic solution, which is represent the wet
polluted insulator. The experiment used an electrolytic solution of aqueous solution of
potassium chloride. The impulse voltages has been focused as to be related to lightning
phenomena. The experiment setup is shown below.
Figure 3 : Electrode system [7]

9
Tungsten probe at the bottom and plane electrode functioned to detect current
distribution and propagation during the discharges occur. When the voltages is applied
from the rod electrode, the local discharge occur between the rod electrode and solution
surface .The experiment recorded that current flow through the solution surface and
voltages difference occurs between the tungsten probe. The voltages difference were varies
as the local discharges propagates.[7]
2.6 Rogowski Coil
Rogowski Coil is an electrical device used for measuring alternating current (AC)
such as high speed transient; pulsed currents or fast changing current impulses. Rogowski
coil is actually a coil of wire that wound on a non-magnetic material or air as a core and it
has a constant cross sectional area [9]. The winding wire is lead from one end returning
through the centre of the coil to the other end, so that both terminals are at the same end of
the coil [8]. The free end of the coil is normally inserted into an electronic integrator
circuit, as it will provide an output signal that is proportional to the measured current [8].
Like a CT's(current transformer), the conductor that carry measured current, or a primary
conductor can be placed at the centre of the coil for measurement process. The Rogowski
coil using a comparison principles, which at the coil and at the primary conductor. The
voltage induced in the coil will be proportional to the rate of change of current in the
primary conductor. The voltage that induced can connected to the electronic integrator.
This will generate a signal in accordance with the changing current signal.

10
2.7 Impulse Voltage Generator
2.7.1 Impulse Voltage
Impulse voltages is a transient voltage where its amplitudes may hugely exceed the
peak values of the normal AC operating voltage, in other words, a very short high voltage
surges. There is two common type of impulse voltages, which is both over voltages of
lightning and switching. The lighting over voltages is a natural phenomenon, where it is a
peak discharge in which charge accumulated in the cloud discharges into neighbouring
cloud or ground [11]. Lightning over voltages is very sudden, unpredictable and could
draw a large value of current and voltages in a short time which make it considerably
more dangerous. Meanwhile, the switching phenomena is occur in the electrical system
during the connection and disconnection of circuit breaker contact or due to interruption of
fault [11]. The rate of voltage rise is usually proportional to the operating voltages. This
two phenomena normally brought a temporary over voltages to the system, and a good
insulation is essential for protection purpose.
Figure 4 : Rogowski coil construction with electronic comparator [9]