seeing the light through the dark - eso · 1 no. 103 – march 2001 seeing the light through the...
TRANSCRIPT

1
No. 103 – March 2001
Seeing the Light Through the DarkJ. ALVES1, C. LADA2 and E. LADA3
1European Southern Observatory, Garching, Germany 2Harvard-Smithsonian Center for Astrophysics, Cambridge MA, USA; 3University of Florida, Gainsville FL, USA
Figure 1: Visible and near-infrared images of Barnard 68. The images are a B, V, and I-band composite (left) and a B, I, Ks-band composite(right). At visual wavelengths the cloud is completely opaque owing to extinction of background starlight caused by small (~ 0.1µm) interstel -lar dust particles that permeate the cloud. The red stars detected at 2 µm through the visually opaque regions of the cloud (right) are the starsthat will provide direct measurements of dust extinction through the cloud.
1. Introduction: The Search forthe Initial Conditions for StarFormation
Stars and planets form within darkmolecular clouds. However, despite 30
years of study, little is understood aboutthe internal structure of these cloudsand consequently the initial conditionsthat give rise to star and planet forma-tion. This is largely due to the fact thatmolecular clouds are primarily com-
posed of molecular hydrogen, which isvirtually inaccessible to direct observa-tion. Because of its symmetric struc-ture, the hydrogen molecule possesses
(Continued on page 15)

Nowadays almost all La Silla tele-scopes deliver very good image quality,routinely achieving sub-arcsec images.In some cases, the theoretically pre-dicted performances of the telescope ismatched, or the limitations are at leastunderstood.
The image quality, however, is notonly a function of the telescope opticalset-up, it is also highly dependent onthe cleanliness of the optical surfaces.
Main Mirror MaintenanceFive years ago, systematic cleaning
of the primary mirrors using CO2 wasimplemented on the major telescopes:the NTT, 3.6-m, 2.2-m and Danish 1.54-m. Main mirror cleaning is now carriedout by the telescope team as part of theroutine maintenance operation. T h eonly restriction with this process is thatthe humidity cannot be too high.Indeed, high humidity causes the con-densed water surrounding each coldCO2 particle to stick the dust to the mir-ror surface, resulting in an accumula-tion of dust on the mirror.
A mirror water washing operation,performed by the opticians, was alsoimplemented about three years ago.The best period to wash the mirrors isthe end of the summer, when the highhumidity is decreasing and hence thefrequency of the CO2 cleaning was dis-rupted. The mirror washing was first im-plemented on the NTT, whose mirror
cell was designed for such a process,then on the 3.6-m and is soon to be car-ried out on the 2.2-m as well.
The optimal frequency of the CO2cleaning, resulting in clean mirrorswithout too much time spent on the op-eration, was found to be one week. TheNTT was the test bench for the processwith the mirror surface maintaininggood reflectivity for a three-year periodwith the regular CO2 cleaning and four“in-situ” washings (Fig.1).
Aphotograph of the washing operationat the NTTis also presented in Figure 2.
All the above-mentioned telescopeswere realuminised during the year 2000and the reflectivity is still above 88% at670 nm with low roughness. The 2.2-mmain mirror suffered some water con-tamination during the bad winter periodand a first washing is scheduled for thenear future. Recently, the 3.6-m mainmirror also suffered water contamina-tion from cooling liquid, and the wash-ing is already scheduled end of March.
The status of the mirror is verified ona monthly basis with a measure of theR% and roughness. A database of themirror status for the main telescopeswill soon be available on the La Sillaweb site.
Telescope Image QualityAbout nine years ago, the awareness
of the observer towards the image qual-ity increased and the quality delivered
by the 3.6-m was found insufficient be-cause the improvements in the per-formance and dynamic range of the de-tectors showed more accurately the im-age quality achieved by the telescope.With the availability of wavefront sen-sors – the first one available was aShack-Hartmann type called Antares –the optical quality of the telescope wasmeasured more often, and more pre-cise aberration information was ob-tained. On several occasions, largeaberrations were identified. The spher-ical aberration, often mistaken for see-ing quality, appeared clearly and onlythe decentring coma was adjusted aftermeasurements performed only onzenith. It was found that almost all third-order aberrations were affecting the tel-escope. The most critical issue con-cerned the instability of the aberrationsat different telescope orientations aswell as with changes in temperature. Adedicated study with eventual periodsof closed telescope was really compul-sory. In 1994, a complete study of the3.6-m with a contracted optical engi-neer on La Silla was initiated to deter-mine the status of the telescope and tofind a way of improving it.
During this process, we gathered con-siderable experience in solving problemswith the telescope, but also a deeperknowledge of the limitations of the tele-scope was reached. The 2.2-m, Danish1.54-m and the NTT have all benefitedfrom this exercise. Of course, theactive optics concept, greatly demon-strated with the NTT, allowed a betterunderstanding of the local thermal con-tribution.
The contributions of dome and mirrorseeing were identified and a solution todecrease both has been found.
Thanks to all the La Silla staff for theirongoing interest and success in im-proving the image quality at the tele-scopes on site.
The NTT Status
This telescope delivers the best im-age quality on La Silla with the activeoptics system fulfilling all expectations.Initially, the limiting factor for this tele-scope was found to be the image qual-ity of the La Silla site. Now, after a longperiod of operation, more image qualitylimitations have appeared. To monitorthe image quality, the NTT has a dis-tinct advantage over the other tele-scopes as repeated image analysis ismade during the observations. All re-
2
T E L E S C O P E S A N D I N S T R U M E N TAT I O N
La Silla Telescope Status, a Great Achievement on Image Quality PerformancesA. GILLIOTTE, ESO
Figure 1: The variation of the reflectivity (R%) and roughness of the NTT main mirror duringthe period from August 1996 to August 2000.

sults are logged in a database, and sta-tistics can be performed with respect toexternal meteorological conditions orother parameters. The image qualitygenerally becomes poorer when thewind speed is below 5 m/s or if the tem-perature is dropping rapidly as demon-strated by Figure 3a.
Several recommendations weremade to the NTT team to improve theimage quality:
– Install high flux fans to produce ar-tificial wind to reduce mirror seeing.
– Install a new M2 baffle with openshade to avoid warm bubble forma-tion.
– Improve the air conditioning in theinstrument room to avoid a positive gra-dient.
– Install a Nasmyth shutter to closethe optical path not in operation.
The new baffle and fans have beeninstalled and the new results alreadyshow a substantial improvement in theimage quality (cf. Fig. 3b).
The air-conditioning of the instrumentrooms was slightly improved but an op-timal solution could not be implementedbecause of high cost.
The timing of a complete imageanalysis and mirror correction cycle isunfortunately long in comparison withthe VLT active optics system. On someoccasions, more frequently than be-fore, the active optics is not convergingproperly. Hence the telescope does notalways operate in closed-loop correc-tion. Some efforts should be undertak-
en to reach the same operational modeas used on the VLT.
A complete maintenance of the asta-tic levers is underway to recalibrate andreadjust each lever. For perfect imagingquality at the zenith, each lever must beadjusted to the medium range of thecounterweight move, and the springcompensation tuned to compensate thespherical aberration constant term.This time-consuming operation will beperformed during 2001.
The possible upgrade of the activeoptics will also include a standardisa-tion of the present software to complywith the latest version at the VLT.
The 3.6-m Status
Excellent work at the 3.6-m has re-sulted in improved image quality due tothe minimisation of the spherical aber-ration, triangular and astigmatism con-tributions, even when the telescope isinclined. In addition, the dome and mir-ror seeing contributions are now almostnegligible. The main limitations affect-ing image quality are the coma instabil-ity when moving the telescope far fromthe zenith. Astigmatism is still slightlyhigh, with a contribution coming fromthe axial fixed points. A new design ofthe axial fixed point contact on the mir-ror back side is compulsory to reduce alateral stress applied on the mirror.
A new support for the M2 unit is cur-rently under study. It will mainly be acopy of the present NTT M2 adjustingsupport. The improvement to imagequality will be significant, with the comavariation kept under control at a lowvalue. We are still awaiting the green lightto build and implement this new unit.
3
Figure 2: The NTT main mirror being rinsed with distilled water. The last washing step beforedrying the mirror surface.
Figure 3b corresponds to the same layout as Figure 3a, after instal -lation of the new baffle and fans.
Figure 3a represents the “fitting” residual variations (non-modelised7 first aberrations) of the image quality with NTT dome position rela -tive to the wind direction as well as the wind speed. Colour code ofwind speed is at top of figure in m/s.

The present status of the image qual-ity at the 3.6-m, despite the two re-maining limitations, is already within theobjectives fixed at the beginning of thestudy. We have achieved the goal of 0.9arcsec within 60 deg Zenithal Distanceand image quality as good as 0.6 arc-sec has been measured with EFOSC2.The EFOSC2 sampling limit of two pix-els is now often attained.
For the last few months, the EFOSC2image quality is logged together withthe external seeing. Figure 4 speaks foritself about the present quality of im-ages. The EFOSC2 image quality is al-ready acknowledged by the ESO com-munity.
The Infrared mode of the telescopewith the F/35 chopping M2 mirror hasalso been improved. The image qualityobtained at 10 and 20 microns with thenew TIMMI2 is diffraction limited.
The 2.2-m Status
During 2000, the telescope has beengreatly improved with the large de-crease in the contribution from astig-matism. A separate article describesthese activities.
Observers often report the imagequality as very good, and sub-arcsecimages are often obtained when theoutside seeing is good. The limiting res-olution of the Wide Field Imager pixelsize is often reached when the seeingis below 0.5 arcsec and the mirror cold-er than the outside air.
Image quality limitations still exist butare more related to thermal contribu-tions rather than opto-mechanical fea-tures.
The Danish 1.54-m Status
The ongoing problem of the sphericalaberration varying with the temperaturehas been studied again. Experiencegained on the 3.6-m, NTT and 2.2-mpresented a possible explanation of thischallenging feature. Again, the opto-mechanical mirror support seems to beguilty and the behaviour of the axialfixed points with temperature variationsis the most probable explanation. Abending effect at the mirror edge,where the spherical aberration is moresensitive, could produce the 0.3 arcsecvariable term of this aberration. The de-focus, astigmatism, quadratic and
coma terms are almost stable and be-low 0.2 arcsec.
The telescope focus has been shift-ed to compensate the high constantterm of the spherical aberration. How-ever, the variability of this aberrationwas not confirmed at the time when theamount by which to shift the focus wasdecided. Although the right correctionmay not have been applied, observersare not reporting poor image quality.The main limitation of image quality atthe Danish 1.54-m is still the instrumentdetector sampling. Even after the re-cent detector changes (October 2000),the sampling of 0.81 arcsec (2 pixels of0.015 mm with a scale of 27 arcsec/mm) is often reached when the nightseeing conditions are around or below0.6 arcsec. (The previous CCD suf-fered from diffusion transfer increasingin fact the pixel size.)
Pending Issues
A further step on improving the imagequality of the telescopes will be consid-ered this year. A large part of the straylight level affecting the depth of the im-age, is related to the telescope bafflingquality as well as the cleanliness of theoptical surface. At least three casesmust be considered, the first case iswhen there is a high density of brightstars in the field, the second when thereare very bright objects close to the tar-get and the last case when there is abright star almost alone in the field. Theimprovement of the telescope bafflingwill reduce at least the second case.The others depend primarily on the lightdiffusion by the optical surfaces. Ofcourse, the mirror polishing quality im-proved dramatically between the con-struction of the 3.6-m and the VLT, butthis benefit could be easily lost if thecleanliness of the mirror surface is notensured.
The baffling status of the 2.2-m, theNTT and the 3.6-m telescopes must beverified and recommendations will beissued.
4
Figure 4 shows thatthe image quality is,on severaloccasions, betterthan that measuredby the Dimm moni -tor. Local siteeffects and the mir -ror fans are mostlikely the reason forthe better seeingmeasured atEFOSC2 on theseoccasions. Imagequality can be asgood as 0.6 arcsecand ranges up to1.5 arcsec, with thecoma variation be -ing the main reasonfor the measuredspread in EFOSC2seeing quality.
Image Quality Improvement of the 2.2-mA. GILLIOTTE, ESO
Historical Overview
On the very first period of operationof the 2.2-m telescope, a direct CCDcamera was offered to the community.With a pixel size of 0.35 arcsec and asmall field of 3 arcmin, the telescopeimage quality was never reported asbeing bad or showing asymmetric, el-liptical images. In the mid-1990s, a new
imaging instrument called EFOSC2was installed at the telescope. Ob-servers soon began seeing variable im-age elongations across the full field,which were later identified as comingfrom the instrument and not the tele-scope. Meanwhile, the optical quality ofthe telescope was measured to be asgood as 0.35 arcsec d80% close tozenith, using our portable Shack-
Hartmann called Antares. The opticalquality of the EFOSC instrument wasstrongly dependent on the precisionwith which focus had been achieved,and subsequent variations with temper-ature. The EFOSC camera focus didnot include temperature compensationas was the case with EFOSC1 on the3.6-m. The focus degradation intro-duced field curvature and increasing
astigmatism as one moved off-axis.Optical quality tests with EFOSC afterrefocusing the camera and performinga careful thorough focus sequence re-established the instrument and tele-scope quality within the resolution de-livered by the two pixels sampling 0.7arcsec.
Image Quality Degradation
After the installation of the Wide-Field Imager (WFI), several observersreported bad, elongated images. Thedefect was identified as astigmatismwhich was found to increase for largeNorth and East telescope orientations.On several occasions, even observa-tions at zenith showed the same fea-tures. Only a telescope “shake-up”could remove the astigmatism, andeven then, only temporarily.
Optical tests were performed onseveral occasions with the new Cur-vature Sensing Method (CSM) andthese confirmed the astigmatism varia-tion for large zenithal distances. Earliertests only performed at zenith showedthe correct quality. Observations withdirect CCD and EFOSC2 in the pastwere not of sufficiently high spatialresolution to detect the problem.Therefore, the defect could have beenpresent all along since the early daysand gone unnoticed until the arrival ofthe WFI.
Optical Tests
The tests could not reproduce the de-fect at zenith. Therefore, it seems thatthere was some dependence on thehistory of telescope movements. As hadpreviously been done at the 3.6-m, theoptical tests were performed by systema-tically moving the telescope along thesame sequence each time. First, a blanksequence was followed to set the tele-scope properly, followed by South-North and East-West series. The CSMuses an ST8 SBIG CCD mounted on atranslation stage to obtain the two de-focused intra and extra focal images.Thirty-second exposures were per-formed to ensure that variations in theseeing were averaged out. This CCD isgood in terms of sampling, with 9 µmpixels and a correct linearity to restorethe beam intensity variance. The beamheterogeneity between both extrafocalimages is produced by the optical aber-rations.
The WFI image quality is very goodwhen correct focus is achieved. Thesmall difference in the filter opticalthickness must be properly compensat-ed by telescope focus offset. Te m-perature changes also introduce varia-tion in the telescope focus. For condi-tions of very good seeing, the focusmust be performed as carefully as pos-sible. The WFI pixel size is only 0.24arcsec, and with this, the sensitivity totelescope imaging defects is increased.
The astigmatism aberration was con-firmed during all optical tests. It is al-ways a challenge to identify the originof the astigmatism, but unfortunatelythis can take a long time. Any kind ofstress or buckling on the telescope mir-ror will trigger the first elastic deforma-tion mode, and this corresponds to theoptical astigmatism term.
From the outset, all supporting ele-ments of both mirrors should be sus-pected. A complete check of all fixedpoints as well as astatic levers (radialand axial) needs to be performed.Because astigmatism was almost sym-metric over such a large field, the aber-ration could not have been produced bya misalignment of the mirrors. In thiscase, the origin points more to how themirrors are held. The defect appears atlarge inclination and sometimes re-mains at zenith. In a first pass, the mainmirror support system should be stud-ied followed by the secondary mirror ifnothing is found.
Of course, the tests were conductedduring short test periods within longstretches of observing time. This meantthat it was mandatory to keep the tele-scope in a stable condition for the ob-servers; which means that the testscould only be done in small conserva-tive steps.
A Contribution from theInstrument Operation
An additional problem was discov-ered which almost certainly contributedto the early reports of image problems.In the early days, the focus offsets pro-duced by changes in temperature, wereonly applied to the nominal referencefilter, and not automatically correctedwhen a different filter was used. Forlarge focus offsets, the instrument wasshifted out of focus and this producedthe field astigmatism image elonga-
tions. This problem is now fixed. Notethat this “astigmatism” differs from thatcaused by elastic deformation of themirror. Field astigmatism varies withinthe field whereas the “stress” astigma-tism is constant. Of course, in somecases a combination of both effectscould have been present.
The Opto-MechanicalContribution
All the tests were performed with theparticipation of the mechanic team andlong, fruitful discussions took place withthe team members. A first check wasconducted on the lateral astatic padsafter dismounting the mirror cell fromthe telescope. The mirror is kept later-ally in position by a reference sphere incontact with the Cassegrain hole.Radial astatic levers maintain the mirrorlaterally by pushing or pulling, and noforce is applied when the mirror ishorizontal. All levers were found to bemoving freely without mechanicalstress. However, the reference spherewas found to be dirty on the northernside. The cause of this is thought to becleaning of the mirror when it is in-clined, allowing some of the CarbonDioxide snow to fall into the Cassegrainhole, taking dust from the mirror sur-face with it.
The design of the mirror cell includesthe facility to keep the mirror in a “park”position. In this case the mirror rests onthree supports without the control ofastatic levers. Three axial fixed pointsdefine the mirror orientation while themirror is supported over the astaticlevers under the control of pneumaticpressure. When the air pressure is re-moved, the mirror moves down byaround 2 mm and the three axial fixedpoints move down within a spring ten-sion device. The springs are used tokeep the fixed points in contact with the
5
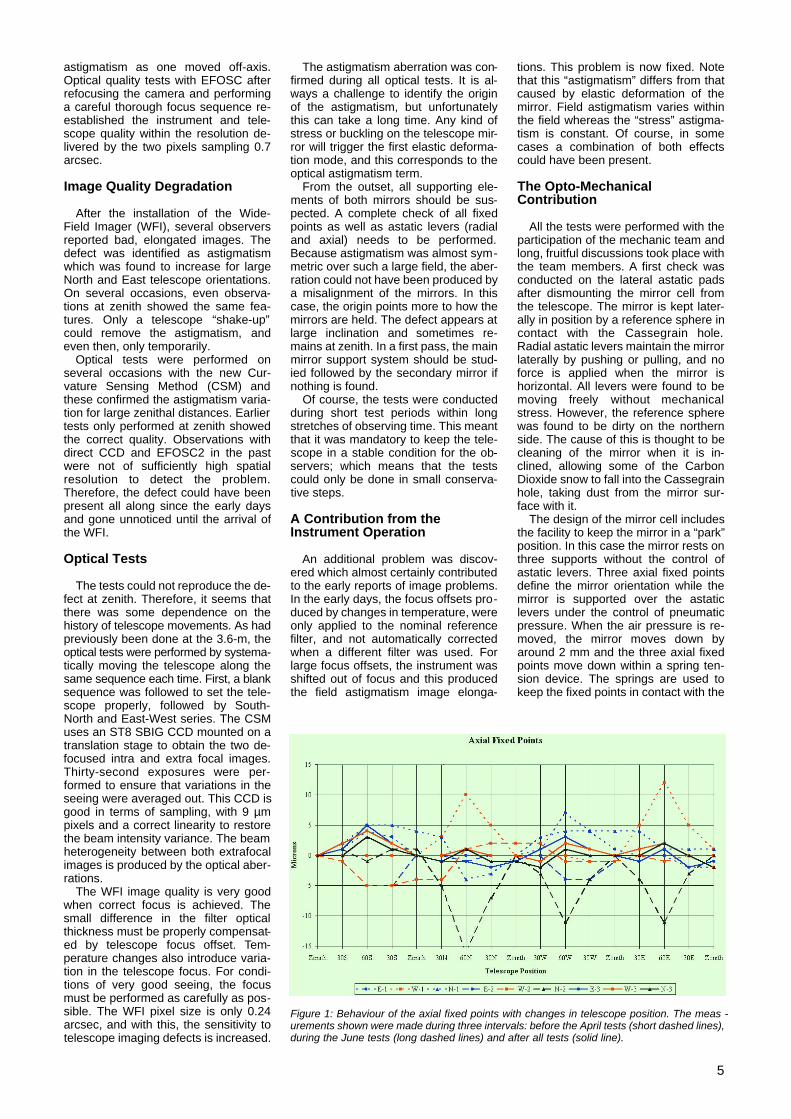
Figure 1: Behaviour of the axial fixed points with changes in telescope position. The meas -urements shown were made during three intervals: before the April tests (short dashed lines),during the June tests (long dashed lines) and after all tests (solid line).

reference position with the correct ap-plied force on zenith. The astatic leversare distributed around two rings. Twomanual air pressure controllers distrib-ute the pressure equally on all levers.Each unit delivers air pressure to onering only. At the beginning of the obser-vation, the telescope start-up operationincludes the air pressure distribution onthe mirror cell. The mirror raises untilthe mirror weight is in equilibrium withthe astatic levels, assuming the correctpositioning of the fixed points in contactwith their respective references. Due tothe lack of load cell, the force appliedon the mirror is not known (it is a non-active optics). Departure on force distri-bution cannot be verified directly. Theonly part allowing access to the mirrorposition check are the three axialpoints, where linear gauges have beeninstalled.
A Summary of the Tests
At each telescope position during themeasurement sequence, a check ofboth mirror position and the amount ofaberration was made.
April 2000 Period
During this test period, the behaviourof the western fixed point was not cor-rect for large inclinations towards thenorth and east. A correlation with an in-crease of astigmatism and triangularaberration terms was also identified.The three fixed points were checkedduring the re-aluminisation of the 2.2-mthat took place on April 20. Effectively,the west point was found to be tiltedwith improper mechanical contactwhich increased the force of thesprings. The effect was to raise the mir-
ror when the cosine astatic forces de-creased. Therefore, the pad pushingagainst the mirror introduced astig-matism and a small triangular defor-mation.
June 2000 Period
After a complete overhaul of thethree fixed points a new round of testswas performed. Now the northern fixedpoint showed a new pattern with aslight decrease of the applied force ininclined telescope positions. The springtension had to be increased to obtainthe correct force, both at zenith and atlarge inclination.
The last measurement of the axialfixed points showed the correct pat-tern, with a slight decrease for each in-clined position, due to the decrease inthe cosine component of the mirrorweight.
July 2000 Period
A new check of the aberrations in thetelescope was undertaken. The fixedpoints again showed the correct be-haviour for the sequence of measure-ments. However, the spherical aberra-tion term as well as those of the astig-matism increased “abnormally” at sometelescope positions.
Figure 1 shows the range of move-ment in the axial fixed points over thefull range of telescope position at differ-ent times. Figure 2 and 3 show the be-haviour of the astigmatism and the tri-angular aberration during the differenttest periods.
The thermal contribution
“Unforeseen” aberrations appearedin July, and only temporarily. They arerelated to local thermal activity that actsto produce a wavefront deformation. Inthis case, “thermal aberration” would bea more correct term to describe whattakes place. On this test night the coldtemperature of the outside air was pro-ducing large local effects.
This effect is a good demonstrationof the limitations that can exist in tele-scope imaging quality, not just frommisalignment of the telescope (withmirror deformation in an improper celldesign) but also from thermal convec-tion.
The thermal convection can be sep-arated in different components, suchas the dome/tube seeing, dome/slitseeing, mirror seeing and local pertur-bations produced by extra warmsources.
The thermal conditions of each testnight were different, with almost all ex-cept the last having the mirror colderthan ambient air (by between zero and2 degrees). Even so, the thermal ef-fects were still negligible compared tothe contribution of the axial fixed pointsto image degradation.
6
Figure 2: Variation of the astigmatism over the same range of telescope positions as Figure1. The large deviation of the astigmatism for the east and west part of the cycle is clearly vis -ible. Part of the last July sequence was not performed because of bad weather. The largervariations found during the last test night are due partially to a local thermal effect.
Figure 3: Variation of the triangular aberration over the same range of telescope positions.Again, the variations are large for the west and east part of the cycle before the April test.The thermal conditions of the last night (with a strong temperature decrease) produced a veryunfavourable local convection effect on the mirror edge, thereby affecting the wavefront.
On the last night, however, the mirrorwas warmer by 1.5 degrees, with a cor-responding degradation in the mirrorseeing. The outside air temperaturereached a low value of 4 degrees,
causing a larger gradient with the re-maining warmth of the telescope deltapads. Figure 4 clearly shows how thislocal effect is visible in the defocusedimages. The figure also shows the dis-
tortion of the defocused images due tolocal thermal perturbations.
Conclusion
Following the interventions per-formed up to and including July 2000,the telescope image quality remainsgood with several reports by observersas being very good. Under good exter-nal seeing conditions, it is possible toachieve sub-arcsec images, sometimeapproaching 0.5 arcsec. The imagequality achieved with the WFI is as ex-pected over a large part of the sky.Improvements could still be made tominimise the thermal contribution whencolder temperatures are experienced.The best method (which is already inuse on the 3.6-m and the NTT) wouldbe to ventilate the main mirror withhigh-flux fans. A reduction in the mirrorseeing, as well as local perturbations,could be achieved by blowing airacross the mirror, from north to south.
The installation of load cells on thethree axial fixed points will be also a for-ward step on the telescope improve-ment. The force delivered by each ofthe axial fixed points could be finetuned, to reach a new minimising of theresidual low astigmatism. The limit ofthe image quality will be then definedby the pixel size of the WFI.
Acknowledgements
We are grateful to the mechanicsteam for the discussions and participa-tion during all the steps of this study.The assistance of the Medium SizeTelescope Team, in allowing regulartest periods and operational help, wasalso essential to the success of the im-age quality improvement.
7
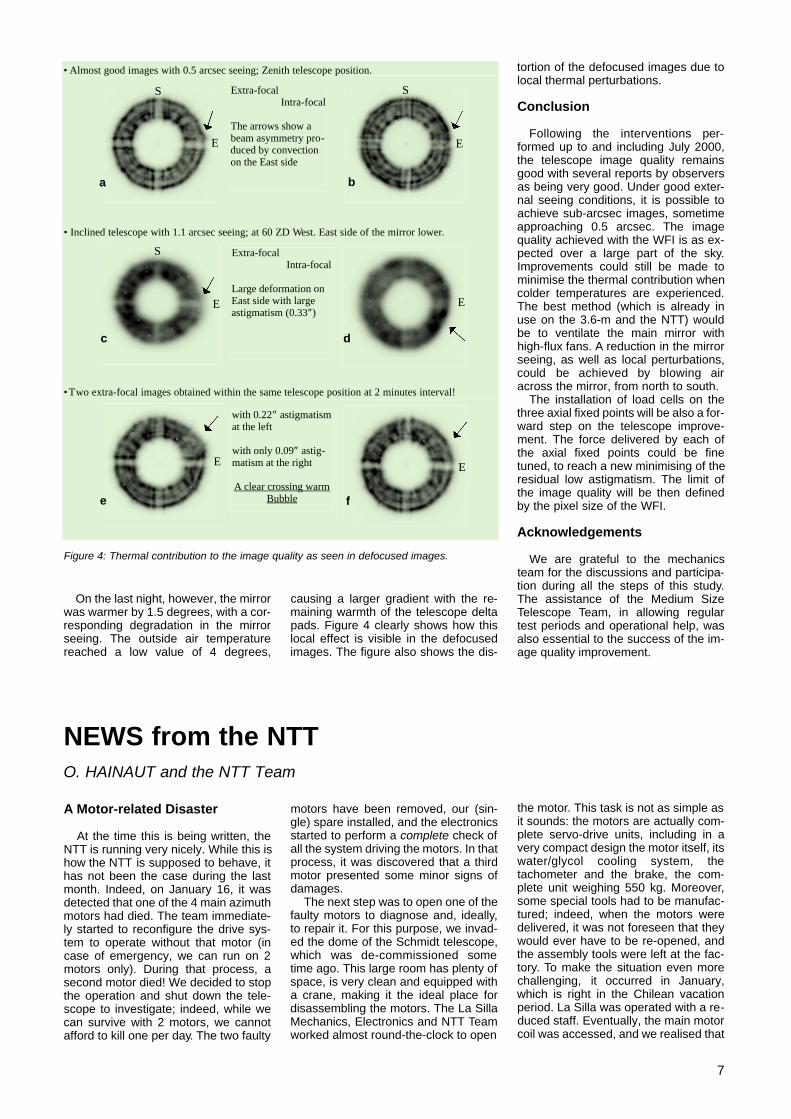
Figure 4: Thermal contribution to the image quality as seen in defocused images.
• Almost good images with 0.5 arcsec seeing; Zenith telescope position.
a b
c d
e f
S S
S
E E
E E
E E
• Inclined telescope with 1.1 arcsec seeing; at 60 ZD West. East side of the mirror lower.
•Two extra-focal images obtained within the same telescope position at 2 minutes interval!
Extra-focalIntra-focal
The arrows show abeam asymmetry pro-duced by convectionon the East side
Extra-focalIntra-focal
Large deformation onEast side with largeastigmatism (0.33″)
with 0.22″ astigmatismat the left
with only 0.09″ astig-matism at the right
A clear crossing warmBubble
NEWS from the NTTO. HAINAUT and the NTT Team
A Motor-related Disaster
At the time this is being written, theNTT is running very nicely. While this ishow the NTT is supposed to behave, ithas not been the case during the lastmonth. Indeed, on January 16, it wasdetected that one of the 4 main azimuthmotors had died. The team immediate-ly started to reconfigure the drive sys-tem to operate without that motor (incase of emergency, we can run on 2motors only). During that process, asecond motor died! We decided to stopthe operation and shut down the tele-scope to investigate; indeed, while wecan survive with 2 motors, we cannotafford to kill one per day. The two faulty
motors have been removed, our (sin-gle) spare installed, and the electronicsstarted to perform a complete check ofall the system driving the motors. In thatprocess, it was discovered that a thirdmotor presented some minor signs ofdamages.
The next step was to open one of thefaulty motors to diagnose and, ideally,to repair it. For this purpose, we invad-ed the dome of the Schmidt telescope,which was de-commissioned sometime ago. This large room has plenty ofspace, is very clean and equipped witha crane, making it the ideal place fordisassembling the motors. The La SillaMechanics, Electronics and NTT Teamworked almost round-the-clock to open
the motor. This task is not as simple asit sounds: the motors are actually com-plete servo-drive units, including in avery compact design the motor itself, itswater/glycol cooling system, thetachometer and the brake, the com-plete unit weighing 550 kg. Moreover,some special tools had to be manufac-tured; indeed, when the motors weredelivered, it was not foreseen that theywould ever have to be re-opened, andthe assembly tools were left at the fac-tory. To make the situation even morechallenging, it occurred in January,which is right in the Chilean vacationperiod. La Silla was operated with a re-duced staff. Eventually, the main motorcoil was accessed, and we realised that

it was severely damaged: water hadleaked on that coil over a long period oftime, slowly building up a mixture of sul-fate and carbon that eventually short-circuited the coil with its steel chassis.Unfortunately, even after cleaning thisgunk out and restoring the connectors,the coils were still short-circuited, indi-cating some internal damages thatcould not be repaired on the spot. Aswe still had a motor missing for normaloperation, we decided to open thespare altitude motor; while the mechan-ic parts are different, the coils are simi-lar. The team, becoming expert in dis-assembling these motors, removed thecoil from the altitude motor and placedit in the body of the azimuth motor in 24hours only. The final rush was to re-as-semble the azimuth motor and test it. Iwon’t go into details in describing theatmosphere in the Schmidt dome whenthe motor started to spin; enough saidthat the satisfaction was palpable. Themechanics immediately re-installed therepaired motor in the telescope and ad-justed it (a task that lasted till the earlyhours of the next day), so that the NTTelectronics could immediately start theadjustments and tests. The followingnight, we were on the sky for a quick,but thorough test and commissioning ofthe new system. The NTT was back tolife, after 12 nights lost for observa-tions. This was the longest down-timeever for the NTT.
The cause of the short-circuit wasobviously water. The main question isthen to know where this water camefrom. The presence of glycol indicatesthat it was from a leak of the coolingsystem, not from condensation. The O-rings sealing the cooling pipes werefound in perfect condition, so it seemsthey are not at the origin of the leak. A
careful examination of the upper part ofthe motor chassis revealed little specksof oxidation right were the cooling tubesare located, so we suspect that the wa-ter diffused through micro-porosity ofthe steel. The next step is now to main-tain and repair the remaining motors,and to fix them so that this problemdoes not repeat itself in the future.
By re-arranging the schedule and us-ing a 4-night technical run combinedwith a 2-night service observing run, wecould perform the priority observationsof all but one of the observation runsthat had been lost.
Instruments
Since the previous report from theNTT, SOFI still had a few hick-ups re-lated to its cryo-mechanics. T h ewheels, which suffer from the sameproblems as ISAAC on the VLT, willeventually be replaced by equivalentones made of different material, hope-fully solving the problem in a definitiveway. In the mean time, the instrumentcontrol software has been modified toavoid the problem.
Asymmetric spectral lines have beenreported by some of our observers us-ing EMMI in Blue Medium Dispersionmode. This was tracked to a misalign-ment of the blue arm that has been cor-rected: the BLMD mode now providesperfectly symmetric lines. We still haveto re-align the instrument for thedichroic mode. At the same time, thecalibration of the long-slit unit used inmedium dispersion spectroscopy hasbeen checked and found quite accu-rate.
SUSI2’s detector head has been re-placed by a new model that will notcause any contamination of the chips, aproblem that plagued SUSI2’s earlydays. The detectors themselves havebeen baked and cleaned, and SUSI2 isnow as good as new.
Improvements
In addition to the upgrade of the con-trol system to the 2000 release of theVLT software (which is extremely stableand reliable), new workstations havebeen installed. Visitors will appreciatethe power of the HP Visualise B2000and J2240 that are put at their dis-posal.
8
Figure 1: Dead motor in the Schmidt dome, ready for disassembly.
Figure 2: The faulty coil removed from the motor; the brush on the right gives the scale of this60 kg piece.

the hot air cellsthat could formover the mirror.This strongly con-tributes to im-prove the imagequality when thereis no wind. T h ebaffle of the sec-ondary mirror hasbeen changed fora l i g h t - w e i g h t,Kevlar and Car-bon fibre structurethat is opticallyequivalent to theformer baffle, but
whose upper part is completely trans-parent to the wind. This provides anair-flow over the secondary mirror, and
We also installed a set of high-speedfans around the main mirror, to producea constant artificial wind which disrupts
Figure 3: Final moments of the re-assembly of themotor.
avoids the formation of a hot-air bub-ble that would introduce some aber-rations. Another article in this issue ofThe Messenger describes these im-provements and their results in moredetails.
Staff
Since our last report, Ismo Kastinenand Hernan Nuñez (Telescope andInstrument Operators) have left theteam; Ismo is now a Software Engineerat La Silla, and Hernan a TIO at theVLT. Gabriel Martin (TIO) is about toleave the NTT to works at the MagellanObservatory on Las Campanas asInstrument Specialist. Monica Castilloand Duncan Castex have joined theTeam as TIO. There are also manychanges in the astronomical staff :Vanessa Doublier (fellow) has left theTeam, and Stephane Brillant (fellow) iscurrently on his last shift at the NTT;both of them have been hired as staffastronomers at the VLT. Obviously, theNTT is an excellent training camp forParanal! Malvina Billeres and MeriemeChadid have joined the NTT Team asfellows.
9
2p2 Team NewsH. JONES
Personnel Movements
In December we welcomed EmanuelGalliano to our team. Emanuel is aFrench student at ESO Chile who is al-ready familiar with La Silla, through hisprevious work with the DENIS group.He will be working primarily on opera-tions at the 2.2-m.
In February, however, we badefarewell to Emanuela Pompei afternearly two years with the team.Although Emanuela is leaving La Silla,she will remain with ESO in Chile, com-mencing work as a Staff Astronomer onParanal in March. We wish her all thebest in her move north.
P2PP and BOB Now on the 2.2-m
In December, the final commission-ing phase of the new operating soft-ware at the 2.2-m took place. Thismeans that Wide Field Imager (WFI)observing programmes at the 2.2-mtelescope are now performed usingVLT Observing Software, with all point-ing and exposure acquisitions con-trolled through Observation Blocks(OBs).
If you have upcoming Service Modeobservations, then you will be contact-ed directly about the creation of OBs as
part of the Phase-2 preparations foryour programme.
If you have an upcoming Vi s i t o rMode WFI run, then you will needto familiarise yourself with the P2PPsoftware. Specifically, you should knowhow to create and edit OBs in thisenvironment, as this is what is used atthe telescope. You should also beaware of the different types of WFI-spe-cific templates available to build OBs,and plan your observations according-ly. Whether or not you choose to pre-pare your OBs in advance of coming toobserve is up to you. If you alreadyhave experience with P2PP, you maywish to install the software at yourhome institute and create your OBsahead of time. Otherwise it is better ifyou can create your OBs on the moun-tain. In this case, it is highly desirablethat you arrive the day before your firstnight if this is at all possible. Allowingample time for preparation plays a ma-jor part in the efficiency of the observ-ing run.
Further information can be found atour 2.2-m P2PP/BOB web page, ath t t p : / / w w w. l s . e s o . o r g / l a s i l l a / Te l e s c o p e s /2p2T/E2p2M/WFI/P2PP_BOB/ . It con-tains links to the P2PPHome Page andthe new WFI Templates Manual, whichdescribes observing templates avail-able for OB creation. The page also hasinstructions for installing and runningthe software at your home institute, in-cluding use of the WFI InstrumentPackage. As always, questions or com-ments can be directed to the 2p2 Teamat any time ([email protected]).
New CCD on the Danish 1.54-m
A new CCD was commissioned atthe Danish 1.54-m in September by ateam from the Copenhagen UniversityObservatory. The new EEV/MAT CCD(2048 × 4096 pixels) replaces the oldLoral 2048 × 2048 detector to bringabout improvements on two fronts.First, the new device does not sufferfrom the same charge diffusion prob-lem as the old CCD. This problem wasthought to have been responsible forthe consistently poorer seeing meas-ured at this telescope compared toothers. Second, the EEV CCD hashalf the read-out noise (3 e– rms) ofthe old device, and a much larger full-well.
However, the optics of DFOSC donot allow the full area of this largeformat device to be used. The regionused suffers from some defects suchas bad columns and charge traps,in a similar way to the Loral chip. Thequantum efficiency of the EEV de-vice is slightly less, peaking around 450nm and declining steadily to the red.The parallel charge transfer efficiencyshows no losses although there is asmall but non-negligible loss in the se-rial direction due to trap in the serialregister.
A full report on the characteristics ofthe device (by Anton Norup Sorensenof the Copenhagen University Obser-vatory), is available from the 2p2 TeamWeb Page at h t t p : / / w w w. l s . e s o . o r g /l a s i l l a / Te l e s c o p e s / 2 p 2 T / D 1 p 5 M / m i s c /ringo.ps .
Introduction
Traditionally, astronomy has reliedupon filters with a fixed bandpass to se-lect the wavelengths of the light allowedto reach the detector, thus allowing theastronomer to derive some colour infor-mation about the objects under study.In the optical, these filters are most of-ten classical broadband UBVRI, or nar-row passbands centred at the wave-lengths of the common emission-linefeatures, either at rest-frame or red-shifted wavelengths.
Examples of the latter are becomingnumerous, especially on the 8–10-m-class telescopes that make it possibleto detect very faint, distant emission-line objects, even through narrow pass-bands. In this vein, Kurk et al. (2000)used FORS1 at the VLT with a 65-Å-wide filter at 3814 Å to image a z = 2.2radio galaxy, searching for nearby Ly-alpha detections at the same redshift.They detected around 50 such objects,collectively suggestive of strong clus-tering around the dominant radiogalaxy. Moreover, they also found ex-tended Ly-alpha emission (~ 100 kpc inextent) centred on the galaxy, addingfurther evidence to the possible sce-nario of protocluster formation.
Steidel et al. (2000) used an 80-Å-wide filter on Keck to search for Ly-alpha emitters at z = 3.09, the redshiftof a prominent peak in the redshift dis-tribution of their original sample ofbroad-band selected Ly m a n - b r e a kgalaxies. This took the number ofgalaxies associated with the peak from24 to 162, a gain of almost a factor of 7,thereby demonstrating the power ofnarrow-band observations in the de-tailed mapping of large-scale structuresat high redshift. They also found ex-tended (~ 100 kpc) Ly-alpha emitting“blobs’’, that again may point to in-cipient cluster formation at these red-shifts.
Kudritzki et al. (2000) used FORS1at the VLT for the spectroscopic follow-up to a sample of emission-line objects,identified by narrow-band imaging inthe field of the Virgo cluster. The ex-pectation was to confirm them as intra-cluster planetary nebulae, given theirdetection with a [OII] (lambda = 5007 Å)filter. As it turned out, however, the nar-row passband was equally good at re-vealing Ly-alpha-emitting objects at z ~3.1, and nine were found.
In some of the above examples, a fil-ter with the desired passband luckilymatched the project requirements; inothers, one had to be designed with aspecific target in mind. However, stud-ies of this kind (as well as many othersin the local universe), would clearlybenefit given the use of a passbandthat can be easily tuned both in its widthand central wavelength, over the fulloptical range. The use of (Wide-band)Tunable Filter (WTF) instruments at theAnglo-Australian and William HerschelTelescopes (Bland-Hawthorn & Jones1998a,b) in the past five years has in-deed seen a very broad range of astro-physical applications. At low redshifts,science undertaken with these instru-ments includes studies of brown dwarfatmospheric variability (Tinney & Tolley1999), and the identification of opticalcounterparts to Galactic X-ray sources(Deutsch, Margon & Bland-Hawthorn1998). High-redshift science has in-cluded estimates of the cosmic star-formation history (Jones & Bland-Hawthorn 2001), identification of galaxyclustering around high-redshift QSOs(Baker et al. 2001), deep imaging of jet-cloud interactions in powerful radiogalaxies (Tadhunter et al. 2000), andthe detection of a large ionised nebulaaround a nearby QSO (Shopbell et al.2000). Figure 1 shows a section of fieldfrom a tunable filter survey on theAnglo-Australian Telescope (Jones &Bland-Hawthorn 2001), for distant
emission-line galaxies. Figure 2 showsexample scans and scanning narrow-band “spectra” obtained with the tun-able filter for some of the same objects.
Understandably, there is growing in-terest in the role that tunable filters canplay in the instruments currently underdesign and construction for the newgeneration of large telescopes. Theseinclude tunable filters in instruments forthe GranTeCan (OSIRIS: Cepa et al.2000) and SOAR telescopes (Cecil2000), among others under considera-tion. The technique is all the more pow-erful when the focal reducing instru-ments in which they are placed havethe capability for both tunable imagingand multi-object spectroscopy, sincethe two modes are complementary. Inthis article we review tunable imagingand the future role it could potentiallyplay at the VLT. We also briefly mentionthe wide range of science, bothGalactic and extragalactic, that couldbe undertaken with a tunable filter onan 8-m-class telescope.
Making a Filter Tunable
There are many ways of making a fil-ter with tuning capability, and conse-quently, many types of tunable filter.These include those using birefringentmaterials (such as the Lyot, Solc andacousto-optic tunable filters), more tra-ditional interferometers such as theMichelson and Fabry-Perot, and evenliquid crystal tunable filters. We will notdescribe details of each technologyhere, but instead refer the interestedreader to Bland-Hawthorn (2000), whodiscusses the merits of each for tunableimaging. While all have advantagesand limitations, in the end it is the strin-gent demands of night-time astronomythat dictate which are feasible. For as-tronomical applications, the ideal filtershould have high peak transmission, abroad (rectangular) profile, and shouldbe large enough to admit a generousbeam size. It should also be of goodimaging quality, produce a stable andreproducible passband, and cover alarge range of wavelengths, to namejust the major requirements.
Of all the possibilities, it is the Fabry-Perot interferometer that has been thepopular choice of astronomers forthree-dimensional spectral imaging.This is because they are readily avail-able on a commercial basis and makeuse of well-established technology.Astronomical applications of these in-struments have included studies of ex-tended diffuse nebulae (e.g. Haffner,Reynolds & Tufte 1999) and obtaining
10
Tunable Filters and Large TelescopesH. JONES (ESO Chile), A. RENZINI (ESO Garching), P. ROSATI (ESO Garching) andW. SEIFERT (Landessternwarte, Heidelberg)
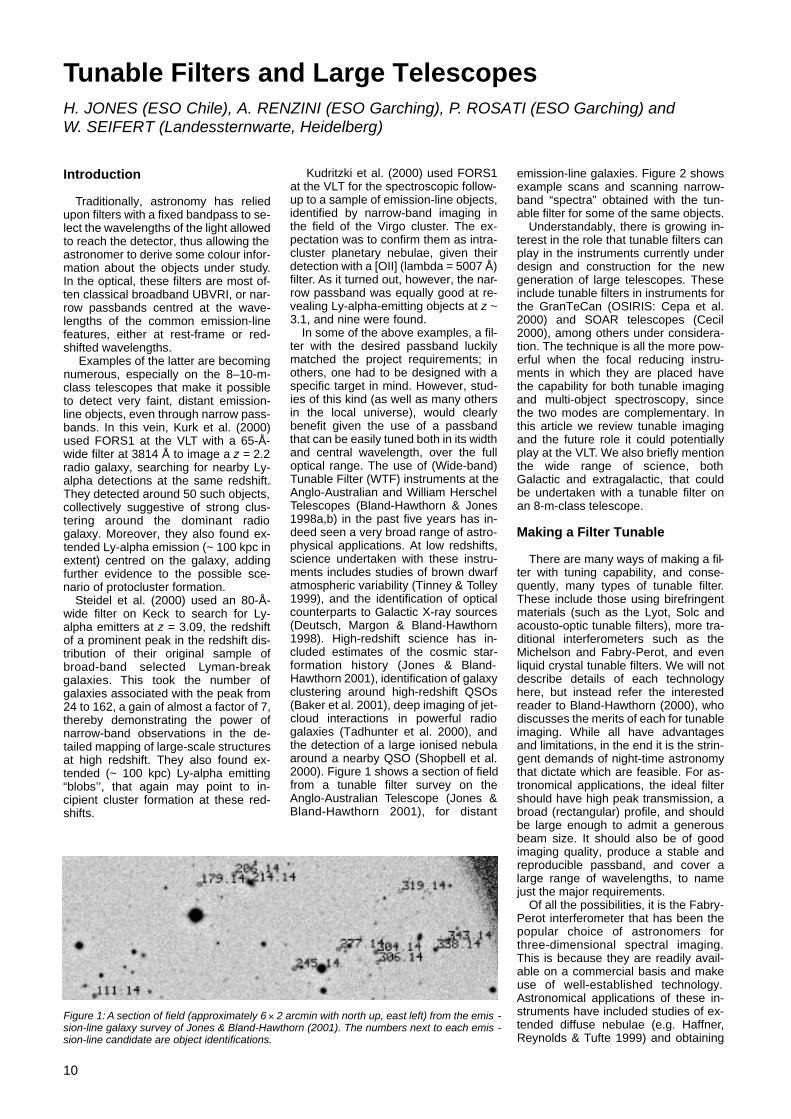
Figure 1: A section of field (approximately 6 2 arcmin with north up, east left) from the emis -sion-line galaxy survey of Jones & Bland-Hawthorn (2001). The numbers next to each emis -sion-line candidate are object identifications.

kinematic information (such as linewidths and radial velocities) on nearbydisk galaxies (e.g. Amram and Östlin inthis issue, p. 31; Laval et al. 1987; Cecil1989; Veilleux, Bland-Hawthorn & Cecil1997; Shopbell & Bland-Hawthorn1998). The Fabry-Perot systems em-ployed have traditionally used narrowwavelength coverage and high spectralresolutions (resolving powers R 1500).
There are two problems to be over-come in the adaptation of a Fabry-Perotinterferometer to tunable imaging. First,it must work at sufficiently low spec-tral resolution (in other words, narrowplate spacing) that scanning in spec-tral steps over larger ranges of wave-length is feasible. Second, the filtercoatings must be optimised over alarge range of wavelengths. Tradition-ally, Fabry-Perots have had neither thewavelength coverage nor the ability towork at such small plate spacing.
Fabry-Perot Tunable Filters
It is a little more than one hundredyears since Charles Fabry and AlfredPerot first highlighted the potential of aninterference device producing fringesfrom two parallel silvered plates (Perot& Fabry 1899; Fabry & Perot 1901).Modern Fabry-Perot interferometersconsist of two parallel glass plates helda small distance apart, such that con-structive interference of light betweenthe plates causes only specific wave-lengths to be transmitted. However,with typical plate spacings in the range20 to 500 microns, Fabry-Perots for as-tronomical work have been confined tohigh orders of interference (50 to 2000),thereby giving rise to the high resolvingpowers mentioned earlier.
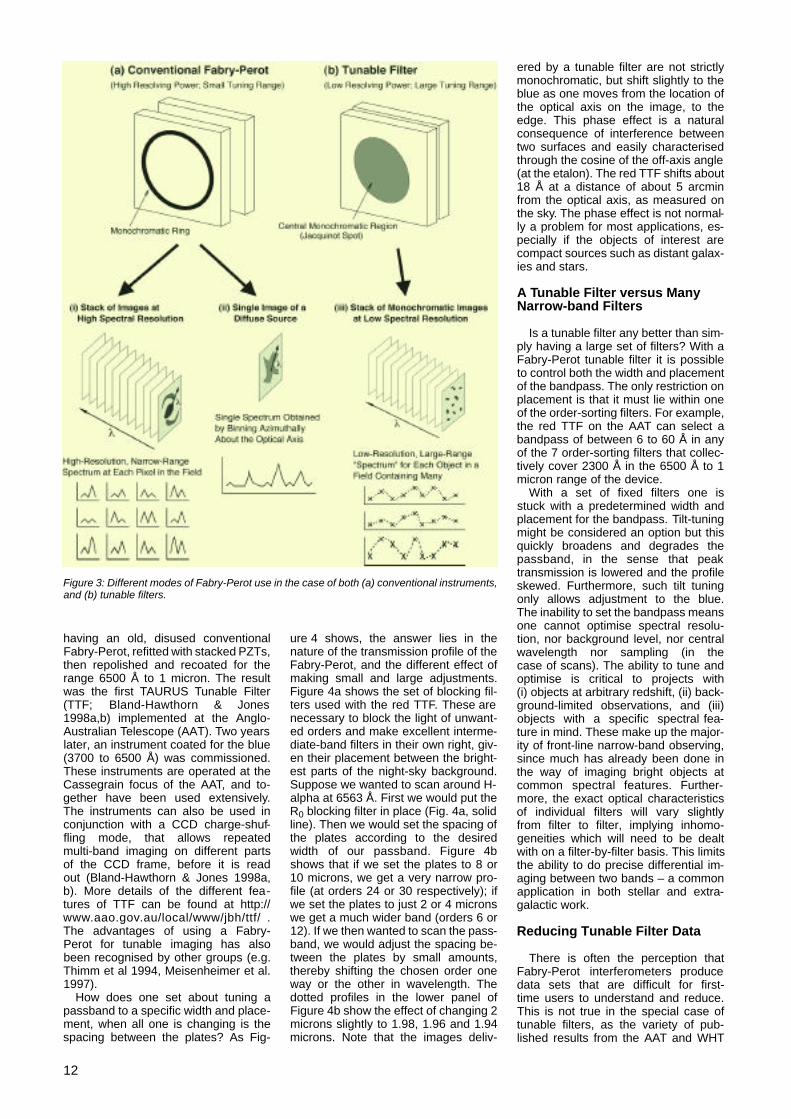
Tunable filters differ from convention-al Fabry-Perot devices in two novel butimportant ways. First, the plates are op-erated at much smaller plate spacingsthan the Fabry-Perot instruments so farused for astronomy. The effect of this isto widen the central interference regionof the chosen wavelength. A conven-tional Fabry-Perot, with a plate spacingof many tens or even hundreds of mi-crons, presents an interference regionas a narrow ring on the sky, with verysmall area (Fig. 3a). A tunable filter,with a plate spacing of no more than afew microns, aims to provide a broad-ened central interference region,known as the Jacquinot spot (Fig. 3b).The latter is more useful for surveywork, where one seeks a commonwavelength transmitted across the fullfield and where lower spectral resolu-tions are desired.
The second way in which a tunablefilter differs from a conventional Fabry-Perot is in its ability to access a muchwider range of plate spacings. Con-ventional devices are most commonlyused to scan through a relatively smallrange of wavelengths around a singlespectral feature. However, a tunable fil-
ter, aiming to access as broad a tunablerange as is possible, needs to access amuch wider range of plate settings.This is made possible by having a stackof piezo-electric transducers (PZTs) tocontrol plate spacing, instead of theusual single-layer. These structural dif -ferences between a tunable filter and aconventional Fabry-Perot contribute tothe different types of data that are ob-tained with each instrument:
(i) conventional Fabry-Perots can beused to obtain a high-resolution nar-row-range spectrum at each pixel posi-tion over a wide field (Fig. 3i),
(ii) conventional Fabry-Perots canalso be used to obtain a single spec-trum of a diffuse source which fills alarge fraction of the aperture (from one
or more deep frames at the sameetalon spacing, Fig 3ii), and,
(iii) tunable filters can obtain a se-quence of monochromatic images with-in a field defined by the Jacquinot spot,(Fig. 3iii).
Atherton & Reay (1981) were the firstto suggest the possibilities of a Fabry-Perot as a tunable imager. However,the technology available at the timewas not sufficient for precise control ofthe plates over a such wide range ofspacings, and suitable coatings werenot very good by the standards of today(see Pietraszewski 2000 for descrip-tions of the current state of the art inFabry-Perot technology). In the mid-1990s, J. Bland-Hawthorn (AAO) re-visited the tunable filter concept by
11
Figure 2: (Top) Individual object scans for some of the same candidates as in Figure 1.Individual images are 9 arcsec on a side with north at top, east to the left. Circles denote aper -ture size. (Bottom) Spectral flux measurement for the same galaxies. Both preliminary (dotted line) andfinal (solid line) continuum fits are shown. Numbers shown on the right are flux ( 10–16
ergs/s/cm2, a star-galaxy classification parameter and deviation of the line detection in sig -ma. Deviant points (excluded from the final continuum fit) are indicated by circles. The zeroflux level is shown by the horizontal tickmarks (where present) and non-detections are rep -resented on this level by crosses. Galaxy 214.14 has independently been found to haveemission in [OII] by Ellis et al. (1996); the emission we see here is H-alpha and [NII].
having an old, disused conventionalFabry-Perot, refitted with stacked PZTs,then repolished and recoated for therange 6500 Å to 1 micron. The resultwas the first TAURUS Tunable Filter(TTF; Bland-Hawthorn & Jones1998a,b) implemented at the Anglo-Australian Telescope (AAT). Two yearslater, an instrument coated for the blue(3700 to 6500 Å) was commissioned.These instruments are operated at theCassegrain focus of the AAT, and to-gether have been used extensively.The instruments can also be used inconjunction with a CCD charge-shuf-fling mode, that allows repeatedmulti-band imaging on different partsof the CCD frame, before it is readout (Bland-Hawthorn & Jones 1998a,b). More details of the different fea-tures of TTF can be found at http://w w w. a a o . g o v. a u / l o c a l / w w w / j b h / t t f / .The advantages of using a Fabry-Perot for tunable imaging has alsobeen recognised by other groups (e.g.Thimm et al 1994, Meisenheimer et al.1997).
How does one set about tuning apassband to a specific width and place-ment, when all one is changing is thespacing between the plates? As Fig-
ure 4 shows, the answer lies in thenature of the transmission profile of theFabry-Perot, and the different effect ofmaking small and large adjustments.Figure 4a shows the set of blocking fil-ters used with the red TTF. These arenecessary to block the light of unwant-ed orders and make excellent interme-diate-band filters in their own right, giv-en their placement between the bright-est parts of the night-sky background.Suppose we wanted to scan around H-alpha at 6563 Å. First we would put theR0 blocking filter in place (Fig. 4a, solidline). Then we would set the spacing ofthe plates according to the desiredwidth of our passband. Figure 4bshows that if we set the plates to 8 or10 microns, we get a very narrow pro-file (at orders 24 or 30 respectively); ifwe set the plates to just 2 or 4 micronswe get a much wider band (orders 6 or12). If we then wanted to scan the pass-band, we would adjust the spacing be-tween the plates by small amounts,thereby shifting the chosen order oneway or the other in wavelength. Thedotted profiles in the lower panel ofFigure 4b show the effect of changing 2microns slightly to 1.98, 1.96 and 1.94microns. Note that the images deliv-
ered by a tunable filter are not strictlymonochromatic, but shift slightly to theblue as one moves from the location ofthe optical axis on the image, to theedge. This phase effect is a naturalconsequence of interference betweentwo surfaces and easily characterisedthrough the cosine of the off-axis angle(at the etalon). The red TTF shifts about18 Å at a distance of about 5 arcminfrom the optical axis, as measured onthe sky. The phase effect is not normal-ly a problem for most applications, es-pecially if the objects of interest arecompact sources such as distant galax-ies and stars.
A Tunable Filter versus ManyNarrow-band Filters
Is a tunable filter any better than sim-ply having a large set of filters? With aFabry-Perot tunable filter it is possibleto control both the width and placementof the bandpass. The only restriction onplacement is that it must lie within oneof the order-sorting filters. For example,the red TTF on the AAT can select abandpass of between 6 to 60 Å in anyof the 7 order-sorting filters that collec-tively cover 2300 Å in the 6500 Å to 1micron range of the device.
With a set of fixed filters one isstuck with a predetermined width andplacement for the bandpass. Tilt-tuningmight be considered an option but thisquickly broadens and degrades thepassband, in the sense that peaktransmission is lowered and the profileskewed. Furthermore, such tilt tuningonly allows adjustment to the blue.The inability to set the bandpass meansone cannot optimise spectral resolu-tion, nor background level, nor centralwavelength nor sampling (in thecase of scans). The ability to tune andoptimise is critical to projects with(i) objects at arbitrary redshift, (ii) back-ground-limited observations, and (iii)objects with a specific spectral fea-ture in mind. These make up the major-ity of front-line narrow-band observing,since much has already been done inthe way of imaging bright objects atcommon spectral features. Further-more, the exact optical characteristicsof individual filters will vary slightlyfrom filter to filter, implying inhomo-geneities which will need to be dealtwith on a filter-by-filter basis. This limitsthe ability to do precise differential im-aging between two bands – a commonapplication in both stellar and extra-galactic work.
Reducing Tunable Filter Data
There is often the perception thatFabry-Perot interferometers producedata sets that are difficult for first-time users to understand and reduce.This is not true in the special case oftunable filters, as the variety of pub-lished results from the AAT and WHT
12
Figure 3: Different modes of Fabry-Perot use in the case of both (a) conventional instruments,and (b) tunable filters.

show. Conventional Fabry-Perots workat much higher resolving powers andso when they are used to map kine-matics in nearby galaxies, it requiresprecise mapping of the wavelengthchange across the field, so that a 3D-spectral cube can be constructed andsubsequently transformed into a 2Dmap of velocities. However, tunablefilter data are typically concerned onlywith scanning surveys of small point-like sources such as stars or distantgalaxies. This requires nothing morethan the detection, matching and pho-tometry of each object on each frame –routine steps in any imaging survey,with or without a tunable filter. Thereis still a change in wavelength acrossthe field of the tunable filter, but thelower resolving power makes this aless dramatic effect in terms of thebroader width of the transmitting band-pass.
Tunable filter data from the AAT havebeen reduced with scripts utilising boththe FOCAS (Valdes 1993) and SEx-tractor (Bertin & Arnouts 1996) pack-ages for the object detection. One of us(Jones) has written a collection of IRAF
tasks (TFred) offering a range of toolsto treat tunable filter data in IRAF. Amore comprehensive treatment is givenin Jones, Shopbell & Bland-Hawthorn(2001), where approaches to the re-duction of Fabry-Perot tunable filterphotometry are described.
Tunable Filters and the VLT
There is currently no tunable filtercapability on the VLT, and (in the short-term at least), neither on 8–10-m-classtelescopes elsewhere. It is thereforeworthwhile to contemplate if and how itmight be possible to implement a tun-able filter at the VLT. While a detailedtechnical, cost and manpower study re-mains to be done, we have investigat-ed the main parameters of a possibleincorporation of a tunable filter into theFORS2 focal reducer.
The largest commercially availabletunable filter which could be fitted intoeither of the FORS instruments has afree aperture of 116 mm. The mechan-ical size of such a unit (sealed to min-imise thermal/environmental influ-ences) is 200 mm in diameter and
about 135 mm in height (as measuredalong the optical axis). This spacecould be accommodated in the colli-mated beam of FORS2 if the upper ofthe two grism wheels were dismounted.Nevertheless, the full spectroscopic ca-pability of FORS2 is preserved, albeitwith more frequent grism exchanges.The FORS2 echelle mode would belost, although it would be possible to re-install the corresponding grisms inFORS1. Most importantly, no majormechanical hardware modificationswould be necessary to effect the im-plementation. The control electronicsneeded to operate the tunable filter aredelivered by industry. However, to allowfor efficient use of the filter by the ob-server, a full integration into the GUI ofthe instrument would be needed.
As the free aperture of the tunable fil-ters is slightly smaller than that neededto cover the full FORS field of view, a vi-gnetting of 7.5 % occurs at the cornersof the detector, preserving an unvi-gnetted central field of 4.8 arcmin di-ameter. The blue shift of the filter trans-mission at the edge of the unvignettedfield is only a fraction of the transmis-
13
Figure 4: (a) Wavelength regioncovered by the red TTFat the AAT, showing thelocation of the interme -diate blocking filterswith respect to bands ofOH night-sky emission. (b) Transmission profileof the tunable filter plot -ted on the same scale,as a function of chang -ing plate separation(left). Even-numberedorders are indicated.The dotted lines in thelower panel show theeffect of changing theplate spacing to 1.98,1.96 and 1.94 µm.
sion profile width and therefore not aproblem for most applications. For thelowest resolution, ordinary broad-bandfilters could be used as blocking filters.Additional filters needed to work athigher orders could be placed in thetwo interference filter wheels in front ofthe detector. The optimum passbandfor such filters is slightly less than thefree spectral range at the highest re-solving powers envisaged for use.
The useful wavelength range of thetunable filter is largely arbitrary butneeds to be decided at the time of man-ufacture, as it is governed by the design(and resulting performance) of theetalon coating. For example, the twotunable filters in use at the AAT individ-ually cover 3700–6500 Å and 6500 Å–1micron. With a device in FORS, spec-tral resolutions achievable at 370 nmfor example, would range from 330 to1350, while at 650 nm would encom-pass 180 to 720. Such resolutions as-sume a variation of the spacing be-tween the etalon plates from 2 to 8 mi-cron, which can be achieved throughstacked piezo-electric transducers. Thetunable filter has a high efficiency com-parable or even superior to commonnarrow-band filters.
The approach of using FORS2 to fur-nish the VLT with a tunable filter carriesboth pros and cons. On the one handthere is the relatively small effort com-pared to that of building an entirely newinstrument, and the extension of thescientific uses of FORS2 following thecommencement of VIMOS. On the oth-er there is the need to remove one ofthe grism wheels to make the space.Eliminating one grism wheel will makefor increased manual intervention in theexchange of grisms if one wants to pre-serve all the filter/grism combinationspresently available. Clearly, the relativeweight of these different argumentsneeds to be evaluated before decidinghow to proceed.
Potential Science on 8-m-classTelescopes
Scientific applications of a tunablefilter at an 8-m telescope span an ex-tremely wide range, potentially satisfy-ing the needs of what is a very diverseuser community. Several such applica-tions were described at the beginningof this article. Here, we mention a fewmore possibilities. At the high limit ofspectral resolution (R ~ 1500) it may bepossible to probe the internal dynamicsof most kinds of emission-line nebulaeand relatively nearby galaxies, alongwith that of QSO and radio galaxy envi-ronments. At lower resolutions (R ~150), most (but not all) applications willconcern the distant universe. For ex-ample, high-redshift clusters of galax-ies are usually found either in deep X-ray or infrared surveys, with cluster
members being identified relativelyeasily through association with the ‘redsequence’ of passively evolving ellipti-cals. With such methods, however, spi-rals and star-forming galaxies that mayalso be cluster members are muchmore difficult to identify, given theirbroad range of colours, which cansometimes act to make them indistin-guishable from foreground or back-ground galaxies. However, tuning thetunable filter to a suitable emissionline at the cluster redshift easily per-mits identification of these late-typegalaxies.
Mapping the large-scale structure outto z ~ 5 is one of the main goals withinreach of the current generation of largetelescopes and their instruments. Thepilot experiment by Steidel et al. (2000)clearly demonstrates the advantages ofnarrow-band detection for this kind ofwork. Indeed, tuning the filter to theredshift peaks found through futureLyman-break galaxy surveys will ex-pand the number of galaxies associat-ed with these large-scale featuresmany times over. Multi-object spec-troscopy will further complement this,by determining the dynamics of sheets,filaments, and proto-clusters.
As the new VLT instrument VIMOScomes into operation, it becomes nec-essary to re-assess the role of the twoFORS instruments, since the formerwill outperfom the FORSes in many oftheir current applications. An upgradeplan for the two FORS instruments istherefore under study at ESO, includingthe red-optimisation of the CCDs onFORS2, which is planned for later in they e a r. Installing a tunable filter onFORS2 is another possibility for con-sideration, and in this article wehave illustrated some of the scientificadvantages and a possible technicalimplementation. The VLT also currentlylacks an efficient UV imager, and in-deed another upgrade under consider-ation concerns the UV optimisation ofFORS1, all the way to the atmosphericcutoff. Together, these upgrades wouldrestitute new scientific utility to theFORS instruments, while significantlyexpanding the capabilities of the VLToverall.
References
Amram P. and Östlin G., 2001, T h eMessenger 103, p. 31.
Atherton, P. D., Reay, N. K. 1981, MNRAS197, 507.
Baker, J. C., Hunstead, R. W., Bremer, M.N., Bland-Hawthorn, J., Athreya, R. A.,Barr, J. 2001, AJ, in press.
Bertin, E., Arnouts, S. 1996, A&A 117, 393.Bland-Hawthorn, J., Jones, D. H. 1998a,
PASA, 15, 44.Bland-Hawthorn, J., Jones, D. H. 1998b, in
“Optical Astronomical Instrumentation”,Proc SPIE 3355, ed. S. D’Odorico, 855.
Bland-Hawthorn, J. 2000, in “Imaging the
Universe in Three Dimensions”, A S PConf. Series 195, eds. W. van Breugeland J. Bland-Hawthorn, 34.
Cecil, G. 1989, in “Extranuclear Activity inGalaxies”, eds. E. J. A. Meurs and R. A.E. Fosbury, (ESO: Garching bei Mün-chen, Germany).
Cecil, G. 2000, in “Optical and IR TelescopeInstrumentation and Detectors”, ProcSPIE 4008, eds. M. Iye and A. F. M. Moor-wood, 83.
Cepa, J., A g u i a r, M., Escalera, V. G.,Gonzalez-Serrano, I., Joven, E., Peraza,L., Rasilla, J. L., Rodriguez, L. F., Gon-zalez, J. J., Cobos, F. J., Sanchez, B.,Tejada, C., Bland-Hawthorn, J., Militello,C. , Rosa, F., 2000 in “Optical and IRTelescope Instrumentation and Detec-tors”, Proc SPIE 4008, eds. M. Iye and A.F. M. Moorwood, 623.
Deutsch, E. W., Margon, B., Bland-Haw-thorn, J. 1998, PASP 110, 912.
Ellis, R. S., Colless, M., Broadhurst, T., Heyl,J., Glazebrook, K. 1996, MNRAS 280,235.
Fabry, C., Perot, A. 1901, ApJ 13, 265.Haffner, L. M., Reynolds, R. J., Tufte, S. L.
1999, ApJ, 523, 223.Jones, D. H., Bland-Hawthorn, J. 2001, ApJ,
in press.Jones, D. H., Shopbell, P. L., Bland-Haw-
thorn, J. 2001, MNRAS, submitted (seehttp://sc6.sc.eso.org/~hjones/WWWpubl/detect_meas.ps.gz).
Kudritzki, R.-P., Mendez, R. H., Feldmeier, J.J., Ciardullo, R., Jacoby, G. H., Freeman,K. C., Arnaboldi, M., Capaccioli, M.,Gerhard, O., Ford, H. C. 2000, ApJ, 536,19.
Kurk, J. D., Rottgering, H. J. A., Pentericci,L., Miley, G. K., van Breugel, W., Carilli, C.L., Ford, H., Heckman, T., McCarthy, P.,Moorwood, A. 2000, A&A, 358, L1.
Laval, A., Boulesteix, J., Georgelin, Y. P.,Georgelin, Y. M., Marcelin, M. 1987, A&A,175, 199.
Meisenheimer K., Beckwith, S., Focken-brock, R., Fried, J., Hippelein, H., Hopp,U., Leinert, Ch., Roeser, H.-J., Thommes,E., Wolf, C. 1997, in “The Early Universewith the VLT”, (Springer: Berlin), 165.
Perot, A. and Fabry, C. 1899, ApJ 9, 87.Pietraszewski, K. A. R. B. 2000, in “Imaging
the Universe in Three Dimensions”, ASPConf. Series 195, eds. W. van Breugeland J. Bland-Hawthorn, 591.
Shopbell, P. L., Bland-Hawthorn, J. 1998,ApJ 493, 129.
Shopbell, P. L., Veilleux, S., Bland-Haw-thorn, J. 2000, in “Imaging the Universe inThree Dimensions”, ASP Conf .Series195, eds. W. van Breugel and J. Bland-Hawthorn, 404.
Steidel, C.C., A d e l b e r g e r, K.L., Shapley,A.E., Pettini, M., Dickinson, M., Giava-lisco, M. 2000, ApJ, 532, 170.
Tadhunter, C., Villar-Martin, M., Morganti, R.2000, in “Imaging theUniverse in ThreeDimensions”, ASP Conf. Series 195, eds.W. van Breugel and J. Bland-Hawthorn,284.
Thimm, G. J., Roser, H.-J., Hippelein, H.,Meisenheimer, K. 1994, A&A 285, 785.
Tinney, C. G., Tolley, A. J. 1999, MNRAS304, 119.
Valdes, F. 1993, “FOCAS User’s Guide”,NOAO.
Veilleux, S., Bland-Hawthorn, J., Cecil, G.1999, AJ 118, 2108.
14

15
no dipole moment and cannot producea readily detectable signal under theconditions that characterise cold, darkclouds. The traditional methods used toderive the basic physical properties ofsuch molecular clouds therefore makeuse of observations of trace H2 surro-gates, namely those rare moleculeswith sufficient dipole moments to beeasily detected by radio spectroscopictechniques (Lada 1996), and interstel-lar dust, whose thermal emission canbe detected by radio continuum tech-niques (e.g., André et al. 2000).However, the interpretation of resultsderived from these methods is not al-ways straightforward (e.g., Alves, Lada,& Lada 1999; Chandler & Richer 2000).Several poorly constrained eff e c t sinherent in these techniques (e.g., devi-ations from local thermodynamic equi-librium, opacity variations, chemicalevolution, small-scale structure, deple-tion of molecules, unknown emissivityproperties of the dust, unknown dusttemperature) make the construction ofan unambiguous picture of the physicalstructure of these objects a very difficulttask. There is then a need for a lesscomplicated and more robust tracer ofH2 to access not only the physicalstructure of these objects but also toaccurately calibrate molecular abun-dances and dust emissivity inside theseclouds. The deployment of sensitive,large-format infrared array cameras onlarge telescopes, however, has fulfilled
this need by enabling the direct meas-urement of the dust extinction towardthousands of individual backgroundstars observed through a molecularcloud. Such measurements are freefrom the complications that plague mo-lecular-line or dust-emission data andenable detailed maps of cloud structureto be constructed.
2. The Method and ResultsSo Far
The most straightforward and reliableway to measure molecular cloud struc-ture is to measure dust extinction ofbackground starlight. We have devel-oped a new powerful technique formeasuring and mapping the distributionof dust through a molecular cloud usingdata obtained in large-scale, multi-wavelength, infrared imaging surveys.This method combines measurementsof near-infrared colour excess to di-rectly measure extinctions and mapthe dust column density distributionthrough a cloud (see Fig. 2). It is themost straightforward and unambiguousway of determining the density struc -ture in dark molecular clouds. More-over, the measurements can be madeat significantly higher angular resolu-tions and substantially greater opticaldepths than previously thought possi-ble. We have conclusively demonstrat-ed the efficacy of this technique withour study of the dark cloud complex IC
5146 (Lada et al. 1994, Lada et al.1999), L 977 (Alves et al. 1998), andBarnard 68 (Alves, Lada, & Lada 2001),where we detected nearly 7000 infraredsources background to these cloudsand produced detailed maps of the ex-tinction across the cloud to opticaldepths and spatial resolution an orderof magnitude higher than previouslypossible (AV ~ 40 magnitudes, spatialresolution ~ 10 arcsec).
We have used our extinction obser-vations to measure the masses, densi-ty structure, extinction laws, and dis-tances to these objects. We found theradial density profiles of filamentaryclouds (IC 5146 and L 977) to be wellbehaved and smoothly falling with apower-law index of α = –2, significantlyshallower than predicted by early theo-retical calculations of Ostriker (1964) (α= –4). Moreover, because we are usingpencil beam measurements of dust col-umn density along the line of sight tobackground stars, we were able todemonstrate that the small-scale struc-ture of the clouds is surprisingly smoothwith random density fluctuations (δAV /AV) present at very small levels (< 3%!).This result is in very good agreementwith optical studies of the small-scalestructure of the diffuse InterstellarMedium (ISM) (Thoraval, Boissé, &Duvert 1999).
When convolved to the appropriatespatial resolution, our maps showedstructure in the dust distribution whichwas strikingly well correlated with mil-limetre wave CO and CS emissionmaps of the cloud (see Fig. 3), althoughshowing crucial differences at high op-tical depths where these other tracersof column density become unreliable(see Fig. 4). These comparisons en-abled us, for the first time, to directlyderive CO, CS, and N2H+ abundances,and variations of, over an extinctionrange of 1–30 magnitudes, a rangenearly an order of magnitude greaterthan achieved previously with opticalstar-counting techniques. In a recentexperiment we were able to make a di-rect measurement of molecular deple-tion in a cold cloud core (Kramer et al.1999). Finally, a comparison betweenour extinction data and millimetre con-tinuum emission data allowed a mostaccurate measurement of the ratio ofdust absorption coefficients at millime-tre and near-infrared wavelengths(Kramer et al. 1998).
3. Barnard 68 as a Stellar Seed
Recently we have been concentrat-ing efforts on mapping the densest re-gions of the ISM that are likely places of
R E P O RTS FRO M OB SE RV E R S
Seeing the Light Through the Dark (Continued from page 1)
Figure 2: Illustration of the Near-Infrared Colour Excess (NICE) method used to derive andmap dust column density in molecular clouds. Because the amount of reddening is directlyproportional to the total extinction, we can determine the line-of-sight extinction to each starseen through a molecular cloud (at near-infrared wavelengths, NIR) using a reddening lawfor interstellar dust and knowledge of the star’s intrinsic NIR colour.

16
future star formation. We performedvery sensitive near-infrared imagingobservations to map the structure of atype of dark cloud known as a Bok glob-ule (Bok & Reilly 1947), one of the leastcomplicated configurations of molecu-lar gas known to form stars (Fig. 5). Thetarget cloud for our study, Barnard 68(Figs. 1 and 5), is itself one of the finestexamples of a Bok globule, and was se-lected because it is a nearby, relativelyisolated and morphologically simplemolecular cloud with distinct bound-aries, a known distance (125 pc;Launhardt & Henning 1997), and tem-perature (16 K; Bourke et al. 1995). Itwas first discovered by E. E. Barnard(Barnard 1919) and was the target ofseveral optical dust extinction studiesby Bart Bok and co-workers (Bok &Reilly 1974; Bok 1977). Although a verydense cloud, Barnard 68 does notpresent any of the signatures of on-going star formation, such as IRASsources, outflows, or mm continuumsources (Avery et al. 1987; Reipurth,Nyman, Chini 1996).
Barnard 68 lies in the direction of thecentre of the Galaxy but above thegalactic plane where it is projectedagainst the rich star field of the galacticbulge. This makes Barnard 68 a partic-ularly ideal candidate for an infrared ex-tinction study for the following reasons.First, the background bulge stars areprimarily late-type (giant) stars whoseintrinsic infrared colours span a narrowrange and can be accurately deter-mined from observations of nearbycontrol fields. Second, the backgroundstar field is sufficiently rich to permit adetailed sampling of the extinctionacross the entire extent of the cloud.
Third, the cloud is sufficiently nearbythat foreground star contamination isnegligible.
We used the SOFI (Moorwood, Cuby,Lidman 1998) near-infrared camera onthe European Southern Observatory’sNew Technology Telescope (NTT) toobtain deep infrared J band (1.25 µm),H band (1.65 µm) and Ks band (2.16µm) images of the cloud over two nightsin March 1999. Complementary opticaldata were obtained with ESO’s Very
Large telescope (VLT) on CerroParanal, fitted with FORS1 CCD cam-era (Appenzeller et al. 1998), duringone night of March 1999. The results ofthe optical and near-infrared imagingare displayed in Figure 1 (see page 1).At optical wavelengths obscuring dustwithin the cloud renders it opaque andcompletely void of stars (left). However,due to the wavelength dependence ofdust extinction (i.e., opacity), the cloudis essentially transparent at infraredwavelengths enabling otherwise invisi-ble stars behind the cloud to be imaged(right). We detected 3708 stars simulta-neously in the deep H and K band im-ages out of which ~ 1000 stars, lyingbehind the cloud, are not visible at op-tical wavelengths. Because dust opaci-ty decreases sharply with wavelength(Fig. 6), the colours of stars that are de-tected through a dust screen appearreddened compared to their intrinsiccolours.
We have accurately sampled thedust extinction and column density dis-tribution through the Barnard 68 cloudat more than a thousand positions withextraordinary (pencil beam) angularresolution. Although the individualmeasurements are characterised byhigh angular resolution, our mapping ofthe dust column density in the cloud ishighly undersampled. Consequently,we smoothed these data to constructthe first 10 arsec resolution map of dustextinction of a cold dark cloud (Fig. 7)and an azimuthally averaged radial ex-tinction (dust column density) profile ofthe cloud (Fig. 8). This is the most fine-ly sampled and highest signal-to-noiseradial column density profile ever ob-tained for a dense and cold molecular
Figure 3: Dust extinction map and C18O molecular line map of L977. The structure in the dustdistribution correlates strikingly well with the millimetre-wave C18O emission map of the cloud,although showing crucial differences at high optical depths (see next figure) where the COtracer becomes unreliable (from Alves et al. 1999).
Figure 4: Relation between N(C18O)LTE and visual extinction AV for molecular cloud L 977.The solid straight red line represents the result of a linear least-squares fit, with errors in bothcoordinates, over the entire data set. There is a clear deviation from the linear relation at ex -tinctions M10 magnitudes above which C18O becomes a very poor tracer of H2 (from Alveset al. 1999). Follow-up molecular line study of this cloud (Tafalla et al. 2001) suggests that,as in the IC 5146 cloud, depletion of CO might be occurring at high optical depths.

17
cloud. For the first time, the internalstructure of a dark cloud has beenspecified with a detail only exceeded bythat characterising a stellar interior.
3.1 Bonnor-Ebert Spheres
The extinction profile in Figure 8 isthe projection of the cloud volume den-sity profile function, and therefore pro-vides an exquisite view of the internalstructure of this dense dark cloud. Asearly as 1948 Bart Bok pointed out thatroughly spherical homogenous lookingclouds, such as Barnard 68, resemblesingle dynamical units much like thepolytropic models of Lane and Emdenused to describe stellar structure (Lane1870; Emden 1907). Can Barnard 68be described as a self-gravitating, poly-tropic sphere of molecular gas? To in-vestigate the physical structure of thecloud, we begin with the assumptionsof an isothermal equation of state andspherical symmetry.
The fluid equation that describes as e l f-gravitating, isothermal sphere inhydrostatic equilibrium is the follow-ing well-known variant of the Lane-Emden equation (Lane 1870, Emden1907):
(1)Figure 5: Palomar Digitized Sky Survey image of the neighbourhood of Barnard 68.Complexes of globules like the ones in this image (Barnard 68 to Barnard 72) may be theprecursors of small young stellar groups, like the well-known TW Hya.
Figure 6: Deep BVIJHK imaging of dark molecular cloud Barnard 68 done with FORS1 at the VLT and SOFI at the NTT. The wavelength de -pendence of interstellar dust extinction in Barnard 68 is clearly depicted in these images. The analysis of the near-infrared colours of the starsseen through the dark cloud allow the construction of the first 10 resolution map of mass as traced by dust extinction, and the most finelysampled and higher S/N density profile ever obtained for a cold dark cloud (from Alves et al. 2001b).

18
where ξ is the non-dimensional radius,
(2)
while ψ(ξ) equals,
(3)
for which r is the distance from the cen-tre of the sphere, is the isothermalsound speed inside the gas cloud ( =(KT/m ) A₂), is the density, and c is thecentral density. For an isothermalsphere bounded by a fixed externalpressure there is a family of solutionscharacterised by a single parameter(Ebert 1955, Bonnor 1956):
(4)
Here ξmax is the value of ξ at the outerboundary, R. Each of these solutionscorresponds to a unique cloud massdensity profile. Bonnor demonstratedthat for ξmax > 6.5 such a gaseous con-figuration would be unstable to gravita-tional collapse (Bonnor 1956). The highquality of our extinction data permits adetailed comparison with the Bonnor-Ebert predictions and we find that thereis a particular solution, (ξmax = 6.9 ± 0.2,that fits the data extraordinarily well asseen in Figure 8. For the known dis-tance (125 pc), and temperature (16 K),Barnard 68 has a physical radius of1 2,500 AU, a mass of 2.1 solar masses,and a pressure at its boundary of P =2.5 × 10⁻¹² Pa. This surface pressure isan order of magnitude higher than thatof the general ISM (McKee 1999) but itis in rough agreement with the pressureinferred for the Loop I superbubble,where Barnard 68 is embedded, de-rived from X-ray observations with the
ROSAT satellite (Breitschwerdt et al.2000).
The close correspondence of theobserved extinction profile with thatpredicted for a Bonnor-Ebert spherestrongly suggests that Barnard 68 is in-
deed an isothermal, pressure confined,and self-gravitating cloud. It is also like-ly to be in a state near hydrostatic equi-librium with thermal pressure primarilysupporting the cloud against gravita-tional contraction. For Barnard 68, ξmaxis very near and slightly in excess of thecritical radial parameter and the cloudmay be only marginally stable and onthe verge of collapse. If this is the case,we should expect molecular radio-spectroscopy of this cloud to reveal aquiet, non-turbulent cloud with narrowmolecular emission lines. Indeed, pre-liminary results from our radio-spec-troscopy observing campaign of Bar-nard 68 (with the IRAM 30-m RadioTelescope at Pico Veleta, Granada) re-veal that the line width of the C18O linein this cloud is ∆υ ~ 0.18 kms–1, one ofthe narrowest lines ever observed inmolecular clouds, in perfect agreementwith the Bonnor-Ebert sphere nature ofBarnard 68.
3.2 Reverse Engineering: Distanceand Gas to Dust Ratio to FewPercent
The exact physical state of the Bar-nard 68 cloud is further constrained bythe fact that ξmax, which is solely de-
Figure 7: 10 dustextinction map ofBarnard 68. Thecontours start at AV= 4 mag andincrease in steps of2 mags. The peakextinction measuredthrough the verycentre of the cloud is33 magnitudes ofextinction (fromAlves et al. 2001a).
Figure 8: Azimuthally averaged radial dust column density profile of Barnard 68. The red cir -cles show the data points for the averaged profile of a subsample of the data that do not in -clude the cloud’s south-east prominence, seen in Figure 6. The solid black line representsthe best fit of a theoretical Bonnor-Ebert sphere to the data.
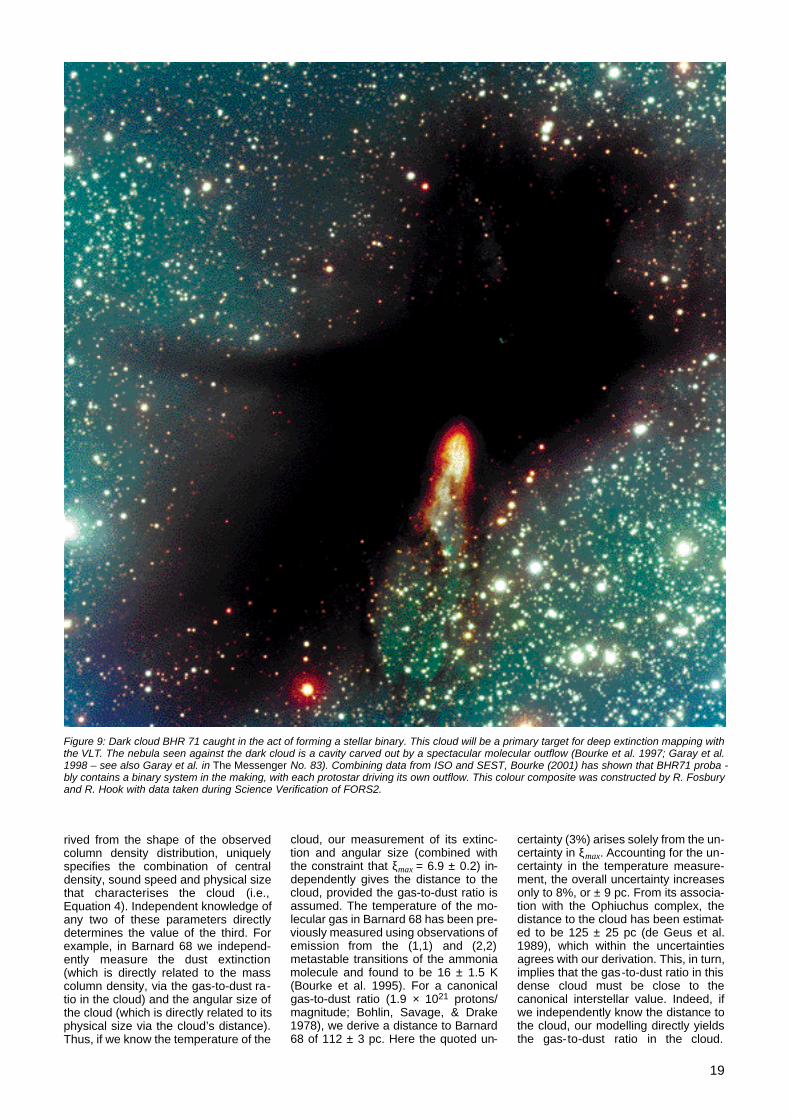
rived from the shape of the observedcolumn density distribution, uniquelyspecifies the combination of centraldensity, sound speed and physical sizethat characterises the cloud (i.e.,Equation 4). Independent knowledge ofany two of these parameters directlydetermines the value of the third. Forexample, in Barnard 68 we independ-ently measure the dust extinction(which is directly related to the masscolumn density, via the gas-to-dust ra-tio in the cloud) and the angular size ofthe cloud (which is directly related to itsphysical size via the cloud’s distance).Thus, if we know the temperature of the
cloud, our measurement of its extinc-tion and angular size (combined withthe constraint that ξmax = 6.9 ± 0.2) in-dependently gives the distance to thecloud, provided the gas-to-dust ratio isassumed. The temperature of the mo-lecular gas in Barnard 68 has been pre-viously measured using observations ofemission from the (1,1) and (2,2)metastable transitions of the ammoniamolecule and found to be 16 ± 1.5 K(Bourke et al. 1995). For a canonicalgas-to-dust ratio (1.9 × 10²¹ protons/magnitude; Bohlin, Savage, & Drake1978), we derive a distance to Barnard68 of 112 ± 3 pc. Here the quoted un-
certainty (3%) arises solely from the un-certainty in ξmax. Accounting for the un-certainty in the temperature measure-ment, the overall uncertainty increasesonly to 8%, or ± 9 pc. From its associa-tion with the Ophiuchus complex, thedistance to the cloud has been estimat-ed to be 125 ± 25 pc (de Geus et al.1989), which within the uncertaintiesagrees with our derivation. This, in turn,implies that the gas-to-dust ratio in thisdense cloud must be close to thecanonical interstellar value. Indeed, ifwe independently know the distance tothe cloud, our modelling directly yieldsthe gas-t o-dust ratio in the cloud.
19
Figure 9: Dark cloud BHR 71 caught in the act of forming a stellar binary. This cloud will be a primary target for deep extinction mapping withthe VLT. The nebula seen against the dark cloud is a cavity carved out by a spectacular molecular outflow (Bourke et al. 1997; Garay et al.1998 – see also Garay et al. in The Messenger No. 83). Combining data from ISO and SEST, Bourke (2001) has shown that BHR71 proba -bly contains a binary system in the making, with each protostar driving its own outflow. This colour composite was constructed by R. Fosburyand R. Hook with data taken during Science Verification of FORS2.

20
Assuming a distance of 125 pc, ourmeasurements allow a high-precisiondetermination (2%) for the gas-to-dustratio in this cloud of 1.73 ± 0.04 × 10²¹
protons/magnitude. If we also accountfor the uncertainties in distance andtemperature, the overall uncertainty(accuracy) of our determination in-creases to ± 0.4 × 10²¹ protons/magni-tude, or 23%. Within the overall error,this ratio is the same as the long ac-cepted value characterising low-densityinterstellar gas and is the first inde-pendent and relatively accurate deter-mination of this important astrophysicalparameter in a dense molecular cloudcore.
3.3 On the Origin of Small StellarGroups
Recently, there has been special at-tention for isolated and sparsely popu-lated associations of young low-massstars similar to the recently identifiedTW Hydra association (Rucinsky &Krautter 1983). The TW Hydra associa-tion is a stellar group near the solar sys-tem consisting of a handful of younglow-mass, sunlike stars, which hasbeen a primary target of recent substel-lar objects search (e.g. Neuhäuser etal. 2000a, Neuhäuser et al. 2000b).The existence of such a young stellargroup presents an interesting problemto astronomers because its origin is dif-ficult to explain given its youth and rel-atively large distance from known sitesof star formation. Bok globules such asthose in the Barnard 68 group arethought to be remnant dense coresproduced as a result of the interactionof massive O stars and molecularclouds (Reipurth 1983). Over their shortlifetimes, such massive stars, throughionisation, stellar winds and ultimatelysupernova explosions, very effectivelydisrupt the molecular clouds from whichthey formed. In the process, largeshells of expanding gas are created.When surrounding clouds are disruptedby the passage of these shells, a few oftheir most resilient dense cores will beleft behind, embedded within the shell’shot interior. Remnant cores with just theright mass can establish pressure equi-librium with the hot gas within the shelland survive to become Bok globules.Eventually, as a result of processesdescribed above, these clouds willevolve to form low mass, sun-like starswhich are relatively isolated and farfrom the original birthplace of the Ostars. We suggest that Barnard 68, andits neighboring globules B69, B70 andB72 (Figure 5) may be the precursorsof a small stellar group, like TW Hya.Up to 35% of all Bok globules con-
tain newly-formed stars (Launhardt &Henning 1997) and thus it is likely thatour observations of the starless Bar-nard 68 cloud provide the first de-tailed description of the initial condi-tions prior to the collapse of dark glob-ules and the formation of isolated, low-mass stars.
4. The Future
Significant progress in extinctionmapping studies will result when theDENIS and 2MASS all-sky near-infra-red imaging surveys are completed andreleased. These surveys will be suffi-ciently sensitive to produce moderate-depth extinction maps (i.e., AV ≤ 25mags) of many nearby dark clouds inthose directions of the Galaxy wherefield stars suffer little extraneous ex-tinction. In the immediate future, large-aperture telescopes, such as the VLToutfitted with ISAAC and NAOS/CONI-CA, will provide the additional capabili-ty to perform deeper surveys of thehigher extinction regions (25 < AV < 60mags) in these clouds (as the star form-ing globule BHR 71 in Figure 9). Finally,space-based infrared telescopes, suchas the NGST, should enable the re-gions of deepest extinction (AV > 60mags) to be probed. Together, such ob-servations promise to render a verycomplete understanding of the phys-ical and chemical structure of mo-lecular clouds and of the general ini-tial conditions to the star-formationprocess.
5. Acknowledgements
The authors acknowledge MarcoLombardi for fruitful discussions andassistance, the Paranal ScienceOperations team for observing Barnard68 with FORS1 on VLT Antu, RichardWest and Edmund Janssen, RichardHook and Robert Fosbury for compos-ing Figure 1. The authors are thankfulto Monika Petr for helpful discussionsduring the preparation of the VLT ob-servations.
References
Alves, J., Lada, C.J., Lada, E.A., Kenyon, S.,& Phelps, R. 1998, ApJ, 506, 292.
Alves, J., Lada, C.J., & Lada, E.A. 1999,ApJ, 515, 265.
Alves, J., Lada, C.J., & Lada, E.A. 2001a,Nature, 409, 159.
Alves, J., Lada, C.J., & Lada, E.A. 2001b,ApJ, submitted.
André, P., Ward-Thompson, D., & Barsony,M. 2000, Protostars and Planets I V,
(Tucson: University of Arizona Press),eds. Mannings, V., Boss, A.P., Russell,S. S.
A p p e n z e l l e r, I., Fricke, K., Fürtig, W. ,Gässler, W., Häfner, R., Harke, R., Hess,H., Hummel, W., Jürgens, P., Kudritzki,R., Mantel, K., Meisl, W., Szeifert, T., &Tarantik, K. Successful Commissioning ofFORS1 – the First Optical Instrument onthe VLT, The Messenger 94, 1–6(1998).
Bok, B. & Reilly, E. 1947, ApJ, 105, 255.Bok, B. 1948, Centennial Symposia (Har-
vard Observatory Monographs No. 7); Har-vard-College Observatory, Cambridge.
Bourke, T., Hyland, A., Robinson, G., James,S. & Wright, C. 1995, MNRAS, 276, 1067.
Bourke, T., Garay, G., Lehtinen, K., Koeh-nenkamp, I., Launhardt, R., Nyman, L.,May, J., Robinson, G., Hyland, A. 1997,ApJ, 476, 781.
Bourke, T. 2001, ApJ, submitted.Breitschwerdt, D., Freyberg, M. & Egger, R.
2000, A&A, 361, 303.Chandler, C. & Richer, J. 2000, ApJ, 530,
851.de Geus, E., de Zeenw, P. & Lub, J. 1989,
A&A, 216, 44.Emden, R. 1907, Gaskugeln, (Leipzig:
Teubner).G a r a y, G., Köhnenkamp, I., Bourke, T. ,
Rodriguez, L., Lehtinen, K. 1998, ApJ,509, 768.
Garay, G., Köhnenkamp, I., Rodriguez, L.,1966, The Messenger 83, 31.
Kramer, C., Alves, J., Lada, C., Lada, E.,Sievers, A., Ungerechts, H., Walmsley, M.1997, A&A, 329, 33.
Kramer, C., Alves, J., Lada, C.J., Lada, E.A.,Sievers, A., Ungerechts, H., Walmsley,C.M. 1999, A&A, 342, 257.
Lada, C.J., Lada, E.A., Clemens, D.P., &Bally, J. 1994, ApJ, 429, 694.
Lada, C.J. 1996, Proceedings of IAUSymposium CO: Twenty-Five Years ofMillimeter-Wave Spectroscopy, eds. W.B.Latter et al. (Kluwer-Dordrecht), p. 387.
Lada, C.J., Alves, J., Lada, E.A. 1999, ApJ,512, 250.
Lane, J. 1870, American Journal of Scienceand Arts, Series 2, 4, 57.
Launhardt, R. & Henning, T. 1997, A&A 326,329.
Mckee, C. 1999, in The Origin of Stars andPlanetary Systems, eds. C. Lada & N.Kylafis (Dordrecht: Kluwer).
Moorwood, A., Cuby, J. & Lidman, C. SOFISees First Light at the NTT, TheMessenger 91, 9–13 (1998).
Neuhäuser, R., Brandner, W., Eckart, A.,Guenther, E., Alves, J., Ott, T., Huélamo,N., Fernandez, M. 2000a, A&A, 354, 9.
N e u h ä u s e r, R., Guenther, E., Petr, M.,B r a n d n e r, W., Huélamo, N., Alves, J.2000b, A&A, 360, 39.
Ostriker, J. 1964, ApJ, 140, 1056.Reipurth, B. 1983, A&A, 117, 183.Reipurth, B., Nyman, L. & Chini, R. 1996,
A&A, 314, 258.Rucinski, S. & Krautter, J. 1983, A&A, 121,
217.Tafalla, M., Alves, J., & Lada, C. 2001, in
prep.Thoraval, S., Boissé, P., Duvert, G. 1999,
A&A, 351, 1051.

Accretion and outflows of mass areamong the most distinctive phenomenaassociated to star formation. Their ob-servational manifestations cover abroad range of appearances and wave-lengths, from the large X-ray emittingbubbles caused by stellar winds mov-ing at several thousands of kilometresper second, to the cold dust shellsaround low-mass stars detected by
their millimetre-wave emission. Evenstars with only a few tenths of the massof the Sun display in their earlieststages spectacular signatures of inter-action with the circumstellar environ-ment, such as the strong emission linesseen in T Tauri stars or the fast-movingjets that produce Herbig-Haro objects.
Can strong accretion and mass losstake place even at substellar masses?
Young brown dwarfs are currentlyknown to share many characteristicswith the more massive T Tauri stars.The similarities include mid-i n f r a r e demission, revealed by ISOCAM (e.g.Comerón et al. 1998, Persi et al. 2000)from warm dust in circumstellar disks orenvelopes that provide large reservoirsof mass for accretion. The spectra ofvery young brown dwarfs often display
21
Strong Accretion and Mass Loss Near theSubstellar LimitF. COMERÓN, ESO, Garching, GermanyM. FERNÁNDEZ, Instituto de Astrofísica de Andalucía, Granada, Spain
Figure 1: A B, V,RC image of the field around LS-RCrA1 obtained with the Wide Field Imager at the ESO-MPG 2.2-m telescope. LS-RCrA 1is the faint object at the centre and marked with an arrow. The bright nebulosity at the upper left corner contains the T Tauri stars R and TCrA. The comma-shaped nebula to the bottom right of that nebula is the Herbig -Haro object HH 100, and the red compact nebula at the bot -tom centre of the image is HH 101. The bright star near the centre of the image, to the left and below LS-RCrA1, is V709 CrA. The field isapproximately 10 10 in size.

Hα emission that is commonly associ-ated to accretion, as confirmed fromhigh-resolution spectroscopy (Muze-rolle et al. 2000). Like T Tauri stars,young brown dwarfs also have beenfound to possess X-ray emission(Neuhäuser & Comerón 1998; Come-rón, Neuhäuser, and Kaas 1998)caused by the magnetic fields that playa fundamental role in regulating theflow of mass from the accretion diskonto the surface (Hartmann 1998). Inview of these similarities, one may won-der if the spectral signposts of intenseaccretion sometimes displayed by clas-sical TTauri stars, and very often foundto be correlated with strong mass loss,may also be found near the substellarlimit or even below.
Here we present our observations ofa very late-type faint member of the RCoronae Australis star-forming cloudthat displays an unusually rich emis-sion-line spectrum, similar to that ofmore massive counterparts, in whichboth accretion and outflow signatures
coexist. This is thelatest-type objectfor which such anintense emission-line spectrum hasbeen observed sof a r. The late-t y p espectrum and thefaintness of theunderlying objectsuggest that it isnear or below theborderline sepa-rating stars frombrown dwar fs ,showing that suchspectacular spec-tral signatures canbe present even atmasses of a fewper cent of a solarmass. The detailsof this work are de-scribed in extent ina separate paper(Fernández & Co-merón 2001).
Observations
The special char-acteristics of theobject that we pre-sent here, hereafterreferred to as LS-RCrA 1 (where LSstands for La Silla)were first revealedin a slitless spec-troscopy survey ofthe core of the RCoronae A u s t r a l i sstar-forming re-gion, carried outwith DFOSC at the1.5-m Danish tele-scope at La Silla inApril 1999. T h e
slitless spectroscopy frames showedonly a dot at the expected position ofHα for an otherwise inconspicuousobject of RC Q 19.5, with a continuumtoo faint to be seen in those ob-servations. Near-infrared JHK photom-etry was obtained with SOFI at theNTT in February 2000. Further spec-troscopic observations were carried outat the VLT, both with FORS2 in thevisible and ISAAC in the K band, inMarch 2000. Finally, short exposures inBVRC IC were obtained with the WFIat the 2.2-m telescope in August, tocheck for possible photometric vari-ability. A colour composite of a part ofthe WFI image is shown in Figure 1,centred on LS-R C r A 1 (see alsohttp://www.eso.org/outreach/press-rel/pr-2000/phot-25-00.html).
Figure 2 shows both the FORS2 andISAAC spectra of LS-RCrA1. The mostoutstanding feature in the visible is theabundance of strong emission lines,dominated by Hα with an equivalentwidth of approximately 330 Å. For-
bidden lines due to [OI], [OII], [NII], and[SII] are also clearly identified, as wellas the Ca ll triplet near 8550 Å. The ap-pearance and intensity of these emis-sion lines is not unprecedented, andthe line ratios are similar to those ofKrautter’s star (Th 28; Graham andHeyer 1988), a G8-K2 star that powersa string of Herbig-Haro objects. How-e v e r, the underlying spectrum ofLS-RCrA1 is much later than that of Th28 and other T Tauri stars with strongemission, and can be reliably classifiedas M6-M7. At the age of the R CoronaeAustralis, such a late spectral type im-plies a mass below 0.1 solar masses,and probably substellar.
The ISAAC K-band spectrum alsopresented in Figure 2 is remarkablyfeatureless. At the resolution and sig-nal-to-noise of these observations, alate M-type spectrum should displayatomic features in that region due toNa I, Ca I, Mg I, as well as prominentCO bandheads starting at 2.29 µm.Only the latter are clearly identified inthe spectrum on LS-RCrA 1, but withequivalent widths of less than half thetypical value for its spectral type.Finally, the H2 line at 2.12 µm is clearlyseen in emission.
A final surprise from our observationsof LS-RCrA1 comes from its faintness.The measured brightness from our WFIimages is B = 23.1, V = 21.3, RC = 19.8,IC = 18.0, and from our SOFI images J= 15.3, H = 14.5, K = 13.9. Since itsmoderately blue colours imply a slightextinction at most and the R CoronaeAustralis clouds are only 150 ± 20 pcaway, this places LS-RCrA1 among theintrinsically faintest members known ofa star-forming region.
Interpretation
The numerous forbidden emissionlines in the spectrum of LS-RCrA 1strongly resemble those seen inl o w-mass stars undergoing strongmass loss, such as those poweringHerbig-Haro objects (e.g. Reipurth etal. 1986). On the other hand, the largestrength of the Hα line as compared to[SII] suggests that most of the Hα emis-sion is actually due to accretion, ratherthan to mass loss. The similar equiva-lent widths of the Ca II lines near8500 Å, together with the absence offorbidden-line emission of [CaII], alsohint that CaII emission arises from adense, optically thick region. It seemstherefore that LS-RCrA 1 is simulta-neously undergoing strong accretionand mass loss, just like its higher-massTTauri counterparts that lie at the originof Herbig-Haro flows.
The K-band spectrum presented alsoshows some characteristics commonlyfound among very young objects en-shrouded by circumstellar material,such as H2 emission and the absenceof any detectable absorption featuresapart from much weakened CO band-
22
Figure 2: Visible (top) and near-infrared (bottom) spectra of LS-RCrA 1, obtained respectively with FORS2 and ISAAC in March2000. The most prominent emission lines are marked in the visiblespectrum. In the infrared spectrum we mark the position of the de -tected lines due to H2 and CO, as well as the expected positions ofsome atomic features that should be detectable in this region for anormal M6 star.
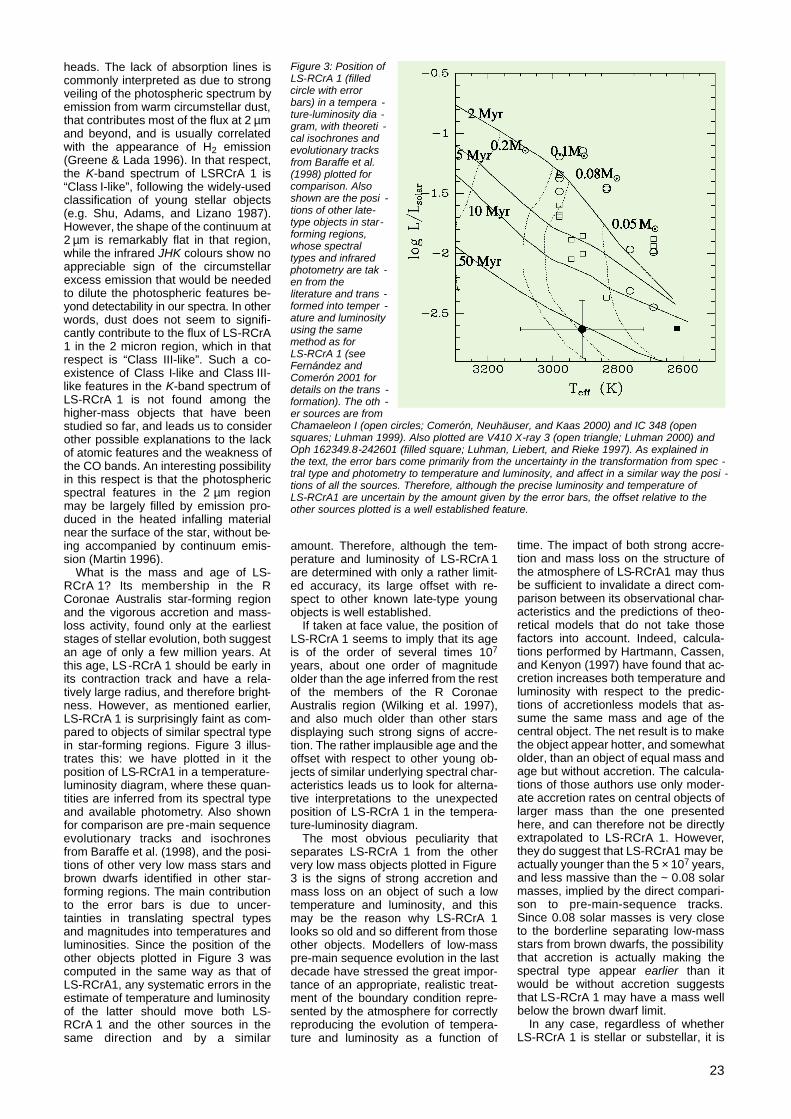
Figure 3: Position ofLS-RCrA 1 (filledcircle with errorbars) in a tempera -ture-luminosity dia -gram, with theoreti -cal isochrones andevolutionary tracksfrom Baraffe et al.(1998) plotted forcomparison. Alsoshown are the posi -tions of other late-type objects in star-forming regions,whose spectraltypes and infraredphotometry are tak -en from theliterature and trans -formed into temper -ature and luminosityusing the samemethod as forLS-RCrA 1 (seeFernández andComerón 2001 fordetails on the trans -formation). The oth -er sources are fromChamaeleon I (open circles; Comerón, Neuhäuser, and Kaas 2000) and IC 348 (opensquares; Luhman 1999). Also plotted are V410 X-ray 3 (open triangle; Luhman 2000) andOph 162349.8-242601 (filled square; Luhman, Liebert, and Rieke 1997). As explained inthe text, the error bars come primarily from the uncertainty in the transformation from spec -tral type and photometry to temperature and luminosity, and affect in a similar way the posi -tions of all the sources. Therefore, although the precise luminosity and temperature ofLS-RCrA1 are uncertain by the amount given by the error bars, the offset relative to theother sources plotted is a well established feature.
heads. The lack of absorption lines iscommonly interpreted as due to strongveiling of the photospheric spectrum byemission from warm circumstellar dust,that contributes most of the flux at 2 µmand beyond, and is usually correlatedwith the appearance of H2 emission(Greene & Lada 1996). In that respect,the K-band spectrum of LSRCrA 1 is“Class I-like”, following the widely-usedclassification of young stellar objects(e.g. Shu, Adams, and Lizano 1987).However, the shape of the continuum at2 µm is remarkably flat in that region,while the infrared JHK colours show noappreciable sign of the circumstellarexcess emission that would be neededto dilute the photospheric features be-yond detectability in our spectra. In otherwords, dust does not seem to signifi-cantly contribute to the flux of LS-RCrA1 in the 2 micron region, which in thatrespect is “Class III-like”. Such a co-existence of Class I-like and Class III-like features in the K-band spectrum ofLS-RCrA 1 is not found among thehigher-mass objects that have beenstudied so far, and leads us to considerother possible explanations to the lackof atomic features and the weakness ofthe CO bands. An interesting possibilityin this respect is that the photosphericspectral features in the 2 µm regionmay be largely filled by emission pro-duced in the heated infalling materialnear the surface of the star, without be-ing accompanied by continuum emis-sion (Martin 1996).
What is the mass and age of LS-R C r A 1? Its membership in the RCoronae Australis star-forming regionand the vigorous accretion and mass-loss activity, found only at the earlieststages of stellar evolution, both suggestan age of only a few million years. Atthis age, LS-RCrA 1 should be early inits contraction track and have a rela-tively large radius, and therefore bright-ness. However, as mentioned earlier,LS-RCrA 1 is surprisingly faint as com-pared to objects of similar spectral typein star-forming regions. Figure 3 illus-trates this: we have plotted in it theposition of LS-RCrA1 in a temperature-luminosity diagram, where these quan-tities are inferred from its spectral typeand available photometry. Also shownfor comparison are pre-main sequenceevolutionary tracks and isochronesfrom Baraffe et al. (1998), and the posi-tions of other very low mass stars andbrown dwarfs identified in other star-forming regions. The main contributionto the error bars is due to uncer-tainties in translating spectral typesand magnitudes into temperatures andluminosities. Since the position of theother objects plotted in Figure 3 wascomputed in the same way as that ofLS-RCrA1, any systematic errors in theestimate of temperature and luminosityof the latter should move both LS-RCrA 1 and the other sources in thesame direction and by a similar
amount. Therefore, although the tem-perature and luminosity of LS-RCrA 1are determined with only a rather limit-ed accuracy, its large offset with re-spect to other known late-type youngobjects is well established.
If taken at face value, the position ofLS-RCrA 1 seems to imply that its ageis of the order of several times 107
years, about one order of magnitudeolder than the age inferred from the restof the members of the R CoronaeAustralis region (Wilking et al. 1997),and also much older than other starsdisplaying such strong signs of accre-tion. The rather implausible age and theoffset with respect to other young ob-jects of similar underlying spectral char-acteristics leads us to look for alterna-tive interpretations to the unexpectedposition of LS-RCrA 1 in the tempera-ture-luminosity diagram.
The most obvious peculiarity thatseparates LS-RCrA 1 from the othervery low mass objects plotted in Figure3 is the signs of strong accretion andmass loss on an object of such a lowtemperature and luminosity, and thismay be the reason why LS-RCrA 1looks so old and so different from thoseother objects. Modellers of low-masspre-main sequence evolution in the lastdecade have stressed the great impor-tance of an appropriate, realistic treat-ment of the boundary condition repre-sented by the atmosphere for correctlyreproducing the evolution of tempera-ture and luminosity as a function of
time. The impact of both strong accre-tion and mass loss on the structure ofthe atmosphere of LS-RCrA1 may thusbe sufficient to invalidate a direct com-parison between its observational char-acteristics and the predictions of theo-retical models that do not take thosefactors into account. Indeed, calcula-tions performed by Hartmann, Cassen,and Kenyon (1997) have found that ac-cretion increases both temperature andluminosity with respect to the predic-tions of accretionless models that as-sume the same mass and age of thecentral object. The net result is to makethe object appear hotter, and somewhatolder, than an object of equal mass andage but without accretion. The calcula-tions of those authors use only moder-ate accretion rates on central objects oflarger mass than the one presentedhere, and can therefore not be directlyextrapolated to LS-RCrA 1. However,they do suggest that LS-RCrA1 may beactually younger than the 5 × 10⁷ years,and less massive than the ~ 0.08 solarmasses, implied by the direct compari-son to pre-main-sequence tracks.Since 0.08 solar masses is very closeto the borderline separating low-massstars from brown dwarfs, the possibilitythat accretion is actually making thespectral type appear earlier than itwould be without accretion suggeststhat LS-RCrA 1 may have a mass wellbelow the brown dwarf limit.
In any case, regardless of whetherLS-RCrA 1 is stellar or substellar, it is
23

clearly a so far unique object thatposes an interesting case study inseveral respects. It demonstrates thatthe spectacular emission-line systemsfound in classical T Tauri stars can bepresent also at much lower masses,and suggests that intense accretionand mass loss can dramatically alterthe spectroscopic and photometricproperties of the underlying object. Itstresses the need to complement exist-ing models for the early evolution oflow-mass objects with significant accre-tion and mass loss rates. A conse-quence of this is the intriguing pos-sibility of biases in current studies ofthe mass and age distributions ofyoung stellar aggregates if a significantfraction of their members undergo ac-cretion and mass loss phases likeLSRCrA 1, due to the reliance of suchstudies on pre-main sequence evolu-tionary tracks.
Of course, LS-RCrA 1 also suggestsa variety of follow-up of observationalstudies: what information can we obtainfrom high-resolution spectra of theemission lines? Does the mass loss ofLS-RCrA1 cause any visible impact (asyet undetected in our images) in thesurrounding interstellar medium, likethe Herbig-Haro objects generated bymore massive stars? How do the sig-natures of accretion and mass loss varywith time? What do possible photomet-ric variations tell us about the existence
and distribution of dark and hot spotson its surface? Can we trace the reser -voir of cold circumstellar gas aroundL S-R C r A 1 through its mid-, far-i n-frared, and radio emission? How com-mon are objects like LS-RCrA 1 instar-forming regions? Is the rich emis-sion-line spectrum of LS-RCrA1 a rari-ty among very low mass objects, ordoes it rather represent a short-livedevolutionary phase? Is the simultane-ous appearance of Class I and Class IIIcharacteristics a part of the peculiaritiesof LS-RCrA 1, or is it common amongyoung very low mass stars and browndwarfs? Are there other signs of activi-ty, such as X-ray emission, associatedto LSRCrA 1? Answering these ques-tions and understanding objects likeLS-RCrA 1 from a theoretical, quantita-tive point of view, is essential for plac-ing LS-RCrA 1 in the context of what isalready known about the early stagesof the lives of stars at different masses,extending such knowledge beyond thesubstellar edge.
Acknowledgements
We are pleased to thank the staffs ofboth La Silla and Paranal Obser-vatories for excellent support during ourobservations, as well as to ParanalScience Operations and the UserSupport Group for the successful exe-
cution of our service mode observa-tions with FORS2 at Kueyen.
References
Baraffe, I., Chabrier, G., Allard, F., Hau-schildt, P. H., 1998, A&A, 337, 403.
Comerón, F., Neuhäuser, R., Kaas, A. A.,1998, The Messenger, 94, 38.
Comerón, F., Neuhäuser, R., Kaas, A. A.,2000, A&A, 359, 269.
Comerón, F., Rieke, G. H., Claes, P., Torra,J., Laureijs, R. J., 1998, A&A, 335, 522.
Fernández, M., Comerón, F., 2001, submit-ted to A&A.
Graham, J. A., Heyer, M. H., 1988, PASP,100, 1529.
Greene, T. P., Lada, C. J., 1996, A J, 11 2, 2184.Hartmann, L., 1998, “Accretion processes in
star formation”, Cambridge Univ. Press.Hartmann, L., Cassen, P., Kenyon, S. J.,1997, ApJ, 475, 770.
Luhman, K. L., 1999, ApJ, 525, 466.Luhman, K. L., 2000, ApJ, 544, 1044.Luhman, K.L., Liebert, J., Rieke, G. H.,
1997, ApJ, 489, L165. Martin, S. C., 1996, ApJ, 470, 537.Muzerolle, J., Briceno, C., Calvet, N.,
Hartmann, L., Hillenbrand, L., Gullbring,E., 2000, ApJ, 545, L141.
Neuhäuser R., Comerón F., 1998, Science,282, 83.
Persi, P., et al., 2000, A&A, 357, 219.Reipurth, B., Bally, J., Graham, J. A., Lane,
A. P., Zealey, W. J., 1986, A&A, 164, 51. Shu, F. H., Adams, F. C., Lizano, S., 1987,
ARA&A, 25, 23.Wilking, B. A., McCaughrean, M. J., Burton,
M. G., Giblin, T., Rayner, J. T., Zinnecker,H., 1997, AJ, 114, 2029.
24
Star Formation at z = 2–4: Going Below the Spectroscopic Limit with FORS1J. U. FYNBO1, P. MØLLER1, B. THOMSEN2
1European Southern Observatory, Garching, Germany 2Institute of Physics and Astronomy, University of Århus, Århus, Denmark
Introduction
The population of bright galaxies at z= 2–4 has been studied intensively us-ing the Lyman-Break technique (Steidelet al. 1996; Cristiani et al. 2000).Currently, redshifts can be determinedfrom absorption features of galaxies se-lected in this way down to R P 25.5(e.g. Steidel et al. 2000), which is com-monly referred to as the spectroscopiclimit. Currently, very little is knownabout the galaxy population below thespectroscopic limit. This is an unfortu-nate situation since all the informationon the chemical enrichment of younggalaxies (Damped Ly-α Absorbers) ac-cessible through QSO absorption linesseems to be valid mainly for galaxiessignificantly fainter than R = 25.5(Fynbo et al. 1999; Haehnelt et al.2000). In order to select and study
galaxies fainter than the current spec-troscopic limit, one has to rely on otherselection criteria than the Ly m a n -Break. Two promising possibilities are(i) to select galaxies with Ly-α emissionlines, and (ii) to study the host galaxiesof Gamma-Ray Bursts (GRBs).
Ly- Selected Galaxies
Ly-α selection of high-redshift galax-ies has been attempted for many years,but only recently with significant suc-cess (Møller and Warren 1993; Franciset al. 1995; Cowie and Hu 1998; Pas-carelle al. 1998; Kudritzki et al. 2000;Fynbo et al. 2000a; Steidel et al. 2000;Kurk et al. 2000). In 1998 we detected6 candidate Ly -α emitting galaxies(called S7–S12) in the field of the QSOQ1205-30 at z = 3.036 with deep NTTn a r r o w-band imaging (Fynbo et al.
2000b). In March 2000 we carried outf o l l o w-up Multi-Object Spectroscopywith FORS1 on the 8.2-m Antu tele-scope (UT1). We also obtained deeperbroad-band B and I imaging reaching 5(2)σ detection limits in 1 arcsec2 circu-lar apertures of 25.9 (26.9) in the I-bandand 26.7 (27.7) in the B-band (both onthe AB system). The results of theseobservations are presented in Fynbo etal. (2001a), and summarised here.
Imaging
In Figure 1 we show image sectionswith Ly-α (top), VLT B-band (middle)and VLT I-band (bottom) for S7–S12.As seen, despite the faint detection lim-its, only for S7 and S9 is there a corre-sponding source detected in the broadbands (B(AB) = 25.6 and 25.4 respec-tively). For the sources S8 and

S10–S12 no convincing broad-bandcounterpart is detected.
For the brightest source, S9, there isan offset of 0.6 ± 0.2 arcsec betweenthe Ly-α centroid and then centroid ofthe continuum source. The same offsetis also seen in the 2-dimensional spec-trum of the source (Fig. 2, the slit wasnearly aligned along the direction of theoffset). To assess whether a likely ex-planation for this is that we see twosources superposed, we calculate theprobability for a chance alignmentalong the line of sight. The surface den-sity of galaxies down to the 5σ detec-tion limit in the VLT B-band image is 50per arcmin2. The probability to find agalaxy by chance within 0.6 arcsecfrom a given position on the sky istherefore roughly π × 0.62 × 50/3600 =1.6%. The probability of such a chancealignment in one of six cases is henceroughly 10%, which is small but notnegligible. Therefore, with the presentdata we cannot conclude whether S9 isa single object with strong Ly-α emis-sion centred 0.6 arcsec from the con-tinuum emission, or a chance align-ment of two objects. Note here that evi-dence that the spatial distribution ofLy-α emission of high-redshift galaxiescan be different from that of the con-tinuum emission of the same galaxy,was reported by Møller and Warren(1998) and Roche et al. (2000).
Spectroscopy
The individual spectra of S7–S12 areshown in Fynbo et al. (2001a). All 6sources have confirmed emission lines.In the middle panel of Figure 3, weshow the composite spectrum of all6 sources in the spectral region
4600 Å–5270 Å around the emissionline (left) and in the spectral region6050Å–6720Å (right). As seen, there isone strong emission line detected in theblue part of the spectrum. This linecould be due to a foreground emission-line galaxy at z = 0.313 with [OII]λ3727in the narrow filter, or Ly-α at z = 3.036.To discriminate between the two possi-bilities we look for the presence of oth-er lines. In the lower panel we show thespectrum of a z = 0.224 (B(AB) = 24.2)emission-line galaxy detected in one ofthe redundant slits. This spectrum hasbeen redshifted to z = 0.313 so that the[OII]λ3727 emission line falls at thesame wavelength as the observedemission lines of S7–S12. Wi t hdashed, vertical lines we indicate thepositions of the [NeIII], Hβ and [OIII]emission lines seen in the spectrum ofthe z = 0.313 galaxy. As seen, there isno hint of these lines in the compositespectrum of S7–S12, which confirmsthat S7–S12 indeed are high redshift
Ly-α emitters and not foreground emis-sion-line galaxies. In the upper panelwe show the spectrum of Q1205-30 inthe same spectral regions as forS7–S12 to illustrate, in the same way,that there is no CIV emission fromS7–S12. Hence, the Ly-α emission ismost likely powered by star-formation.
These results show that Ly-α selec-tion allows the study of high-redshiftgalaxies that are currently not accessi-ble with the Lyman-Break technique.The inferred space density of S7–S12is about 10 times higher than thatof R < 25.5 Ly m a n-Break galaxies(Fynbo et al. 2000a). Only ~ 20% of theLyman-Break galaxies show Ly-α inemission (Steidel et al. 2000). This maybe an underestimate if Ly-α and con-tinuum emission often have differentspatial distributions. However, if thisfraction is valid further down the lumi-nosity function, then there could be 50times more galaxies like S7–S12 thanR < 25.5 Lyman-Break galaxies. Of
25
Figure 1: Image sections (12 12 arcsec2) from the NTT narrow-band (top), VLT B-band (middle) and VLT I-band (bottom) for each of the sixcandidate emission-line galaxies S7–S12 (Fynbo et al. 2000a). East is to the left and north up.
Figure 2: The 2-dimensional spectrum of the brightest Ly- source, S9, showing the offsetbetween the Ly- emission and the continuum emission.

course we need to measure the spacedensity of faint Ly-α emitters to similardepths as in the field of Q1205-30 inseveral (blank) fields before this con-clusion can be drawn.
GRB Host Galaxies
In some widely accepted scenarios,GRBs are related to the deaths of verymassive, short-lived stars and further-more gamma-rays are not obscured bydust. Hence, a sample of GRB hostgalaxies may be considered star-for-m a t i o n-selected independent of theamount of extinction of the rest-frameUV and optical emission.
Several high-redshift galaxies havebeen localised as host galaxies ofGRBs. A Lyman-Break type galaxy atr e d shift z = 3.42 with an R-band magni-tude of R = 25.6 (and a prominent Ly-αemission line) was found to be the hostgalaxy of GRB 971214 (Kulkarni et al.1998; Odewahn et al. 1998). GRB990123 and GRB 990510 occurred atnearly identical redshifts (z ~ 1.6), but
the host galaxy of the former (R = 24.6)is more than 20 times brighter than thelatter (R = 28) (Holland and Hjorth1999; Fruchter et al. 1999, 2000a). Inthe same way, GRB 000301C and GRB000926 occurred at z = 2.0404 and z =2.0375, but have very different host gal-axies. The host galaxy of GRB 000301Cremains undetected down to a detectionlimit of R = 28.5 (Fruchter et al. 2000b;Smette et al. 2001; Jensen et al. 2001),whereas the host galaxy of GRB 000926is relatively bright (R = 24, Fynbo et al.2001b). Finally, no host galaxy hasbeen detected for GRB 000131, thatoccurred at z = 4.50, down to a limit ofR = 25.7 (Andersen et al. 2000).
If GRBs indeed trace star-formation,these observations indicate that atthese redshifts galaxies covering abroad range of luminosities contributesignificantly to the overall density ofstar formation. Furthermore, as the ob-served R-band flux is proportional tothe star-formation rate, there must be1–2 orders of magnitude more galaxiesat the R = 28 level than at the R = 24
level at z = 2. Otherwise it would be un-likely to detect R = 28 galaxies as GRBhosts.
Conclusion: Faint Galaxies atHigh Redshifts
The study of Damped Ly-αAbsorbers (Fynbo et al. 1999; Haehneltet al. 2000), Ly-α selected galaxies andGRB host galaxies independently sug-gest that there are 1–2 orders of mag-nitude more galaxies fainter than R P25.5 than brighter than this limit at z =2–4. The properties of galaxies at thisfaint end of the luminosity function arecurrently very uncertain. Since the pop-ulation of bright, Lyman-Break selectedgalaxies is already (observationally)very well studied and characterised,progress in the understanding of thehigh-redshift galaxy population willmost likely come from the study ofgalaxies below the spectroscopic limit.
References
Andersen M. I., Hjorth J., Pedersen H., et al.,2000, A&A 364, L54.
Cowie L. L., Hu E. M., 1998, AJ 115, 1319. Cristiani S., Appenzeller I., Arnout S., et al.,
2000, A&A 359, 489. Fynbo J. U., Møller P., Warren S. J., 1999,
MNRAS 305, 849. Fynbo J. U., Thomsen B., Møller P., 2000a,
A&A 353, 457. Fynbo J. U., Thomsen B. Møller P., 2000b,
The Messenger 95, 32.Fynbo J. U., Gorosabel J., Dall T. H., et al.,
2001a, submitted to A&A.Fynbo J. U., Møller P., Thomsen B., 2001a,
submitted to A&A.Francis P. J., Woodgate B. E., Warren S. J.,
et al., 1995, ApJ 457, 490. Fruchter A., Thorsett S. E., Metzger M. R., et
al., 1999, ApJ 519, L13. Fruchter A., Hook R., Pian E., 2000a, GCN
757. Fruchter A., Metzger M., Petro L., 2000b,
GCN 701. Haehnelt M. G., Steinmetz M., Rauch M.,
ApJ 534, 594. Holland S., Hjorth J., 1999, A&A 344, L67. Jensen B. L., Fynbo J. U., Gorosabel J., et
al., 2001, A & A submitted (astro-p h /0005609).
Kudritzki R.-P., Méndez R.H., FeldmeierJ.J., et al., 2000, ApJ 536, 19.
Kulkarni S. R., Djorgovski S. G., Rama-prakesh A. N., et al., 1998, Nat 393, 35.
Kurk J. D., Röttgering H. J. A., Pentericci L.,et al., 2000, A&A 358, L1.
Roche N., Lowenthal J., Woodgate B., 2000,MNRAS 317, 937.
Møller P., Warren S. J., 1993, A&A 270, 43. Møller P., Warren S. J., 1998, MNRAS 299,
661. Odewahn S. C., Djorgovski S. G., Kulkarni
S. R., et al., 1998, ApJ 509, L5. Pascarelle S. M., Windhorst R. A., Keel W.
C., 1998, AJ 116, 2659. Smette A., Fruchter A. S., Gull T. R., et al.,
2001, ApJ in press (astro-ph/0007202). Steidel C. C., Giavalisco M., Pettini M.,
Dickinson M., Adelberger K., 1996, ApJ462, L17.
Steidel C. C., Adelberger, Shapley A. E., etal., 2000, ApJ 532, 170.
26
Figure 3: The middlepanel shows thecomposite spectrum ofS7–S12. The lower pan -els show the spectrumof an emission-linegalaxy redshifted to z =0.313 so that the [OII]line falls at thewavelength of theobserved emission lineof S7–S12. As seen, thecomposite spectrum ofS7–S12 shows none ofthe lines expected ifS7–S12 had been fore -ground emission-linegalaxies. The upperpanels show thespectrum of Q1205-30to indicate the positionof the CIV emission ex -pected for AGNs. Theabsence of CIVemission from S7–S12shows that the Ly-emission is powered bystar-formation and notby a central AGN.
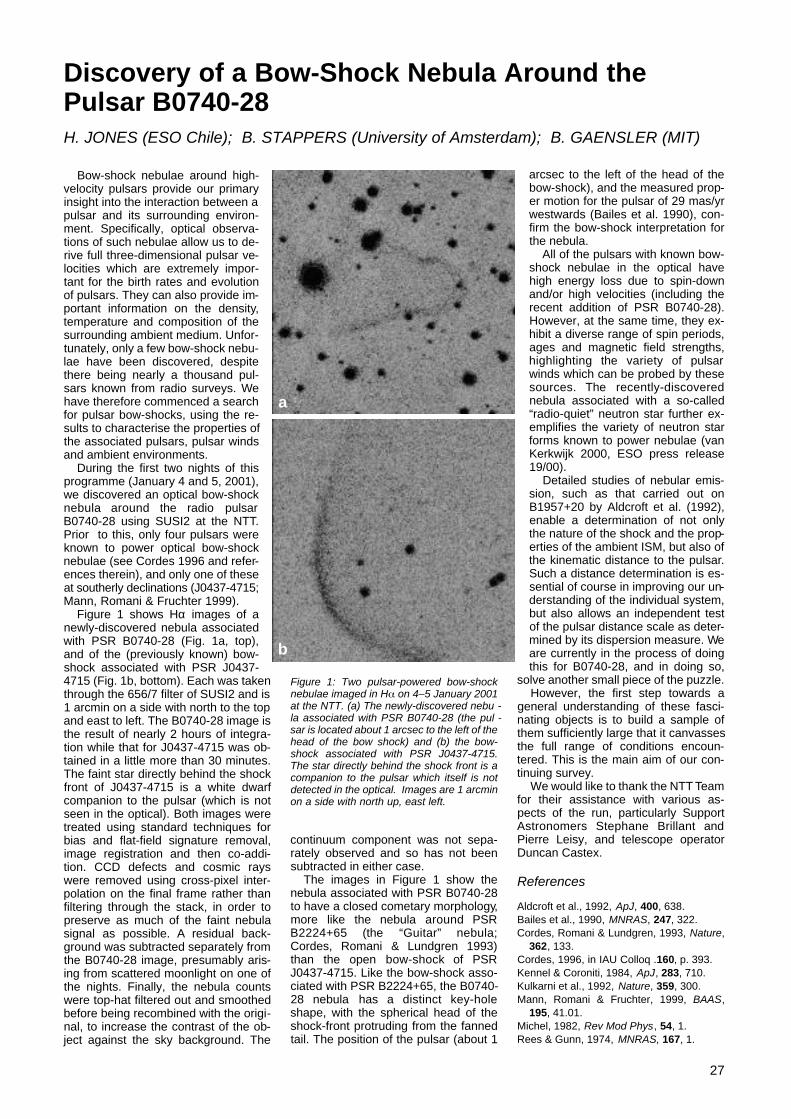
Bow-shock nebulae around high-velocity pulsars provide our primaryinsight into the interaction between apulsar and its surrounding environ-ment. Specifically, optical observa-tions of such nebulae allow us to de-rive full three-dimensional pulsar ve-locities which are extremely impor-tant for the birth rates and evolutionof pulsars. They can also provide im-portant information on the density,temperature and composition of thesurrounding ambient medium. Unfor-tunately, only a few bow-shock nebu-lae have been discovered, despitethere being nearly a thousand pul-sars known from radio surveys. Wehave therefore commenced a searchfor pulsar bow-shocks, using the re-sults to characterise the properties ofthe associated pulsars, pulsar windsand ambient environments.
During the first two nights of thisprogramme (January 4 and 5, 2001),we discovered an optical bow-shocknebula around the radio pulsarB0740-28 using SUSI2 at the NTT.Prior to this, only four pulsars wereknown to power optical bow-shocknebulae (see Cordes 1996 and refer-ences therein), and only one of theseat southerly declinations (J0437-4715;Mann, Romani & Fruchter 1999).
Figure 1 shows Hα images of anewly-discovered nebula associatedwith PSR B0740-28 (Fig. 1a, top),and of the (previously known) bow-shock associated with PSR J0437-4715 (Fig. 1b, bottom). Each was takenthrough the 656/7 filter of SUSI2 and is1 arcmin on a side with north to the topand east to left. The B0740-28 image isthe result of nearly 2 hours of integra-tion while that for J0437-4715 was ob-tained in a little more than 30 minutes.The faint star directly behind the shockfront of J0437-4715 is a white dwarfcompanion to the pulsar (which is notseen in the optical). Both images weretreated using standard techniques forbias and flat-field signature removal,image registration and then co-addi-tion. CCD defects and cosmic rayswere removed using cross-pixel inter-polation on the final frame rather thanfiltering through the stack, in order topreserve as much of the faint nebulasignal as possible. A residual back-ground was subtracted separately fromthe B0740-28 image, presumably aris-ing from scattered moonlight on one ofthe nights. Finally, the nebula countswere top-hat filtered out and smoothedbefore being recombined with the origi-nal, to increase the contrast of the ob-ject against the sky background. The
continuum component was not sepa-rately observed and so has not beensubtracted in either case.
The images in Figure 1 show thenebula associated with PSR B0740-28to have a closed cometary morphology,more like the nebula around PSRB2224+65 (the “Guitar” nebula;Cordes, Romani & Lundgren 1993)than the open bow-shock of PSRJ0437-4715. Like the bow-shock asso-ciated with PSR B2224+65, the B0740-28 nebula has a distinct key-holeshape, with the spherical head of theshock-front protruding from the fannedtail. The position of the pulsar (about 1
arcsec to the left of the head of thebow-shock), and the measured prop-er motion for the pulsar of 29 mas/yrwestwards (Bailes et al. 1990), con-firm the bow-shock interpretation forthe nebula.
All of the pulsars with known bow-shock nebulae in the optical havehigh energy loss due to spin-downand/or high velocities (including therecent addition of PSR B0740-28).However, at the same time, they ex-hibit a diverse range of spin periods,ages and magnetic field strengths,highlighting the variety of pulsarwinds which can be probed by thesesources. The recently-discoverednebula associated with a so-called“radio-quiet” neutron star further ex-emplifies the variety of neutron starforms known to power nebulae (vanKerkwijk 2000, ESO press release19/00).
Detailed studies of nebular emis-sion, such as that carried out onB1957+20 by Aldcroft et al. (1992),enable a determination of not onlythe nature of the shock and the prop-erties of the ambient ISM, but also ofthe kinematic distance to the pulsar.Such a distance determination is es-sential of course in improving our un-derstanding of the individual system,but also allows an independent testof the pulsar distance scale as deter-mined by its dispersion measure. Weare currently in the process of doingthis for B0740-28, and in doing so,
solve another small piece of the puzzle.However, the first step towards a
general understanding of these fasci-nating objects is to build a sample ofthem sufficiently large that it canvassesthe full range of conditions encoun-tered. This is the main aim of our con-tinuing survey.
We would like to thank the NTT Teamfor their assistance with various as-pects of the run, particularly SupportAstronomers Stephane Brillant andPierre Leisy, and telescope operatorDuncan Castex.
References
Aldcroft et al., 1992, ApJ, 400, 638.Bailes et al., 1990, MNRAS, 247, 322.Cordes, Romani & Lundgren, 1993, Nature,
362, 133.Cordes, 1996, in IAU Colloq .160, p. 393.Kennel & Coroniti, 1984, ApJ, 283, 710.Kulkarni et al., 1992, Nature, 359, 300.Mann, Romani & Fruchter, 1999, BAAS,
195, 41.01. Michel, 1982, Rev Mod Phys, 54, 1.Rees & Gunn, 1974, MNRAS, 167, 1.
27
Discovery of a Bow-Shock Nebula Around thePulsar B0740-28H. JONES (ESO Chile); B. STAPPERS (University of Amsterdam); B. GAENSLER (MIT)
Figure 1: Two pulsar-powered bow-shocknebulae imaged in H on 4–5 January 2001at the NTT. (a) The newly-discovered nebu -la associated with PSR B0740-28 (the pul -sar is located about 1 arcsec to the left of thehead of the bow shock) and (b) the bow-shock associated with PSR J0437-4715.The star directly behind the shock front is acompanion to the pulsar which itself is notdetected in the optical. Images are 1 arcminon a side with north up, east left.
a
b

It is now well established by meansof direct and indirect observations thatmost, if not all, stars are formed ingroups rather than in isolation (Clarke,Bonnell & Hillenbrand 2000). An impor-tant result that strongly constrainstheories of massive star and stellarcluster formation is that the stellar den-sity of young stellar clusters seems todepend on the mass of the most mas-sive star in the cluster. Low-mass starsare usually found to form in loosegroups with typical densities of a fewstars per cubic parsec (Gomez et al.1993), while high-mass stars are foundwithin dense stellar clusters of up to 104
stars per cubic parsec (e.g. the OrionNebula Cluster, Hillenbrand & Hart-mann 1998). To explain this differentbehaviour, it has been proposed thatmassive stars may form with a processthat is drastically different from the stan-dard accretion picture, e.g. by coales-cence of lower mass seeds in a densecluster environment. The transition be-
tween these two modes of formationshould occur in the intermediate-massregime, namely 2 <~ M/M0 <~ 15.
In order to probe this transition, Testiet al. (1999) recently completed an ex-tensive near infrared (NIR) survey foryoung clusters around optically visibleintermediate-mass stars (Herbig Ae/Bestars) in the northern hemisphere. Themain result of this survey is that there isa strong correlation between the spec-tral type of the Herbig Ae/Be stars andthe membership number of the stellargroups around them. Furthermore,there is compelling evidence that themost massive stars in their sample aresurrounded by denser, not simply morepopulous clusters. These findings arein qualitative agreement with modelsthat suggest a causal relationship be-tween the birth of a massive star andthe presence of rich stellar clusters.The observed correlation and scatter,however, could also be explained interms of random assembling clusters
with membership size distribution of theform g(N) ~ N–1.7 picking stars from astandard IMP (Bonnell & Clarke 1999).In this view, since massive stars arerare objects compared to low-massstars, they will be observed only asmembers of large ensembles of stars(clusters), while the detection of an iso-lated high-mass star would have a rel-atively low probability. As discussed inTesti et al. (2001), there are two obser-vational strategies to provide additionalconstraints on which of the two modelsis the most appropriate: to expand thesample of optically revealed young Oand B stars to increase the statistics,and to search for clusters in completesamples of luminous embeddedsources in giant molecular clouds. Theyoung high-mass isolated objects pre-dicted by the random model should bedetected in such surveys. However, toproperly compare with the models, it isessential to carry out observationsaround the target luminous objects
28
Young Stellar Clusters in the Vela DMolecular CloudL. TESTI1, L. VANZI2, F. MASSI 3
1Osservatorio Astrofisico di Arcetri, Florence, Italy; 2European Southern Observatory, Santiago, Chile3Osservatorio Astronomico di Teramo, Teramo, Italy
Figure 1: NTT/SOFI near infrared “true-colour” images (J blue, H green, Ks red) of the fields centred on the luminous IRAS sources in theVela D molecular cloud. The sources are ordered by increasing far infrared (IRAS) luminosity from left to right and top to bottom.

complete down to at least 0.1–0.2 M0over a field of view large enough tocover the expected cluster size. TheNTT/SOFI combination, with the pro-vided field of view and sensitivity is anideal asset to collect the required dataand settle this fundamental issue.Moreover, due to the reduced extinctioncompared to the optical, the near in-frared bands (especially Ks) are themost effective for this type of studies, infact the young clusters are expected tobe at least partially embedded withintheir parent molecular cloud core. Inthis paper we report on the results of astudy of a complete sample of luminousIRAS sources in the Vela-D giant mo-lecular cloud.
1. The Vela-D Luminous IRASSources
Low-resolution observations in theCO(1–0) mm-line of the region of thegalactic plane defined by 255° m I m275°, –5° m b < +5° carried out byMurphy & May (1991) uncovered theexistence of an emission ridge in therange 0 m LSR m 15 km s–1 which waspromptly dubbed “Vela MolecularRidge” (VMR). These authors found themolecular gas complex to be made outof four main molecular clouds that theyindicated as A, B, C and D, ~ 105 M0each. Liseau et al. (1992) studied theassociation of luminous IRAS sourceswith the VMR and selected amongthem a complete sample of protostellarobjects based on IRAS colours, theirspectral slopes from the near- to thef a r-infrared and the velocity of theparental molecular gas. They also dis-cussed the distance of the VMR, con-cluding that clouds ACD are likely to belocated ~ 700 ± 200 pc from the Sun.
On this basis, they found no O-typestars recently having been formed inthe VMR, although birth of intermediate-mass stars is in progress. Massi et al.(1999, 2000) examined in detail NIRimages of the subsample of IRAS pro-tostellar sources (12) belonging to theD cloud, concluding that most of theirbolometric luminosity arises from singleyoung stellar objects (or close pairs ofyoung stellar objects) of intermediatemass embedded in young stellar clus-
ters. We selected the most luminous(Lbol > 103 L0) IRAS sources in thesubsample of Massi et al. (1999, 2000),namely IRS 17, 18, 19, 20 and 21 (fol-lowing the classification of Liseau et al.1992), adding IRS 16, a source not in-cluded by Liseau et al. (1992) in their fi-nal list of protostellar objects associat-ed with the VMR possibly because of itsfailure in fulfilling some of the ratherconservative selection criteria chosen,although lying toward an HII region.
Our observations were designed toreach at Ks band a completeness mag-nitude high enough to be sensitive to allstars more massive than 0.1 M0 in allthe clusters. From the observations ofMassi et al. (2000), the age of all knownyoung clusters in our sample is lessthan 1 Myr and the visual extinctionmuch less than 30 mag, as derivedfrom the brightest members of the clus-ters. Using the methods described inTesti et al. (1998) and the PMS evolu-tionary tracks from Palla & Stahler(1999), these constraints translate in arequired Ks completeness magnitude of~ 17, this figure having been used todesign the observing strategy and inte-gration times. The expected clustersizes were estimated from the Testi etal. (1999) and Massi et al. (2000) sur-veys, which found an average clusterradius of 0.2 pc, corresponding to ~ 1arcmin at the distance of the Vela Dcloud.
The clusters were observed withSOFI at the NTT through the J, H andKs broad-band filters and with the large-field objective offering an instanta-neous field coverage of ~ 5 arcmin with
29
Figure 2: Ks luminosity functions for the observed sample. For each field in the top panel weshow the observed K sLF at the image centre (black histogram) and at the edges (red shad -ed histogram), normalised to the same area. The estimated KsLF of each cluster, obtainedby subtracting the “edge” from the “central” K sLFs, are shown in the bottom panels as greenhistograms. The dotted vertical lines mark the Ks completeness magnitude.
Figure 3: (J–H) vs. (H–Ks) colour-colour diagrams for the six observed regions. Sources with -in one arcminute from the field centres are shown in green, sources further away are shownin blue. The red line marks the location of main sequence, non reddened stars. The redden -ing vectors are shown as dashed lines with a red cross every 5 magnitudes. Sources in theinner regions show on average redder colours, some of them exhibit an infrared excess, typ -ical of young stellar objects. Only very few sources are affected by extinction exceeding 25mags in the visual.

Figure 5: IC versusmaximum stellarmass for the lumi -nous young clustersin the Vela Dmolecular cloud(red open circles),compared with theresults toward lowluminosity sourcesin the same cloud(cyan open circles)and the HerbigAe/Be sample (bluefilled circles). Theprediction of the“random” model(see text) areshown in green:median results (sol -id line), 50% of therealisations(dashed lines), and 98% of the realisations (dottedlines).
a pixel scale of 0.292 arcsec. We inte-grated for ~ 15 minutes per filter andcluster. Object and sky were alterna-tively observed to have a good sam-pling of the background variations. Theimages were reduced following thestandard procedure and the “SpecialFlatField” technique. After combiningthe dithered frames, the final imagequality is ~ 0.85 arcsec for all fields butIRS 16, which was observed underworse seeing conditions (1.1 arcsec).
2. Results
In Figure 1 we show a subsection ofthe NTT/SOFI near infrared “true-colour” images of the fields surroundingthe six IRAS sources that we surveyed.From the images it is immediately clearthat we detected groups of very redsources in every field, and an increaseof the stellar surface density toward thecentre, where the luminous IRASsources are located, is also evident. Allclusters are embedded within a diffusenebulosity, likely due to cluster mem-bers light scattered toward the line ofsight by the dust in which the youngersources are still embedded. In a fewcases, IRS 17 and IRS 20 are the mostevident, we clearly detect in the Ksbroad-band filter the line emission fromcollimated jets (see also Massi et al.1997 for a narrow- band survey of theregion) emerging from the inner regionsof the clusters, confirming the youth ofthe objects.
More quantitatively the presence ofan excess of (relatively) bright sourcestoward the map centres can be madeclear by comparing Ks-band luminosity
functions of the central regions withthose of the image edges. In Figure 2,we show such comparison for all fieldson our sample. In all cases, the pres-ence of a cluster near the centre isclearly indicated by the excess of lumi-nous sources with respect to the edgeregions. In Figure 2 we also show theKs completeness magnitudes for eachfield. As expected, our observations aredeep enough to obtain a complete cen-sus of whole relevant young stellar pop-ulation in all clusters. Additionally, wenote that the derived cluster KsLFs areall sharply declining above our com-pleteness limits, suggesting that either
the relative number of sub-stellar ob-jects in the Vela D cluster is smallerthan in other cluster forming regions(such as the Orion Nebula Cluster,Hillenbrand & Carpenter 2000), or thatmost of the sources within the clustersare affected by a visual extinction muchlower than the Av = 30 mag value thatwe have assumed to compute the sen-sitivity estimates. This latter explana-tion is in agreement with the near in-frared colour-colour and colour-magni-tude diagrams shown in Figures 3 and4, where sources within 1 arcmin fromthe image centres are shown in green.On average, they show redder coloursthan sources further away from thecentre and a fraction of them dis-play a clear infrared excess, typical ofyoung stellar objects. In the figures, thereddening vectors and the main se-quence loci are also displayed, onlyvery few sources are consistent with anextinction greater than 20 mag in thevisual.
To obtain a quantitative estimate ofthe richness of the detected young stel-lar clusters, we followed the method de-scribed in Testi et al. (1999) and de-rived the richness indicator IC for all sixsources. IC gives the “effective” numberof cluster members, since it is definedas the integral of the radial Ks stellarsurface density profile centred on thepeak stellar surface density and cor-rected for the foreground/backgroundstellar density as computed on theedge of the images. In Figure 5, weshow IC as a function of the maximumstellar mass in each cluster for the high-luminosity sources in the Vela D cloudcompared with the results of Testi et al.(1999) toward Herbig Ae/Be systemsand the low luminosity sources in theVela D cloud (Massi et al. 2000). Themass sensitivity of our NTT survey issimilar to the estimated mass sensitivi-ty of the Herbig Ae/Be survey, while the
30
Figure 4: J vs. (H–Ks) colour-magnitude diagrams for the six observed regions. Sources with -in one arcminute from the field centres are shown in green, sources further away are shownin blue. The red line marks the location of main sequence, non reddened stars. The arrowsshow the direction of the reddening vectors and its length correspond to a visual extinction of20 mag.

Massi et al. survey of low-luminositysources in the Vela D cloud has aslightly lower sensitivity. The maximumstellar masses in the Vela clusters havebeen computed assuming that a frac-tion of the total luminosity ranging from30% to 100% is emitted by the mostmassive object. The young IRASsources in the Vela molecular cloudshow the same trend as the HerbigAe/Be stars: more massive stars aresurrounded by rich clusters, while low-mass stars are found in relative iso-lation.
In the same plot, the result of the var-ious surveys are compared with thepredictions of a “random samplingmodel” (as described in Testi et al.2001). Our results clearly deviate fromthe prediction of the model, since nomassive object is found in isolation, andall lie above the median predictions ofthe model. These results suggest thatthere is a physical connection betweenclusters and high-mass stars. T h i s
does not necessarily imply that mas-sive stars are formed by coalescence in(proto-)cluster environments, but sug-gests that the conditions to form a mas-sive star are such that this process isassociated with the formation of acluster of (lower-mass) objects. The clus-ter could be either the catalyst of high-mass star formation or a by-product of it.
These conclusions should and will bemade more firm by combining largersamples from various surveys towarddifferent regions.
References
Bonnell I. A., & Clarke C. J., 1999, MNRAS,309, 461.
Clarke C. J., Bonnell I. A., & Hillenbrand L.A., 2000, in Protostars and Planets IV,eds. V. Mannings, A. Boss & S. S. Russell(Tucson: University of Arizona press), p.151.
Gomez M., Hartmann L., Kenyon S. J.,Hewett R., 1993, AJ, 105, 1927.
Hillenbrand L. A. & Hartmann L. W., 1998,ApJ, 492, 540.
Hillenbrand L. A. & Carpenter J. M., 2000,ApJ, 540, 236.
Liseau R., Lorenzetti D., Nisini B., SpinoglioL., Moneti A., 1992, A&A 265, 577.
Massi F., Lorenzetti D., Vitali F.: “NearInfrared H2 imaging of YSOs in VelaMolecular Clouds” in Malbet F., Castets A.(eds.), Low Mass Star Formation fromInfall to Outflow – Poster Proceedings ofthe IAU Symposium n. 182 onHerbig-Haro Flows and the Birth of LowMass Stars, Observatoire de Grenoble1997.
Massi F., Giannini T., Lorenzetti D. et al.,1999, A&AS 136, 471.
Massi F., Lorenzetti D., Giannini T., Vitali F.,2000, A&A 353, 598.
Murphy D. C., May J., 1991, A&A 247, 202.Palla F. & Stahler S.W., 1999, ApJ, 525, 772.Testi L., Palla F., Natta A., 1998, A&AS, 133,
81.Testi L., Palla F., Natta A., 1999, A&A, 342,
515.Testi L, Palla F., Natta A., 2001, in “From
Darkness to Light”, eds. T. Montmerle andPh. André, ASP Conf. Series, in press.
31
Building Luminous Blue Compact Galaxies by MergingP. AMRAM1 AND G. ÖSTLIN 2
1Observatoire de Marseille, France; 2Stockholm Observatory, Sweden
1. Introduction
A Blue Compact Galaxy (BCG) ischaracterised by blue optical colours,–21 < MB < –12, an HII-region-likeemission-line spectrum, a compact ap-pearance on photographic sky-surveyplates, small to intermediate sizes, highstar-formation rates per unit luminosityand low chemical abundances (e.g.Searle and Sergent, 1972). Moreover,most BCGs are rich in neutral hydro-gen. There is no consensus on theprocess(es) that trigger the bursts ofstar formation. Three main scenarioshave been proposed to explain it: (1)cyclic infall of cooled gas: Starbursts
are terminated by SN winds, but whengas later accretes back, a new star-burst may be ignited; (2) galaxy inter-actions and (3) collapse of protocloud ifBCGs are genuinely young galaxies.Most arguments have been based onphotometry alone. On the other hand,the dynamics of these systems are notwell explored, still the creation of an en-ergetic event like a sudden burst of starformation is likely to have dynamicalcauses and impacts, complicating theinterpretation.
To improve our understanding of thedynamics and the triggering mecha-nisms behind the starburst activity, wehave obtained Fabry-Perot data allow-
ing us to achieve two-dimensional ve-locity fields with both high spatial andspectral (velocity) resolutions. BCGsare obviously the galaxies for which 2-D data are absolutely requested due tothe non-axisymmetry of the velocityfield around the centre of mass.
The selected BCGs are among themore luminous ones known in the near-by universe. The galaxies were ob-served at the Hα-emission line with theESO 3.6-m telescope on La Silla. Theexposure times ranged between 24minutes and 160 minutes. In Östlin etal. (1999), we presented and describedthe data: Hα images, velocity fields,continuum maps and rotation curves. In
ABSTRACT
Observations of six luminous blue compact galaxies (LBCGs) and two star-forming companion galaxies werecarried out with the CIGALE scanning Fabry-Perot interferometer attached to the ESO 3.6-m telescope, tar -geting the H emission line. The gaseous velocity field presents large-scale peculiarities, strong deviations topure circular motions and sometimes, secondary dynamical components. In about half the cases, the observedrotational velocities are too small to allow for pure rotational support. If the gas and stars are dynamically cou -pled, a possible explanation is either that velocity dispersion dominates the gravitational support or the galax -ies are not in dynamical equilibrium, because they are involved in mergers, explaining the peculiar kinematics.In two cases, we find evidence for the presence of dark matter within the extent of the H rotation curves andin two other cases we find marginal evidence. For most of the galaxies of the present sample, the observedpeculiarities have probably as origin merging processes; in five cases, the merger hypothesis is the best wayto explain the ignition of the starbursts. This is the most extensive study as yet of optical velocity fields of lu -minous blue compact galaxies.

Östlin et al. (2001), we will discuss theinterpretation of these observationsand their implications on the dynamics,the mass distribution and the triggeringmechanism behind the starbursts.
In this paper, we give a flavour of theobservations and provide some de-scriptions of two galaxies: ESO 350-IG38 and ESO 338-IG04. Then, wepoint out the hot spots of the sampleand suggest an interpretation.
2. A Scanning Fabry-Perot Inter-ferometer on the ESO 3.6-m
The instrument CIGALE attached tothe Cassegrain focus of the ESO 3.6-mwas used for the observations. CIGALEis basically composed of a focal reducer,a scanning Fabry-Perot interferometer,an interference filter and an IPCS (Im-age Photon Compting System). CI-GALE (for Cinématique des GALaxiEs)is a visiting instrument belonging toMarseille Observatory, mounted for thefirst time on the ESO 3.6-m in 1991 andcommissioned on the average for onerun a year since that time. (In fact, aFabry-Perot etalon plus an image tubehas been mounted on the ESO 3.6-mby the Marseille team for the first timein 1979, see Marcelin et al., 1982). Withthe efficient cooperation of the 3.6-mESO team and of the astro-workshop,using the facilities of the telescope, theinstrument is easily mounted during thedaytime of the first observing night.Several replica of this instrument existthroughout the world, one of them ispresently extensively used on the OHP1.93-m telescope (Observatoire deHaute-Provence, France) to provide asample of about 200 velocity fields ofnearby galaxies (the GHASP’s project– Gassendi HAlpha SPiral galaxies sur-vey – see h t t p : / / w w w-o b s . c u r s m r s . f r /i n t e r f e r o m e t r i e / G H A S P / g h a s p . h t m l ).
The instrument CIGALE based at LaSilla is used both on the ESO 3.6-mand on the Marseille 36-cm telescope.On the Marseille telescope, CIGALEhas a wide field of view (40 arcminsquare) and is used to make a kine-matical deep Hα survey of gaseousemission regions in the Milky Way andin the Magellanic Clouds (see for in-stance Georgelin et al., 2000). On the3.6-m, CIGALE has a one hundredtimes smaller field (~ 4 arcmin square,providing a pixel size of 0.91 arcsec).The spectral scanning step depends onthe interferometer used, it was of 4.8km s–1 for the present study. A full de-scription of the instrument CIGALE isgiven in a previous paper in T h eMessenger (Amram et al., 1991). Bythe way, a previous discussion in TheMessenger on BCGs (Infants of theUniverse?) including ESO 338-I G 0 4can be found in Bergvall & Olofsson(1984). Data reduction was performedusing the http available ADHOCw soft-ware (http://www-o b s . c n r s-mrs.friadhoc/adhoc.html); a complete data-reductionprocedure is given for instance inAmram et al. (1991, 1996). In August1999 and in September 2000, two ma-jor upgrades were realised on CIGALE:the data-acquisition system and the re-ceptor were removed. (1) Two hundredkg of electronics were substituted by aMatrox board allowing the acquisition offrames 1024 × 1024 px2 at high fre-quency and the computation in realtime of the events on each frame.(2) The 20-year old Thomson IPCS wasreplaced by a new AsGa IPCS. Thes e m i-conductor photocathode A s G a(built by Hamamatsu) of the new de-tector offers a d.q.e. five times higher(25% instead of 5% for the oldThompson IPCS). The output of theAsGa tube is coupled by opticalfibers to a 1024 × 1024 CCD. (http://
w w w. o b s . c n r s-m r s . f r / i n t e r f e r o m e t r i e /instrumentation.html#AsGa). T h eIPCS, with a time resolution of 1/50second and zero readout noise makesit possible to scan the interferometerrapidly, avoiding problems with varyingsky transparency, airmass and seeingduring long exposures; and thus hasseveral advantages over a CCD for thisapplication. Figure 1 compares the totalefficiency of a CCD and an IPCS usedin narrow-band imaging (left) and inmultiplex application (right). It clearlyshows that at low intensity level, thesignal-to-noise ratio is much higher withan IPCS than with a CCD in the case ofmultiplex observations as for instancescanning Fabry-Perot interferometry.Figure 1 has been plotted from a simu-lation of one hour exposure time on an8-metre telescope, for a pixel size of0.25 arcsec square, 48 scanning chan-nels, transmissions of: 80% for the at-mosphere; 64% for the 2 mirrors of thetelescope; 70% for the interference fil-ter; 80% for the optics and 90% for theFabry-Perot (Gach et al., 2001). Thedata presented here were obtained inAugust 1995 with the old system; newobservations were performed for anoth-er 15 BCGs, extending down to fainterluminosities in 1999 and 2000 with thenew system, this will allow us to obtaina more comprehensive picture on theevolution of BCGs.
3. Results: Description of TwoBGCs
3.1 ESO 350-IG38 (Haro 11)
The morphology of this object is com-plex. The three bright starburst nucleiare composed of numerous individualsuper star clusters (MV M –15, Östlin,2000) as it can be seen for anHST/WFPC2 image (Fig. 2 – left,
32
Figure 1: Comparison of the performances, expressed in terms of signal-to-noise ratio vs. the flux of the extended source for two CCDs (withdifferent quantum efficiency) and an AsGa IPCS in a narrow-band imaging application (left) and in a multiplex application like a scanningFabry-Perot interferometer (right). See text for further details.

Malkan et al. 1998). The properties ofthe central regions bear a close resem-blance with the classical collidinggalaxies NGC 4038/4039 as seen inHST data (Whitmore and Schweizer1995). This galaxy is the most massivein the whole sample and also has thehighest star-formation rate (~ 20M0/yr). The inferred supernova (SNtype II) frequency is one every 7 years.Surprisingly, the galaxy is very lumi-nous in IR but seems to be rather de-
void of cool gas (MHI < 108 M0 = de-tection limit) despite a very high star-formation rate (Bergvall et al., 2000).This suggests that either the starburstis about to run out of fuel or the gas isto a large extent in molecular andionised form as suggested by calcula-tion. The outer isocontours are distort-ed out to very faint isophotal levels (µRP 26 mag/arcsec2) on broad-band im-ages (Fig. 2 – right). This is still visiblebut less extended in the Hα line demon-
strating that thelight originatesmainly in stars.Hence, the large-scale distributionof stars in thisgalaxy is highlyasymmetric. At allisophotal levels an
extension in the south-east is evident.This may be a tidal tail in developmentor most likely the remnants of such.
The Hα line profiles of this galaxy arebroad, up to FWHM = 270 km/s, andhave non-gaussian shape. This sug-gests that two or more non-virialisedcomponents may be present. In thecentre, double peaked lines are presentconsistent with the presence of acounter rotating disk or high velocityblobs. This galaxy presents a strongcentral velocity gradient and large-scale distortions (see Fig. 4 – up). If wedo not decompose the velocity field inseveral components, the rapid increaseof the rotation curve is followed by akeplerian decrease. Alternatively, if wedisentangle two possible components,the main one (in terms of intensity andextension) provides a low-velocity am-plitude flat rotation curve while the sec-ond one gives a high-velocity amplitudebut only in the central parts of thegalaxy (see Fig. 5 – left). These prop-erties indicate that the centre is not dy-namically relaxed, while the outer ve-locity field shows a very slow rotation.The estimated stellar mass densityexceeds by far what can be supportedby the observed amount of rotation(G 30 km/s). Thus the galaxy is eithernot in equilibrium, or it is not primarilysupported by rotation. These proper-ties strongly suggest that the starbursthas been triggered by a mergerprocess.
3.2 ESO 338-IG04(Tololo 1924-416)
HST observations of this well-knownstarburst (see Fig. 4 – left, Östlin et al.,1998) have revealed that in addition to
33
Figure 2: ESO 350-IG38. North is up, East is left. (Left): HST/WFPC2 V+R (F606W) broad-band image. The scale of the box is 24 arcsecsquare. (Right): R-band CCD image. Note the irregular morphology at all isophotal levels. The faintest visible structures are µR P 26 mag/arc -sec2. The size of the field is 1 by 1 arcminute, corresponding to 23 23 kpc.
Figure 3: Ve l o c i t yfields for ESO 350-IG38 (up) and ESO3 3 8-IG04 (bottom).The two galaxieshave the same pixelsize (0.91 arcsec/px) and scale onthe image; the hori -zontal size of thebox is 42 arcsec.ESO 350-IG38: Thevelocity amplituderanges linearly fromviolet (6220 km s–1)to white (6300 kms– 1) .E S O 3 3 8-IG04: Thevelocity amplituderanges linearly fromviolet (2750 km s–1)to white (2850 kms–1).
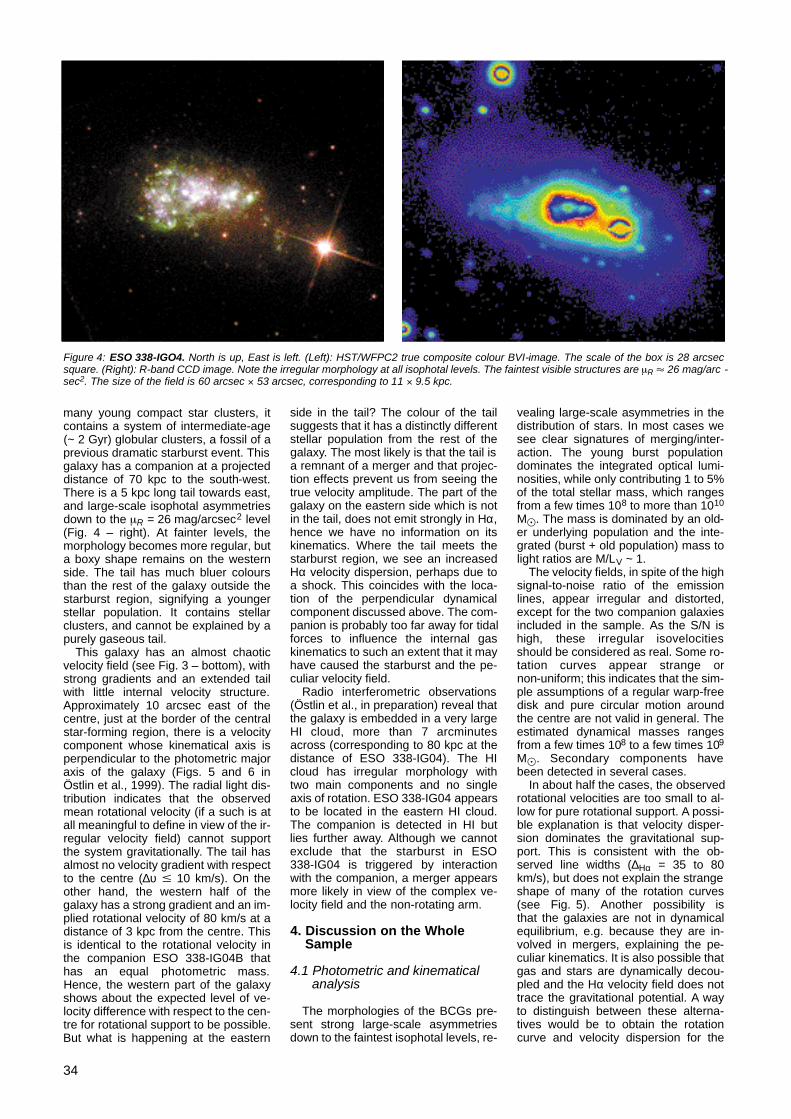
many young compact star clusters, itcontains a system of intermediate-age(~ 2 Gyr) globular clusters, a fossil of aprevious dramatic starburst event. Thisgalaxy has a companion at a projecteddistance of 70 kpc to the south-west.There is a 5 kpc long tail towards east,and large-scale isophotal asymmetriesdown to the R = 26 mag/arcsec2 level(Fig. 4 – right). At fainter levels, themorphology becomes more regular, buta boxy shape remains on the westernside. The tail has much bluer coloursthan the rest of the galaxy outside thestarburst region, signifying a youngerstellar population. It contains stellarclusters, and cannot be explained by apurely gaseous tail.
This galaxy has an almost chaoticvelocity field (see Fig. 3 – bottom), withstrong gradients and an extended tailwith little internal velocity structure.Approximately 10 arcsec east of thecentre, just at the border of the centralstar-forming region, there is a velocitycomponent whose kinematical axis isperpendicular to the photometric majoraxis of the galaxy (Figs. 5 and 6 inÖstlin et al., 1999). The radial light dis-tribution indicates that the observedmean rotational velocity (if a such is atall meaningful to define in view of the ir-regular velocity field) cannot supportthe system gravitationally. The tail hasalmost no velocity gradient with respectto the centre (∆υ m 10 km/s). On theother hand, the western half of thegalaxy has a strong gradient and an im-plied rotational velocity of 80 km/s at adistance of 3 kpc from the centre. Thisis identical to the rotational velocity inthe companion ESO 338-IG04B thathas an equal photometric mass.Hence, the western part of the galaxyshows about the expected level of ve-locity difference with respect to the cen-tre for rotational support to be possible.But what is happening at the eastern
side in the tail? The colour of the tailsuggests that it has a distinctly differentstellar population from the rest of thegalaxy. The most likely is that the tail isa remnant of a merger and that projec-tion effects prevent us from seeing thetrue velocity amplitude. The part of thegalaxy on the eastern side which is notin the tail, does not emit strongly in Hα,hence we have no information on itskinematics. Where the tail meets thestarburst region, we see an increasedHα velocity dispersion, perhaps due toa shock. This coincides with the loca-tion of the perpendicular dynamicalcomponent discussed above. The com-panion is probably too far away for tidalforces to influence the internal gaskinematics to such an extent that it mayhave caused the starburst and the pe-culiar velocity field.
Radio interferometric observations(Östlin et al., in preparation) reveal thatthe galaxy is embedded in a very largeHI cloud, more than 7 arcminutesacross (corresponding to 80 kpc at thedistance of ESO 338-IG04). The HIcloud has irregular morphology withtwo main components and no singleaxis of rotation. ESO 338-IG04 appearsto be located in the eastern HI cloud.The companion is detected in HI butlies further away. Although we cannotexclude that the starburst in ESO3 3 8-IG04 is triggered by interactionwith the companion, a merger appearsmore likely in view of the complex ve-locity field and the non-rotating arm.
4. Discussion on the WholeSample
4.1 Photometric and kinematicalanalysis
The morphologies of the BCGs pre-sent strong large-scale asymmetriesdown to the faintest isophotal levels, re-
vealing large-scale asymmetries in thedistribution of stars. In most cases wesee clear signatures of merging/inter-action. The young burst populationdominates the integrated optical lumi-nosities, while only contributing 1 to 5%of the total stellar mass, which rangesfrom a few times 108 to more than 1010
M0. The mass is dominated by an old-er underlying population and the inte-grated (burst + old population) mass tolight ratios are M/LV ~ 1.
The velocity fields, in spite of the highsignal-to-noise ratio of the emissionlines, appear irregular and distorted,except for the two companion galaxiesincluded in the sample. As the S/N ishigh, these irregular isovelocitiesshould be considered as real. Some ro-tation curves appear strange ornon-uniform; this indicates that the sim-ple assumptions of a regular warp-freedisk and pure circular motion aroundthe centre are not valid in general. Theestimated dynamical masses rangesfrom a few times 108 to a few times 109
M0. Secondary components havebeen detected in several cases.
In about half the cases, the observedrotational velocities are too small to al-low for pure rotational support. A possi-ble explanation is that velocity disper-sion dominates the gravitational sup-port. This is consistent with the ob-served line widths (∆Hα = 35 to 80km/s), but does not explain the strangeshape of many of the rotation curves(see Fig. 5). Another possibility isthat the galaxies are not in dynamicalequilibrium, e.g. because they are in-volved in mergers, explaining the pe-culiar kinematics. It is also possible thatgas and stars are dynamically decou-pled and the Hα velocity field does nottrace the gravitational potential. A wayto distinguish between these alterna-tives would be to obtain the rotationcurve and velocity dispersion for the
34
Figure 4: ESO 338-IGO4. North is up, East is left. (Left): HST/WFPC2 true composite colour BVI-image. The scale of the box is 28 arcsecsquare. (Right): R-band CCD image. Note the irregular morphology at all isophotal levels. The faintest visible structures are R P 26 mag/arc -sec2. The size of the field is 60 arcsec 53 arcsec, corresponding to 11 9.5 kpc.

stellar component. In two cases, wefind evidence for the presence of darkmatter within the extent of the Hα r o t a-tion curves, and in two other cases wefind marginal evidence. Indeed, evenwith a maximum disk model, the rota-tion curves computed from the surfacebrightness profiles cannot fit the ob-served rotation curve without an addi-tional dark halo component.
4.2 Spectral Evolutionary Modelsand Dynamical Analysis
Spectral evolutionary synthesis mod-els in combination with colour profiles inthe optical and near infrared are usedto estimate the mass to light ratios(M/L) of the galaxies (the models aredescribed in Bergvall and Rönnback,1995). Photometric mass distributionswere derived by integrating the lumi-nosity profiles for the disk and burstcomponents and using their corre-sponding M/L values. The photometricmass distributions are further com-pared to dynamical mass models (seeFig. 5). From B-band surface bright-ness photometry, an exponential diskhas been separated from the burstby extrapolation of the profile of theouter regions where the contribution tothe burst is marginal. The photometricM/L of the disks and of the bursts havebeen evaluated by matching the ob-served colours to extended sets ofmodels with different IMF, mass limit
and star-formation histories (Östlin etal., 2001). The photometric total mass-es of the disk and of the burst havebeen obtained by integrating the lumi-nosities with the M/L values in the al-lowed range. The dynamical M/L of thedisk have been computed using at w o-component (exponential disk +dark halo) best-fit mass model or max-imum disk model (Carignan, 1985). Inmost cases, the M/L obtained from thedynamical mass models are lower thanthe ones obtained from the spectralevolutionary synthesis models. T h i smeans that the dynamical mass is un-der-evaluated, the velocity fields beingdisturbed by non-circular motionsor/and that the galaxies are not rota-tionally supported.
4.3 Merging in Process
For this sample of LBCGs, two kindsof perturbation are probably in compe-tition: (1) merging processes distortingthe velocity fields at large scale and (2)winds driven by starbursts strongly dis-turbing the circular motion of theionised gas at smaller scales. Merging,interaction and wind driven by super-novae can induce non-circular motionsof high amplitude to the gas. Then, dueto dissipative collisions, the gas is prob-ably decoupled from the rotation of thestars which constitute the dominantmass of the disk. Stars and gas arethen decoupled due to dissipative colli-
sions in the gaseous component of thegalaxies. Furthermore, the gas be-comes a bad tracer of the potential wellbut a good tracer of starburst activity.Stars should be a better tracer of thepotential well but their observationspresent difficulties due to the weaknessof the continuum emission and absorp-tion lines in this class of galaxies.
When considering the kinematicsand morphologies of this sample of lu-minous BCGs, we are led to the con-clusion that dwarf galaxy mergers arethe favoured explanation for the star-bursts. The dynamics of the studiedgalaxies fall into two broad classes: onewith well behaving rotation curves atlarge radii and one with very perturbeddynamics. This may indicate a distinc-tion of the fate of these galaxies, oncethe starbursts fade. Alternatively, de-pending on the state in which we seethe interaction/merger, we will detectmore or less chaotic velocity maps.
5. Perspectives
Dwarf galaxies are very common ob-jects in the universe; compact galaxies(CGs) are frequent and blue compactgalaxies (BCGs) are not rare. At highredshift, gas-rich dwarf galaxies andperhaps also CGs even can be thebuilding blocks of the larger galaxies,merge and form stars during episodicprocesses in their evolution. The lumi-nous blue compact galaxies (LBCGs)
35
Figure 5: Mass model for ESO 350-IG38 (left) and ESO 338-IG04 (right). The solid line is the photometric rotation curve for the disk compo -nent; and the green shaded area is the allowed range based on the uncertainty in M/L. The filled circles show both sides’averaged observedrotation curves, the error bars represent mainly the deviation to pure circular motions. ESO 350-IG38 (left): the blue open symbols show therotation curve based on the decomposed velocity field. The blue open circles correspond to the main component; the secondary component,which is counter rotating is shown by the blue open squares. The maximum disk model (in order to provide an upper limit of the (M/L)disk)has been computed on the main component. The dash-dot red line is the stellar disk component from the mass model and the crosses is thehalo component (red crosses). As the halo component is very faint, the total model (disk + halo) matches the stellar component. ESO338-IG04 (right): The blue open symbols show both sides of the rotation curve. The blue open circles correspond to the receding side while theapproaching one is shown by the blue open squares. Due to the disagreement between the approaching and the receding sides, the aver -aged rotation curves do not represent the axisymmetric potential well of the galaxy, the instrumental accuracy of the velocity being 2–3 km/sat high signal-to-noise ratio. Furthermore, no dynamical model can be plotted for this galaxy.

have luminosities and properties similarto galaxies seen at intermediate red-shifts (e.g. Guzman et al., 1997).Moreover, they are among the leastmassive/luminous galaxies that arepossible probes also at high redshifts.The sample of LBCGs presented hereis not representative of classical BCGsbut can be regarded as a referencesample for high redshift LBCGs, forwhich, moreover, observations presenta serious bias. Even if there are evolu-tionary processes that make distantgalaxies unique, the evolutionary histo-ry of a galaxy is not only a time-de-pendent parameter but it may alsostrongly depend on the environment.Furthermore, LBCGs can be thought ofas nearby sites which mimic galaxy in-teraction, merging and the star trigger-ing in higher-density environments ofthe young universe.
These local dwarf galaxy mergersmay be the best analogues of hierar-chical build-up of more massive galax-ies at high redshifts.
Acknowledgements
We would like to thank our collabora-tors Nils Bergvall, Josefa Masegosa,Jacques Boulesteix and IsabelMarquez for their contributions to thiswork. Jean-Luc Gach from MarseilleObservatory is thanked for providingthe computations for Figure 1. NilsBergvall is thanked for his commentsand his careful reading of this paper.The 3.6-m ESO and the astroworkshopteams are thanked for providing effi-cient support during the set-up of the in-strument.
References
Amram P., Boulesteix J., Georgelin Y.M. etal., 1991, The Messenger, 64, 44.
Amram P., Balkowski C., Boulesteix J. et al.,1996, A& A, 310, 737.
Bergvall N. and Olofsson K., 1984, TheMessenger 38, 2.
Bergvall N., Masegosa J., Östlin G. andCernicharo J., 2000, A&A 359, 41.
Bergvall N., Rönnback J., 1995, MNRAS273, 603.
Carignan C., 1985, ApJ 299, 59.Östlin G., in “Massive Stellar Clusters”, A.
Lancon and C. Boily Eds., 2000, ASPConf. Ser. 211, p. 63.
Östlin G., Amram P., Masegosa J., BergvallN., Boulesteix J., 1999, A&AS, 137, 419.
Östlin G., Amram P., Masegosa J., BergvallN., Boulesteix J. and Marquez I. 2001, tobe submitted.
Östlin G., Bergvall N., Rönnback J., 1998,A&A 335, 85.
Gach J.L. et al., 2001, in preparation forApJS.
Guzman R., Gallego J., Koo D.V. et al.,1997, ApJ. 489, 559.
Georgelin Y.M., Russeil D., Amram P. et al.,2000, A& A 357, 308.
Malkan, Gorjian and Tam, 1998, ApJS 117,25.
Marcelin, M.; Boulesteix, J.; Courtes, G.;Milliard, B. Nature, vol. 297, May 6, 1982,p. 38–42.
Searle L. and Sargent W.L.W., 1972, ApJ.173, 25.
Whitmore B., Schweizer F., 1995, AJ 109,960.
36
ESO VACANCYApplications are invited for the position of
Head of the Office for Science Assignment: A strong research-oriented scientific staff with diverse expertise is essential to fulfil ESO’s mandateof providing and maintaining international competitive observatories for its community of users. In this context theHead of the Office for Science will be responsible to the Director General for the science policies, and the maintasks will be
• to foster science across the entire Organisation and increase the exchange between ESO Chile andGarching;
• to support the efforts of ESO staff to conduct science at a high level; • to provide a reference point for young scientists; • to pursue actively the Fellowship, Studentship, Visitor programmes and carry out scientific exchanges
with the European community through a strong and attractive Workshop Programme; • to be the ESO representative at the International Research School recently created in the Munich area.
Experience and knowledge: Candidates must have an outstanding record of achievement in one or more areasof modern astrophysics and preferably be widely experienced in the use of large ground-based optical and/or ra-dio telescopes. Excellent communication and management skills and a strong sense of team spirit are essential.
Duty station: Garching near Munich, Germany, with regular trips to Chile.
Starting date: 1 September 2001 or later.
We offer an attractive remuneration package including a competitive salary (tax free), comprehensive social ben-efits and financial help in relocating your family. The initial contract is for a period of three years with the possibili-ty of a fixed-term extension. Serious consideration will be given to outstanding candidates willing to be secondedto ESO on extended leaves from their home institutions. Either the title or the grade may be subject to changeaccording to education and the number of years of experience. If you are interested in working in areas of front-line science and technology in a stimulating internationalresearch environment, please send us your CV (in English language) and the ESO Application Form (to beobtained from the ESO Home Page at http://www.eso.org/) and four letters of reference
before 15 May 2001.
For further information, please consult the ESO Home Page.

EIS Data on the Chandra Deep Field South ReleasedThe purpose of this note is to an-
nounce that the ESO Imaging Surveyprogramme has released a full set ofoptical/infrared data covering the so-called Chandra Deep Field South(CDF-S) rapidly becoming a favouredtarget for cosmological studies in thesouthern hemisphere. The field wasoriginally selected for deep X-ray ob-servations with Chandra and XMM. Theformer have already been completed pro-ducing the deepest high-resolution X-ray
image ever taken with a total integrationtime of one million seconds. The dataobtained by EIS include J and Ks infra-red observations of an area of 0.1square degree nearly matching theChandra image down to JAB ~ 23.4 andKAB ~ 22.6 and UU’BVRI optical obser-vations over 0.25 square degree,matching the XMM field of view, reach-ing 5 σ limiting magnitudes of U’AB =26.0, UAB = 25.7, BAB = 26.4, VAB =25.4, RA B = 25.5 and IA B = 24.7 mag, as
measured within a 2 × FWHM aperture.Given the general interest on this
field, fully calibrated images and asso-ciated weight maps as well as sourcelists have been made available world-wide on February 16, 2001 and March5, 2001. The data can be requestedthrough the URL “http://www.eso.org/eis”. A first impression of the data is giv-en by the colour composite imageshown below which combines U, R,and J+K infrared images.
OTHER A S T R O N O M I C A L N E W S

A N N O U N C E M E N T S
ESO Studentship Programme 2001The European Southern Observatory research student programme aims at providing the opportunities and the facilities to en-hance the post-graduate programmes of ESO member-state universities by bringing young scientists into close contact with theinstruments, activities, and people at one of the world’s foremost observatories. For more information about ESO’s astronomi-cal research activities please consult Research Projects and Activities (http://www.eso.org/science/ or http://www.eso.org/proj-ects/).
Students in the programme work on an advanced research degree under the formal tutelage of their home university and de-partment, but come to either Garching or Vitacura-Santiago for a stay of normally up to two years to conduct part of their stud-ies under the supervision of an ESO staff astronomer. Candidates and their national supervisors should agree on a researchproject together with the potential ESO local supervisor. This research programme should be described in the application andthe name of the ESO local supervisor should also be mentioned. It is highly recommended that the applicants start their Ph.D.studies at their home institute before continuing their Ph.D. work and developing observational expertise at ESO.
The ESO studentship programme comprises about 14 positions, so that each year a total of up to 7 new studentships are avail-able either at the ESO Headquarters in Garching or in Chile at the Vitacura Quarters. These positions are open to students en-rolled in a Ph.D. programme in the ESO member states and exceptionally at a university outside the ESO member states.
The closing date for applications is June 15, 2001.
Please apply by using the ESO Studentship application form available on-line (http://www.eso.org/gen-fac/adm/pers/forms/).
European Southern Observatory Studentship ProgrammeKarl-Schwarzschild-Str. 285748 Garching bei Mü[email protected]
P E R S O N N E L M O V E M E N T S
International Staff
(January – March 2001)
ARRIVALS
EUROPE
BRANDNER, Wolfgang (D), Adaptive Optics InstrumentScientist
CHATZIMINAOGLOU, Evanthia (GR), Associate EISCONAN, Rodolphe (F), AssociateCONDORELLI, Livio (I), VLT Software System Manager
for UNIX computers DEMARCO, Ricardo (RCH), StudentEKVALL, Jenny (S), AssociateHACKENBERG, Wolfgang (D), Laser SpecialistKORNMESSER, Martin (D), Graphics DesignerLAMPERSBERGER, Brigitte (D), AssociateMARCHETTI, Enrico (I), Associate NELSON, Martine (UK), Division Secretary/AssistantTRIPICCHIO, Alfredo (I), AssociateVAN BOEKEL, Roy (NL), StudentVANZELLA, Eros (I), Student
CHILE
BAUVIR, Bertrand (B), Software EngineerHOUSEN, Nico (B), Software EngineerHUBRIG, Swetlana (D), Operations Staf f AstronomerMOREL, Sébastien (F), VLTI Instrument OperatorSCHÜTZ, Oliver (D), Student
38
SLUSE, Dominique (B), StudentWITTKOWSKI, Markus (D), VLTI AstronomerWOODS, Paul (UK), Student
DEPARTURES
EUROPE
TORWIE-SCHMER, Claudia (D), Accounting Assistant
Local Staff(December 2000 – March 2001)
ARRIVALS
ALARCON, Hector, Telescope Instruments Operator,Paranal
GODOY, Angelina, Bilingual Secretary, SantiagoHERRERA, Cristian, Telescope Instruments Operator,
ParanalMORALES, Alex, Maintenance Engineer, ParanalROJAS, Manuel, Telescope Instruments Operator, Paranal
DEPARTURES
ABUTER, Roberto, Software Engineer, ParanalALVAREZ, Roberto, Bilingual Secretary, ParanalBROWNING, Victoria, Paranal Administrator, ParanalFIGUEROA, Edgardo, Precision Mechanics, La SillaMARTIN, Gabriel, Telescope Instruments Operator, La SillaRAHMER, Gustavo, Optical Detector Engineer, Paranal


ESO, the European Southern Observa-tory, was created in 1962 to “… establishand operate an astronomical observatoryin the southern hemisphere, equippedwith powerful instruments, with the aim offurthering and organising collaboration inastronomy …” It is supported by eightcountries: Belgium, Denmark, France,Germany, Italy, the Netherlands, Swedenand Switzerland. ESO operates at twosites. It operates the La Silla observatoryin the Atacama desert, 600 km north ofSantiago de Chile, at 2,400 m altitude,where several optical telescopes with di-ameters up to 3.6 m and a 15-m submil-limetre radio telescope (SEST) are now inoperation. In addition, ESO is in theprocess of building the Very LargeTelescope (VLT) on Paranal, a 2,600 mhigh mountain approximately 130 kmsouth of Antofagasta, in the driest part ofthe Atacama desert. The VLT consists offour 8.2-metre and three 1.8-metre tele-scopes. These telescopes can also beused in combination as a giant interferom-eter (VLTI). In April 1999, the first 8.2-me-tre telescope (called ANTU) started regu-lar operation, and also the three otherones (KUEYEN, MELIPAL and YEPUN)have already delivered pictures of excel-lent quality. Over 1200 proposals aremade each year for the use of the ESOtelescopes. The ESO Headquarters arelocated in Garching, near Munich, Ger-many. This is the scientific, technical andadministrative centre of ESO where tech-nical development programmes are car-ried out to provide the La Silla and Paranalobservatories with the most advanced in-struments. There are also extensive as-tronomical data facilities. In Europe ESOemploys about 200 international staffmembers, Fellows and Associates; inChile about 70 and, in addition, about 130local staff members.
The ESO MESSENGER is published fourtimes a year: normally in March, June,September and December. ESO also pub-lishes Conference Proceedings, Pre-prints, Technical Notes and other materialconnected to its activities. Press Releasesinform the media about particular events.For further information, contact the ESOEducation and Public Relations Depart-ment at the following address:
EUROPEAN SOUTHERN OBSERVATORYKarl-Schwarzschild-Str. 2 D-85748 Garching bei München Germany Tel. (089) 320 06-0 Telefax (089) [email protected] (internet) URL: http://www.eso.orghttp://www.eso.org/gen-fac/pubs/messenger/
The ESO Messenger:Editor: Marie-Hélène DemoulinTechnical editor: Kurt Kjär
Printed by J. Gotteswinter GmbHBuch- und OffsetdruckJoseph-Dollinger-Bogen 22D-80807 MünchenGermany
ISSN 0722-6691
1408. E. Scannapieco and T. Broadhurst:Linking the Metallicity Distribution ofGalactic Halo Stars to the EnrichmentHistory of the Universe. ApJ Letters.
1409. M. Rejkuba: Deep VLT Search forGlobular Clusters in NGC 5128:Color-Magnitude Diagrams andGlobular Cluster Luminosity Func-tion. A&A.
1 4 1 0 . Th. Rivinius, D. Baade, S. Št e f l ,R.H.D. Townsend, O. Stahl, B. Wolfand A. Kaufer: Stellar and Circum-
stellar Activity of the Be StarµCentauri. III. Multiline NonradialPulsation Modeling. A&A.
1411. B. Paltrinieri, F.R. Ferraro, F. Paresceand G. De Marchi: VLT Observationsof the Peculiar Globular Cluster NGC6712. III. The Evolved Stellar Popu-lation. AJ.
1412. B. L. Jensen et al.: The Afterglowof the Short/Intermediate-DurationGamma-Ray Burst GRB 000301C: AJet at z = 2.04. A&A.
40
ContentsJ. Alves, C. Lada and E. Lada: Seeing the Light Through the Dark . . 1
TELESCOPES AND INSTRUMENTATION
A. Gilliotte: La Silla Telescope Status, a Great Achievement on Image Quality Performances . . . . . . . . . . . . . . . . . . . . . . . . . . . 2
A. Gilliotte: Image Quality Improvement of the 2.2-m . . . . . . . . . . . . 4O. Hainaut and the NTT Team: NEWS from the NTT . . . . . . . . . . . . 7H. Jones: 2p2 Team News . . . . . . . . . . . . . . . . . . . . . . . . . . . . . . . . 9H. Jones, A. Renzini, P. Rosati and W. Seifert: Tunable Filters and
Large Telescopes . . . . . . . . . . . . . . . . . . . . . . . . . . . . . . . . . . . 10
REPORTS FROM OBSERVERS
J. Alves, C. Lada and E. Lada: Seeing the Light Through the Dark(Continued from page 1) . . . . . . . . . . . . . . . . . . . . . . . . . . . . . . 15
F. Comerón and M. Fernández: Strong Accretion and Mass Loss Near the Substellar Limit . . . . . . . . . . . . . . . . . . . . . . . . . . . . . . 21
J.U. Fynbo, P. Møller, B. Thomsen: Star Formation at z = 2–4: Going Below the Spectroscopic Limit with FORS1 . . . . . . . . . . . 24
H. Jones, B. Stappers, B. Gaensler: Discovery of a Bow-Shock Nebula Around the Pulsar B0740-28 . . . . . . . . . . . . . . . . . . . . . 27
L. Testi, L. Vanzi, F. Massi: Young Stellar Clusters in the Vela DMolecular Cloud . . . . . . . . . . . . . . . . . . . . . . . . . . . . . . . . . . . . 28
P. Amram and G. Östlin: Building Luminous Blue Compact Galaxies by Merging . . . . . . . . . . . . . . . . . . . . . . . . . . . . . . . . . . . . . . . . 31
OTHER ASTRONOMICAL NEWS
EIS Data on the Chandra Deep Field South Released . . . . . . . . . . . 37
ANNOUNCEMENTS
ESO Vacancy. Head of the Office for Science . . . . . . . . . . . . . . . . . 36ESO Studentship Programme 2001 . . . . . . . . . . . . . . . . . . . . . . . . . 38Personnel Movements . . . . . . . . . . . . . . . . . . . . . . . . . . . . . . . . . . . 38ESO Vacancies. A Challenge for Astronomers, Engineers in the
Field of Software, Electronics and/or Mechanics . . . . . . . . . . . . 39Scientific Preprints (January – March 2001) . . . . . . . . . . . . . . . . . . . 40
SCIENTIFIC PREPRINTS(January – March 2001)