section 7 advanced hart diagnostic suite - · pdf filesection 7 advanced hart diagnostic suite...
TRANSCRIPT

Reference Manual 00809-0100-4801, Rev FAOctober 2010 Rosemount 3051S Series
Section 7 Advanced HART Diagnostic SuiteOverview . . . . . . . . . . . . . . . . . . . . . . . . . . . . . . . . . . . . . . . page 7-1User Interface . . . . . . . . . . . . . . . . . . . . . . . . . . . . . . . . . . . page 7-3Statistical Process Monitoring . . . . . . . . . . . . . . . . . . . . . page 7-4Power Advisory . . . . . . . . . . . . . . . . . . . . . . . . . . . . . . . . . . page 7-20Diagnostic Log . . . . . . . . . . . . . . . . . . . . . . . . . . . . . . . . . . page 7-24Variable Logging . . . . . . . . . . . . . . . . . . . . . . . . . . . . . . . . . page 7-26Process Alerts . . . . . . . . . . . . . . . . . . . . . . . . . . . . . . . . . . . page 7-29Service Alerts . . . . . . . . . . . . . . . . . . . . . . . . . . . . . . . . . . . page 7-31Device Diagnostics . . . . . . . . . . . . . . . . . . . . . . . . . . . . . . . page 7-32Smart Wireless THUM Adapter Configuration . . . . . . . . . page 7-33Rosemount 333 Hart Tri-Loop Configuration . . . . . . . . . . page 7-34Safety Instrumented Systems (SIS) Certification . . . . . . page 7-36Other Information . . . . . . . . . . . . . . . . . . . . . . . . . . . . . . . . page 7-40Field Communicator Menu Trees . . . . . . . . . . . . . . . . . . . page 7-41
OVERVIEW The Advanced HART Diagnostic Suite is an extension of the Rosemount 3051S Series of Instrumentation and takes full advantage of the scalable architecture. The 3051S SuperModule™ Platform generates the pressure measurement while the diagnostic electronics board is mounted in the PlantWeb housing and plugs into the top of the SuperModule. The electronics board communicates with the SuperModule and produces standard 4 – 20 mA and HART outputs while adding advanced diagnostic capability.
NOTEWhen a new SuperModule is connected to the diagnostic electronics board for the first time, the transmitter will be in alarm state until pressure range is specified.
The Advanced HART Diagnostics Suite is designated by the option code “DA2” in the model number. All options can be used with DA2 except the following:
• Foundation Fieldbus protocol (Output code F)
• Wireless (Output code X)
• Quick Connect (Housing code 7J)
• Junction box (Housing code 2A, 2B, 2C, 2J)
• Remote display (Housing code 2E, 2F, 2G, 2M)
The HART Diagnostic transmitter has seven distinct diagnostic functions that can be used separately or in conjunction with each other to detect and alert users to conditions that were previously undetectable, or provide powerful troubleshooting tools.
7-1
Reference Manual00809-0100-4801, Rev FA
October 2010Rosemount 3051S Series
1. Statistical Process Monitoring (SPM) – SPM technology detects changes in the process, process equipment or installation conditions of the transmitter. This is done by modeling the process noise signature (using the statistical values of mean, standard deviation, and coefficient of variation) under normal conditions and then analyzing the recorded baseline values to current values over time. If a significant change in the current values is detected, the transmitter can generate HART alerts or analog alarms, depending on user configuration. The condition is time stamped and is also noted on the LCD.
The statistical values are also available as secondary variables from the transmitter via HART. Users can trend their process noise signature, perform their own analysis or generate their own alarms or alerts based on the secondary variables. Trending of statistical values in an analog system can be done with the Smart Wireless THUM Adapter or Rosemount 333 Tri-Loop. Refer to pages 7-33 and 7-34 for more details.
2. Power Advisory Diagnostic – This diagnostic functionality detects changes in the characteristics of the electrical loop that may jeopardize loop integrity. This is done by characterizing the electrical loop after the transmitter is installed and powered up in the field. If terminal voltage deviates outside of user configured limits, the transmitter can generate HART alerts or analog alarms.
3. Diagnostic Log – The transmitter logs up to ten device status events, each associated with the time stamp of when the event occurred. Referencing this log allows for better understanding of the device health and can be used in conjunction with device troubleshooting.
4. Variable Log – The transmitter logs the following values: Minimum and Maximum Pressure and Minimum and Maximum Temperature with independent time stamped values. The transmitter also logs total elapsed time in over-pressure or over-temperature conditions and number of pressure or temperature excursions outside of sensor limits.
5. Process Alerts – These are configurable alerts for both process pressure and sensor temperature. Users can receive a HART alert if pressure or temperature exceeds threshold limits. The time stamp of when the alert occurred and the number of alert events is also recorded in the transmitter. When alert is active, this notification is displayed on the LCD.
6. Service Alerts – This is a configurable service reminder that generates a HART alert after user-specified time has expired. When alert is active, this notification is displayed on the LCD.
7. Time Stamp – The diagnostic electronics board includes an embedded Operational Hours clock whose purpose is two-fold.
a. Provides the total number of operating hours of the transmitter.
b. Provides an elapsed “Time Since” event indication or time stamping for all diagnostics.
All time values are non-volatile and displayed in the following format: YY:DDD:hh:mm:ss (years:days:hours:minutes:seconds). The time stamping capability significantly enhances the user’s ability to troubleshoot measurement issues, particularly transient events that may be too fast to capture with DCS or PLC trending or historian capabilities.
7-2

Reference Manual 00809-0100-4801, Rev FAOctober 2010 Rosemount 3051S Series
USER INTERFACE The 3051S with Advanced HART Diagnostic Suite can be used with any asset management software that supports Electronic Device Description Language (EDDL) or FDT/DTM.
Advanced HART Diagnostics is best viewed and configured using the latest Device Dashboard interface based on Human Centered Design concepts. The Device Dashboard can be obtained with DD revision 3051S HDT Dev. 3 Rev. 1.
The following screen shots are taken from Emerson Process Management’s AMS™ Device Manager, version 10.5. All screens shown are based on the Device Dashboard interface.
Figure 7-1. Device Dashboard
Figure 7-1 is the landing screen for the 3051S with Advanced HART Diagnostic Suite. The device status will change if any device alerts are active. Graphical gauges provide quick reading of the primary purpose variables. Shortcut buttons are available for the most common tasks.
Diagnostic Action Settings
Each diagnostic allows the user to select a type of action to take if the diagnostic is tripped.
None – Transmitter provides no indication that any trip values were exceeded or the diagnostic is turned off.
Alert Unlatched – Transmitter generates digital HART alert and does not affect the 4 – 20 mA signal. When conditions return to normal or within threshold levels, the alert is automatically cleared.
Alert Latched – Transmitter generates digital HART alert and does not affect the 4 – 20 mA signal. When conditions return to normal, an alert reset is required to clear the status. This type of alert action is recommended if a 3rd party alert monitor software is likely to miss alerts due to slow polling of HART data.
Alarm – Transmitter drives mA output to the configured Failure Alarm level (HIGH or LOW).
7-3

Reference Manual00809-0100-4801, Rev FA
October 2010Rosemount 3051S Series
STATISTICAL PROCESS MONITORING
Introduction Statistical Process Monitoring (SPM) provides a means for early detection of abnormal situations in a process environment. The technology is based on the premise that virtually all dynamic processes have a unique noise or variation signature when operating normally. Changes in these signatures may signal that a significant change will occur or has occurred in the process, process equipment, or transmitter installation. For example, the noise source may be equipment in the process such as a pump or agitator, the natural variation in the DP value caused by turbulent flow, or a combination of both.
The sensing of the unique signature begins with the combination of the Rosemount 3051S pressure transmitter and software resident in the diagnostic electronics to compute statistical parameters that characterize and quantify the noise or variation. These statistical parameters are the mean, standard deviation, and coefficient of variation of the input pressure. Filtering capability is provided to separate slow changes in the process due to setpoint changes from the process noise or variation of interest. Figure 7-2 shows an example of how the standard deviation value is affected by changes in noise level while the mean or average value remains constant. Figure 7-3 shows an example of how the coefficient of variation is affected by changes in the standard deviation and mean.
The calculation of the statistical parameters within the device is accomplished on a parallel software path used to filter and compute the primary output signal (such as the 4 - 20 mA output). The primary output is not affected in any way by this additional capability.
Figure 7-2. Changes in process noise or variability and affect on statistical parameters
Standard Deviation increases or decreases with changing noise level.
Process Noise
StandardDeviation
Mean
7-4

Reference Manual 00809-0100-4801, Rev FAOctober 2010 Rosemount 3051S Series
Figure 7-3. CV is the ratio of Standard Deviation to Mean
CV is stable if Mean is proportional to Standard Deviation.
SPM provides statistical information to the user in two ways. First, the statistical parameters can be made available to the host system directly via HART communication protocol or HART to other protocol converters. Once available, the system can make use of these statistical parameters to indicate or detect a change in process conditions. In the simplest example, the statistical values may be stored in a data historian. If a process upset or equipment problem occurs, these values can be examined to determine if changes in the values foreshadowed or indicated the process upset. The statistical values can then be made available to the operator directly, or made available to alarm or alert software.
The second way for SPM to provide statistical information is with software embedded in the 3051S. The 3051S uses SPM to baseline the process noise or signature via a learning process. Once the learning process is completed, the user can set thresholds for any of the statistical parameters. The device itself can then detect significant changes in the noise or variation, and communicate an alarm via the 4 – 20 mA output and/or alert via HART. Typical applications are detection of plugged impulse lines, change in fluid composition, or equipment related problems.
Overview A block diagram of the SPM diagnostic is shown in Figure 7-4. The pressure process variable is input to a module where basic high pass filtering is performed on the pressure signal. The mean (or average) is calculated on the unfiltered pressure signal, the standard deviation calculated from the filtered pressure signal. These statistical values are available via HART and handheld communication devices like the 375 Field Communicator or asset management software like Emerson Process Management’s AMS™ Device Manager. The values can also be assigned as secondary variables from the device for 4-20 mA communication to the user through other devices like the Smart Wireless THUM or Rosemount 333 HART Tri-loop.
Mean
StandardDeviation
Coefficient of Variation
7-5
Reference Manual00809-0100-4801, Rev FA
October 2010Rosemount 3051S Series
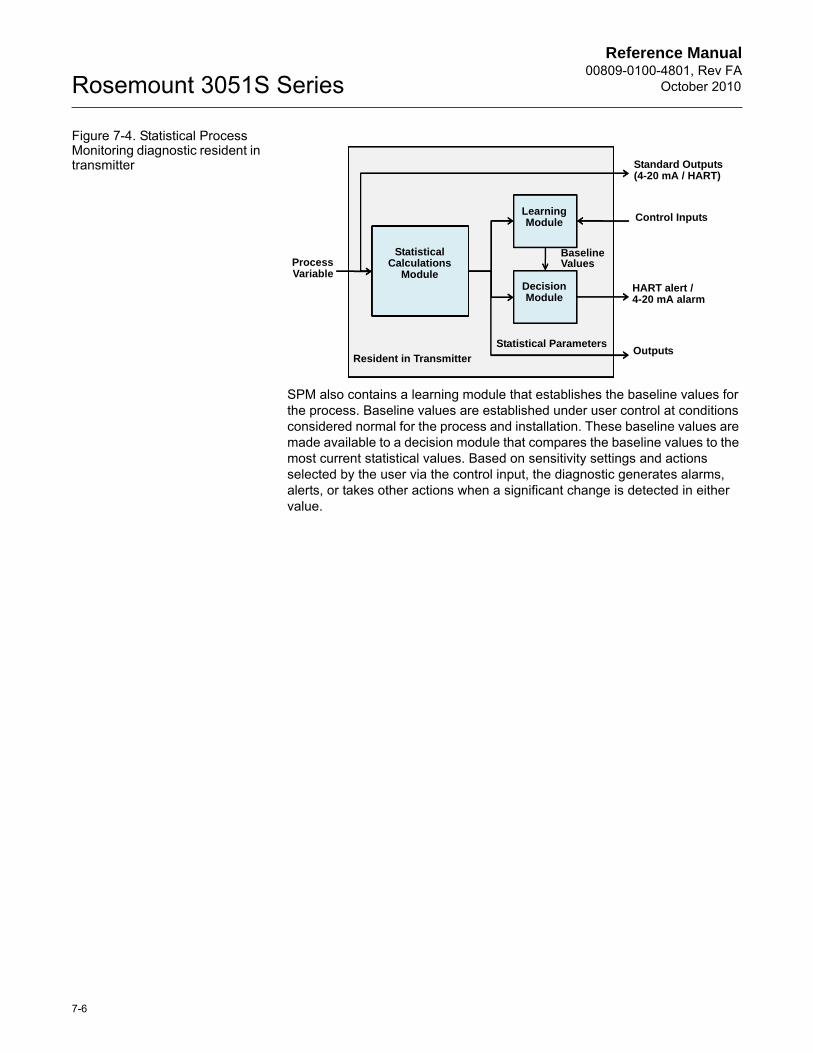
Figure 7-4. Statistical Process Monitoring diagnostic resident in transmitter
SPM also contains a learning module that establishes the baseline values for the process. Baseline values are established under user control at conditions considered normal for the process and installation. These baseline values are made available to a decision module that compares the baseline values to the most current statistical values. Based on sensitivity settings and actions selected by the user via the control input, the diagnostic generates alarms, alerts, or takes other actions when a significant change is detected in either value.
ProcessVariable
Statistical Calculations
Module
Learning Module
Decision Module
Standard Outputs (4-20 mA / HART)
Control Inputs
Outputs
HART alert / 4-20 mA alarm
Resident in Transmitter
Statistical Parameters
Baseline Values
7-6

Reference Manual 00809-0100-4801, Rev FAOctober 2010 Rosemount 3051S Series
Figure 7-5. Simplified SPM flowchart
Further detail of the operation of the SPM diagnostic is shown in the Figure 7-5 flowchart. This is a simplified version showing operation using the default values. While SPM continuously calculates the mean, standard deviation, and coefficient of variation values, the learning and decision modules must be turned on to operate. Once enabled, SPM enters the learning/verification mode and the status will be “Learning”. The baseline statistical values are calculated over a period of time controlled by the user (Learning/Monitoring Period; default is 3 minutes). A check is performed to make sure that the process has a sufficiently high noise or variability level (above the low level of internal noise inherent in the transmitter itself). If the level is too low, the diagnostic will continue to calculate baseline values until the criteria is satisfied (or turned off). A second set of values is calculated and compared to the original set to verify that the measured process is stable and repeatable. During this period, the status will change to “Verifying”. If the process is stable, the diagnostic will use the last set of values as baseline values and change to “Monitoring” status. If the process is unstable, the diagnostic will continue to verify until stability is achieved. The stability criteria are also user defined.
Learning/Verifying Monitoring
User Initiatives
Compute mean, std. dev. for
3 min.
Sufficient Noise?
Compute 2nd mean, std. dev.
for 3 min.
System Stable?
System Stable?
“Insufficient Dynamics”
Change Status
Compute mean (X) and std. dev. ( )
Decrease in > 60%?
“Low Variation Detected”
“High Variation Detected”
Increase in > 60%?
Yes
Yes
Yes
Yes
Yes
No
No
NoNo
No
7-7

Reference Manual00809-0100-4801, Rev FA
October 2010Rosemount 3051S Series
In the “Monitoring” mode, statistical values of mean, standard deviation, and coefficient of variation are continuously calculated, with new values available every second. When using mean and standard deviation as the SPM variables, the mean value is compared to the baseline mean value. If the mean has changed by a significant amount, the diagnostic can automatically return to the “Learning” mode. The diagnostic does this because a significant change in mean is likely due to a change in process operation and can result in a significant change in noise level (i.e. standard deviation) as well. If the mean has not changed, the standard deviation value is compared to the baseline value. If the standard deviation has changed significantly and exceeds configured sensitivity thresholds, this may indicate a change has occurred in the process, equipment, or transmitter installation and a HART alert or analog alarm is generated.
For DP flow applications where the mean pressure is likely to change due to changing process operation, the recommended SPM variable for process diagnostics is the coefficient of variation. Since the coefficient of variation is the ratio of standard deviation to mean, it represents normalized process noise values even when the mean is changing. If the coefficient of variation changes significantly relative to the baseline and exceeds sensitivity thresholds, the transmitter can generate a HART alert or analog alarm.
NOTE SPM diagnostic capability in the Rosemount 3051S HART pressure transmitter calculates and detects significant changes in statistical parameters derived from the input pressure signal. These statistical parameters relate to the variability of and the noise signals present in the pressure signal. It is difficult to predict specifically which noise sources may be present in a given pressure measurement application, the specific influence of those noise sources on the statistical parameters, and the expected changes in the noise sources at any time. Therefore, Rosemount cannot absolutely warrant or guarantee that SPM will accurately detect each specific condition under all circumstances.
Assigning Statistical Values to Outputs
The statistical values of mean, standard deviation, and coefficient of variation can be made available to other systems or data historians via HART communication. WirelessHART adaptor, such as the Smart Wireless THUM can also be used to obtain additional variables. Devices that convert HART variables to analog 4-20 mA outputs, such as the Rosemount 333 Tri-Loop can also be used.
Statistical values can be assigned to be 2nd variable, 3rd variable, or 4th variable. This is accomplished through Variable Mapping. See Figure 7-6.
Device Dashboard Fast Keys
2, 2, 5, 1
7-8

Reference Manual 00809-0100-4801, Rev FAOctober 2010 Rosemount 3051S Series
Figure 7-6. Selection of statistical values as secondary variables
SPM Configuration For inexperienced users, guided setup is recommended. Guided setup walks the user through settings that configure the SPM diagnostic for most common usage and applications.
Figure 7-7. Guided Setup Menu
The rest of the configuration section explains the parameters for manual configuration of SPM diagnostic.
Device Dashboard Fast Keys
2, 1, 2, 1
7-9

Reference Manual00809-0100-4801, Rev FA
October 2010Rosemount 3051S Series
Figure 7-8. Statistical Process Monitoring main screen
The SPM Status screen shows overview information for the diagnostic.
The process for operation of the SPM diagnostic is:
• Configure the diagnostic using Baseline Configuration and Detection Configuration screens.
• Turn on the diagnostic from the SPM Status screen.
The configuration process starts with Baseline Configuration, Figure 7-9 on page 7-11. The configurable fields are:
SPM Variable:
This is the statistical variable to be used for SPM diagnostic detection.
Stdev & Mean (default)Standard deviation and mean of the process are calculated. Users can set independent sensitivity thresholds for both statistical variables.
Coefficient of Variation (CV)CV is calculated from the ratio of standard deviation to mean and is better suited for DP flow applications where the mean pressure is likely to change due to changing process operation. CV puts standard deviation in context of the mean and is represented as a % value.
7-10

Reference Manual 00809-0100-4801, Rev FAOctober 2010 Rosemount 3051S Series
Figure 7-9. Baseline Configuration screen
Learn/Monitor Period:
This is the learning and monitoring time period that SPM diagnostic uses to sample the pressure signal. The mean and standard deviation or coefficient of variation values determined during the learning period will become the Baseline values. Decreasing this period can speed up the set up time and is recommended for stable process operations. Increasing this value will give a better baseline value for noisier processes. If false trips for “High Variation Detected” are occurring due to rapid changes in the process and statistical value, increasing the learning period is recommended. The Learning/Monitoring Period is always set in minutes. The default value is 3 minutes and the valid range is 1 to 60 minutes.
Figure 7-10 illustrates the effect of Learn/Monitor Period on the statistical calculations. Notice how a shorter sampling window of 3 minutes captures more variation (e.g. plot looks noisier) in the trend. With the longer sampling window of 10 minutes, the trend looks smoother because SPM uses process data sampled over a longer period of time.
Figure 7-10. Effect of Learn/Monitor Period on Statistical Values 3 min.
5 min.
10 min.
7-11

Reference Manual00809-0100-4801, Rev FA
October 2010Rosemount 3051S Series
Power Interruption Action
This is used to direct what the diagnostic should do in the case of a power interruption or if the diagnostic is manually disabled and then enabled. The options are:
Monitor (default)When SPM restarts, the diagnostic returns to the Monitoring mode immediately and uses the baseline values computed before the interruption.
RelearnWhen SPM restarts, the diagnostic enters the Learning mode and will recalculate new baseline values.
Low Pressure Cut-off
This is the minimum pressure required to operate the diagnostic with Coefficient of Variation selected as the statistical variable. The coefficient of variation is a ratio of standard deviation to mean and is defined for non-zero mean values. When the mean value is near zero, the coefficient of variation is sensitive to small changes in the mean, limiting its usefulness. Default value is 1% of upper sensor limit.
Insufficient Variability
The SPM diagnostic uses process noise to baseline the process and detect abnormal situations. Typically the Insufficient Variability check is on to ensure there is sufficient noise for proper operation. In a quiet application with very minimal process noise, this setting can be turned off. The default setting is ON.
Standard Deviation Difference, Mean Difference
If these difference values are exceeded during the Verification mode, SPM diagnostic will not start Monitoring mode and will continue verifying the baseline. If SPM diagnostic will not leave the Verification mode, these values should be increased. If the diagnostic still remains in the Verification mode with the highest level, the Learning/Monitoring period should be increased.
Parameter Definition
On (default) Perform insufficient variation check
Off Do not perform insufficient variation check
Table 7-1. Standard Deviation Verification Criteria
Parameter Definition
None Do not perform any verification checks for standard deviation.
10% If the difference between baseline standard deviation value and the verification value exceeds 10%, diagnostic will stay in Verification mode.
20% (default) If the difference between baseline standard deviation value and the verification value exceeds 20%, diagnostic will stay in Verification mode.
30% If the difference between baseline standard deviation value and the verification value exceeds 30%, diagnostic will stay in Verification mode.
7-12

Reference Manual 00809-0100-4801, Rev FAOctober 2010 Rosemount 3051S Series
The Detection Configuration screen (Figure 7-11 and Figure 7-12) allows for configuration of sensitivity threshold values for tripping the diagnostic and how to receive the HART alert or analog alarm.
Figure 7-11. Detection Configuration screen for Standard Deviation & Mean
Table 7-2. Mean Verification Criteria
Parameter Definition
None Do not perform any verification checks for mean.
3 Stdev (default) If the difference between baseline mean value and the verification value exceeds 3 standard deviations, diagnostic will stay in Verification mode.
6 Stdev If the difference between baseline mean value and the verification value exceeds 6 standard deviations, diagnostic will stay in Verification mode.
2% If the difference between baseline mean value and the verification value exceeds 2%, diagnostic will stay in Verification mode.
7-13

Reference Manual00809-0100-4801, Rev FA
October 2010Rosemount 3051S Series
Figure 7-12. Detection Configuration screen for Coefficient of Variation
Standard Deviation Sensitivity, Mean Sensitivity
Shows the current sensitivity level for detecting changes in standard deviation or mean. Users can choose from preset values of High, Medium, and Low. Custom sensitivity levels can also be configured.
Coefficient of Variation Sensitivity
Shows the current sensitivity level for detecting changes in the coefficient of variation. Users can choose from preset values of High, Medium, and Low. Custom sensitivity levels can also be configured.
Figure 7-13 illustrates the differences in preset sensitivity limits of High, Medium, and Low. The preset High sensitivity setting (e.g. 20%) will cause the SPM diagnostic to be more sensitive to changes in the process profile. The preset Low sensitivity setting (e.g. 80%) will cause the SPM diagnostic to be less sensitive as a much greater change in the process profile is needed to trip the alert.
Figure 7-13. Preset sensitivity levels
7-14

Reference Manual 00809-0100-4801, Rev FAOctober 2010 Rosemount 3051S Series
Threshold Value
If sensitivity is Custom, this field will display the custom sensitivity setting as % change from the baseline value.
Configure Sensitivity
This button launches a window for entering sensitivity settings.
Alert Delay
This value specifies the amount of delay from when the transmitter detects a deviation of the sensitivity threshold to generating an alert or alarm. The default value is 60 seconds and valid range is 0 to 3600 seconds. Increasing the alert delay helps to avoid false detections resulting from the standard deviation or CV exceeding the threshold only momentarily.
High Detection Message
Customizable message field related to standard deviation / coefficient of variation crossing the upper threshold value. This message can be used to describe the abnormal process condition or provide additional details for troubleshooting. Message will appear along with the High Variation or High CV Detected alert. Character limit is 32 including spaces.
Table 7-3. Standard Deviation Sensitivity Choices
Parameter Definition
Low 80% change from baseline value will trip the diagnostic
Medium (default) 60% change from baseline value will trip the diagnostic
High 40% change from baseline value will trip the diagnostic
Custom Adjustable from 1 to 10000%
Table 7-4. Mean Sensitivity Choices
Parameter DP GP/AP
Low 40% of baseline or 4% of span, whichever is greater
20% of span
Medium (default) 20% of baseline or 2% of span, whichever is greater
10% of span
High 10% of baseline or 1% of span, whichever is greater
5% of span
Custom Adjustable from 1 to 10000% of value
Adjustable from 1 to 10000% of span
Table 7-5. Coefficient of Variation Sensitivity Choices
Parameter Definition
Low 80% change from baseline value will trip the diagnostic
Medium (default) 40% change from baseline value will trip the diagnostic
High 20% change from baseline value will trip the diagnostic
Custom Adjustable from 1 to 10000%
7-15

Reference Manual00809-0100-4801, Rev FA
October 2010Rosemount 3051S Series
7-16
Low Detection Message
Customizable message field related to standard deviation / coefficient of variation crossing the lower threshold value. This message can be used to describe the abnormal process condition or provide additional details for troubleshooting. Message will appear along with the Low Variation or Low CV Detected alert. Character limit is 32 including spaces.
Mean Change Message
Customizable message field related to mean value crossing either the upper or lower threshold value. This message can be used to describe the abnormal process condition or provide additional details for troubleshooting. Message will appear along with the Mean Change Detected alert. Character limit is 32 including spaces.
Operation
Figure 7-14. SPM diagnostic can be activated from the SPM Status screen
Turning On the SPM Diagnostic
The SPM diagnostic is enabled by selecting On for “SPM Mode”, shown on Figure 7-14. Upon enabling SPM, the diagnostic will automatically begin “Learning” with the following exception: if valid baseline values have been previously established and “Monitor” has been selected as the option for Power Interruption on the Baseline Configuration screen, then the diagnostic will bypass Learning and begin Monitoring immediately. The diagnostic status will stay in the Learning mode for the Learning Period specified on the Baseline Configuration screen. After the learning period is complete, the Mode will change to Verifying and a blue line will appear on the charts indicating the learned baseline value. Upon completion of the Verify mode, the diagnostic will use the parameters selected on the Verification Criteria page to validate the baseline value. After the Verifying period the Mode will switch to Monitoring and grey lines that indicate the sensitivity setting will appear on the charts.
Device Dashboard Fast Keys
1, 3, 2

Reference Manual 00809-0100-4801, Rev FAOctober 2010 Rosemount 3051S Series
Reset
If SPM trip action is set to “Alert Latched”, clicking on Reset will clear the alert when process conditions are back to normal or baseline.
Relearn
Clicking this button will cause SPM to relearn the process condition and establish a new baseline. Manually performing a relearn is recommended if the process profile has been intentionally changed to a new set point.
Figure 7-15. Operational Values screen
The Operational Values screen contains the parameter values used in the SPM diagnostic.
Standard DeviationThis is the current value of standard deviation. This value is continuously calculated and can be provided as a secondary variable.
MeanThis is the current value of mean. This value is continuously calculated and can be provided as a secondary variable.
Coefficient of VariationThis is the current value for coefficient of variation. The CV is derived from the ratio of standard deviation to mean. This value is continuously calculated and can be provided as a secondary variable.
Number of RelearnsThis is the number of times SPM relearn has been initiated by the user or via automatic relearn.
Detection
If the SPM diagnostic detects a Standard Deviation, Mean, or Coefficient of Variation change outside the threshold values, the SPM Status box will indicate “Detection”, followed by the type of detection.
7-17

Reference Manual00809-0100-4801, Rev FA
October 2010Rosemount 3051S Series
The LCD will also indicate the diagnostic condition. The “Time Since Detection” clock in the Time Stamp box will start incrementing until the statistical value is returned to normal. If the diagnostic alert is latched, the “Time Since Detection” clock will continue to increment until the alert is reset or SPM diagnostic is turned off.
Interpreting Results
The SPM diagnostic can be used to detect installation, process and equipment changes, or problems. However, as the diagnostic is based on detecting changes in process noise or variability, there are many possible reasons or sources for the change in values and detection. Following are some possible causes and solutions if a diagnostic event is detected:
Table 7-6. Possible causes of SPM diagnostic events
Detection Type LCD Display Potential Cause Corrective Action
High Variation Detected / High CV Detected
HIGH VARIA / HIGH CV
Plugged impulse line (DP only). Follow facility procedure to check for and clear plugged impulse lines. Both lines must be checked as the SPM diagnostic cannot determine if the plug is on the high or low side. Conditions that lead to plugging on one side may lead to an eventual plug on the other side.
Aeration or aeration increase (liquid flow).
a) If aeration is undesired, take necessary steps to eliminate aeration.b) If the measurement is DP flow and aeration is not desired, move primary element to another location in the process piping to ensure it remains full (no air) under all conditions.
Liquid present or amount of liquid increased (gas or steam flow).
If liquid is undesired, take necessary steps to eliminate liquid in gas or steam flow.If some liquid is normal, and error correction in the gas flow measurement is being done (such as an over-reading in wet natural gas measurements), you may need to determine the volume fraction of the liquid (e.g. using a test separator) and a new error correction factor for the gas flow measurement.
Solids present or solids level increased.
If solids are undesired, take necessary steps to eliminate.
Control loop problem(valve stiction, controller issue, etc.).
Review control valve or loop for control problems.
Process or equipment change or problem has resulted in an increase in the pressure noise level.
Check process equipment.
High Variation Detected
HIGH VARIA Rapid change of process variable mean value.
Rapid changes in the process variable can result in indication of high variation. If undesired, increase Alert Delay value (default is 60 seconds). Increase the Learn/Monitor period (default is 3 minutes).
7-18

Reference Manual 00809-0100-4801, Rev FAOctober 2010 Rosemount 3051S Series
NOTERosemount cannot absolutely warrant or guarantee that Statistical Process Monitoring will accurately detect each specific abnormal condition under all circumstances. Standard maintenance procedures and safety precautions should not be ignored because SPM diagnostic is enabled.
Troubleshooting the SPM Diagnostic
Users are encouraged to pretest the SPM diagnostic if possible. For example, if the diagnostic is to be used to detect plugged impulse lines, and if root valves are present in the installation, the user should set up the diagnostic as described earlier, and then alternately close the high and the low side root valve to simulate a plugged impulse line. Using the SPM Status screen, the user can then note the changes to the standard deviation or coefficient of variation under the closed conditions and adjust the sensitivity values as needed.
Low Variation Detected / Low CV Detected
LOW VARIA / LOW CV
Plugged impulse line (DP/AP/GP).
Follow facility procedure to check for and clear plugged impulse lines. Both lines must be checked as the SPM diagnostic cannot determine if the plug is on the high or low side(DP devices only). Conditions that lead to plugging on one side may lead to an eventual plug on the other side.
Aeration decrease. If decrease is normal, reset and relearn. If not, check process and equipment for change in operating conditions.
Decrease of liquid content in gas or steam flow.
If decrease is normal, reset and relearn. If not, check process and equipment for change in operating conditions.
Decrease in solids content. If decrease is normal, reset and relearn. If not, check process and equipment for change in operating conditions.
Reduction in variability in process. If decrease is normal, reset and relearn. If not, check process and equipment for change in operating conditions. For example, a stuck control valve can reduce variability.
Mean Change Detected
MEAN CHANGE Significant process setpoint change.
If change is normal, reset and relearn. Consider changing mean change detection to automatically relearn. If change is not expected, check process and equipment for change in operating conditions.
Table 7-6. Possible causes of SPM diagnostic events
Detection Type LCD Display Potential Cause Corrective Action
Table 7-7. Possible SPM issues and resolutions
SPM Diagnostic Issue Action
SPM diagnostic status indicates insufficient variability and will not leave learning or verifying mode
Process has very low noise. Turn off insufficient variability check (Verification Criteria screen). SPM diagnostic will be unable to detect a significant decrease in noise level.
7-19

Reference Manual00809-0100-4801, Rev FA
October 2010Rosemount 3051S Series
7-20
POWER ADVISORY
Introduction The Power Advisory diagnostic provides a means to detect issues that may jeopardize the integrity of the electrical loop. Some examples are: water entering the wiring compartment and makes contact with the terminals, an unstable power supply nearing end of life, or heavy corrosion on the terminals.
This technology is based on the premise that once a transmitter is installed and powered up, the electrical loop has a baseline characteristic that reflects the proper installation. If the transmitter terminal voltage deviates from the baseline and outside the user configured threshold, the 3051S can generate a HART alert or analog alarm.
To make use of this diagnostic, the user must first create a baseline characteristic for the electrical loop after the transmitter has been installed. The loop is automatically characterized with the push of a button. This creates a linear relationship for expected terminal voltage values along the operating region from 4 – 20 mA, see Figure 7-16.
Figure 7-16. Baseline operating region
SPM diagnostic will not leave verifying mode
Process is unstable. Increase learning sensitivity checks (Verification Criteria screen). If this does not correct the issue, increase the learning verification period to match or exceed the cycle time of the instability of the process. If maximum time does not correct the problem, process is not a candidate for SPM diagnostic. Correct stability issue or turn off diagnostic.
SPM diagnostic does not detect a known condition
With the condition present, but the process operating, go to the SPM Status or Operational Values screen and note the current statistical values and compare to the baseline and threshold values. Adjust the sensitivity values until a trip of the diagnostic occurs.
SPM diagnostic indicates “High Variation Detected” when no diagnostic event has occurred
The most likely cause is a fast change in the value of the process variable. Direction of the change is not important. Increase the learning/monitoring period to better filter out increases in standard deviation.
Table 7-7. Possible SPM issues and resolutions
SPM Diagnostic Issue Action
Volts
4 mA 20 mA
Output Current
Term
inal
Vo
ltag
e

Reference Manual 00809-0100-4801, Rev FAOctober 2010 Rosemount 3051S Series
Overview The transmitter is shipped with Power Advisory off as default and without any loop characterization performed. Once the transmitter is installed and powered up, loop characterization must be performed for Power Advisory diagnostic to function.
When the user initiates a loop characterization, the transmitter will check to see if the loop has sufficient power for proper operation. Then the transmitter will drive the analog output to both 4mA and 20mA to establish a baseline and determine the maximum allowable terminal voltage deviation. Once this is complete, the user enters a sensitivity threshold called “Terminal Voltage Deviation Limit” and a check is in place to make sure this threshold value is valid.
Once the loop has been characterized and Terminal Voltage Deviation Limit is set, Power Advisory actively monitors the electrical loop for deviations from the baseline. If the terminal voltage has changed relative to the expected baseline value, exceeding the configured Terminal Voltage Deviation Limit, the transmitter can generate an alert or alarm.
NOTEPower Advisory diagnostic in the Rosemount 3051S HART pressure transmitter monitors and detects changes in the terminal voltage from expected values to detect common failures. It is not possible to predict and detect all types of electrical failures on the 4-20mA output. Therefore, Rosemount cannot absolutely warrant or guarantee that Power Advisory Diagnostic will accurately detect failures under all circumstances.
Configuration For inexperienced users, guided setup is recommended. Guided setup walks the user through settings that configure the Power Advisory diagnostic for most common usage and applications.
Figure 7-17. Guided Setup Menu
The rest of the configuration section explains the parameters for manual configuration of Power Advisory diagnostic.
Device Dashboard Fast Keys
2, 1, 2, 2
7-21

Reference Manual00809-0100-4801, Rev FA
October 2010Rosemount 3051S Series
Figure 7-18. Manual configuration of Power Advisory main screen
The Power Advisory configuration screen allows users to characterize the loop and configure the Terminal Voltage Deviation Limit and the Action. Two instances of loop characterization data are recorded and presented on this screen: “Baseline” and “Previous Baseline”. Baseline represents values from the most recent loop characterization whereas Previous Baseline represents values recorded prior to the most recent characterization.
Terminal Voltage
This field shows the current terminal voltage value in Volts. The terminal voltage is a dynamic value and is directly related to the mA output value.
Terminal Voltage Deviation Limit +/-
The Terminal Voltage Deviation Limit should be set large enough that “expected” voltage changes do not cause false failures. The default value of 1.5V will accommodate typical deviation of customer power supply voltage and loop tests (amp meters connected across the test diode on the terminal block). This value should be increased if your loop has additional “expected” variation.
Figure 7-19. Voltage Deviation Limit
7-22

Reference Manual 00809-0100-4801, Rev FAOctober 2010 Rosemount 3051S Series
Resistance
This value is the calculated resistance of the electrical loop (in Ohms) measured during the Characterize Loop procedure. Changes in the resistance may occur due to changes in the physical condition of the loop installation. Baseline and Previous Baselines can be compared to see how much resistance has changed over time.
Power Supply
This value is the calculated power supply voltage of the electrical loop (in Volts) measured during the Characterize Loop procedure. Changes in this value may occur due to degraded performance of the power supply. Baseline and Previous Baselines can be compared to see how much the power supply has changed over time.
Characterization Time Stamp
This is the time stamp or elapsed time of the loop characterization event. All time values are non-volatile and displayed in the following format: YY:DDD:hh:mm:ss (years:days:hours:minutes:seconds).
Characterize Loop
Loop characterization must be initiated when the transmitter is first installed or when electrical loop characteristics have been intentionally altered. Examples include more transmitters being added onto the loop, modified power supply level or loop resistance of the system, changing the terminal block on the transmitter, or adding the Smart Wireless THUM to the transmitter. Another case of required re-characterization is if the diagnostic electronics is taken out of an existing 3051S transmitter and placed in a new 3051S installed on a different loop.
NOTEPower Advisory diagnostic is not recommended for transmitters operating in HART Burst Mode (fixed current mode) or multidrop.
Severe changes in the electrical loop may inhibit HART communication or the ability to reach alarm values. Therefore, Rosemount cannot absolutely warrant or guarantee that the correct Failure Alarm level (HIGH or LOW) can be read by the host system at the time of annunciation.
7-23
Reference Manual00809-0100-4801, Rev FA
October 2010Rosemount 3051S Series
Troubleshooting
DIAGNOSTIC LOG
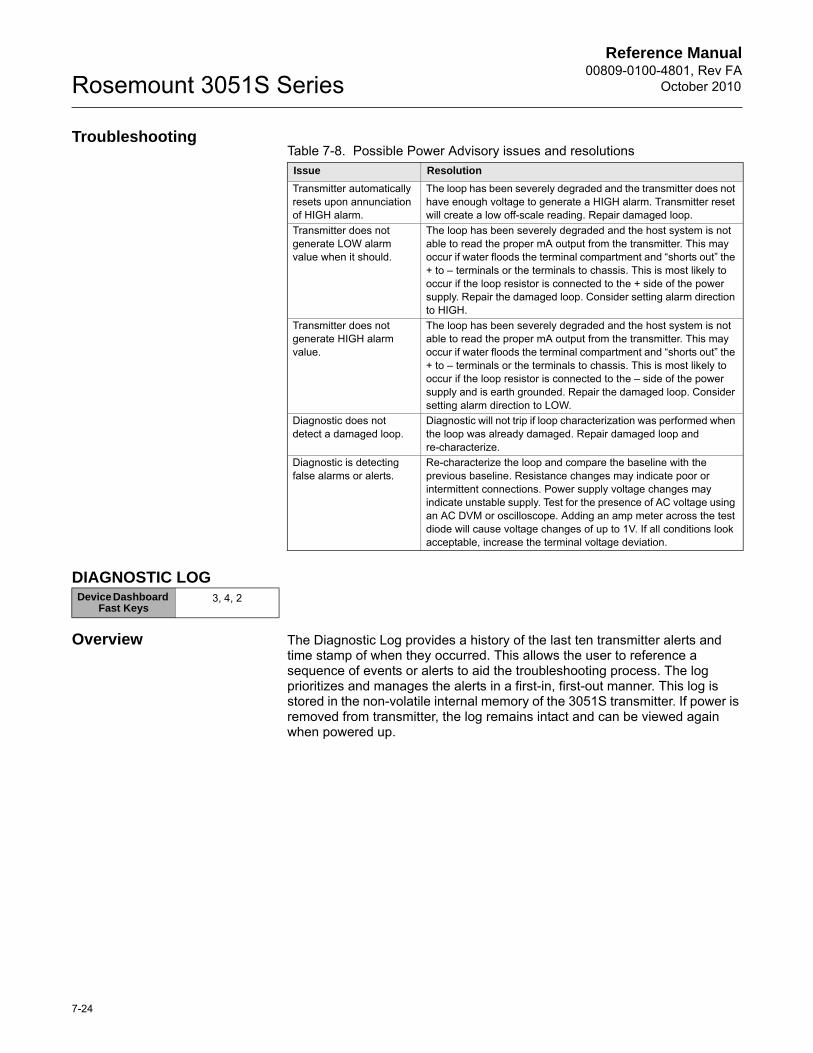
Overview The Diagnostic Log provides a history of the last ten transmitter alerts and time stamp of when they occurred. This allows the user to reference a sequence of events or alerts to aid the troubleshooting process. The log prioritizes and manages the alerts in a first-in, first-out manner. This log is stored in the non-volatile internal memory of the 3051S transmitter. If power is removed from transmitter, the log remains intact and can be viewed again when powered up.
Table 7-8. Possible Power Advisory issues and resolutions
Issue Resolution
Transmitter automatically resets upon annunciation of HIGH alarm.
The loop has been severely degraded and the transmitter does not have enough voltage to generate a HIGH alarm. Transmitter reset will create a low off-scale reading. Repair damaged loop.
Transmitter does not generate LOW alarm value when it should.
The loop has been severely degraded and the host system is not able to read the proper mA output from the transmitter. This may occur if water floods the terminal compartment and “shorts out” the + to – terminals or the terminals to chassis. This is most likely to occur if the loop resistor is connected to the + side of the power supply. Repair the damaged loop. Consider setting alarm direction to HIGH.
Transmitter does not generate HIGH alarm value.
The loop has been severely degraded and the host system is not able to read the proper mA output from the transmitter. This may occur if water floods the terminal compartment and “shorts out” the + to – terminals or the terminals to chassis. This is most likely to occur if the loop resistor is connected to the – side of the power supply and is earth grounded. Repair the damaged loop. Consider setting alarm direction to LOW.
Diagnostic does not detect a damaged loop.
Diagnostic will not trip if loop characterization was performed when the loop was already damaged. Repair damaged loop and re-characterize.
Diagnostic is detecting false alarms or alerts.
Re-characterize the loop and compare the baseline with the previous baseline. Resistance changes may indicate poor or intermittent connections. Power supply voltage changes may indicate unstable supply. Test for the presence of AC voltage using an AC DVM or oscilloscope. Adding an amp meter across the test diode will cause voltage changes of up to 1V. If all conditions look acceptable, increase the terminal voltage deviation.
Device Dashboard Fast Keys
3, 4, 2
7-24

Reference Manual 00809-0100-4801, Rev FAOctober 2010 Rosemount 3051S Series
Figure 7-20. Diagnostic Log
Figure 7-20 shows the Diagnostic Log screen where a set of ten events and time stamp can be seen.
Status Event
This is the name of the event that was recorded in the transmitter. Table 7-9 shows a list of possible status events that can be recorded.
Table 7-9. Possible status events for Diagnostic Log
Alert / Status Criticality
CPU Error Set, Cleared Failed
Electronics Failure Set, Cleared Failed
Field Device Malfunction Set, Cleared Failed
HW/SW Incompatibility Set, Cleared Failed
mA Output Diagnostic Alert Set, Cleared Failed
NV Error Set, Cleared Failed
Pressure Not Updating Set, Cleared Failed
RAM Error Set, Cleared Failed
ROM Error Set, Cleared Failed
Sensor Failure Set, Cleared Failed
Stack Overflow Set, Cleared Failed
SW Flow Control Error Set, Cleared Failed
Transmitter Power Consumption Alert Set, Cleared Failed
Analog Output Fixed Set, Cleared Maintenance
Analog Output Saturated Set, Cleared Maintenance
Power Advisory Diagnostic Alert Set, Cleared Maintenance
Pressure Out of Limits Set, Cleared Maintenance
Sensor Trim Mode Set, Cleared Maintenance
Temperature Compensation Error Set, Cleared Maintenance
Temperature Not Updating Set, Cleared Maintenance
Cold Start Cleared Advisory
High CV Change Set, Cleared Advisory
Key Error Set, Cleared Advisory
LCD Update Error Set, Cleared Advisory
7-25

Reference Manual00809-0100-4801, Rev FA
October 2010Rosemount 3051S Series
NOTE:It is recommended that transmitters showing “Failed” status should be replaced.
Time Since
This is the time stamp or elapsed time of the status event. All time values are non-volatile and displayed in the following format: YY:DDD:hh:mm:ss (years:days:hours:minutes:seconds).
Clear Log
This button launches a method to clear the status events in the Diagnostic Log.
VARIABLE LOGGING
Overview Variable Logging can be used in a number of ways. The first function is the logging and time-stamping of the minimum and maximum pressures and module temperatures. The second function is logging and time-stamping of over pressure or over temperature conditions, events that could have an effect on the life of the transmitter. Figure 7-21 shows the Pressure Variable Logging screen. Figure 7-22 shows the Temperature Variable Logging screen.
Pressure Variable Log Minimum, Maximum Pressure
The meters indicate the lowest and highest pressure the transmitter has measured since the last time the value was cleared. Time Since Event indicates the elapsed time since the min/max pressure was measured.
Both the Min and Max values can be reset independently. Clicking on Reset All Pressure Events will reset the Time Since Event clock and sets the pressure to the currently measured value.
Low CV Change Set, Cleared Advisory
New Sensor Set, Cleared Advisory
Pressure Alert Set, Cleared Advisory
Scaled Variable Low Flow Set, Cleared Advisory
Service Alert Set, Cleared Advisory
SPM High Variation Set, Cleared Advisory
SPM Low Pressure Cutoff Set, Cleared Advisory
SPM Low Variation Set, Cleared Advisory
SPM Mean Change Detected Set, Cleared Advisory
Stuck Key Set, Cleared Advisory
Temperature Alert Set, Cleared Advisory
Temperature Out of Limits Set, Cleared Advisory
Transmitter Startup Advisory
Table 7-9. Possible status events for Diagnostic Log
Alert / Status Criticality
Device Dashboard Fast Keys
3, 2, 2
7-26

Reference Manual 00809-0100-4801, Rev FAOctober 2010 Rosemount 3051S Series
Figure 7-21. Pressure Variable Logging screen
Time Outside Sensor Limits gives the operator/maintenance personnel an indication of possible misapplication of the transmitter. The Lower and Upper operate the same. They both include a Time Since 1st Event, Number of Events, and Total time.
Total Time Above / Below
This is the accumulated time the pressure sensor has been in an over-pressure condition. This elapsed total time is independent of the number of events or frequency; it is the total or sum time the transmitter was in this condition. These values are not resettable.
Time Since 1st Event
The elapsed time since the first over-pressure was detected. This time can be reset by clicking the Reset Time Since 1st Events button.
Number of Events
This is the number of times the pressure sensor has been in an over-pressure condition. These values are not resettable.
Reset Time Since 1st Events
Selecting this reset will set the Since 1st Event for both Above Upper Sensor Limit and Below Lower Sensor Limit to zero.
Reset All Pressure Events
Selecting this will reset all values on this screen to zero with the exception of Total Operating Time, the Total Time above and below sensor limit, and the Number of Events for above and below sensor limit.
7-27

Reference Manual00809-0100-4801, Rev FA
October 2010Rosemount 3051S Series
Temperature Variable Log
Minimum, Maximum Temperature
The meter indicates the lowest and highest temperature the transmitter has measured since the last time the value was cleared. The Time Since Event indicates the elapsed time since that temperature was measured.
Both the Min and Max values can be reset independently. Clicking on Reset All Temperature Events will reset the Time Since Event clock and sets the temperature to the currently measured value.
Figure 7-22. Temperature Variable Logging screen
Time Outside Sensor Limits gives the operator/maintenance personnel an indication of possible misapplication of the transmitter. The Lower and Upper operate the same. They both include a Time Since 1st Event, Number of Events, and Total time.
Total Time Above / Below
This is the accumulated time the temperature sensor has been in an over- temperature condition. This elapsed total time is independent of the number of events or frequency; it is the total or sum time the transmitter was in this condition. These values are not resettable.
Time Since 1st Event
The elapsed time since the first over- temperature was detected. This time can be reset by clicking the Reset Time Since 1st Events button.
Number of Events
This is the number of times the temperature sensor has been in an over- temperature condition. These values are not resettable.
Reset Time Since 1st Events
Selecting this reset will set the Since 1st Event for both Above Upper Sensor Limit and Below Lower Sensor Limit to zero.
Device Dashboard Fast Keys
3, 2, 3
7-28

Reference Manual 00809-0100-4801, Rev FAOctober 2010 Rosemount 3051S Series
Reset All Temperature Events
Selecting this will reset all values on this screen to zero with the exception of Total Operating Time, the Total Time above and below sensor limit, and the Number of Events for above and below sensor limit.
PROCESS ALERTS
Overview Process alerts can be used in addition to alarm or alerts generated in the control system to indicate problems with the process or installation.
Pressure Alerts
Figure 7-23. Process Pressure Alerts screen
Figure 7-23 shows the configuration section for Pressure Alert. If applied pressure goes above or below the alert values, the LCD will indicate a pressure alert and a HART alert will be generated by the transmitter. An active alert will not affect the transmitter’s 4 – 20 mA output signal.
Alert Mode
This setting dictates whether the diagnostic is On or Off. Selecting “On Unlatched” will generate a HART alert when the alert values are tripped. When pressure returns to normal and within the alert limits, the alert is automatically cleared. Selecting “On Latched” will generate the same HART alert but will require a manual reset to clear the alert.
Latched alert action is recommended if 3rd party alert monitor software is likely to miss alerts due to slow polling of HART data.
High Alert Value / Low Alert Value
These are independent trip values for the diagnostic. These values are represented on the graph by the red lines.
Device Dashboard Fast Keys
2, 3, 4, 1
7-29
Reference Manual00809-0100-4801, Rev FA
October 2010Rosemount 3051S Series
Total Event Time (High / Low)
These fields show the total time the transmitter’s input pressure was above the High Alert Value or below the Low Alert Value.
Time Since 1st Event (High / Low)
This is the elapsed time since the first Pressure Alert event for High Alert Value and Low Alert Value. Subsequent events will increment the Total Event Time values but this value will remain unchanged.
Number of Events (High / Low)
This is the number of times the transmitter’s input pressure was above the High Alert Value or below the Low Alert Value.
Reset Alert Events
Selecting this will reset all time stamp values and number of events to zero.
Temperature Alerts
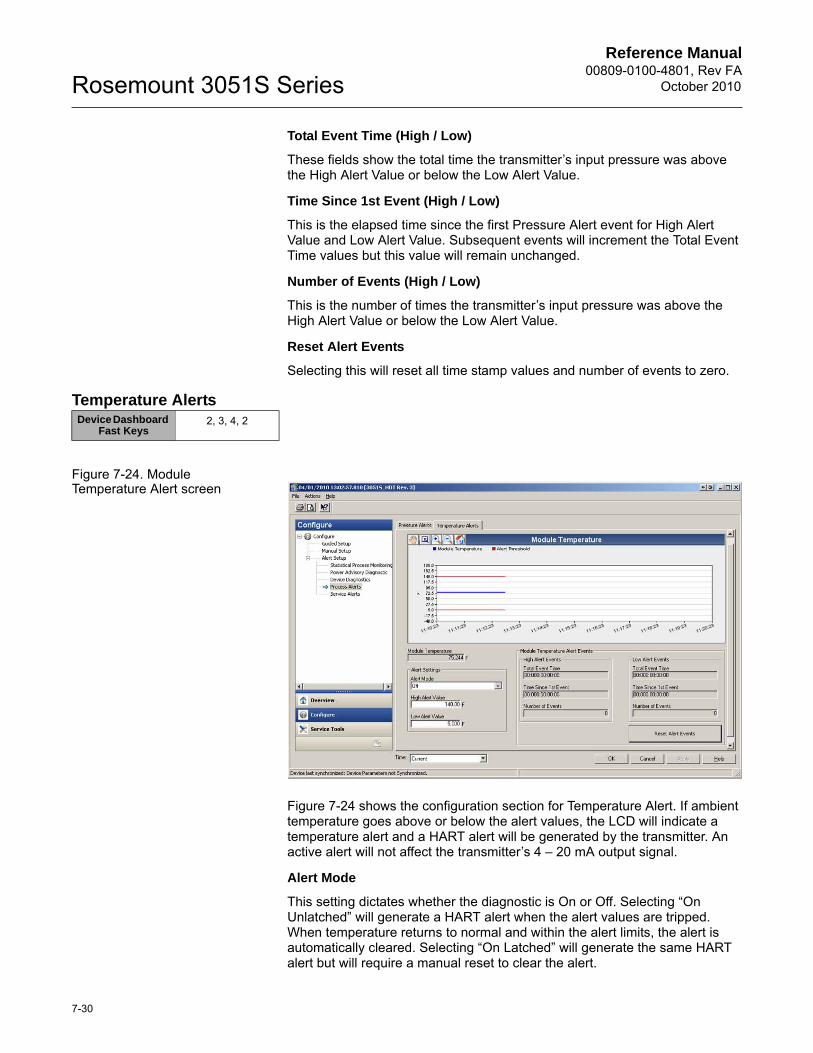
Figure 7-24. Module Temperature Alert screen
Figure 7-24 shows the configuration section for Temperature Alert. If ambient temperature goes above or below the alert values, the LCD will indicate a temperature alert and a HART alert will be generated by the transmitter. An active alert will not affect the transmitter’s 4 – 20 mA output signal.
Alert Mode
This setting dictates whether the diagnostic is On or Off. Selecting “On Unlatched” will generate a HART alert when the alert values are tripped. When temperature returns to normal and within the alert limits, the alert is automatically cleared. Selecting “On Latched” will generate the same HART alert but will require a manual reset to clear the alert.
Device Dashboard Fast Keys
2, 3, 4, 2
7-30

Reference Manual 00809-0100-4801, Rev FAOctober 2010 Rosemount 3051S Series
Latched alert action is recommended if 3rd party alert monitor software is likely to miss alerts due to slow polling of HART data.
High Alert Value / Low Alert Value
These are independent trip values for the diagnostic. These values are represented on the graph by the red lines.
Total Event Time (High / Low)
These fields show the total time the transmitter’s module temperature was above the High Alert Value or below the Low Alert Value.
Time Since 1st Event (High / Low)
This is the elapsed time since the first Temperature Alert event for High Alert Value and Low Alert Value. Subsequent events will increment the Total Event Time values but this value will remain unchanged.
Number of Events (High / Low)
This is the number of times the transmitter’s module temperature was above the High Alert Value or below the Low Alert Value.
Reset Alert Events
Selecting this will reset all time stamp values and number of events to zero.
SERVICE ALERTS
Overview Service Alert can be used to generate a time-based HART alert with customizable message. This can be used to remind personnel when to perform maintenance on the transmitter. When the alert is generated, the LCD will indicate “TIMER ALERT” and a HART alert will be generated by the transmitter. An active alert will not affect the transmitter’s 4 – 20 mA output signal.
Device Dashboard Fast Keys
2, 3, 5
7-31

Reference Manual00809-0100-4801, Rev FA
October 2010Rosemount 3051S Series
Figure 7-25. Service Alert screen
Time Remaining
Amount of time remaining before the HART alert is generated. This value begins counting down to zero as soon as the diagnostic is turned on. Time Remaining can be configured in terms of number of Years, Days, and Hours.
If transmitter loses power, Time Remaining will not continue to count down. Once powered up again, the timer resumes operation.
Message
User customizable message associated to the Service Alert. The message field can contain up to 32 alphanumeric characters and is stored in the non-volatile memory of the transmitter.
Alert Mode
This indicates whether the diagnostic is turned On or Off.
Configure
This method controls the Alert Mode of the diagnostic and allows for configuration of timer and message.
Reset Alert
Selecting this will reset the Time Remaining value and start the count down process again.
DEVICE DIAGNOSTICS
Overview In addition to standard device diagnostics that provide notification of when the transmitter fails, the 3051S HART Diagnostic transmitter has predictive device diagnostics that detect issues in the electronics that may result in on-scale failure.
7-32

Reference Manual 00809-0100-4801, Rev FAOctober 2010 Rosemount 3051S Series
Figure 7-26. Device Diagnostics screen
mA Output Diagnostic The mA Output Diagnostic measures the actual 4 – 20 mA output from the transmitter’s Digital-to-Analog converter and compares it against the output by the transmitter’s microprocessor. If the measured value deviates from the expected value by 2% or more, the diagnostic will generate an alarm or alert.
NOTEThe default trip action for mA Output Diagnostic is set to Alarm. For use in SIS, the trip action must not be changed or the proper safety coverage stated on the FMEDA will not be realized.
Transmitter Power Consumption
Transmitter Power Consumption diagnostic monitors for excessive current draw by the transmitter. This diagnostic is used to detect a potential on-scale failure due to current leakage or failing electronics.
NOTEIf trip action is set to Alarm, the transmitter will drive the 4 – 20 mA output to fail HIGH regardless of the alarm direction configured by the alarm switch.
SMART WIRELESS THUM ADAPTER CONFIGURATION
Overview Many older legacy control systems that only use analog can not take full advantage of HART diagnostics or additional process variables. The Smart Wireless THUM Adapter can transmit up to four process variables and additional HART status information at the user configurable update rate. The selectable process variables are Pressure, Module Temperature, Scaled Variable, Standard Deviation, Mean, and Coefficient of Variation.
7-33

Reference Manual00809-0100-4801, Rev FA
October 2010Rosemount 3051S Series
Installation and Commissioning
Below are the four major steps to commission the 3051S HART Diagnostics transmitter and THUM. Further detail on these steps can be found in the Smart Wireless THUM Adapter instruction manual (p/n 00809-0100-4075).
1. Check the 3051S variable assignments (2nd, 3rd, and 4th variable) and remap as necessary to assign variables intended for use with the THUM.
2. Configure the Network ID and Join Key in order for the THUM to join wireless network.
3. Configure Update Rate for the THUM. This is frequency at which HART data is taken and transmitted over the wireless network.
4. Connect the 3051S to the THUM, as shown in Figure 7-27 on page 7-34, and make sure there is at least 250 Ohms resistance in the loop.
Figure 7-27. Wiring Diagram for 2-Wire Device
NOTEThe Smart Wireless THUM Adapter has a minimum update rate of 8 seconds and may not capture alerts that appeared in between updates. It is recommended to set diagnostic trip action to “Alert Latched” to minimize chance of missed alerts in between updates.
NOTEWhen using Power Advisory Diagnostic and the THUM to detect changes on the electrical loop, a re-characterization of the loop must be performed when the THUM is installed for the first time.
ROSEMOUNT 333 HART TRI-LOOP CONFIGURATION
Overview The Rosemount 333 HART Tri-Loop can be used in conjunction with the Rosemount 3051S with Advanced HART Diagnostics to acquire up to three more variables via 4-20mA analog signals. The additional three outputs are selected by the user and can include: Pressure, Temperature, Scaled Variable, Standard Deviation, Mean, or Coefficient of Variation.
Installation and Commissioning
Below are the four major steps to commission the 3051S and Tri-Loop. Further detail on these steps can be found in the Tri-Loop Instruction manual (document number 00809-0100-4757).
Splice Connector
Wired Device
4-20 mA Loop -
4-20 mA Loop +Ground
- PWR / COMM
+ PWR / COMM
THUM Adapter
Green
Red
Black
White
Yellow
7-34

Reference Manual 00809-0100-4801, Rev FAOctober 2010 Rosemount 3051S Series
1. Check the 3051S variable mapping and remap as necessary to assign the three variables intended to be the Tri-Loop output. Take note of the variable information including variable, variable name, and variable units as it will be necessary to duplicate this exactly in the Tri-Loop for proper operation. Some useful variables for process diagnostics include Standard Deviation, Mean, Coefficient of Variation, and Sensor Temperature.
NOTEThe measured pressure will continue to be reported as a 4 – 20 mA value via the primary variable output.
2. Connect the 3051S to the 333 Tri-Loop. The 3051S 4-20mA output connects to the 333 Burst Input. See Figure 7-28.
Figure 7-28. 333 Tri-Loop Wiring Diagram
3. Configure the Tri-Loop. The Channel configuration must be identical to the variables mapped in the 3051S. Note: The Tri Loop default address is 1. The HART host must be configured to Poll for the 333 in order to find the Tri-Loop.
4. Enable Burst mode in the 3051S. The Burst Mode must be ON and the Burst Option must be set to Process Vars/Crnt.
HAZARDOUS AREA
Intrinsically Safe Barrier
Rosemount 3051S
DINRail MountedHART Trip-Loop
Ch. 3
Ch. 2Ch. 1
Burst Inputto Tri-Loop
RL 250
HART Burst Command 3/Analog Output
Control Room
Devicereceives powerfrom Control Room
Channel 1 must be powered for the Tri-Loop to operate
Each Tri-LoopChannel receivespower fromControl Room
NON HAZARDOUS AREA
7-35

Reference Manual00809-0100-4801, Rev FA
October 2010Rosemount 3051S Series
SAFETY INSTRUMENTED SYSTEMS (SIS) CERTIFICATION
The safety-critical output of the 3051S with Advanced HART Diagnostic is provided through a two-wire, 4 - 20 mA signal representing pressure. The 3051S safety certified pressure transmitter is certified to: Low Demand; Type B. SIL 2 for random integrity @ HFT=0SIL 3 for random integrity @ HFT=1SIL 3 for systematic integrity
3051S Safety Certified Identification
All 3051S transmitters must be identified as safety certified before installing into SIS systems.
NOTEThere are three versions of safety certified 3051S pressure transmitters. For transmitters with a yellow SIS circuit board installed (Output code B), please refer to Manual Supplement 00809-0700-4801. For transmitters without the Advanced HART Diagnostics circuit board installed, please refer to Section 6: Safety Instrumented Systems.
To identify a safety certified 3051S with Advanced HART Diagnostics:
1. Connect a HART host to the transmitter.
2. Check transmitter Revision numbers to verify that Electronics SW rev is 10 or higher and Sensor SW rev is 5 or higher.
Fast Key Sequence - 1, 3, 5, 3
3. Verify that option code DA2 is included in the transmitter model code.
3051S SIS Installation No special installation is required in addition to the standard installation practices outlined in this document. Always ensure a proper seal by installing the electronics housing cover(s).
Environmental limits are available in the 3051S Product Data Sheet (document number 00813-0100-4801). This document can be found at
http://www2.emersonprocess.com/en-US/brands/rosemount/Documentation-and-Drawings/Product-Data-Sheets/Pages/index.aspx
The loop should be designed so the terminal voltage does not drop below
12.0 Vdc when the transmitter output is 23.0 mA.
Security switch should be in the “ON” position during normal operation. See Figure 7-30 on page 7-38.
3051S SIS Commissioning
Use any HART-compliant master to communicate with and verify configuration of the 3051S Safety Certified transmitter with Advanced HART Diagnostics.
Revision Numbers
Field Device 3
Electronics Software 10 or higher
Electronics Hardware 1
Sensor Software 5 or higher
7-36

Reference Manual 00809-0100-4801, Rev FAOctober 2010 Rosemount 3051S Series
For more information on the 375 Field Communicator see document 00809-0100-4276. AMS help can be found in the AMS on-line guides within the AMS system.
NOTETransmitter output is not safety-rated during the following: configuration changes, multidrop, and loop test. Alternative means should be used to ensure process safety during transmitter configuration and maintenance activities.
Statistical Process Monitoring and Power Advisory Diagnostics are shipped with a default configuration. Both these diagnostics must be configured and the trip action set to Alarm before any additional diagnostic coverage can be realized. The default trip action for mA Output Diagnostic is set to Alarm and must not be changed or proper diagnostic coverage will not be realized.
Damping
User-selected damping will affect the transmitters ability to respond to changes in the applied process. The damping value + response time should not exceed the loop requirements.
Fast Key Sequence - 2, 2, 1, 1, 3
Alarm and Saturation Levels
DCS or safety logic solver should be configured to match transmitter configuration. Figure 7-29 identifies the three alarm levels available and their operation values.
Figure 7-29. Alarm LevelsRosemount Alarm Level
Namur Alarm Level
Custom Alarm Level(3)(4)
(1) Transmitter Failure, hardware or software alarm in LO position. (2) Transmitter Failure, hardware or software alarm in HI position.(3) High alarm must be at least 0.1 mA higher than the high saturation value.(4) Low alarm must be at least 0.1 mA lower than the low saturation value.
Normal Operation
4 mA 20 mA20.8 mA
high saturation
21.75(2)
3.9 mAlow saturation
3.75 mA(1)
Normal Operation
4 mA 20 mA20.5 mA
high saturation
22.5(2)
3.8 mAlow saturation
3.6 mA(1)
Normal Operation
4 mA 20 mA20.1 - 20.5 mA
high saturation
20.2 - 23.0(2)
3.7 - 3.9 mAlow saturation
3.6 - 3.8 mA(1)
7-37

Reference Manual00809-0100-4801, Rev FA
October 2010Rosemount 3051S Series
Configuring Alarm and Saturation Levels
1. If using a Field Communicator, use the following fast key sequence to set the Alarm and Saturation values.Fast Key Sequence - 2, 2, 2, 5, 6
2. Manually set the direction for the Alarm to HI or LO using the ALARM switch as shown in Figure 7-30.
Figure 7-30. Security and alarm configuration
3051S SIS Operation and Maintenance
Proof Test
The following proof tests are recommended. Proof test results and corrective actions taken must be documented at http://rosemount.d1asia.ph/rosemount/safety/ReportAFailure_newweb.asp (to report a failure) in the event that an error is found in the safety functionality. All proof test procedures must be carried out by qualified personnel.
Use “Fast Key Sequence” on page 3-6 to perform a Loop Test, Analog Output Trim, or Sensor Trim. Security switch should be in the “OFF” position during proof test execution and repositioned in the “ON” position after execution.
Simple Proof Test
The simple suggested proof test consists of a power cycle plus reasonability checks of the transmitter output. This test will detect ~ 41% of possible DU failures in the device.
Required tools: Field Communicator and mA meter.
1. Bypass the safety function and take appropriate action to avoid a false trip.
2. Use HART communication to set the transmitter in fixed current mode. For the Emerson Field Communicator, enter Fast Key Sequence 3, 5, 1. Select “4 Other.”
3. Enter the milliamp value representing a high alarm state.
4. Check the reference meter to verify the mA output corresponds to the entered value.
5. Enter the milliamp value representing a low alarm state.
6. Check the reference meter to verify the mA output corresponds to the entered value.
7. Remove the bypass and otherwise restore normal operation.
8. Document the test results per your requirements.
9. Place the Security switch in the “ON” position.
Security Alarm
7-38

Reference Manual 00809-0100-4801, Rev FAOctober 2010 Rosemount 3051S Series
Comprehensive Proof Test
The comprehensive proof test consists of performing the same steps as the simple suggested proof test but with a two point calibration of the pressure sensor in place of the reasonability check. This test will detect ~ 87% of possible DU failures in the device.
Required tools: Field Communicator and pressure calibration equipment.
1. Bypass the safety function and take appropriate action to avoid a false trip.
2. Perform Proof Test 1.
3. Perform a minimum two point sensor calibration check using the 4-20 mA range points as the calibration points.
4. Check the reference mA meter to verify the mA output corresponds to the pressure input value.
5. If necessary, use “Choosing a Trim Procedure” on page 4-5 of the 3051S Reference Manual.
6. Document the test results per your requirements.
7. Remove the bypass and otherwise restore normal operation.
8. Place the Security switch in the “ON” position.
NOTEThe user determines the proof test requirements for impulse piping.
Inspection Visual Inspection
Not required
Special Tools
Not required
Product Repair
The 3051S is repairable by major component replacement.
All failures detected by the transmitter diagnostics or by the proof-test must be reported. Feedback can be submitted electronically at http://rosemount.d1asia.ph/rosemount/safety/ReportAFailure_newweb.asp
All product repair and part replacement should be performed by qualified personnel.
3051S SIS Specifications The 3051S must be operated in accordance to the functional and performance specifications provided in the 3051S Product Data Sheet (document number 00813-0100-4801).
Failure Rate Data
The FMEDA report includes failure rates and common cause Beta factor estimates.
The report is available at http://www2.emersonprocess.com/en-US/brands/rosemount/Safety-Products/Pages/index.aspx.
7-39
Reference Manual00809-0100-4801, Rev FA
October 2010Rosemount 3051S Series
Failure Values
Product Life
50 years - based on worst case component wear-out mechanisms - not based on wear-out of process wetted materials
Report any safety related product information at:
http://rosemount.d1asia.ph/rosemount/safety/ReportAFailure_newweb.asp
OTHER INFORMATION
Digital Trim with Non-DD Based Communicators
The 3051S Pressure Transmitter with Advanced Diagnostics makes use of its Device Description to support an enhanced digital trim function. Use of a non-DD based host or communicator may require repeat trims to achieve maximum accuracy.
Temperature Rating
Safety accuracy: 2.0%(1)
Transmitter response time: 145 msDiagnostic response time: 1.5 secondsSelf-diagnostics Test: At least once every 30 minutes
(1) A 2% variation of the transmitter mA output is allowed before a safety trip. Trip values in the DCS or safety logic solver should be derated by 2%.
Temperature rating for the Advanced HART Diagnostic electronics (p/n 03151-9071-000X) is T4. When upgrading a 3051S, the SuperModule and electronics must have equivalent approval labeling in order to maintain hazardous location approvals.
7-40

Reference Manual 00809-0100-4801, Rev FAOctober 2010 Rosemount 3051S Series
7-41
FIELD COMMUNICATOR MENU TREES
Figure 7-31. Overview Menu TreeHome1 Overview2 Configure3 Service Tools
Overview1 Status2 Primary Purpose Variable3 Shortcuts
Status1 Device Status: Good2 Communications: Polled
Shortcuts1 Calibration2 SPM Status3 All Variables4 View Logs5 Device Information
Calibration1 Pressure2 Analog Output3 Restore Factory Calibration
Pressure1 Sensor Calibration2 Range Values3 Current Measurement4 Last Calibration Points5 Sensor Limits
Primary Purpose Variable1 Pressure2 Analog Output
SPM Status1 Detection Status2 Statistical Values3 Time Stamp4 Trends
Analog Output1 Analog Output2 Percent of Range3 Analog Calibration
Detection Status1 SPM Status2 SPM Status (cont.)3 Standard Deviation Sensitivity*4 Mean Sensitivity**
*If CV is selected, "Coefficient of Variation Sensitivity"**If CV is selected, this is not shown
Statistical Values1 Standard Deviation*2 Mean
*Or Coefficient of Variation
Time Stamp1 Time Since Detection2 Total Operating Time
Trends1 Standard Deviation*2 Mean
*If CV is selected, "Coefficient of Variation"All Variables1 Primary Variable2 2nd Variable3 3rd Variable4 4th Variable5 Other Variables
Primary Variable1 <Mapped variable>
2nd Variable1 <Mapped variable>
3rd Variable1 <Mapped variable>
4th Variable1 <Mapped variable>
Other Variables1 <Unmapped variable>2 <Unmapped variable>
Device Information1 General2 Model Numbers3 Revision Numbers4 Materials of ConstructionAlarm and Security
View Logs1 Diagnostic Log2 Pressure Variable Logging3 Temperature Variable Logging
Diagnostic Log1 Most Recent Status Event2 View Other Status Events3 Total Operating Time4 Clear Log
Pressure Variable Logging1 Pressure Variable Log2 Time Outside Sensor Limits3 Pressure4 Total Operating Time5 Reset All Pressure Events
Temperature Variable Logging1 Temperature Variable Log2 Time Outside Sensor Limits3 Module Temperature4 Total Operating Time5 Reset All Temperature Events
Sensor Calibration1 Upper Sensor Trim2 Lower Sensor Trim3 Zero
Range Values1 Upper Range value (20 mA)2 Lower Range Value (4 mA)
Current Measurement1 Pressure2 Damping3 Transfer Function
Last Calibration Points1 Upper2 Lower
Sensor Limits1 Upper2 Lower3 Minimum Span
SPM Status (cont.)1 SPM Insufficient Variability2 SPM Low Pressure Status
Most Recent Status Event1 Event 1 - Time since
View Other Status Events1 Event 2 - Time since2 Event 3 - Time since3 Event 4 - Time since4 Event 5 - Time since5 Event 6 - Time since6 Event 7 - Time since7 Event 8 - Time since8 Event 9 - Time since9 Event 10 - Time since
Pressure Variable Log1 Minimum Pressure2 Time Since Minimum Event3 Reset Minimum4 Maximum Pressure5 Time Since Maximum Event6 Reset Maximum
Time Outside Sensor Limits1 Above Upper Sensor Limit2 Below Lower Sensor Limit3 Reset Time Since 1st Events
Temperature Variable Log1 Minimum Temperature2 Time Since Minimum Event3 Reset Minimum4 Maximum Temperature5 Time Since Maximum Event6 Reset Maximum
Time Outside Sensor Limits1 Above Upper Sensor Limit2 Below Lower Sensor Limit3 Reset Time Since 1st Events
General1 Tag2 Model3 Date4 Descriptor5 Message6 Serial Number
Model Numbers1 Model Number 12 Model Number 23 Model Number 3
Revision Numbers1 HART Universal2 Field Device3 Electronics SW4 Electronics HW5 Sensor SW6 Sensor HW
Materials of Construction1 Sensor Module Information2 Flange Information3 Remote Seal Information
Alarm and Security1 Alarm Direction2 High Alarm3 High Saturation4 Low Saturation5 Low Alarm6 Write Protect Status7 Local ZERO/SPAN Buttons
Serial Number1 Transmitter2 Electronics
Sensor Module Information1 Serial Number2 Type3 Configuration4 Sensor Range5 Sensor Limits6 Isolator Material7 Fill Fluid
Flange Information1 Process Connection2 Process Connection Material3 O-ring Material4 Drain Vent Material
Remote Seal Information1 Number2 Type3 Diaphragm Material4 Fill Fluid

Reference Manual00809-0100-4801, Rev FA
October 2010Rosemount 3051S Series
Figure 7-32. Configure (Guided Setup and Manual Setup) Menu TreeHome1 Overview2 Configure3 Service Tools
Configure1 Guided Setup2 Manual Setup3 Alert Setup (see Figure 7-33)
Guided Setup1 Initial Setup2 Diagnostics Setup3 Optional Configuration
Manual Setup1 Process Variables2 Analog Output3 Scaled Variable4 Display Options5 HART6 Security7 Device Information
Initial Setup1 Basic Setup2 Zero Trim
Diagnostics Setup1 Statistical Process Monitoring2 Power Advisory3 Process Alerts4 Service Alert
Optional Configuration1 Configure Display2 Configure Burst Mode
Basic Setup1 Device Tagging2 Units of Measure3 Pressure Damping4 Variable Mapping5 Analog Output6 Config Alarm & Saturation Levels
Display Options1 Pressure: On or Off2 Scaled Variable: On or Off3 Module Temperature: On or Off4 Percent of Range: On or Off5 Standard Deviation: On or Off6 Mean: On or Off7 Coefficient of Variation: On or Off
Process Variables1 Pressure Setup2 Module Temperature Setup
Analog Output1 Set Range Points2 Set Range Points Manually3 Sensor Limits4 Readings5 Alarm and Saturation Levels
Pressure Setup1 Pressure2 Units3 Damping4 Transfer Function
Module Temperature Setup1 Module Temperature2 Units
Set Range Points1 PV Upper Range Value2 PV Lower Range Value3 Primary Variable
Set Range Points Manually1 Range By Applying Pressure
Sensor Limits1 Upper2 Lower3 Minimum Span
Readings1 Analog Output2 Percent of Range
Alarm and Saturation Levels1 Alarm Direction2 High Alarm3 High Saturation4 Low Saturation5 Low Alarm6 Config Alarm & Saturation Levels
Scaled Variable Setup1 Scaled Variable2 Units3 Transfer Function4 Linear Options*5 Configure Scaled Variable*If Square Root is selected for Transfer Function, "Square Root Options"
Linear Options1 Offset
Square Root Options1 Cutoff Mode2 Low Flow Cutoff
Display1 Display Options Display Options
1 Pressure: On or Off2 Scaled Variable: On or Off3 Module Temperature: On or Off4 Percent of Range: On or Off5 Standard Deviation: On or Off6 Mean: On or Off7 Coefficient of Variation: On or Off
HART1 Variable Mapping2 Burst Mode Configuration3 Communication Settings
Variable Mapping1 Primary Variable2 2nd Variable3 3rd Variable4 4th Variable
Burst Mode Configuration1 Mode2 Option
Communication Settings1 Polling Address
Security1 Write Protect Status2 Local ZERO/SPAN Buttons
Device Information1 Identification2 Flange Information3 Remote Seal Information
Identification1 Tag2 Model3 Date4 Descriptor5 Message6 Transmitter Serial Number7 Model Numbers
Flange Information1 Process Connection2 Process Connection Material3 O-ring Material4 Drain/Vent Material
Remote Seal Information1 Number2 Type3 Diaphragm Material4 Fill Fluid
7-42

Reference Manual 00809-0100-4801, Rev FAOctober 2010 Rosemount 3051S Series
Figure 7-33. Configure (Alert Setup) Menu Tree
Home1 Overview2 Configure3 Service Tools
Configure1 Guided Setup2 Manual Setup3 Alert Setup
Alert Setup1 Statistical Process Monitoring2 Power Advisory Diagnostic3 Device Diagnostics4 Process Alerts5 Service Alerts
Statistical Process MonitoringStatusBaseline ConfigurationDetection ConfigurationOperational Values
Status1 Detection Status2 SPM Control3 Statistical Values4 Time Stamp5 Trends
Detection Status1 SPM Status2 SPM Status (cont.)3 Standard Deviation Sensitivity*4 Mean Sensitivity**
*If CV is selected, "Coefficient of Variation Sensitivity"**If CV is selected, this is not shown
SPM Control1 Mode2 Reset3 Relearn
Statistical Values1 Standard Deviation*2 Mean
*Or Coefficient of Variation
Time Stamp1 Time Since Detection2 Total Operating Time
Trends1 View Standard Deviation Trend*2 View Mean Trend
*Or Coefficient of Variation
Baseline Configuration1 Learn Settings2 Verification Criteria
Learn Settings1 SPM Variable2 Learn/Monitor Period3 Power Interruption Action4 Low pressure Cut-off *
*Shown only when CV is selected
Verification Criteria1 Insufficient Variability2 Standard Deviation Difference3 Mean Difference
Detection Configuration1 Standard Deviation Detection Settings*2 Mean Detection Settings**
*If CV is selected, "Coefficient of Variation Detection Settings"**If CV is selected, this is not shown
Standard Deviation Change*1 Standard Deviation Sensitivity2 Threshold Value**3 Configure Sensitivity4 Action5 Alert Delay6 High Detection Message7 Low Detection Message
* If CV is selected, “Coefficient of Variation Change”**Shown only if Sensitivity is set to "Custom"
Mean Change**1 Mean Sensitivity2 Threshold Value3 Configure Sensitivity4 Action5 Mean Change Message
**If CV is selected, this is not shown
Operational Values1 Standard Deviation2 Mean3 Coefficient of Variation4 SPM Detection Values5 Number of Relearns6 Reset Relearn Counter
SPM Detection Values1 Standard Deviation2 Mean3 Coefficient of Variation
Power Advisory Diagnostic1 Power Advisory Diagnostic2 Loop Power Characterization
Power Advisory Diagnostic1 Terminal Voltage2 Terminal Voltage Deviation Limit3 Action4 Reset Alert
Loop Power Characterization1 Resistance2 Power Supply3 Characterization Time Stamp4 Characterize Loop
Resistance1 Previous Baseline2 Baseline
Power Supply1 Previous Baseline2 Baseline
Characterization Time Stamp1 Previous Characterization2 Time Since Characterization
Device Diagnostics1 mA Output Diagnostic2 Transmitter Power Consumption
mA Output Diagnostic1 Action2 Reset Alert
Transmitter Power Consumption1 Action2 Reset Alert
Process Alerts1 Pressure Alerts2 Temperature Alerts
Pressure Alerts1 View Trend2 Pressure3 Alert Settings4 Pressure Alert Events
Temperature Alerts1 View Trend2 Module Temperature3 Alert Settings4 Module Temperature Alert Events
Service Alerts1 Time Remaining2 Message3 Alert Mode4 Configure5 Reset Alert
Alert Settings1 Alert Mode2 High Alert Value3 Low Alert Value
Pressure Alert Events1 High Alert Events2 Low Alert Events3 Reset Alert Events
Alert Settings1 Alert Mode2 High Alert Value3 Low Alert Value
Temperature Alert Events1 High Alert Events2 Low Alert Events3 Reset Alert Events
7-43
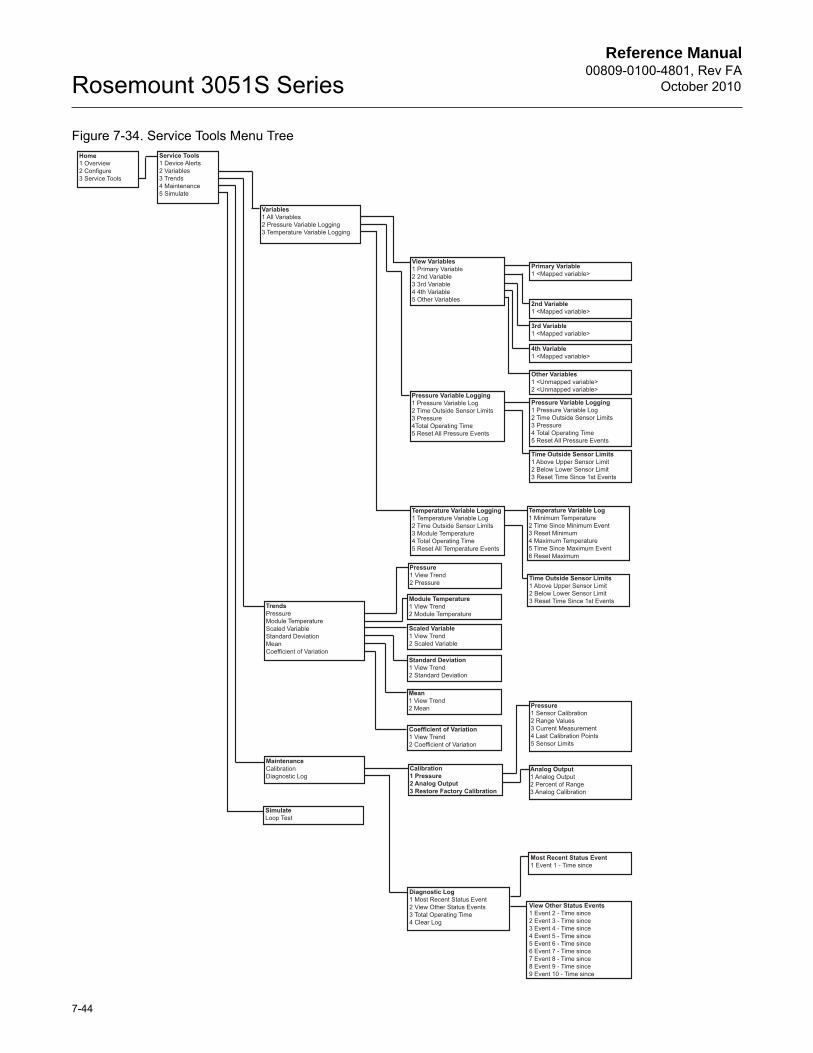
Reference Manual00809-0100-4801, Rev FA
October 2010Rosemount 3051S Series
Figure 7-34. Service Tools Menu TreeHome1 Overview2 Configure3 Service Tools
Service Tools1 Device Alerts2 Variables3 Trends4 Maintenance5 Simulate
View Variables1 Primary Variable2 2nd Variable3 3rd Variable4 4th Variable5 Other Variables
Variables1 All Variables2 Pressure Variable Logging3 Temperature Variable Logging
Pressure Variable Logging1 Pressure Variable Log2 Time Outside Sensor Limits3 Pressure4Total Operating Time5 Reset All Pressure Events
Primary Variable1 <Mapped variable>
2nd Variable1 <Mapped variable>
3rd Variable1 <Mapped variable>
4th Variable1 <Mapped variable>
Other Variables1 <Unmapped variable>2 <Unmapped variable>
Pressure Variable Logging1 Pressure Variable Log2 Time Outside Sensor Limits3 Pressure4 Total Operating Time5 Reset All Pressure Events
Time Outside Sensor Limits1 Above Upper Sensor Limit2 Below Lower Sensor Limit3 Reset Time Since 1st Events
Temperature Variable Logging1 Temperature Variable Log2 Time Outside Sensor Limits3 Module Temperature4 Total Operating Time5 Reset All Temperature Events
Temperature Variable Log1 Minimum Temperature2 Time Since Minimum Event3 Reset Minimum4 Maximum Temperature5 Time Since Maximum Event6 Reset Maximum
Time Outside Sensor Limits1 Above Upper Sensor Limit2 Below Lower Sensor Limit3 Reset Time Since 1st Events
TrendsPressureModule TemperatureScaled VariableStandard DeviationMeanCoefficient of Variation
MaintenanceCalibrationDiagnostic Log
Pressure1 View Trend2 Pressure
Module Temperature1 View Trend2 Module Temperature
Scaled Variable1 View Trend2 Scaled Variable
Standard Deviation1 View Trend2 Standard Deviation
Mean1 View Trend2 Mean
Coefficient of Variation1 View Trend2 Coefficient of Variation
SimulateLoop Test
Calibration1 Pressure2 Analog Output3 Restore Factory Calibration
Pressure1 Sensor Calibration2 Range Values3 Current Measurement4 Last Calibration Points5 Sensor Limits
Analog Output1 Analog Output2 Percent of Range3 Analog Calibration
Diagnostic Log1 Most Recent Status Event2 View Other Status Events3 Total Operating Time4 Clear Log
Most Recent Status Event1 Event 1 - Time since
View Other Status Events1 Event 2 - Time since2 Event 3 - Time since3 Event 4 - Time since4 Event 5 - Time since5 Event 6 - Time since6 Event 7 - Time since7 Event 8 - Time since8 Event 9 - Time since9 Event 10 - Time since
7-44