section 3 full scale facility considerations · 2015-11-15 · 3.1 energy conservation the energy...
TRANSCRIPT
January 2013 3‐1
Section 3
Full‐Scale Facility Considerations
This section presents energy conservation opportunities and other design considerations for the Full‐Scale Facility based on observations made during operation of the Demonstration Facility.
3.1 Energy Conservation The energy conservation considerations for the Full‐Scale Facility provided herein are based on operational experience of the Demonstration Facility from start‐up in mid‐June 2011 through the end of the Q4 Testing Period (ending July 31, 2012). Energy conservation considerations are presented for the water purification processes: membrane filtration, reverse osmosis, and UV disinfection and advanced oxidation.
3.1.1 Membrane Filtration At the Demonstration Facility, the power consumption of the UF system was consistently higher than the MF system; however, this is attributed to differences in the size and type of compressors used to control automatic valves. The UF system air compressor design may have been oversized and could be optimized in full‐scale design. Both MF and UF similarly achieved the membrane filtration water quality goals throughout the testing period. A full‐scale MF system is not anticipated to have significantly lower power consumption than a full‐scale UF system and, therefore, both MF and UF should be equally considered for the Full‐Scale Facility.
Variable Speed Feed Pumps
The AWP Facility influent pumps will pump tertiary effluent prior to chlorination from North City to the Full‐Scale Facility. The pumps will need to ramp up and down through a wide range of speed settings to accommodate backwashing (approximately twice an hour for each membrane filtration skid) and daily integrity testing. The flow can be modulated using either throttling valves or variable speed drives; the throttling valves will be less expensive on a capital cost basis, but variable speed drives will use power more efficiently and are expected to be less expensive on a lifecycle cost basis. Variable speed feed pumps should therefore be considered for the Full‐Scale Facility to conserve energy and reduce overall project costs.
Lifecycle Selection for Membrane Filtration System
Before detailed design, it is recommended that the City conduct additional side‐by‐side pilot testing of multiple membrane filtration system vendors. The purpose of the testing would be to prequalify vendors and establish design criteria for the vendor’s most‐recent equipment designs to gather actual operational data to be used for the lifecycle bid evaluation. The data for each vendor could be used to allow the City to procure the membrane filtration system on a lifecycle‐cost basis to select the most cost‐effective system in terms of both capital and O&M costs (including power usage) and be confident that the selected equipment can meet the design criteria.
3.1.2 Reverse Osmosis Two energy saving measures recommended for the RO system are the use of a two‐stage design rather than a three‐stage and the incorporation of energy recovery devices.
Section 3 Full‐Scale Facility Considerations
January 2013 3‐2
Two‐Stage Reverse Osmosis System
During the testing period, it was observed that the three‐stage system required an average eight percent higher feed pressure than the two‐stage system under similar operating conditions (i.e., flux, recovery, antiscalant dose, temperature). The higher pressure requirement is attributed to the vessel configuration rather than differences in the membranes, because the specific flux for the membranes used in both trains were identical. Similar water quality results (as measured by TOC, UV254, nitrate, etc.) were observed by both RO systems throughout the testing period. A two‐stage RO system should, therefore, be considered for the Full‐Scale Facility to reduce the power usage.
Energy Recovery Devices
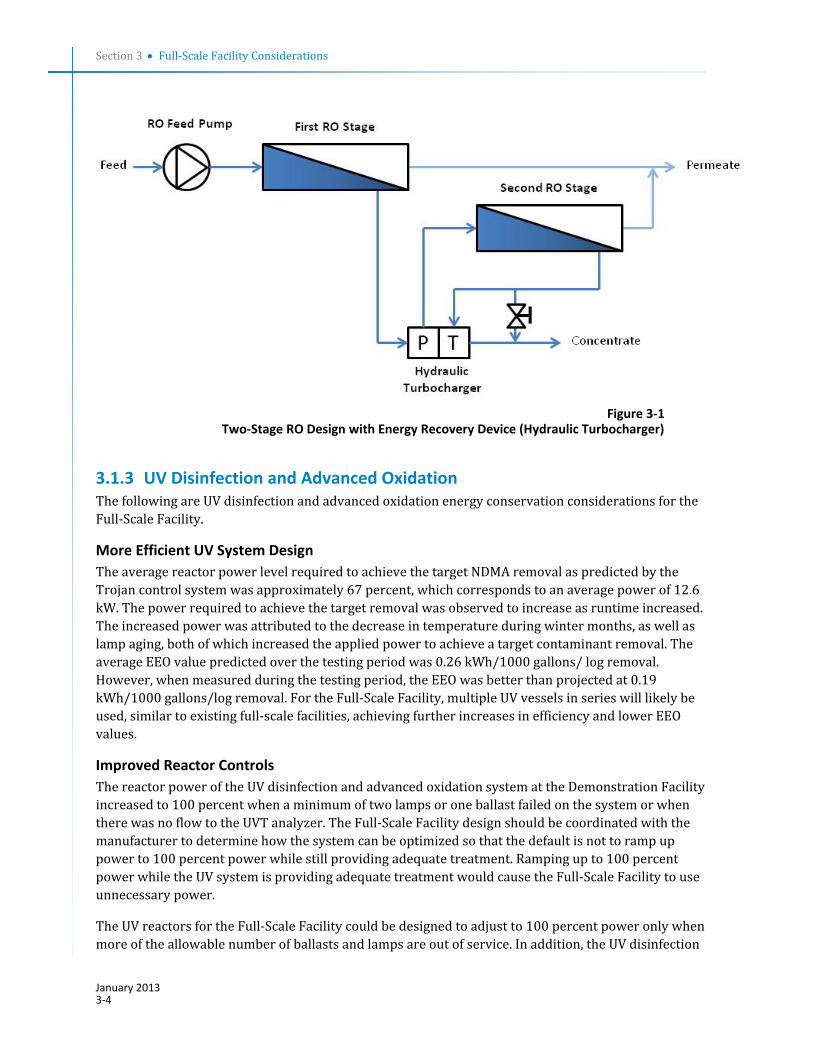
The design of the Demonstration Facility included energy recovery devices to reduce the overall power usage of the RO systems and evaluate their potential benefits for the Full‐Scale Facility. While numerous types of energy recovery devices are available and in use at desalination facilities, recovering as much as 98 percent of the waste energy from concentrate streams, the lower efficiency centrifugal‐type devices are generally the only devices applicable for low salinity applications, such as this. Figure 3‐1 illustrates the configuration of the centrifugal style TurboCharger energy recovery devices employed at the Demonstration Facility. These devices make use of residual energy from the concentrate stream of the second RO stage to drive a turbine coupled with a pump (the turbine/pump combination represents the energy recovery device). The pump then provides a pressure boost to the interstage water feeding the second RO stage. Using an energy recovery device in this manner has two intrinsic benefits: first, the pressure boost to the second stage reduces the required feed pressure for the overall system; and second, by providing an interstage boost, the production of the first and second stage can be more evenly balanced, reducing the risk of fouling from poor hydraulic conditions within the RO membranes. While the immediate economic benefits of reduced feed pressure can be easily calculated, the longer term benefits from reduced rates of fouling are more difficult to quantify, and are therefore not included in the evaluation presented below.
The actual energy savings achieved by the energy recovery devices at the Demonstration Facility was compared against values predicted during design using RO design software and efficiency projections from the energy recovery device manufacturer (Energy Recovery Inc). IMSDesign software (v.2012) was used to model the two‐stage side of the Demonstration Facility, and an interstage boost of 24 psi (boost pressure to the second stage) was projected for one‐year‐old membrane elements, based on the average water quality conditions seen during the first twelve months of operation. Actual interstage boost for this side of the system averaged 23 psi after initial repairs on the device had been completed, indicating that the projected efficiency was within five percent of the values measured. This same software model was then used to estimate the potential energy savings for the Full‐Scale Facility, assuming an average feed water TDS of 1,100 mg/L, based on historic concentrations observed at North City. A two‐stage RO system was assumed, using Hydranautics ESPA2 membranes and a hydraulic recovery of 85 percent. Projections were run for three different membrane ages, with older membranes characterized by higher feed pressures and higher available energy for the recovery devices.
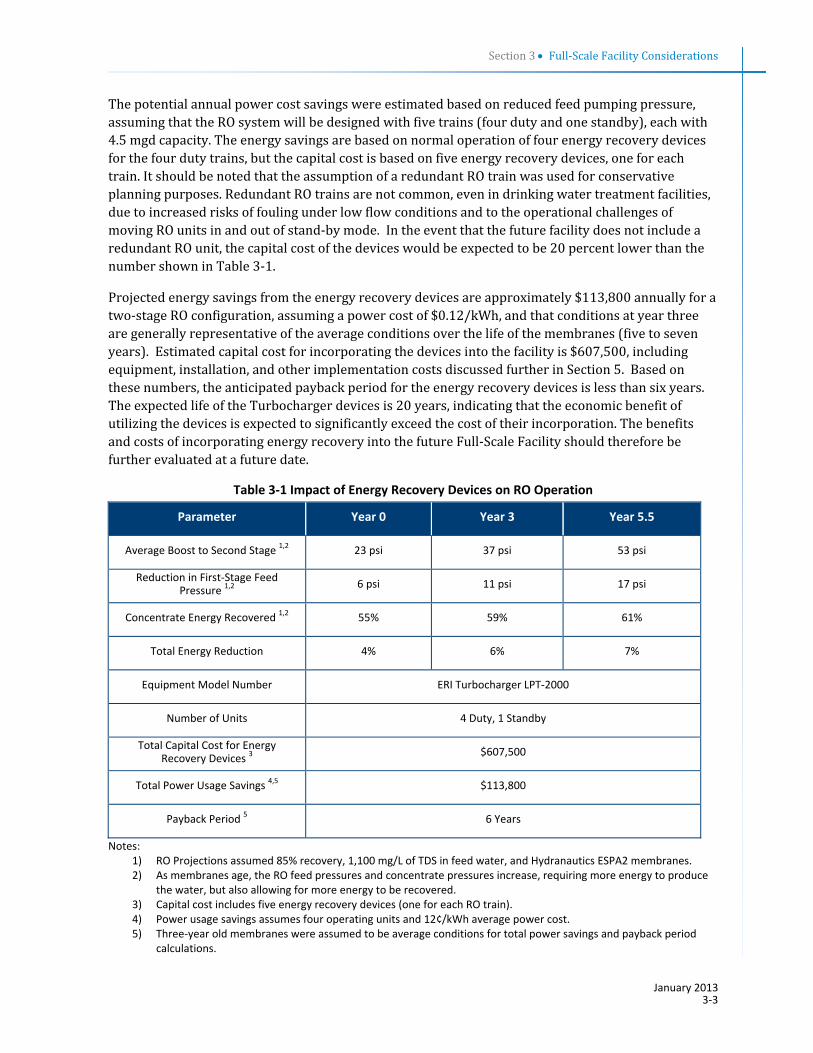
Table 3‐1 presents results of the energy recovery projections for initial operation (year zero), three years, and five years. The table includes the anticipated boost pressure to the second stage, the expected impact this boost will have in reducing the overall feed pressure to the RO system, and the overall efficiency at which energy is expected to be recovered from the concentrate under these operating conditions. The table also includes assumed design criteria for the energy recovery device and the anticipated cost and economic benefit of employing the devices for the Full‐Scale Facility.
Section 3 Full‐Scale Facility Considerations
January 2013 3‐3
The potential annual power cost savings were estimated based on reduced feed pumping pressure, assuming that the RO system will be designed with five trains (four duty and one standby), each with 4.5 mgd capacity. The energy savings are based on normal operation of four energy recovery devices for the four duty trains, but the capital cost is based on five energy recovery devices, one for each train. It should be noted that the assumption of a redundant RO train was used for conservative planning purposes. Redundant RO trains are not common, even in drinking water treatment facilities, due to increased risks of fouling under low flow conditions and to the operational challenges of moving RO units in and out of stand‐by mode. In the event that the future facility does not include a redundant RO unit, the capital cost of the devices would be expected to be 20 percent lower than the number shown in Table 3‐1.
Projected energy savings from the energy recovery devices are approximately $113,800 annually for a two‐stage RO configuration, assuming a power cost of $0.12/kWh, and that conditions at year three are generally representative of the average conditions over the life of the membranes (five to seven years). Estimated capital cost for incorporating the devices into the facility is $607,500, including equipment, installation, and other implementation costs discussed further in Section 5. Based on these numbers, the anticipated payback period for the energy recovery devices is less than six years. The expected life of the Turbocharger devices is 20 years, indicating that the economic benefit of utilizing the devices is expected to significantly exceed the cost of their incorporation. The benefits and costs of incorporating energy recovery into the future Full‐Scale Facility should therefore be further evaluated at a future date.
Table 3‐1 Impact of Energy Recovery Devices on RO Operation
Parameter Year 0 Year 3 Year 5.5
Average Boost to Second Stage 1,2 23 psi 37 psi 53 psi
Reduction in First‐Stage Feed Pressure 1,2
6 psi 11 psi 17 psi
Concentrate Energy Recovered 1,2 55% 59% 61%
Total Energy Reduction 4% 6% 7%
Equipment Model Number ERI Turbocharger LPT‐2000
Number of Units 4 Duty, 1 Standby
Total Capital Cost for Energy Recovery Devices 3
$607,500
Total Power Usage Savings 4,5 $113,800
Payback Period 5 6 Years
Notes: 1) RO Projections assumed 85% recovery, 1,100 mg/L of TDS in feed water, and Hydranautics ESPA2 membranes. 2) As membranes age, the RO feed pressures and concentrate pressures increase, requiring more energy to produce
the water, but also allowing for more energy to be recovered. 3) Capital cost includes five energy recovery devices (one for each RO train). 4) Power usage savings assumes four operating units and 12¢/kWh average power cost. 5) Three‐year old membranes were assumed to be average conditions for total power savings and payback period
calculations.
Section 3 Full‐Scale Facility Considerations
January 2013 3‐4
Figure 3‐1
Two‐Stage RO Design with Energy Recovery Device (Hydraulic Turbocharger)
3.1.3 UV Disinfection and Advanced Oxidation The following are UV disinfection and advanced oxidation energy conservation considerations for the Full‐Scale Facility.
More Efficient UV System Design
The average reactor power level required to achieve the target NDMA removal as predicted by the Trojan control system was approximately 67 percent, which corresponds to an average power of 12.6 kW. The power required to achieve the target removal was observed to increase as runtime increased. The increased power was attributed to the decrease in temperature during winter months, as well as lamp aging, both of which increased the applied power to achieve a target contaminant removal. The average EEO value predicted over the testing period was 0.26 kWh/1000 gallons/ log removal. However, when measured during the testing period, the EEO was better than projected at 0.19 kWh/1000 gallons/log removal. For the Full‐Scale Facility, multiple UV vessels in series will likely be used, similar to existing full‐scale facilities, achieving further increases in efficiency and lower EEO values.
Improved Reactor Controls
The reactor power of the UV disinfection and advanced oxidation system at the Demonstration Facility increased to 100 percent when a minimum of two lamps or one ballast failed on the system or when there was no flow to the UVT analyzer. The Full‐Scale Facility design should be coordinated with the manufacturer to determine how the system can be optimized so that the default is not to ramp up power to 100 percent power while still providing adequate treatment. Ramping up to 100 percent power while the UV system is providing adequate treatment would cause the Full‐Scale Facility to use unnecessary power.
The UV reactors for the Full‐Scale Facility could be designed to adjust to 100 percent power only when more of the allowable number of ballasts and lamps are out of service. In addition, the UV disinfection
Section 3 Full‐Scale Facility Considerations
January 2013 3‐5
and advanced oxidation system could be specified to have a lag time before adjusting to 100 percent power if the UVT analyzer experiences no flow. The flow to the UVT analyzer can be corrected by operations staff based on a system alarm.
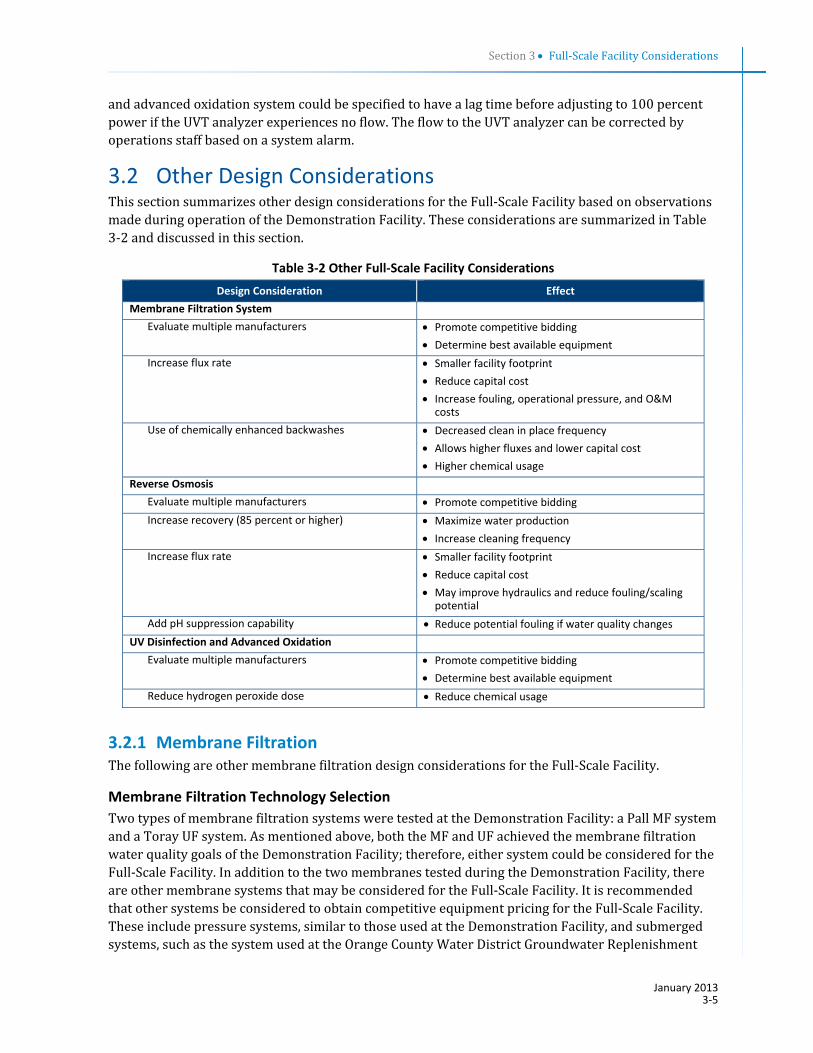
3.2 Other Design Considerations This section summarizes other design considerations for the Full‐Scale Facility based on observations made during operation of the Demonstration Facility. These considerations are summarized in Table 3‐2 and discussed in this section.
Table 3‐2 Other Full‐Scale Facility Considerations
Design Consideration Effect
Membrane Filtration System
Evaluate multiple manufacturers Promote competitive bidding
Determine best available equipment
Increase flux rate Smaller facility footprint
Reduce capital cost Increase fouling, operational pressure, and O&M costs
Use of chemically enhanced backwashes Decreased clean in place frequency Allows higher fluxes and lower capital cost Higher chemical usage
Reverse Osmosis
Evaluate multiple manufacturers Promote competitive bidding
Increase recovery (85 percent or higher) Maximize water production
Increase cleaning frequency Increase flux rate Smaller facility footprint
Reduce capital cost May improve hydraulics and reduce fouling/scaling potential
Add pH suppression capability Reduce potential fouling if water quality changesUV Disinfection and Advanced Oxidation
Evaluate multiple manufacturers Promote competitive bidding
Determine best available equipment
Reduce hydrogen peroxide dose Reduce chemical usage
3.2.1 Membrane Filtration The following are other membrane filtration design considerations for the Full‐Scale Facility.
Membrane Filtration Technology Selection
Two types of membrane filtration systems were tested at the Demonstration Facility: a Pall MF system and a Toray UF system. As mentioned above, both the MF and UF achieved the membrane filtration water quality goals of the Demonstration Facility; therefore, either system could be considered for the Full‐Scale Facility. In addition to the two membranes tested during the Demonstration Facility, there are other membrane systems that may be considered for the Full‐Scale Facility. It is recommended that other systems be considered to obtain competitive equipment pricing for the Full‐Scale Facility. These include pressure systems, similar to those used at the Demonstration Facility, and submerged systems, such as the system used at the Orange County Water District Groundwater Replenishment
Section 3 Full‐Scale Facility Considerations
January 2013 3‐6
System. While there are basic conceptual differences between these two systems, the more significant differences are between manufacturers and systems in operating pressures, recovery, and efficiency between the systems and operating configurations. Therefore, lifecycle evaluations of multiple membrane filtration system vendors are recommended (refer to Section 3.1.1). Any manufacturer/equipment considered should meet the minimum qualifications discussed in Section 4.2.10.
Optimize Membrane Filtration Operating Conditions
Based on the relatively low membrane fouling rates observed for the MF and UF systems during the reporting period, it may be possible to optimize the operating conditions for the potential Full‐Scale Facility by increasing the operating flux and feed water recovery. Such changes would result in a smaller footprint (i.e., fewer number of skids) to achieve the target production capacity thereby reducing the initial capital cost. Increasing the feed water recovery would also reduce the volume of backwash waste that would be required to be discharged to North City. This would also increase the Full‐Scale Facility capacity based on the fixed available capacity of tertiary effluent.
Increasing these parameters could also increase the membrane fouling rates and operating pressure, which would result in higher O&M costs by increasing the frequency of chemical cleanings and feed pump pressure requirements. Optimization of these parameters would be specifically beneficial for the MF system as the system was operated at a lower feed water recovery than the UF system and exhibited a lower fouling rate.
Another operating condition that could be investigated is the use of chemically enhanced backwashes or frequent (daily or weekly) maintenance cleans to lessen membrane fouling thereby decreasing the number of full chemical cleanings required over a given time period. Both of these actions would increase the chemical usage (and O&M cost) of the Full‐Scale Facility.
Flow Equalization of Membrane Filtrate
During operation of the Demonstration Facility, excess filtrate water produced from the MF and UF systems overflowed the filtrate tank to the drain. The filtrate storage tank was sized to accommodate downtime of the MF and UF system during the daily PDTs conducted on each system. It was also observed that the overflow of filtrate water from the storage tank increased when the feed water recovery of the RO systems was increased from 80 percent to 85 percent recovery as the RO feed water flow to meet the design permeate flow decreased. The design and operating strategy of the MF or UF system and filtrate storage tank for the Full‐Scale Facility should be optimized to avoid wasting filtrate water and meet the demand of the RO system.
3.2.2 Reverse Osmosis The following are other RO design considerations for the Full‐Scale Facility.
Reverse Osmosis Technology Selection
Comparison of the two‐stage and three‐stage RO system performance during this reporting period showed similar membrane fouling rates and permeate water quality despite the fact that the Hydranautics ESPA2 LD membranes are advertised as low fouling membranes and the Toray TML membranes were projected to achieve higher rejection of nitrate. In addition to the two membranes tested during the Demonstration Facility, there are other RO membranes that should be considered for the Full‐Scale Facility and new membranes will be developed before the Full‐Scale Facility is designed. It is recommended that other membranes be tested to assess their operating performance
Section 3 Full‐Scale Facility Considerations
January 2013 3‐7
(i.e., scaling and fouling rates) and permeate water quality in order to obtain competitive equipment pricing for the Full‐Scale Facility. Any manufacturer/equipment considered should meet the minimum qualifications discussed in Section 4.2.10.
85 Percent RO Recovery to Maximize Water Production
Based on the low fouling rates observed on the RO systems during nearly six months of operation at 80 percent recovery, the RO systems were successfully increased to 85 percent recovery to maximize water production. In previous pilot testing conducted by the City, stable operations were not achievable at 85 percent recovery due to excessive fouling and scaling. The same effects have not been observed at the Demonstration Facility, possibly due to improved system hydraulics from higher fluxes (the piloting was done at fluxes between 10 and 12 gfd), or due to changes in water quality since the piloting was completed. Further consideration of recoveries as high as 87 to 88 percent could also be considered if additional water production is required, however, these higher recoveries should be successfully tested at the Demonstration Facility before considering them for full‐scale design.
While increasing the recovery would increase the overall capacity of the Full‐Scale Facility, long term operation at the higher recovery rates may warrant more O&M requirements. Such requirements may include an increase in the number of chemical cleanings due to increased membrane fouling and scaling and increased membrane replacement frequency. Although the antiscalant type and dose was sufficient without acid to prevent fouling during operation of the Demonstration Facility, water quality will change over time and could require changes in antiscalant or potentially the use of acid to maintain operation at 85 percent recovery for the Full‐Scale Facility. If further increases above 85 percent recovery are considered, additional changes may be required, such as increases in RO flux or the addition of a third RO stage.
Higher RO Design Flux
While RO systems at the Demonstration Facility were tested at design flux of 12 gfd and feed water recoveries of 80 and 85 percent, the Full‐Scale Facility design may consider a higher flux rate of 14 gfd. A pilot study performed at the Los Angeles Donald C. Tillman Water Reclamation Plant (Wetterau et al, 2011) observed that poor hydraulic conditions—high beta values or low crossflow velocities—can contribute to fouling in a two‐stage RO configuration when an overall average flux below 12 gfd is maintained with a recovery of 85 percent. These findings are supported by challenges with scaling that have been experienced at the Leo J. Vander Lans Water Treatment Facility and the Terminal Island AWP Facility, both designed with two‐stage RO and 85 percent recovery. Both facilities are in the process of expanding, and both will be operated at fluxes above 12 gfd when the expansions are complete.
It is recommended that an RO flux of 14 gfd be considered for the Full‐Scale Facility in a two‐stage configuration to take advantage of improved hydraulics and reduced scaling potential, and to allow some degree of turn‐down for the RO skids during low supply flow conditions. To confirm the reliability of plant operation under such conditions, a higher flux should be tested with North City’s tertiary effluent before the design of the Full‐Scale Facility.
3.2.3 UV Disinfection and Advanced Oxidation The following are other UV disinfection and advanced oxidation design considerations for the Full‐Scale Facility.
Section 3 Full‐Scale Facility Considerations
January 2013 3‐8
Power Monitoring for Ballast Failure
The UV system at the Demonstration Facility had several ballast failures. While it is suspected that the ballast failures were caused by faulty ballasts, there is a chance that they could have been caused by power surges. The design of the Full‐Scale Facility should include power monitoring of the Full‐Scale Facility power sources to determine if a transient voltage surge suppressor should be included in the UV system design.
Optimize UVT Analyzer Inlet Connection
For the Full‐Scale Facility, the UVT analyzer inlet connection should be located in a pipe run that is always running full with RO permeate and away from areas where air entrainment could be introduced. Air entrainment in the UVT analyzer inlet connection caused the UVT analyzer to malfunction several times at the Demonstration Facility, due primarily to the need for overhead piping at the Demonstration Facility. Such flow configurations should be avoided, to the extent possible, in the Full‐Scale Facility design.
Optimize Hydrogen Peroxide Dose
The UV disinfection and advanced oxidation system at the Demonstration Facility was designed to achieve 1.2‐log removal of NDMA based on the draft 2008 CDPH Groundwater Recharge Reuse Regulations. During the testing period, however, the CDPH revised the draft regulations (November 21, 2011) to specify that advanced oxidation be sized to achieve only 0.5‐log removal of 1,4‐dioxane or on demonstrated log removals of select indicator compounds from different functional groups. This change may make it possible to design the UV disinfection and advanced oxidation system at the Full‐Scale Facility a lower UV dose. Based on initial studies completed by the Orange County Water District, it may also be possible to reduce the hydrogen peroxide dose below 3 mg/L and still achieve the 0.5‐log removal requirement for 1,4‐dioxane.
3.2.4 Chemical Systems The following are other chemical systems design considerations for the Full‐Scale Facility.
Prevent Air Locking
The chemical in the full scale design should be designed to prevent air locking, locating metering pumps sufficiently below the low level in the feed tanks to maintain pressures and prevent off‐gassing.
Chemical Cleanings
The membrane filtration and reverse osmosis systems will require chemical cleanings. Based on the chemical cleanings that were conducted at the Demonstration Facility, the following elements for the clean‐in‐place system should be considered for the Full‐Scale Facility design:
Minimizing the volume of piping between the clean in place tank and equipment skids would reduce the cleaning solution volume requirement.
Optimizing the clean in place tank configuration to limit the volume required to submerge the pump used to recirculate cleaning solution would reduce the cleaning solution volume requirement.
The addition of flow meters on chemical cleaning solution dosing pumps would prevent over dosing and overuse of cleaning chemicals.
Section 3 Full‐Scale Facility Considerations
January 2013 3‐9
The inclusion of an inline pH meter on the clean in place skid would be useful to help ensure target pH is met through the recirculation process and minimize over usage of chemicals needed to make pH adjustments.
The inclusion of a designated neutralization tank (s) should be considered to allow more aggressive cleanings (e.g., pH below City’s current discharge requirements).
The use of acid followed by caustic was observed to be more effective than caustic followed by acid during clean in place procedures conducted on the RO systems.
Use of North City cogeneration facility waste heat to heat chemical tanks during cleaning should be investigated prior to final design.
Increasing soak and recirculation times of standard chemical solutions on the RO systems improved cleaning efficiency and avoided the need for proprietary costly cleaning solutions.
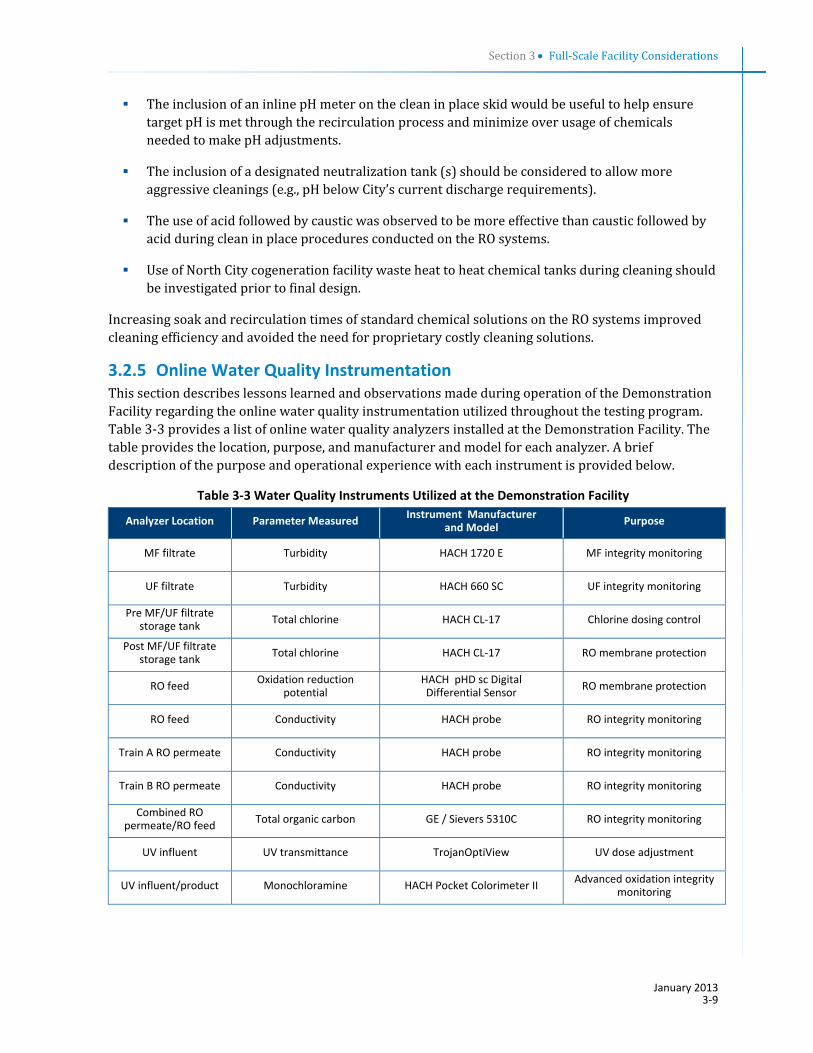
3.2.5 Online Water Quality Instrumentation This section describes lessons learned and observations made during operation of the Demonstration Facility regarding the online water quality instrumentation utilized throughout the testing program. Table 3‐3 provides a list of online water quality analyzers installed at the Demonstration Facility. The table provides the location, purpose, and manufacturer and model for each analyzer. A brief description of the purpose and operational experience with each instrument is provided below.
Table 3‐3 Water Quality Instruments Utilized at the Demonstration Facility
Analyzer Location Parameter Measured Instrument Manufacturer
and Model Purpose
MF filtrate Turbidity HACH 1720 E MF integrity monitoring
UF filtrate Turbidity HACH 660 SC UF integrity monitoring
Pre MF/UF filtrate storage tank
Total chlorine HACH CL‐17 Chlorine dosing control
Post MF/UF filtrate storage tank
Total chlorine HACH CL‐17 RO membrane protection
RO feed Oxidation reduction
potential HACH pHD sc Digital Differential Sensor
RO membrane protection
RO feed Conductivity HACH probe RO integrity monitoring
Train A RO permeate Conductivity HACH probe RO integrity monitoring
Train B RO permeate Conductivity HACH probe RO integrity monitoring
Combined RO permeate/RO feed
Total organic carbon GE / Sievers 5310C RO integrity monitoring
UV influent UV transmittance TrojanOptiView UV dose adjustment
UV influent/product Monochloramine HACH Pocket Colorimeter II Advanced oxidation integrity
monitoring
Section 3 Full‐Scale Facility Considerations
January 2013 3‐10
Oxidation Reduction Potential (ORP) Analyzer – The Demonstration Facility included an ORP analyzer at the feed of the RO systems. The purpose of this meter was to detect changes in ORP, which may be indicative of the presence of free chlorine that can damage the RO membranes. Throughout the testing the ORP of the feed water stayed fairly consistent around 400 millivolt (mV). The control system was set to give a warning if the ORP reached 500 mV and shut down if the value reached 550 mV. As a redundant measure, a flow confirmation switch was installed on the ammonia hydroxide pump to directly monitor that ammonia was being added at all times to form combined chlorine.
Chlorine Analyzers – The Demonstration Facility included two online chlorine analyzers and one portable monochloramine analyzer. One online analyzer was located upstream and the other downstream of the MF/UF filtrate storage tank. The intention of the upstream meter was for chemical dosing, to ensure the target chloramine concentration was present in the membrane filtration filtrate to prevent biological fouling of the MF, UF, and RO systems. The downstream analyzer was tied to a control loop, which was set to alarm if total chlorine in the feed exceeded 4.0 mg/L, the maximum concentration allowed by the RO membrane manufacturers. The portable monochloramine analyzer was used in conjunction with the UV system to evaluate the use of monochloramine as a surrogate for CEC destruction. Based on successful correlation of monochloramine destruction at the Demonstration Facility, it is recommended that online analyzers be considered at the Full‐Scale Facility to monitor the integrity of the UV process.
Turbidimeters – Online turbidimeters were equipped on both the MF and UF systems to monitor filtrate turbidity on a continuous basis. Average filtrate turbidities based on readings taken twice per day from the online analyzer displays were 0.05 NTU for the MF system and 0.016 NTU for the UF system. The lower turbidity values measured on the UF system were attributed to the fact that this system uses a laser turbidimeter (HACH Model Filter Trak 660 SC), which uses advanced incident light, whereas the MF system uses a conventional incandescent light turbidimeter (HACH 1720 E). The specifications on the laser turbidimeter states the unit can detect changes in turbidity as low as 0.0003 NTU. Based on experience at the Demonstration Facility, both turbidimeters worked as intended and are suitable for the Full‐Scale Facility.
UVT Analyzer – The UV disinfection and advanced oxidation system was equipped with an online UVT analyzer located at the UV reactor influent. The purpose of the UVT analyzer was to provide feedback to the UV control system to adjust reactor power based on the measured UVT in the influent water. During the course of operation the analyzer operated as intended with the exception of the low flow alarms causing the reactor to alarm. Discussion on the possible use of online UVT for integrity monitoring and the Full‐Scale Facility is discussed in Section 4.3.3.
Portable TOC Analyzer – The RO system was equipped with one online TOC analyzer (GE Model 5310 C). The main purpose of the analyzer was to provide continuous monitoring of TOC in the RO permeate. However, the unit was also used each quarter to characterize the RO feed water TOC over a one to two‐week period. The unit was also used to measure the TOC in grab samples from various locations in the Demonstration Facility process including MF filtrate, UF filtrate, and in the permeate from each RO Train. In general the analyzer operated as expected during the testing period. However, in order to achieve accurate measurements of the low concentrations of TOC (e.g., less than 100 ppb) in the RO permeate it was necessary to install an
Section 3 Full‐Scale Facility Considerations
January 2013 3‐11
inorganic carbon removal unit on the analyzer. It was also observed during December 2011 that the accuracy of the analyzer was impacted by large swings in the internal cell and ambient temperature. Lastly, it is was necessary to frequently replace consumables on the unit including oxidizer and acid reagents, UV lamp, tubing, and resin per the manufacturer’s recommended maintenance schedule. Additional recommendation on the use of online TOC monitoring for the full‐scale integrity monitoring is provided in Section 4.3.3.
Conductivity Analyzers – The RO system was equipped with online conductivity analyzers on the feed water and permeate. During the course of operation the analyzer operated as intended and correlated well with daily measurements taken with a hand held meter. Discussion of the use of online conductivity monitoring and the Full‐Scale Facility is presented in Section 4.3.3.

Section 3 Full‐Scale Facility Considerations
January 2013 3‐12
This page intentionally left blank.