secondary low-voltage circuit models – how good...
TRANSCRIPT

Secondary Low-Voltage Circuit Models – HowGood is Good Enough?
Jouni Peppanen, Jason A. Taylor, Roger C. DuganPower System Studies, Electric Power Research Institute, TN, USA
[email protected] / [email protected] / [email protected]
Celso RochaPolytechnic School of the University of Sao Paulo, Brazil

Why Care About Secondary Circuits?• Distribution analysis
typically focuses on primarycircuits
• Many DER & sensors insecondary circuits
• Lack of accurate secondarymodels and data
• Many simplifications usedwithout considering theimpacts 115
120
125
Voltageon a 120-V Base
ANSI C84.1 Service Voltage Upper Limit
ANSI C84.1 Service Voltage Lower Limit
Secondary Voltage Drop
Primary Circuit Voltage Drop
Service Transformer Voltage Drop
?

Typical SimplificationsSimplification MotivationLoad allocation Lack of AMI measurements
Difficulty handling large AMI data setsSingle-phase models No split-phase measurements
Insufficient component informationConstant power factor Lack of AMI var measurementsLow measurement time-granularity (15-min or 1-hour)
Lack of/difficulty handling high-granularity data
SHOULD NOT BE USED TO ANALYZE SECONDARY SYSTEMS

Split-Phase Secondary Modeling
Fully detailed modeling requires:• Transformer & line/cable information• Information on topology & phasing• Load P & Q measurements from both 120-volt legs
PrimaryCircuit
Split-PhaseService Transformer
Customers with aSplit-phase Service
Triplex-CableService Lines

Split-Phase Secondary Modeling
VH
V1
V2
H1 X1
X2
X3
ZH Z1
Z2
+
-
+
-+
-
+
-
EH
-
-
+
+
Vt1
Vt2
IH I1
I2
:1
= 1 −
rp
rn
rp
dDpn
Dpp rnrp
Dpp
rp
d ddDpn
ZSL1
ZSL2
ZSLn
ZSL1n
ZSL2n
ZSL12
IS1 IR1
IRn
IR2IS2
ISn
VS1
VSn
VS2
VR1
VRn
VR2
ISL1
ISLn
ISL2
= +
+
--
+
VL1
VL2
VL3
+
-
IL1
ISL2
ISLn
IL2
IL3
ISL1
Split-Phase TransformerTriplex Line/Cable Split-Phase Customer

Single-Phase Equivalent Modeling
• What to do when split-phase data/models notavailable?
• Detailed split-phase modelhas an exact single-phaseequivalent
• Small Print: Currents in thetwo 120-volt currentcarrying legs must be equal( = − )
VH
V1
V2
H1 X1
X2
X3
ZH Z1
Z2
+
-
+
-+
-
+
-
EH
-
-
+
+
Vt1
Vt2
IH I1
I2
+
-+
-
VL1
VL2
VL3
+
-
IL1
IL2
IL3
ZSL1
ZSL2
ZSLn
ZSL1n
ZL2n
ZSL12
:1
In
VH V12
ZH Z1
Z2
+
-
+
-
+
-
EH
-
+Vt1
IH I1
I2=-I1
VL
+
-
IL=I1
ZSL1’
ZSL12’
ZSL2’
:1
Vt2
+-

Single-Phase Equivalent Model Parameters• Single-phase transformer:
– 240-volt L-N connectedsecondary winding
– Use full-winding impedance• Single-phase service lines
– Use 2 , − ,• Single-phase load
– 240-volt line-neutral connection– Total P, Q
VH V12
ZH Z1
Z2
+
-
+
-
+
-
EH
-
+Vt1
IH I1
I2=-I1
VL
+
-
IL=I1
ZSL1’
ZSL12’
ZSL2’
:1
Vt2
+-

Case Study Secondary Circuits
• Two real utility secondary circuits• Split-phase & single-phase
models derived
“Small Secondary Circuit”PrimaryCircuit
ServiceXmfr7.2D/0.24Y kV
25 kVAr+jx=1.18+j1.44Non-interlaced
48’ 4
167’ 3/0
Load110+j2
Load212+j4
PrimaryCircuit
ServiceXmfr7.2Y/0.24Y
25 kVAr+jx=1.18+1.44Non-interlaced
106’ 1/013’ 1/0 Load3
5.2+j3.2
206’ 1/010’ 1/0
11’ 1/0
Load11.6+j1.0
Load21.2+j0.7
61’ 1/0 Load48.3+j5.1
187’ 1/0
103’ 1/042’ 1/0
23’ 1/0
Load71.8+j1.1
Load85.7+j3.5
161’ 1/0286’ 1/0
116’ 1/0
Load52.6+j1.6
Load68.4+j5.1
All Lines Assumed toHave Full Neutrals
“Large Secondary Circuit”

Split-phase vs. Single-Phase Model Comparison• Under perfectly balanced
loads– Identical results from split-
phase and single-phase modelsfor both circuits
• What happens in unbalancedconditions?
Small Secondary CircuitPrimaryCircuit
ServiceXmfr7.2D/0.24Y kV
25 kVAr+jx=1.18+j1.44Non-interlaced
48’ 4
167’ 3/0
Load110+j2
Load212+j4
Quantity Split-PhaseModel Single-Phase Model
Load1 240 V Voltage 236.36∠ − 0.5 236.36∠ − 0.5Load2 240 V Voltage 236.36∠ − 0.5 236.36∠ − 0.5
Transformer 240 V Voltage 236.77∠ − 0.4 236.55∠ − 0.6Total Load Power 36.3+j20.1 36.3+j20.1
Total Losses 0.8+j0.4 0.8+j0.4

Single-Phase Model with Unbalanced Loads
When the small secondarycircuit phase A load shareis varied 0-100%:• 240-volt voltages still
very accurate• 120-voltages inaccurate• Losses underestimated
by up to 50%
[V]

Case Study Measurement Data• High-granularity residential house split-
phase measurements– Recorded with WattNode sensors– Two 120-volt voltages, active powers,
reactive power, currents, etc.– 417660 1-min samples over a 9-month time
period
• Each circuit load was assigned randomlyone of the measurement profiles

Measurement Time-Granularity
• Typical AMI @ 15-min orhigher
• Residential load shapeconsists of “needle peaks”
• Accurate analysis requires5-min or faster time-granularity
0
0.2
0.4
0.65-min vs. 1-min
Prob
abilit
y[0
,1]
Error [%] Against 1-min Measurements
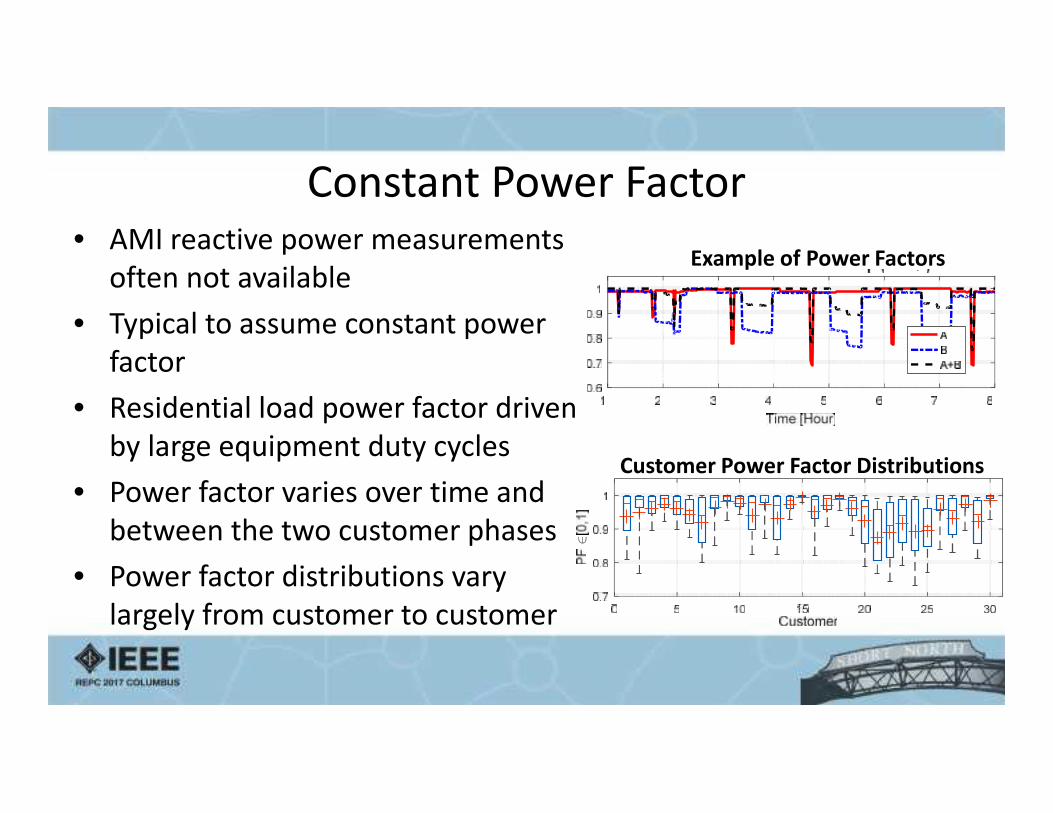
Constant Power Factor• AMI reactive power measurements
often not available• Typical to assume constant power
factor• Residential load power factor driven
by large equipment duty cycles• Power factor varies over time and
between the two customer phases• Power factor distributions vary
largely from customer to customer
Example of Power Factors
Customer Power Factor Distributions

How Balanced Are the 120-volt Loads?
• P, Q, and power factorare not balancedbetween customerphases
• Error of balanced loadassumption varies largelyfrom customer tocustomer

Studied Simplified CasesCase Model Measurements Description/Motivation
1 Split-phase
1-min, , , Base case for comparison
2 Single-phase
1-min, Impact of single-phase models and data
3 Split-phase
1-min,Assume PF=0.9
Impact of constant conservative (0.9) power factorassumption
4 Split-phase
15-min, , , Impact of low (15-min) measurement timegranularity
5 Single-phase
15-min, Today’s best case: Accurate single-phase modes anddata with typical 15-min AMI resolution

Single-phase vs. Split-phase (Case 2 vs. Case 1)• Losses underestimated on average by 15% (6%) for small
(large) circuit• 240-volt drops accurate• 120-volt drop have mean absolute percentage error (MAPE)
of 10-25% & mean absolute error (MAE) of 0.19-0.40 volt• 120-volt drop error driven by load unbalance and
connection (electrical) strength

Constant Power Factor Error (Case 3 vs. Case 1)
• Losses underestimated on average by ~20%– Results likely from selected (low) power factor of 0.90– Different power factor selection will yield better/worse results– Error depends on how well the assumed power factor
represents the loads
• 120-volt drop MAPE 10-16% (MAE 0.12-0.36 volt)• 240-volt drop MAPE 1.9-3.3% (MAE 0.27-0.46 volt)

15-min vs. 1-min Error (Case 4 vs. Case 1)
• Losses underestimated on average by 6-7%– Losses proportional to the square of the currents– 15-min data does not capture “needle peaks”
• 120-volt drop MAPE 12-16% (MAE 0.08-0.27 volt)• 240-volt drop MAPE 11-12% (MAE 0.17-0.46 volt)
Practical Best Case Error (Case 5 vs. Case 1)
• Losses underestimated by 20% (12%) for small(large) circuit
• 120-volt drops MAPE 16-26% (MAE 0.21-0.47 Volts)• 240-volt drops MAPE 11-12% (MAE 0.17-0.46 Volts)

Practical Best Case Error (Case 5 vs. Case 1)
• Average errors fail togive the entire picture
• Voltage drop simulationerrors– Can be >2 Volts– Are frequently >1 Volt
Case 5 Volt Drop MAE Histograms
Case 5 Share of MAEs >1 Volt

Key Take Aways• Single-phase models accurately represent the 240-volt
voltages but not the 120-volt voltages• Constant power factor can lead to considerable errors
in estimating losses and some error in simulatedvoltages
• Typical best case (15-min AMI P & Q with single-phasemodel) can result in considerable errors in simulatedvoltages and losses

Going Forward• How good is good enough? Acceptable errors depend on
applications• The error from the simplifications may influence
– Analysis of advanced PV / DER inverter functionalities– Operational algorithms, such as distribution state estimation, that
use AMI and other sensors located in secondary circuits• More accurate models and more granular measurement
data will likely be needed• EPRI has on-going work on
– The impact of voltage excursions– Advanced load modeling techniques

Thank You!
Paper Title: Secondary Low-Voltage Circuit Models – How Good is Good Enough?
Jouni Peppanen, Jason A. Taylor, Roger C. DuganPower System Studies, Electric Power Research Institute, TN, USA
[email protected] / [email protected] / [email protected]
Celso RochaPolytechnic School of the University of Sao Paulo, Brazil

Extra Slides to Follow

Split-Phase Service Transformer Modeling
• 3-winding transformers with asingle L-L or L-N connected MVprimary winding and two 120-Vsecondary windings
• Winding impedances are typicallyestimated from full-windingshort-circuit impedance (shortingX1 to X3)
VH
V1
V2
H1 X1
X2
X3
ZH Z1
Z2
+
-
+
-+
-
+
-
EH
-
-
+
+
Vt1
Vt2
IH I1
I2
:1
= 1 −

Triplex Service Line Modeling
• Typically two identical insulatedconductors wrapped around a non-insulated neutral conductor
• Can be modeled with π-equivalentusing Carson’s equations
• Capacitance typically neglected• Impedances not very sensitive to
insulation thickness and conductorspacing
rp
rn
rp
dDpn
Dpp rnrp
Dpp
rp
d ddDpn
ZSL1
ZSL2
ZSLn
ZSL1n
ZSL2n
ZSL12
IS1 IR1
IRn
IR2IS2
ISn
VS1
VSn
VS2
VR1
VRn
VR2
ISL1
ISLn
ISL2
= +

Split-Phase Customer Modeling• Consists of
– A single 240-volt connected load– Two 120-volt connected loads
• Detailed split-phase modeling requiresP & Q measurements from both 120-volt lines (or from both 120-volt and240-volt load)
• What to do when no split-phasemeasurements are available?
+
--
+
VL1
VL2
VL3
+
-
IL1
ISL2
ISLn
IL2
IL3
ISL1

Single-Phase Equivalent Model Parameters• Single-phase transformer:
– 240-volt L-N connectedsecondary winding
– Use full-winding impedance• Single-phase service lines
– Use 2 , − ,• Single-phase load
– 240-volt line-neutral connection– Total P, Q
VH V12
ZH Z1
Z2
+
-
+
-
+
-
EH
-
+Vt1
IH I1
I2=-I1
VL
+
-
IL=I1
ZSL1’
ZSL12’
ZSL2’
:1
Vt2
+-