second quarter report hospitality and conference expenses 13 management discussion and analysis 14...
TRANSCRIPT

SECONDQUARTERREPORT
EVOLUTION
TRANSFORMATION
CONNECTION


President’s Message 2
second Quarter at a glance 4
transforMation Milestones 6
capital investment 6
tracks 6
trains 6
stations 6
technology and customer experience 7
intermodal Partnerships 7
adjusting services to Match demand 8
lean Management 9
social Media 9
Key PerforMance indicators 10
coMMunity and governance 11
safety outreach 11
Partnership with the canadian institute for citizenship 11
the Board of directors 12
annual Public Meeting 12
official languages 12
access to information and Privacy 13
community involvement 13
travel, Hospitality and conference expenses 13
ManageMent discussion and analysis 14
interiM condensed financial stateMents 24
CONTENT

via
ra
il c
an
ad
a /
se
co
nd
Qu
ar
ter
re
Po
rt
2012
/ M
essa
ge
fro
M t
he
Pres
iden
t
2
MESSAGE FROM THE PRESIDENT
via rail canada continued to face significant challenges during the second quarter of 2012 with respect to ridership and revenues. as in the frist quarter, the impact of economic uncertainty on travel markets limited our opportunities for growth.
We responded to these challenges with aggressive marketing and fare discounts, reducing the impact on our ridership levels and making passenger rail a more attractive option for customers. this helped to increase both our revenues per employee and revenues per seat mile compared with the first quarter. We also maintained tight cost controls to keep expenses below budget. as a result, we continue to operate within approved funding levels.
rapidly changing markets underline the importance of our efforts to modernize and transform passenger rail in canada. Markets will continue to fluctuate, rising and falling from quarter to quarter and year to year. our goal is to transform passenger rail into an attractive, efficient, competitive and affordable travel service, able to withstand these fluctuations, respond to the changing needs of customers, and achieve sustainable growth in the future. We are doing this by:
/ investing in better trains, track and stations which will deliver fast, reliable and more frequent service to customers.
/ investing in new technologies such as e-ticketing and mobile booking to transform the way customers access our services.
/ integrating passenger rail with other travel services, such as air and commuter rail, to increase options for customers and make it easier to combine rail with other modes of travel.
/ transforming the way we operate and deliver our services to eliminate waste, streamline operations, and provide more customer value.
Marc LalibertéPresident and chief executive officer

via
ra
il c
an
ad
a /
se
co
nd
Qu
ar
ter
re
Po
rt
2012
/ M
essa
ge
fro
M t
he
Pres
iden
t
3
We are moving forward quickly in all of these areas. Highlights of the transformation during the second quarter of 2012 are outlined in this report.
an essential part of modernizing passenger rail is providing the right level of service to match customer demand in different markets across the country. in June, we announced that we will adjust service frequencies on a number of routes where customer demand has changed over the years. for example, ridership on our transcontinental service between toronto and vancouver is strong and growing during the summer months, but has dropped significantly during the off-peak season over the past fifteen years. in southwestern ontario, the expansion of air and commuter rail services has made some intercity rail services redundant. the development of a more robust transportation infrastructure in eastern canada has reduced demand for via’s service between Montreal and Halifax.
starting this fall we will adjust service levels on these routes to match current demand, while maintaining sufficient capacity to respond to opportunities for growth in the future. i want to emphasize that we are not eliminating service on any of these routes. We will continue to operate trains and an appropriate level of service to meet the needs of our customers.
these kinds of service adjustments are normal practice for virtually every other passenger service in canada. they are essential to our efforts to transform via into a company that is modern, efficient, reliable and self-sustaining.
changes of this kind are always difficult, and i fully understand the concerns that have been expressed by some communities where the frequency of train service will be reduced. via will continue to work with these communities and other transportation services to ensure that we meet the needs of our customers and the communities we serve.
i also understand the concerns of via employees who will be affected by these service adjustments. about 9% of our unionized workforce will be affected by the modernization of our services. normal attrition and planned retirements will help to reduce the impact on employees. via will work with the unions to help manage the transition for those employees who are affected.
as a result of these adjustments, via will be a more viable business. as we continue to transform passenger rail and to improve services from coast-to-coast, we are building the kind of efficient passenger service that customers and taxpayers want – one that is financially sustainable, delivers good value for money, and is ready for future growth.
in closing, at the time of writing this report, via rail lost a very valuable and respected member of its Board of directors, donald Mutch, who continued, despite a long illness, to offer his dedication and expertise to our organisation. Mr. Mutch had been on via’s Board of directors since august 3, 2007. originally from scotland, he moved to canada as a young man and forged a long and successful career in the banking industry. He served on several boards of directors and was selected by the canadian Bankers association as the industry appointee to the government of canada’s department of finance. He was also an active member of the volunteer community and served in a variety of roles. via extends heartfelt appreciation for his committed and engaged service and its deepest sympathies to his family during this difficult time.

via
ra
il c
an
ad
a /
se
co
nd
Qu
ar
ter
re
Po
rt
2012
/ s
eCo
nd
Qu
art
er a
t a
gla
nCe
4
SEcOND QuARTER AT A GLANcE
(1) deficit before amortization of deferred capital funding & corporate taxes.
Q2-2012 Q2-2011 YTD-2012 YTD-2011
KEY FINANCIAL INDICATORS (in millions of dollars)total passenger revenues 63.5 64.5 119.0 121.6
total revenues 68.1 69.1 128.8 130.8
operating expenses 144.8 141.0 298.8 283.7
government funding 72.0 75.7 151.5 137.4
amortization of deferred capital funding 13.5 9.7 29.4 21.0
corporate tax expense 1.8 (3.8) 2.3 (3.7)
net income (net loss) and comprehensive income 7.0 17.3 8.6 9.2
capital expenditures 40.7 54.5 84.0 110.3
KEY OPERATING STATISTICStotal passenger-miles (in millions) 200 206 376 389
total seat-miles (in millions) 390 388 752 736
operating deficit per passenger-mile (in cents) (1) 38.3 34.9 45.2 39.3
yield (cents per passenger-mile) 31.0 31.0 30.9 31.0
train-miles operated (in thousands) 1,636 1,640 3,276 3,268
car-miles operated (in thousands) 11,575 11,567 21,275 20,853
average passenger load factor (%) 51 53 50 53
average number of passenger-miles per train mile 122 126 115 119
on-time performance (%) 80 85 83 81
average number of full time employees during the period 2,779 2,802 2,779 2,802

VIA
RA
Il C
An
Ad
A /
se
Co
nd
Qu
AR
teR
Re
po
Rt
2012
/ S
ECO
ND
Qu
art
Er a
t a
Gla
NCE
5
Passenger revenues and ridershiP for the second quarter of 2012
train servicePassenger revenues*(in thousands)
Passengers(in thousands)
Passenger-Miles(in thousands)
goverment funding
(per passenger mile)
Corridor $45,867 843 140,235 $0.26
longhaul West $11,960 31 39,679 $0.28
longhaul east $3,203 34 14,692 $0.56
Mandatory services $1,154 22 5,408 $2.12
total $62,184 930 200,014 $0.33
Passenger revenues and ridershiP for the 6 Months ended June 30, 2012
train servicePassenger revenues*(in thousands)
Passengers(in thousands)
Passenger-Miles(in thousands)
goverment funding
(per passenger mile)
Corridor $93,417 1,712 282,168 $0.29
longhaul West $15,705 46 55,806 $0.50
longhaul east $6,165 68 28,379 $0.66
Mandatory services $1,945 37 9,420 $2.53
total $117,232 1,864 375,773 $0.40
* Before off-train and other passenger revenues.
via
ra
il c
an
ad
a /
se
co
nd
Qu
ar
ter
re
Po
rt
2012
/ t
ran
sfo
rMat
ion
Mil
esto
nes
6
TRANSFORMATION MILESTONESsince 2007 the government of canada has committed $923 million to upgrade tracks, modernize passenger stations, and renew passenger trains and technology. to capture the benefits of this investment, via is transforming its own operations to increase efficiency and deliver more value to customers. at the same time it is aligning train services more closely with markets across canada -- matching train schedules, capacity and pricing to market demand.
CaPital investMentthe transforming via website (www.viarail.ca/transformingvia) provides up-to-date information on many of the train, track and station work currently underway across via’s network. image galleries and additional project details create a comprehensive online reference point for all projects.
Tracksin June via issued a tender for major safety improvements and signal work on the guelph sub-division between georgetown and london, ontario, in cooperation with goderich-exeter railway (geXr). improvements will add centralized traffic control (ctc) to approximately 90 miles (144 Km) of track as well as significant level crossing upgrades. the construction work will begin this fall and will continue into 2013.
Work also continued on major projects to increase the capacity of cn owned tracks between Brockville and toronto, which will allow via to add more frequencies between ottawa and toronto. With projects at Brockville and gananoque already complete, the new third track section between grafton and cobourg was completed in april 2012.
Trainsvia is rebuilding most of its locomotives and passenger cars to extend their life, enhance environmental performance and efficiency, and to provide better comfort and service to customers – including better accessibility for people with special mobility needs.
as of June 30, 2012, 42 of via’s 53 f-40 locomo-tives have been completed, along with 4 of via’s 59 renaissance passenger cars; all 4 cars being fully accessible. also completed are 10 of 98 light, rapid comfortable (lrc) passenger cars. six (6) rail-diesel (rdc) cars are yet to be completed.
during the first quarter, via terminated the remainder of the contract to upgrade renaissance passenger cars, as well as a portion of the lrc contract, as a result of the supplier’s failure to meet the delivery schedule. a new schedule for completing this work is under development.
Stationsvia is upgrading and modernizing key passenger stations across the country to serve customers more efficiently, and to address operational and safety needs.
in april via announced the completion of a $6.9 million renovation of vancouver’s historic central station. the exterior masonry of the building was repointed and cleaned, the roof has been rebuilt, and the exterior windows and doors have been restored or replaced. Work also included improvements to security systems.
in May via announced a $6.5 million investment in Winnipeg’s union station to improve public areas, accessibility, passenger services and amenities, and the exterior of the heritage building. improvements will include fully accessible public washrooms, exte-rior improvements, and upgraded security systems. in addition, via will clean, repair and restore the central rotunda, one of the most striking features of the heritage station that officially opened in June 1912.
also in May, via officially opened the new Panorama lounge in toronto’s union station. the new lounge, which was completed in January, provides more than twice the space available in the old lounge serving business and tourist customers.

via
ra
il c
an
ad
a /
se
co
nd
Qu
ar
ter
re
Po
rt
2012
/ t
ran
sfo
rMat
ion
Mil
esto
nes
7
Work is also advancing well at oshawa and cobourg, along with track capacity improvements to be com-pleted this year. new overhead walkways will accom-modate the growing number of passengers who use the facilities each year.
construction of a new Windsor station is well advanced and expected to open in august 2012.
teChnology and CustoMer exPerienCevia is developing and implementing new technologies to enhance the customer’s experience with passenger rail. during the second quarter via continued to implement key initiatives launched earlier in the year, including a new mobile booking engine, which allows customers with any web-enabled phone to purchase tickets or rail passes, get real-time departure and arrival updates for all Windsor – Quebec city trains, and maintain an online customer profile to make ticket purchases faster and easier.
via continued testing the use of Blackberry phones by employees to connect to on-board system; all on-board employees will be equipped with the phones this year. the system allows staff to access passenger lists and information, as well as real-time train status, and will integrate with via’s new electronic ticketing technology when it is implemented later this year.
in May via introduced fare shopping for trains in the corridor. this is an online service that lets customers and travel agents find their best train options quickly and easily, based on travel dates, class of service, and price. information on all fares and services is laid out so that customers can easily understand all their options, and make the best choice for their needs.
interModal PartnershiPsthe transformation of passenger rail also involves building better intermodal partnerships with other transportation services – making it easier for people to find the right solution for their travel needs. in June via expanded the number of options available to travelers in southern ontario, in partnership with go transit in the greater toronto area. all via train, go train and go bus options are available for one stop shopping online. customers have up to 20 weekday choices for travelling from toronto to niagara, and 17 choices in the other direction. Between June 23rd thru september 3rd there will also be one additional go train round-trip choice on fridays, and three additional go train round-trip choices on weekends and holidays. eventually, the partnership will allow via to offer customers access to the entire go train network.
via has reached an agreement with Montreal’s transit authority, agence métropolitaine de transport, to provide similar integration with their services. a new partnership with air transat, canada’s leading holiday travel airline, will make it easier for rail customers to connect with their flights.
via also has an intermodal partnership with regional bus services.

8
via
ra
il c
an
ad
a /
se
co
nd
Qu
ar
ter
re
Po
rt
2012
/ t
ran
sfo
rMat
ion
Mil
esto
nes
adjusting serviCes to MatCh deMandBetter integration and alignment with markets will allow via to focus energy and resources on delivering more value to more customers, in markets where demand is high and growing. in June via announced that it will reconfigure services to better match passenger rail capacity with the demand for service.
The Canadian: the canadian currently provides three round trips per week, year round, between toronto and vancouver. demand for this service is strong and growing during the summer months; via has invested more than $55 million to improve service along this route, and is upgrading equipment to meet customer needs.
demand for this service during the off-peak season, however, is much lower, and has fallen steadily for the past 15 years. three round trips per week during the off-peak season are no longer needed to meet demand. Beginning this november, the canadian will offer two round trips per week during the off peak season.
The Ocean: the ocean currently provides six round trips per week between Montréal and Halifax. via has invested more than $25 million to improve this service, and will continue to improve the value of this service to customers.
However, the current schedule, which has been essentially unchanged since 1990, no longer reflects current ridership or foreseeable market demand – ridership has dropped 50% over the last 15 years, as other travel options (highways, air and bus services) have improved. Beginning this november, the ocean will operate three round trips per week year round.
Quebec – Windsor Intercity Trains: the Montreal-ottawa-toronto triangle, where the demand for efficient intercity transportation is high and growing, is via’s busiest market. in January 2012 via added new frequencies, including express services, between Montreal, ottawa and toronto. More frequencies will be added this year, and faster trains will reduce overall trip times.
the southwestern ontario market includes some of via’s poorest-performing train services, where customer demand is very low. at the same time, new air services, and expanding commuter rail services in the greater toronto area, are further reducing the need for some weekday and weekend via services. accordingly, via is reducing frequencies on some routes in southwestern ontario and will provide better integration with other public transportation services.

9
via
ra
il c
an
ad
a /
se
co
nd
Qu
ar
ter
re
Po
rt
2012
/ t
ran
sfo
rMat
ion
Mil
esto
nes
lean ManageMentlean Management techniques improve efficiency by analyzing business activities, focusing on the value of those activities to customers, and eliminating wasted effort and resources that do not add value. via began implementing lean Management in 2010-11, training coaches and developing awareness of the process throughout the organization, and launching lean projects in areas such as improving the on-time performance, resolving customer complaints, and reducing equipment maintenance delays.
as June 30, 2012, 17 lean projects and initiatives had been completed, and another 29 projects were identified for future implementation.
soCial Mediain 2011 via expanded its use social media to connect with customers, communities and stakeholders through facebook (facebook.com/viarailcanada) and twitter (twitter.com/via_rail). along with email, and via’s award-winning website (viarail.ca), social media helps via to maintain a strong online presence, and engage in a dynamic dialogue with customers. via has also implemented a new corporate blog, via evolution (viaevolution.ca). the blog features weekly commentaries and insights from via executives on via’s business strategy, initiatives and operations, and provides an opportunity to explain the reasoning behind via’s business decisions.
during Q-2, via rail was discussed or mentioned 21,790 times in social media including blogs and online publications, and more than 92% of these mentions were positive. on twitter there were over 13,000 comments mentioning via rail. there were over 500 posts on via’s facebook page, along with 2,324 “likes” and 1,439 posted comments.

via uses the following performance indicators as an integral part of its lean Management process. for detailed information on financial and operating performance during the quarter consult the Management discussion and analysis.
Q2 2012 Q2 2011
Total Revenue per Employee ($000s) ytd revenues divided by the number of employees. a measure of productivity. 97 97
Passenger Revenues per Available Seat-Mile (¢) revenues divided by available seat-miles. 16 16
Direct Costs per Available Seat-Mile (¢) direct costs divided by available seat-miles. 20 21
On-Time Performance (%) excludes mandatory services 82 88
Employee Attendance (%) total hours of absences per month divided by the total possible work hours per month. 92 92
Train Incidents per Million Train-Miles includes collisions between two (2) trains; derailments with at least one wheel off the track; all cardinal rule violations; excludes crossing accidents and trespassing. 2 3
via
ra
il c
an
ad
a /
se
co
nd
Qu
ar
ter
re
Po
rt
2012
/ K
ey P
erfo
rMa
nCe
indi
Cato
rs
10
KEy PERFORMANcE INDIcATORS

via
ra
il c
an
ad
a /
se
co
nd
Qu
ar
ter
re
Po
rt
2012
/ C
oM
Mu
nit
y a
nd
go
vern
an
Ce
11
cOMMuNITy AND GOvERNANcE
safety outreaChthe majority of rail safety incidents occur at intersections where roads cross rail tracks, or involve pedestrians trespassing on rail property. these types of incidents are often caused by people underestimating the dangers of trespassing on rail property or trying to cross tracks in front of trains. via rail has developed a comprehensive community outreach program to help educate and raise public awareness of these dangers.
via continues to work with communities, schools, and law enforcement agencies to identify high-risk crossings and areas. for example, in Q2 via worked with communities in the Belleville and Kingston areas to conduct a public awareness “safety Blitz” during rail safety Week (april 30 – May 6).
via also works with the owners of private property where road-rail crossings are located, encouraging them to eliminate these danger points through transport canada’s closure crossing Program. these efforts earned via a safety award from the railway association of canada in 2011, and continue to be a priority in 2012.
as part of the north american occupational Health and safety Week (May 6-12), all via Health and safety committees carried out employee safety awareness events and activities throughout via’s network.
PartnershiP with the Canadian institute for CitizenshiPon July 1st of this year, via rail canada announced a new partnership with the institute for canadian citizenship which will allow new canadian citizens to discover their adopted country by train. With this announcement via rail is now offering all new citizens who are members of the cultural access Pass program, a one-time 50% discount on the lowest available fare on any via train. the offer applies to any class, both one way and round trips, with no blackout periods, to all new citizens and up to four of their children under the age of 18.
although this announcement took place at the beginning of the third quarter, via wanted to share this new partnership to ensure a wider distribution of the information, therefore enabling more new canadian citizens to benefit from this offer.

via
ra
il c
an
ad
a /
se
co
nd
Qu
ar
ter
re
Po
rt
2012
/ C
oM
Mu
nit
y a
nd
go
vern
an
Ce
12
the Board of direCtorsthe Board of directors consists of the chairperson, the President and chief executive officer and 11 other directors appointed by the government of canada. the Board is responsible for overseeing the strategic direction and management of the corporation, and reports on via’s operations to Parliament through the Minister of state, transport.
during the second quarter of 2012, one Board Meeting and seven Board committee meetings were held. the overall average attendance rate of Board members at the Board Meeting was of 100%, and of 93% for the Board committees. cumulative fees for Board members during this time period totaled $61,129.
annual PuBliC Meetingvia rail canada held its annual Public Meeting on May 29, 2012, at Winnipeg’s union station. during the meeting, Paul g. smith, chairman of the Board, Marc laliberté, President and ceo, and robert st-Jean, chief financial and administration officer reviewed the latest financial results and discussed the strategic direction for the corporation moving forward in 2012.
copies of presentations and a webcast of the meeting are available online at http://www.viarail.ca/en/about-via-rail/our-company/annual-public-meeting.
offiCial languagesvia received one complaint under the official languages act during the second quarter of 2012, which was still in progress at the end of the quarter.

via
ra
il c
an
ad
a /
se
co
nd
Qu
ar
ter
re
Po
rt
2012
/ C
oM
Mu
nit
y a
nd
go
vern
an
Ce
13
aCCess to inforMation and PrivaCyvia is committed to responding promptly to infor-mation requests under the access to information act and the Privacy act. during the second quarter of 2012 via received eleven (11) such requests, which were in progress at the end of the quarter.
CoMMunity involveMentvia works with a variety of local, regional and national charity groups and non-profit organizations to support community activities, fundraisers and initiatives across the country. Promotional travel credits are donated to qualifying organizations that have submitted requests through via’s website.
during the second quarter of 2012, via accepted 350 requests for support valued at $211,778.
travel, hosPitality and ConferenCe exPensesthe following travel, hospitality and conference expenses were submitted during the second quarter of 2012:
Paul G. Smith, chairman of the Board $ 3,823
Marc Laliberté, President and ceo $ 7,830
executive management committee for members (6) $ 36,435
Board of directors members (11) $ 18,390
travel expenses submitted by the Board of directors reflect the diverse geographical locations of the members.
via
ra
il c
an
ad
a /
se
co
nd
Qu
ar
ter
re
Po
rt
2012
/ M
an
ag
eMen
t di
sCu
ssio
n a
nd
an
aly
sis
14
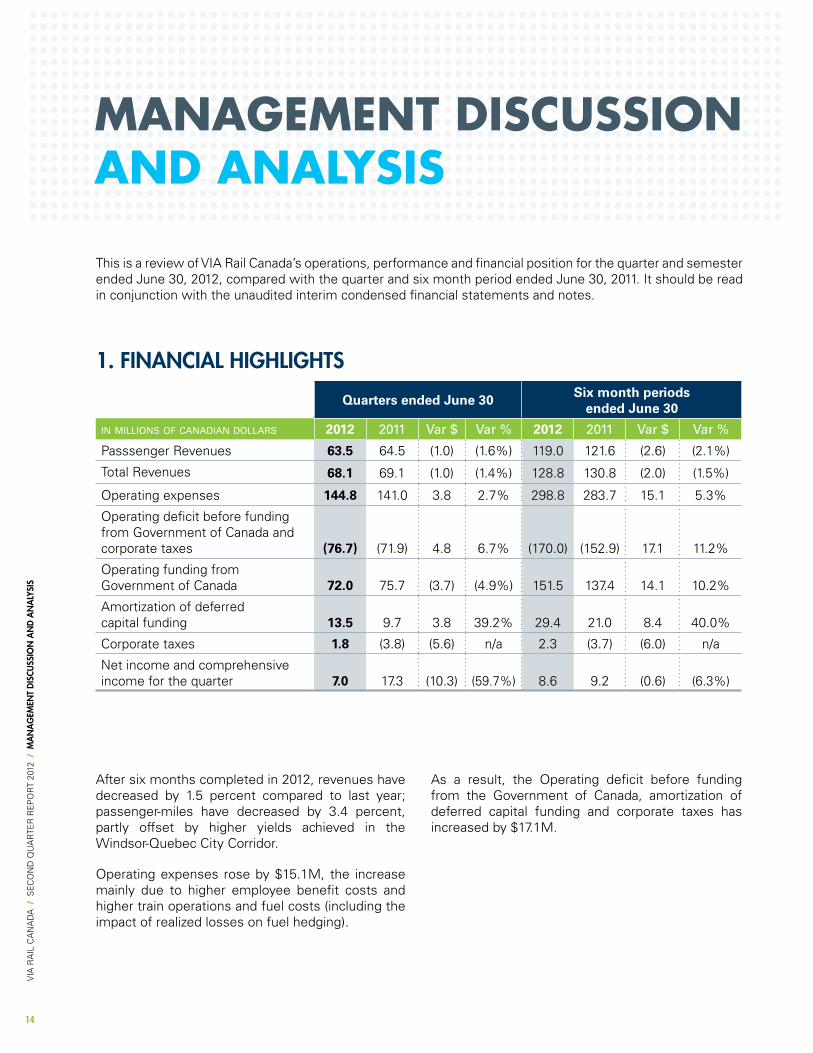
this is a review of via rail canada’s operations, performance and financial position for the quarter and semester ended June 30, 2012, compared with the quarter and six month period ended June 30, 2011. it should be read in conjunction with the unaudited interim condensed financial statements and notes.
after six months completed in 2012, revenues have decreased by 1.5 percent compared to last year; passenger-miles have decreased by 3.4 percent, partly offset by higher yields achieved in the Windsor-Quebec city corridor.
operating expenses rose by $15.1M, the increase mainly due to higher employee benefit costs and higher train operations and fuel costs (including the impact of realized losses on fuel hedging).
MANAGEMENT DIScuSSION AND ANALySIS
1. finanCial highlights
Quarters ended June 30 Six month periods ended June 30
in millions of canadian dollars 2012 2011 Var $ Var % 2012 2011 Var $ Var %
Passsenger revenues 63.5 64.5 (1.0) (1.6%) 119.0 121.6 (2.6) (2.1%)
total revenues 68.1 69.1 (1.0) (1.4%) 128.8 130.8 (2.0) (1.5%)
operating expenses 144.8 141.0 3.8 2.7% 298.8 283.7 15.1 5.3%
operating deficit before funding from government of canada and corporate taxes (76.7) (71.9) 4.8 6.7% (170.0) (152.9) 17.1 11.2%
operating funding from government of canada 72.0 75.7 (3.7) (4.9%) 151.5 137.4 14.1 10.2%
amortization of deferred capital funding 13.5 9.7 3.8 39.2% 29.4 21.0 8.4 40.0%
corporate taxes 1.8 (3.8) (5.6) n/a 2.3 (3.7) (6.0) n/a
net income and comprehensive income for the quarter 7.0 17.3 (10.3) (59.7%) 8.6 9.2 (0.6) (6.3%)
as a result, the operating deficit before funding from the government of canada, amortization of deferred capital funding and corporate taxes has increased by $17.1M.

15
highlights of the quarter
Compared with the quarter ended June 30, 2011:
/ revenues have decreased by 1.4 percent and total $68.1M for the quarter;
/ operating expenses before corporate taxes and amortization of deferred capital funding have increased by 2.7 percent and amount to $144.8M for the quarter;
highlights of the six month period ended June 30, 2012
Compared with the corresponding period ended June 30, 2011:
/ revenues have decreased by 1.5% and total $128.8M for the period;
/ operating expenses before corporate taxes and amortization of deferred capital funding have increased by 5.3% and amount to $298.8M for the period;
via
ra
il c
an
ad
a /
se
co
nd
Qu
ar
ter
re
Po
rt
2012
/ M
an
ag
eMen
t di
sCu
ssio
n a
nd
an
aly
sis
/ funding from government of canada decreased by $3.7M to $72.0M for the quarter;
/ there is a net profit of $7.0M for the quarter, compared to a profit of $17.3M for the same quarter of 2011.
/ funding from government of canada increased by 10.2% to $151.5M for the period;
/ there is a net profit of $8.6M for the period, compared to a profit of $9.2M for the corresponding period in 2011.
16
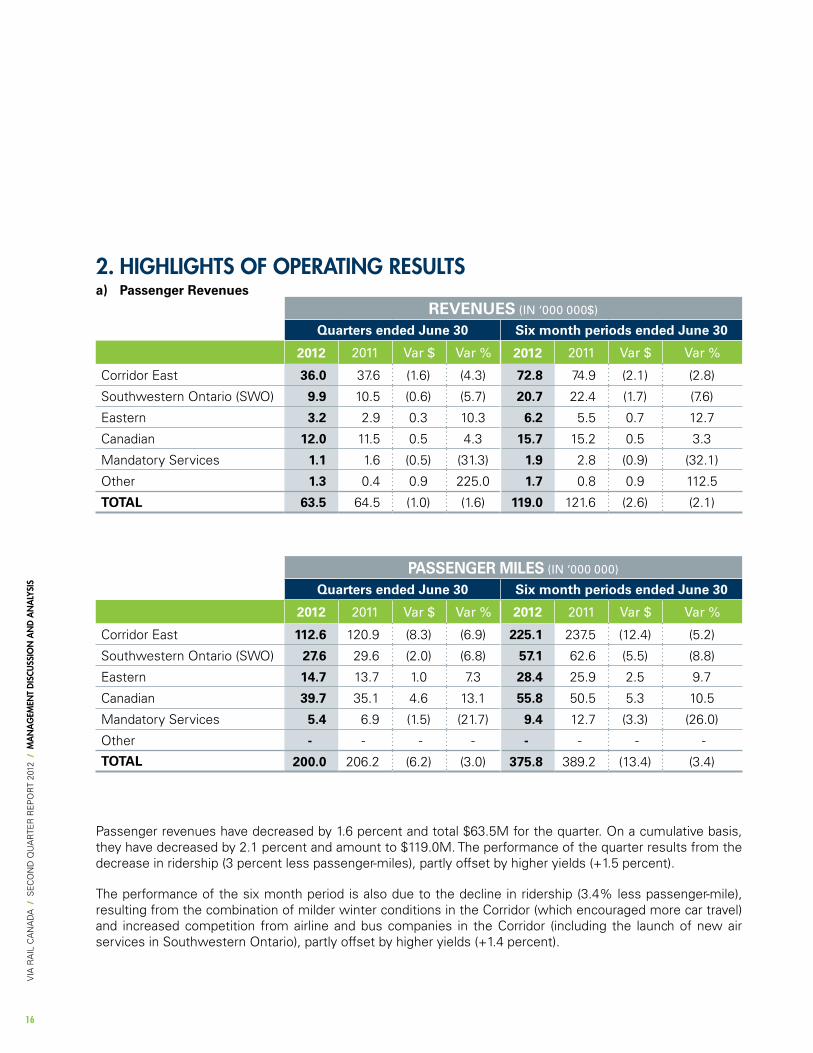
Passenger revenues have decreased by 1.6 percent and total $63.5M for the quarter. on a cumulative basis, they have decreased by 2.1 percent and amount to $119.0M. the performance of the quarter results from the decrease in ridership (3 percent less passenger-miles), partly offset by higher yields (+1.5 percent).
the performance of the six month period is also due to the decline in ridership (3.4% less passenger-mile), resulting from the combination of milder winter conditions in the corridor (which encouraged more car travel) and increased competition from airline and bus companies in the corridor (including the launch of new air services in southwestern ontario), partly offset by higher yields (+1.4 percent).
REvENuES (in ‘000 000$)
Quarters ended June 30 Six month periods ended June 30
2012 2011 Var $ Var % 2012 2011 Var $ Var %
corridor east 36.0 37.6 (1.6) (4.3) 72.8 74.9 (2.1) (2.8)
southwestern ontario (sWo) 9.9 10.5 (0.6) (5.7) 20.7 22.4 (1.7) (7.6)
eastern 3.2 2.9 0.3 10.3 6.2 5.5 0.7 12.7
canadian 12.0 11.5 0.5 4.3 15.7 15.2 0.5 3.3
Mandatory services 1.1 1.6 (0.5) (31.3) 1.9 2.8 (0.9) (32.1)
other 1.3 0.4 0.9 225.0 1.7 0.8 0.9 112.5
TOTAL 63.5 64.5 (1.0) (1.6) 119.0 121.6 (2.6) (2.1)
PASSENGER MILES (in ‘000 000)
Quarters ended June 30 Six month periods ended June 30
2012 2011 Var $ Var % 2012 2011 Var $ Var %
corridor east 112.6 120.9 (8.3) (6.9) 225.1 237.5 (12.4) (5.2)
southwestern ontario (sWo) 27.6 29.6 (2.0) (6.8) 57.1 62.6 (5.5) (8.8)
eastern 14.7 13.7 1.0 7.3 28.4 25.9 2.5 9.7
canadian 39.7 35.1 4.6 13.1 55.8 50.5 5.3 10.5
Mandatory services 5.4 6.9 (1.5) (21.7) 9.4 12.7 (3.3) (26.0)
other - - - - - - - -
TOTAL 200.0 206.2 (6.2) (3.0) 375.8 389.2 (13.4) (3.4)
2. highlights of oPerating resultsa) Passenger Revenues
via
ra
il c
an
ad
a /
se
co
nd
Qu
ar
ter
re
Po
rt
2012
/ M
an
ag
eMen
t di
sCu
ssio
n a
nd
an
aly
sis

via
ra
il c
an
ad
a /
se
co
nd
Qu
ar
ter
re
Po
rt
2012
/ M
an
ag
eMen
t di
sCu
ssio
n a
nd
an
aly
sis
17
For the quarter:
/ corridor east revenues are 4.3 percent below last year, and result mainly from lower ridership (6.9 percent less passenger miles), partly offset by higher yields (+2.8 percent). the decrease in passenger-miles during the quarter was more significant than the decrease of passengers, reflecting the fact that the erosion of ridership affected end to end markets;
/ revenues in sWo have decreased by 5.7 percent also as a result of lower ridership (6.8 percent less passenger-miles), partly offset by higher yields (+1.1 percent);
/ revenues on the Ocean have grown by 10.3 percent, due to increased volume (+7.3 percent passenger-miles) combined with higher yields (+2.8 percent). this increase can be associated to the interruption of service on the Montreal-gaspe route (passengers travelled instead on the Montreal-Halifax trains);
For the six month period ended June 30:
/ corridor east revenues are 2.8 percent below last year, and result mainly from lower ridership (5.2 percent less passenger miles), partly offset by higher yields (+2.6 percent). the decrease in passenger-miles during the quarter was more significant than the decrease of passengers, reflecting the fact that the erosion of ridership affected end to end markets;
/ revenues in sWo have decreased by 7.6 percent also as a result of lower ridership (8.8 percent less passenger-miles), partly offset by higher yields (+1.3 percent);
/ revenues on the Ocean have grown by 12.7 percent, due to increased volume (+9.7 percent passenger-miles) combined with higher yields (+2.8 percent). this increase can be associated to the interruption of service on the Montreal-gaspe route (passengers travelled instead on the Montreal-Halifax trains);
/ revenues on the Canadian have increased by 4.3 percent. Passenger volumes increased compared to last year (13.1 percent more passenger-miles), but yields decreased (-7.7 percent) due to the fact that ridership grew in economy where average fares are lower compared to sleeper class, and that average fares in both classes were below last year’s levels;
/ Mandatory services have generated lower revenues (-31.3 percent), the decrease directly attributable to the situation affecting the Montreal-gaspé service. the train service cannot be provided all the way to gaspe because of poor track conditions, the train therefore stops at campbelton where passengers are transferred on a bus and taken to gaspé. this situation has had a negative impact on ridership.
/ revenues on the Canadian have increased by 3.3 percent. Passenger volumes increased compared to last year (10.5 percent more passenger-miles), but yields decreased (-6.5 percent) due to the fact that ridership grew in economy where average fares are lower compared to sleeper class, and that average fares on both classes were below last year’s levels;
/ Mandatory services have generated lower revenues (-32.1 percent), the decrease directly attributable to the situation affecting the Montreal-gaspé service. the train service cannot be provided all the way to gaspe because of poor track conditions, the train therefore stops at campbelton where passengers are transferred on a bus and taken to gaspé. this situation has had a negative impact on ridership.

via
ra
il c
an
ad
a /
se
co
nd
Qu
ar
ter
re
Po
rt
2012
/ M
an
ag
eMen
t di
sCu
ssio
n a
nd
an
aly
sis
18
b) Operating Expenses
For the quarter: / operating expenses before amortization of deferred capital funding & corporate tax expense increased by $3.8M and total $144.8M for the quarter, mainly due to higher compensation and benefit costs (due to higher employee benefit costs).
For the six month period ended June 30: / operating expenses before amortization of deferred capital funding & corporate tax expense increased by $15.1M and total $298.8M for the period, mainly due to higher compensation and benefit costs (due to higher employee benefit costs) and higher train operations and fuel costs (including the impact of realized losses on fuel hedging).
Quarters ended June 30Six month periods
ended June 30
in millions of canadian dollars 2012 2011 Var $ Var % 2012 2011 Var $ Var %
compensation & Benefits 60.6 56.8 3.8 6.7 132.8 122.3 10.5 8.6
train operations & fuel 30.0 31.3 (1.3) (4.2) 62.3 60.7 1.6 2.6
other operating expenses 48.9 50.8 (1.9) (3.7) 101.6 103.8 (2.2) (2.1)
unrealized loss (gain) on derivative financial instruments 5.5 3.7 1.8 48.6 3.1 (0.3) 3.4 n/a
realized loss (gain) on derivative financial instruments (0.2) (1.6) 1.4 87.5 (1.0) (2.8) 1.8 64.3
total operating expenses before amortization of deferred capital funding & corporate tax expense 144.8 141.0 3.8 2.7 298.8 283.7 15.1 5.3
corporate taxes 1.8 (3.8) 5.6 n/a 2.3 (3.7) 6.0 n/a
TOTAL OPERATING ExPENSES bEFORE AMORTIzATION OF DEFERRED CAPITAL FuNDING 146.6 137.2 9.4 6.9 301.1 280.0 21.1 7.5

via
ra
il c
an
ad
a /
se
co
nd
Qu
ar
ter
re
Po
rt
2012
/ M
an
ag
eMen
t di
sCu
ssio
n a
nd
an
aly
sis
19
3. CaPital investMentsfixed assets (net of accumulated depreciation) amount to $1,205.6M, up $53.5M compared to the balance as at december 31, 2011. capital investments for the quarter totaled $40.7M and $84.0M for the six month period ended June 30.
/ investments of $18.0M were made in major infrastructure projects, mostly on the cn Kingston subdivision of the Montreal-toronto line. Work is done to add sections of a third track to minimize congestion;
/ a total of $10.6M was invested in major equipment projects, including $7.9M for the f40 locomotive fleet rebuild project, $2.1M for the renaissance accessibility project, and $0.5M for the HeP1 Modernization program;
/ investments of $4.6M were made in information technology projects during the quarter;
/ a total of $1.4M was invested in station upgrading projects;
the corporation’s cash balance is $7.5M as at June 30, 2012, down $7.4M compared to the balance as at March 31, 2012 and down $5.7M compared to december 31, 2011.
the decrease in cash position during the quarter and six month period is due to acquisition of property, plant and equipment and intangible assets.
4. Cash flow and finanCial Position
20
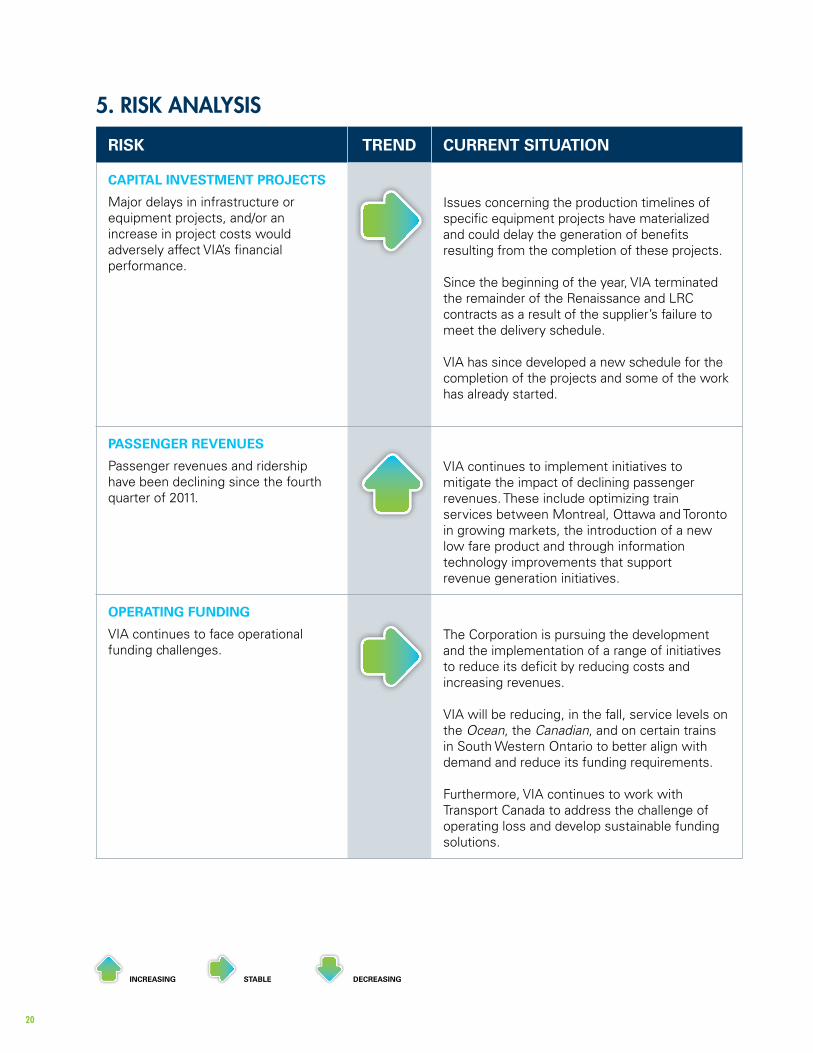
5. risK analysis
RISK TREND CuRRENT SITuATION
CAPITAL INvESTMENT PROJECTS
Major delays in infrastructure or equipment projects, and/or an increase in project costs would adversely affect via’s financial performance.
issues concerning the production timelines of specific equipment projects have materialized and could delay the generation of benefits resulting from the completion of these projects.
since the beginning of the year, via terminated the remainder of the renaissance and lrc contracts as a result of the supplier’s failure to meet the delivery schedule.
via has since developed a new schedule for the completion of the projects and some of the work has already started.
PASSENGER REvENuES
Passenger revenues and ridership have been declining since the fourth quarter of 2011.
via continues to implement initiatives to mitigate the impact of declining passenger revenues. these include optimizing train services between Montreal, ottawa and toronto in growing markets, the introduction of a new low fare product and through information technology improvements that support revenue generation initiatives.
OPERATING FuNDING
via continues to face operational funding challenges.
the corporation is pursuing the development and the implementation of a range of initiatives to reduce its deficit by reducing costs and increasing revenues.
via will be reducing, in the fall, service levels on the Ocean, the Canadian, and on certain trains in south Western ontario to better align with demand and reduce its funding requirements.
furthermore, via continues to work with transport canada to address the challenge of operating loss and develop sustainable funding solutions.
increasing stable decreasing

21
RISK TREND CuRRENT SITuATION
PENSION COSTS
Pension costs could increase significantly given current and projected discount rates as well as demographics.
the situation has worsened due to declining interest rates.
Management has adopted changes to the Pension plan programs to minimize cost increases and ensure costs are contained as much as possible. these changes will take effect in the beginning of 2013.
CAPITAL FuNDING
via will need to continue investing in equipment, stations, maintenance systems, facilities and information technology after 2012, when the current investment program is completed.
the corporation is working with transport canada to address ongoing capital funding requirements, and to ensure that via has the capital funding it requires to deliver on its mandate.
via received a $60M envelope for the 2012-2013 year but ongoing capital funding will still be required for future years.
RETIREMENT OF LOCOMOTIvE ENGINEERS
via is dependant on the specialized set of skills of the engineers who operate its locomotives. More than half of via’s locomotive engineers could retire by the end of the year 2015, and if via were to experience a substantial turnover in its locomotive engineer group, its business could be adversely affected.
the corporation launched, in december 2010, a training program for new locomotive engineers, with the first class scheduled to graduate in 2012. an additional class has started in october 2011 and another additional class started in 2012, all of which will graduate at the end of 2012.
the reductions in services recently announced could partially mitigate that risk.
FuEL COST FLuCTuATIONS
fuel is a major cost for passenger rail operations, and fuei costs could vary significantly from via’s estimates due to the uncertainty and volatility of fuel prices.
via’s proven hedging strategy adds certainty to future fuel costs and can delay the impact of fuel price fluctuations. given that contracts used to hedge fuel prices are denominated in u.s. dollars, via also hedges against foreign exchange risks.
furthermore, fuel consumption has decreased compared to previous years as a result of the introduction of the refurbished locomotives as well as other initiatives to reduce fuel consumption.
increasing stable decreasing

via
ra
il c
an
ad
a /
se
co
nd
Qu
ar
ter
re
Po
rt
2012
/ M
an
ag
eMen
t di
sCu
ssio
n a
nd
an
aly
sis
22
RISK TREND CuRRENT SITuATION
CROSSING INCIDENTS
via’s train operate through many protected and unprotected level road crossings where vehicles can cross and where incidents/accidents could occur.
via has developed a crossing improvement (protection, fences) and closure program. they work actively with communities and owners of the land where there are crossings. the objectives of the program are to close crossings where possible and to increase public awareness about the potential dangers they represent.
increasing stable decreasing

via
ra
il c
an
ad
a /
se
co
nd
Qu
ar
ter
re
Po
rt
2012
/ M
an
ag
eMen
t di
sCu
ssio
n a
nd
an
aly
sis
23
6. outlooKthe performance of revenues has been below expectations during the second quarter, as total ridership continued to decline for a third consecutive quarter.
via has put in place its contingency plan to minimize the adverse impact of the uncertain economic conditions and sustained competition from airlines and bus companies have had on revenues since the beginning of the year. this plan includes initiatives to stimulate revenues and measures to ensure that expenses are kept at minimum levels.
via will also be reducing, in the fall, service levels on the Ocean, the Canadian, and on certain trains in south Western ontario to better align with demand and reduce its funding requirements.
While via faced a challenging second quarter, the corporation remains confident that it will meet its financial objectives for 2012 with the exclusion of the recent pension cost increases.
at the same time, via is focusing on completing its capital investments projects and will ensure that passenger rail delivers better value to more canadian travelers, while maintaining rigorous control over operating costs.
INTERIM CONDENSED
fINaNCIal STaTEMENTS

25
VIA
RA
Il C
An
Ad
A /
se
Co
nd
Qu
AR
teR
Re
po
Rt
2012
/ I
nte
rIm
co
nde
nse
d FI
na
ncI
al
stat
emen
ts
25
Management is responsible for the preparation and fair presentation of these quarterly financial statements in accordance with the treasury Board of Canada standard on Quarterly Financial Reports for Crown Corporations, and for such internal controls as management determines is necessary to enable the preparation of quarterly financial statements that are free from material misstatement.
Management is also responsible for ensuring all other information in this quarterly financial report is consistent, where appropriate, with the quarterly financial statements.
Based on our knowledge, these unaudited quarterly financial statements present fairly, in all material respects, the financial position, results of operations and cash flows of the corporation, as at the date of and for the periods presented in the quarterly financial statements.
Marc Lalibertépresident and Chief executive officer
Robert St-Jean, CAChief Financial and Administration officer
MaNagEMENT’S RESpONSIbIlITy STaTEMENTQuARteR ended june 30. 2012
Montréal, Canada August 28, 2012

26
VIA
RA
Il C
An
Ad
A /
se
Co
nd
Qu
AR
teR
Re
po
Rt
2012
/ I
nte
rIm
co
nde
nse
d FI
na
ncI
al
stat
emen
ts
26
InterIm condensed FInancIal statementsStatement of Financial PositionAs at (in thousands of canadian dollars)
June 30, 2012 (unaudited)
December 31, 2011 (audited)
Current AssetsCash and cash equivalents $ 7,527 $ 13,253 Accounts receivable, trade 8,104 10,707 prepaids, advances on contracts and other receivables 9,553 11,147 Receivable from the Government of Canada 5,595 - derivative financial instruments (note 16) 1,441 2,225 Materials 22,620 21,287 Asset Renewal Fund (note 8) 15,230 24,022
70,070 82,641 non-Current Assetsproperty, plant and equipment (note 6) 840,145 814,876 Intangible assets (note 7) 365,412 337,182 Asset Renewal Fund (note 8) 11,621 9,881 Accrued benefit asset (note 11) 200,757 186,937
1,417,935 1,348,876 Total assets $ 1,488,005 $ 1,431,517 Current liAbilitiesAccounts payable and accrued liabilities (note 9) $ 85,180 $ 103,841 provisions (note 10) 14,655 18,050 deferred government funding - 6,148 derivative financial instruments (note 16) 3,480 1,173 deferred revenues 44,827 26,734
148,142 155,946 non-Current liAbilitiesAccrued benefit liability (note 11) 35,777 35,425 deferred corporate tax liabilities (note 12) 2,299 - deferred investment tax credits 424 566
38,500 35,991 DeferreD CApitAl funDing (note 13) 1,196,959 1,143,800 shAreholDer’s equityshare capital 9,300 9,300 Retained earnings 95,104 86,480
104,404 95,780 Total liabilities and shareholder’s equity $ 1,488,005 $ 1,431,517
Commitments (notes 13) the notes are an integral part of the interim condensed financial statements.
Eric L. Stefanson. FCA director and Chairman of the Audit. Risk and Finance Committee
Paul G. Smithdirector and Chairman of the Board
Approved on behalf of the Board.
27
VIA
RA
Il C
An
Ad
A /
se
Co
nd
Qu
AR
teR
Re
po
Rt
2012
/ I
nte
rIm
co
nde
nse
d FI
na
ncI
al
stat
emen
ts
27
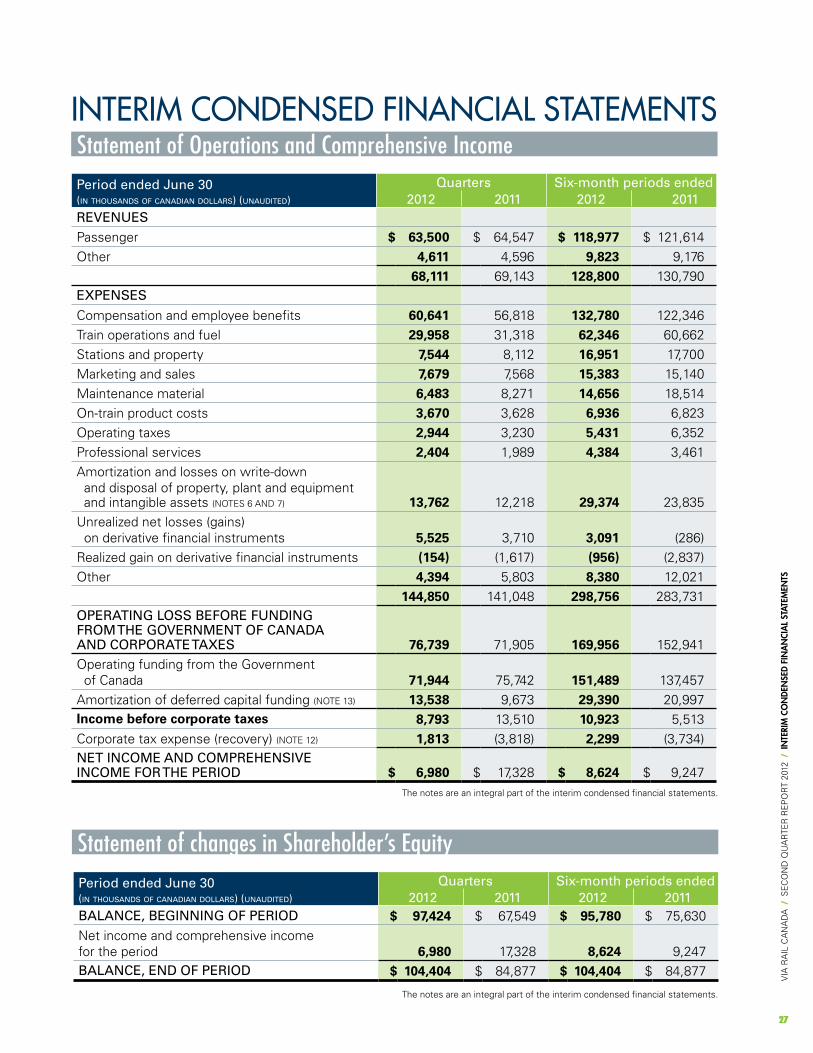
InterIm condensed FInancIal statementsStatement of Operations and Comprehensive Income
Statement of changes in Shareholder’s Equity
period ended June 30 (in thousands of canadian dollars) (unaudited)
quarters six-month periods ended2012 2011 2012 2011
revenuespassenger $ 63,500 $ 64,547 $ 118,977 $ 121,614 other 4,611 4,596 9,823 9,176
68,111 69,143 128,800 130,790 expenses
Compensation and employee benefits 60,641 56,818 132,780 122,346 train operations and fuel 29,958 31,318 62,346 60,662 stations and property 7,544 8,112 16,951 17,700 Marketing and sales 7,679 7,568 15,383 15,140 Maintenance material 6,483 8,271 14,656 18,514 on-train product costs 3,670 3,628 6,936 6,823 operating taxes 2,944 3,230 5,431 6,352 professional services 2,404 1,989 4,384 3,461 Amortization and losses on write-down and disposal of property, plant and equipment and intangible assets (notes 6 And 7)
13,762 12,218
29,374 23,835
unrealized net losses (gains) on derivative financial instruments 5,525 3,710 3,091 (286)Realized gain on derivative financial instruments (154) (1,617) (956) (2,837) other 4,394 5,803 8,380 12,021
144,850 141,048 298,756 283,731operAting loss before funDing from the government of CAnADA AnD CorporAte tAxes
76,739 71,905 169,956 152,941
operating funding from the Government of Canada 71,944 75,742 151,489 137,457 Amortization of deferred capital funding (note 13) 13,538 9,673 29,390 20,997 Income before corporate taxes 8,793 13,510 10,923 5,513 Corporate tax expense (recovery) (note 12) 1,813 (3,818) 2,299 (3,734)net inCome AnD Comprehensive inCome for the perioD $ 6,980 $ 17,328 $ 8,624 $ 9,247
the notes are an integral part of the interim condensed financial statements.
period ended June 30 (in thousands of canadian dollars) (unaudited)
quarters six-month periods ended2012 2011 2012 2011
bAlAnCe, beginning of perioD $ 97,424 $ 67,549 $ 95,780 $ 75,630 net income and comprehensive income for the period 6,980 17,328 8,624 9,247 bAlAnCe, enD of perioD $ 104,404 $ 84,877 $ 104,404 $ 84,877
the notes are an integral part of the interim condensed financial statements.

28
VIA
RA
Il C
An
Ad
A /
se
Co
nd
Qu
AR
teR
Re
po
Rt
2012
/ I
nte
rIm
co
nde
nse
d FI
na
ncI
al
stat
emen
ts
28
InterIm condensed FInancIal statementsStatement of Cash Flowsperiod ended June 30(in thousands of canadian dollars) (unaudited)
quarters six-month periods ended2012 2011 2012 2011
operAting ACtivities
net income and comprehensive income for the period $ 6,980 $ 17,328 $ 8,624 $ 9,247
Adjustments to determine net cash (used in) from operating activities:
Amortization of property, plant and equipment and intangible assets 13,810 12,104 27,539 23,193
losses on write-down and disposal of property, plant and equipment and intangible assets 23 213 1,977 840
Amortization of deferred investment tax credits (71) ( 99) (142) (198)
Amortization of deferred capital funding (13,538) (9,673) (29,390) (20,997)
Interest income (183) (232) (412) ( 474)
deferred corporate taxes 1,888 248 2,299 248
Change in fair value of financial instruments (Asset renewal fund) (27) (187) (401) (643)
unrealized net loss (net gain) on derivative financial instruments 5,525 3,710 3,091 (286)
net change in non-cash working capital items 3,693 (11,274) (3,766) (47,115)
Change in accrued benefit asset (15,108) (11,530) (13,820) (13,481)
Change in accrued benefit liability 101 299 352 600
Change in other non-current liabilities - - - (66)
Net cash used in operating activities 3,093 907 (4,049) (49,132)finAnCing ACtivities
Capital funding 39,273 43,622 82,549 110,293
Change in capital funding receivable from the Government of Canada (5,088) 22,878 (564) 16,207 Net cash provided by financing activities 34,185 66,500 81,985 126,500
investing ACtivities
Acquisition of investments in the Asset Renewal Fund (22,087) (23,588) (46,671) (63,424)
proceeds from sale and maturity of investments in the Asset Renewal Fund 23,235 23,484 54,124 67,207
Change in Capital accounts payable and accrued liabilities (5,279) (12,207) (8,512) (30,593)
Acquisition of property, plant and equipment and intangible as-sets (40,774) (54,516) (84,044) (110,293)
Interest received 183 232 412 474
proceeds from disposal of property, plant and equipment and intangible assets 6 10 1,029 66
Net cash used in investing activities (44,716) (66,585) (83,662) (136,563)
CAsh AnD CAsh equivAlents
Increase (decrease) during the period (7,438) 822 (5,726) (59,195)
Balance, beginning of period 14,965 16,812 13,253 76,829
bAlAnCe, enD of perioD $ 7,527 $ 17,634 $ 7,527 $ 17,634
representeD by:
Cash $ 6,303 $ 6,916 $ 6,303 $ 6,916
short-term investments 1,224 10,718 1,224 10,718
$ 7,527 $ 17,634 $ 7,527 $ 17,634
the notes are an integral part of the interim condensed financial statements.

29
VIA
RA
Il C
An
Ad
A /
se
Co
nd
Qu
AR
teR
Re
po
Rt
2012
/ n
ote
s to
th
e In
terI
m c
on
den
sed
FIn
an
cIa
l st
atem
ents
29
1. authorIty and objectIvesVIA Rail Canada Inc. is a Crown corporation named in part I of schedule III to the Financial Administration Act. the Corporation was incorporated in 1977 in Canada, under the Canada Business Corporations Act. the corporate headquarters is located at 3 place Ville-Marie, Montreal (Quebec). the Corporation’s vision is to offer the best travel experience in Canada with a mission to work together to exceed customer expectations every time. the Corporation uses the roadway infrastructure of other railway companies and relies on them to control train operations.
the Corporation is not an agent of Her Majesty and is subject to income taxes.
the Corporation has one operating segment, passenger transportation and related services in Canada. the corporation’s activities are considered seasonal since passenger traffic increases significantly during the summer and holiday periods resulting in an increase in revenue for these same periods.
these interim condensed financial statements were approved and authorized for issue by the Board of directors on August 28, 2012.
2. basIs oF PreParatIon A) stAtement of CompliAnCesection 83 of the Financial Administration Act requires that most parent Crown Corporations prepare and make public quarterly financial reports for periods beginning on or after April 1, 2011 compliant with the Standard on Quarterly Financial Reports for Crown Corporations.
these unaudited interim condensed financial statements have been prepared in accordance with IAs 34 ‘’Interim financial reporting’’. the interim condensed financial statements should be read in conjunction with the annual financial statements for the year ended december 31, 2011, which have been prepared in accordance with the IFRs.
b) funCtionAl AnD presentAtion CurrenCythese interim condensed financial statements are presented in Canadian dollars, which is the Corporation’s functional currency. All financial information presented in Canadian dollars has been rounded to the nearest thousand in the interim condensed financial statements and rounded to the nearest million in the notes to the interim condensed financial statements.
3. summary oF sIGnIFIcant accountInG PolIcIesthe significant accounting policies applied in these unaudited interim condensed financial statements are disclosed in note 4 of the Corporation’s annual financial statement for the year ended december 31, 2011. the accounting policies have been applied consistently to all periods presented.
NOTES TO ThE INTERIM CONDENSED fINaNCIal STaTEMENTSAs At june 30, 2012 (unAudIted)
30
VIA
RA
Il C
An
Ad
A /
se
Co
nd
Qu
AR
teR
Re
po
Rt
2012
/ n
ote
s to
th
e In
terI
m c
on
den
sed
FIn
an
cIa
l st
atem
ents
30
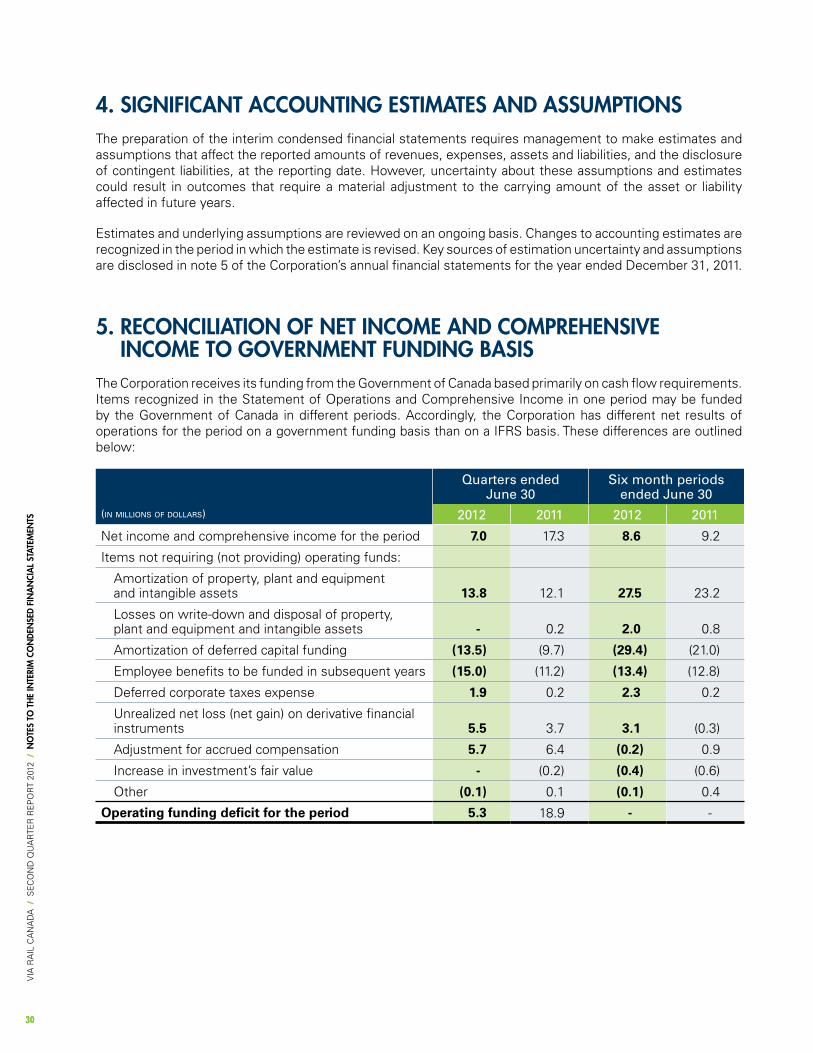
4. sIGnIFIcant accountInG estImates and assumPtIonsthe preparation of the interim condensed financial statements requires management to make estimates and assumptions that affect the reported amounts of revenues, expenses, assets and liabilities, and the disclosure of contingent liabilities, at the reporting date. However, uncertainty about these assumptions and estimates could result in outcomes that require a material adjustment to the carrying amount of the asset or liability affected in future years.
estimates and underlying assumptions are reviewed on an ongoing basis. Changes to accounting estimates are recognized in the period in which the estimate is revised. Key sources of estimation uncertainty and assumptions are disclosed in note 5 of the Corporation’s annual financial statements for the year ended december 31, 2011.
5. reconcIlIatIon oF net Income and comPrehensIve Income to Government FundInG basIs
the Corporation receives its funding from the Government of Canada based primarily on cash flow requirements. Items recognized in the statement of operations and Comprehensive Income in one period may be funded by the Government of Canada in different periods. Accordingly, the Corporation has different net results of operations for the period on a government funding basis than on a IFRs basis. these differences are outlined below:
quarters ended June 30
six month periods ended June 30
(in millions of dollars) 2012 2011 2012 2011
net income and comprehensive income for the period 7.0 17.3 8.6 9.2
Items not requiring (not providing) operating funds:
Amortization of property, plant and equipment and intangible assets 13.8 12.1 27.5 23.2
losses on write-down and disposal of property, plant and equipment and intangible assets - 0.2 2.0 0.8
Amortization of deferred capital funding (13.5) (9.7) (29.4) (21.0)
employee benefits to be funded in subsequent years (15.0) (11.2) (13.4) (12.8)
deferred corporate taxes expense 1.9 0.2 2.3 0.2
unrealized net loss (net gain) on derivative financial instruments 5.5 3.7 3.1 (0.3)
Adjustment for accrued compensation 5.7 6.4 (0.2) 0.9
Increase in investment’s fair value - (0.2) (0.4) (0.6)
other (0.1) 0.1 (0.1) 0.4
Operating funding deficit for the period 5.3 18.9 - -

31
VIA
RA
Il C
An
Ad
A /
se
Co
nd
Qu
AR
teR
Re
po
Rt
2012
/ n
ote
s to
th
e In
terI
m c
on
den
sed
FIn
an
cIa
l st
atem
ents
31
6. ProPerty, Plant and eQuIPment
(in millions of dollars)December
31, 2011 Additions
retirement and
Disposalsreclassifica-
tionJune 30,
2012
Cost:
land 9.6 2.7 - - 12.3
Rolling stock 823.4 19.7 (14.8) - 828.3
Maintenance buildings 138.4 - (0.2) - 138.2
stations and facilities 64.2 16.5 (0.4) - 80.3
owned infrastructures 164.6 5.9 - - 170.5
leasehold improvements 73.6 0.1 (0.2) - 73.5
Machinery and equipment 36.2 0.2 (0.1) - 36.3
Computer hardware 12.7 0.6 (0.7) - 12.6
other property, plant and equipment 22.5 - (0.3) - 22.2
Total cost 1,345.2 45.7 (16.7) - 1,374.2
Accumulated amortization and impairments:
Rolling stock 386.5 13.8 (12.1) - 388.2
Maintenance buildings 83.6 2.0 - - 85.6
stations and facilities 29.5 1.3 (0.3) - 30.5
owned infrastructures 51.4 2.3 - - 53.7
leasehold improvements 49.2 1.3 (0.2) - 50.3
Machinery and equipment 27.1 0.7 (0.3) - 27.5
Computer hardware 9.8 0.8 (0.1) - 10.5
other property, plant and equipment 19.6 0.1 - - 19.7
Total accumulated amortization and impairments 656.7 22.3 (13.0) - 666.0
project in progress 126.3 52.3 (45.7) (1.1) 131.8
Retired assets 0.1 - - - 0.1
Total net carrying amount 814.9 75.7 (49.4) (1.1) 840.1

32
VIA
RA
Il C
An
Ad
A /
se
Co
nd
Qu
AR
teR
Re
po
Rt
2012
/ n
ote
s to
th
e In
terI
m c
on
den
sed
FIn
an
cIa
l st
atem
ents
32
7. IntanGIble assets
(in millions of dollars)December
31, 2011 Additionsretirement
and Disposals reclassificationsJune 30,
2012
Cost:
Internally generated software 54.3 4.3 (0.4) - 58.2
Right of access to rail infrastructure 173.4 0.6 - - 174.0
other intangible 3.5 - - - 3.5
Total cost 231.2 4.9 (0.4) - 235.7
Accumulated amortization and impairments:
Internally generated software 46.9 2.4 (0.5) 0.7 49.5
Right of access to rail infrastructure 43.9 2.7 - - 46.6
other intangible 1.5 0.1 - (0.7) 0.9
Total accumulated amortization and impairments 92.3 5.2 (0.5) - 97.0
project in progress 198.3 31.7 (4.4) 1.1 226.7
Total net carrying amount 337.2 31.4 (4.3) 1.1 365.4
8. asset reneWal FundChAnges in the Asset renewAl funDthe changes in the closing balance of the Asset Renewal Fund resulted from the following movements during the period:
(in millions of dollars)
June 30, 2012
December 31, 2011
Balance at beginning of the period 33.9 40.9
proceeds from sale or lease of surplus assets
1.2 0.5
Investment Income 0.2 0.4
Change in fair value 0.4 0.4
less: Cash drawdown during the period (8.8) (8.3)
Balance at end of the period 26.9 33.9
33
VIA
RA
Il C
An
Ad
A /
se
Co
nd
Qu
AR
teR
Re
po
Rt
2012
/ n
ote
s to
th
e In
terI
m c
on
den
sed
FIn
an
cIa
l st
atem
ents
33
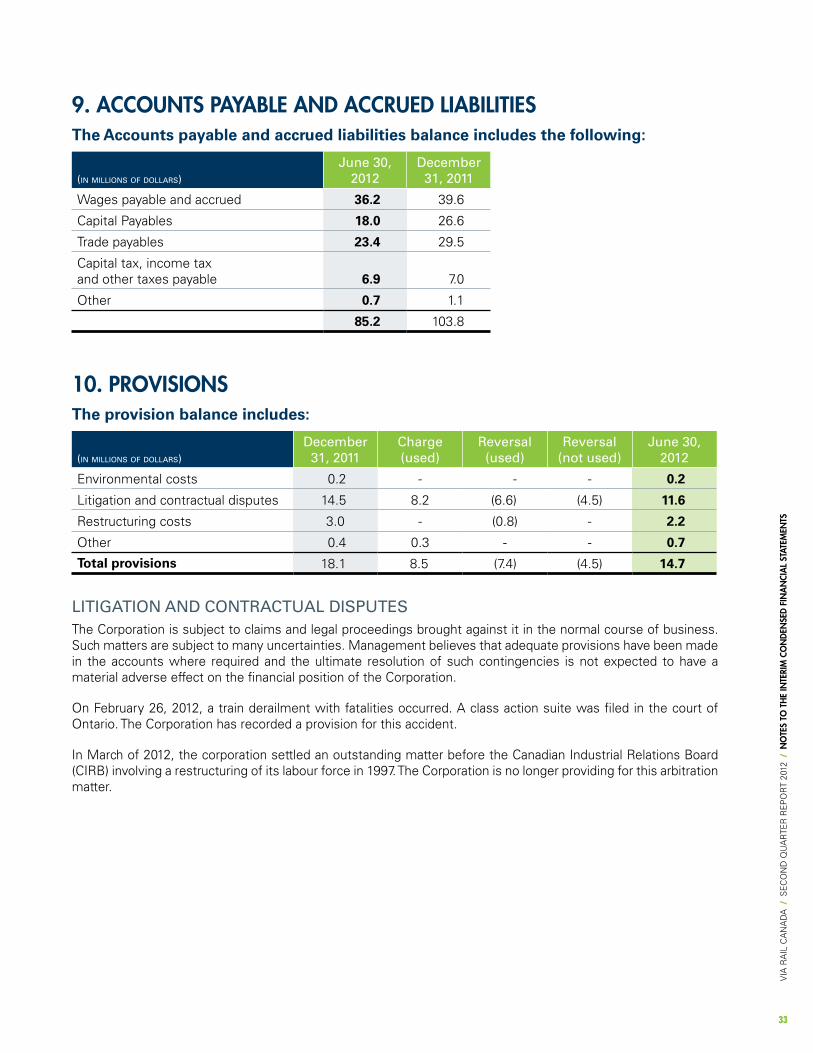
9. accounts Payable and accrued lIabIlItIesThe Accounts payable and accrued liabilities balance includes the following:
(in millions of dollars)
June 30, 2012
December 31, 2011
Wages payable and accrued 36.2 39.6
Capital payables 18.0 26.6
trade payables 23.4 29.5
Capital tax, income tax and other taxes payable 6.9 7.0
other 0.7 1.1
85.2 103.8
10. ProvIsIonsThe provision balance includes:
(in millions of dollars)
December 31, 2011
Charge (used)
reversal (used)
reversal (not used)
June 30, 2012
environmental costs 0.2 - - - 0.2
litigation and contractual disputes 14.5 8.2 (6.6) (4.5) 11.6
Restructuring costs 3.0 - (0.8) - 2.2
other 0.4 0.3 - - 0.7
Total provisions 18.1 8.5 (7.4) (4.5) 14.7
litigAtion AnD ContrACtuAl Disputesthe Corporation is subject to claims and legal proceedings brought against it in the normal course of business. such matters are subject to many uncertainties. Management believes that adequate provisions have been made in the accounts where required and the ultimate resolution of such contingencies is not expected to have a material adverse effect on the financial position of the Corporation.
on February 26, 2012, a train derailment with fatalities occurred. A class action suite was filed in the court of ontario. the Corporation has recorded a provision for this accident.
In March of 2012, the corporation settled an outstanding matter before the Canadian Industrial Relations Board (CIRB) involving a restructuring of its labour force in 1997. the Corporation is no longer providing for this arbitration matter.

34
VIA
RA
Il C
An
Ad
A /
se
Co
nd
Qu
AR
teR
Re
po
Rt
2012
/ n
ote
s to
th
e In
terI
m c
on
den
sed
FIn
an
cIa
l st
atem
ents
34
11. emPloyee beneFIts the Corporation provides a number of funded defined benefit pension plans as well as unfunded other post-employment benefits including post-retirement medical, dental and life insurance benefits. the Corporation also provides long-term employee benefits such as an unfunded self-insured workers’ compensation benefits, long-term employee disability benefits and continuation of benefit coverage for employees on long-term disability. the actuarial valuations for employee benefits are carried out by external actuaries who are members of the Canadian Institute of Actuaries.
A) pension plAns AnD post-employment benefits plAns
Based on these actuarial valuations and projections to june 30, the summary of the principal valuation results, in aggregate, excluding the self-insured workers’ compensation benefits is as follows:
(in millions of dollars)
pension planspost-employment
benefit plans
June 30, 2012
December 31, 2011
June 30, 2012
December 31, 2011
ACCrueD benefit obligAtion:
Balance at beginning of the period 1,860.5 1,593.5 16.8 13.6
Current service cost 14.4 24.7 0.3 0.4
Interest cost 41.7 87.2 0.4 0.8
plan amendment - - - 0.6
employee contributions 5.2 10.1 - -
Benefits paid (41.7) (92.8) (0.3) (0.6)
Actuarial losses 52.6 237.8 0.6 2.0
plan curtailment (4.9) - (0.3) -
Balance at end of the period 1,927.8 1,860.5 17.5 16.8
fAir vAlue of plAn Assets:
Balance at beginning of the period 1,586.1 1,588.2 - -
expected return on plan assets 45.3 97.7 - -
Actuarial loss (4.1) (61.2) - -
employer contributions 34.9 44.1 0.3 0.6
employee contributions 5.2 10.1 - -
Benefits paid (41.7) (92.8) (0.3) (0.6)
Balance at end of the period 1,625.7 1,586.1 - -

35
VIA
RA
Il C
An
Ad
A /
se
Co
nd
Qu
AR
teR
Re
po
Rt
2012
/ n
ote
s to
th
e In
terI
m c
on
den
sed
FIn
an
cIa
l st
atem
ents
35
quarters ended June 30
six month periods ended June 30
(in millions of dollars) 2012 2011 2012 2011
Components of Pension cost:
Current service cost 7.2 6.4 14.4 12.8
Interest cost 20.9 21.7 41.7 43.3
expected return on plan assets (22.9) (24.2) (45.3) (48.4)
Actuarial loss recognized in the period 6.9 0.3 13.7 0.6
plan curtailment (3.5) - (3.5) -
Total pension cost 8.6 4.2 21.0 8.3
Components of Post-employment benefit cost:
Current service cost 0.1 0.1 0.3 0.2
Interest cost 0.2 0.2 0.4 0.4
Actuarial losses 0.1 - 0.1 -
Vested past service cost - 0.1 0.1 0.2
plan curtailment (0.2) - (0.2) -
Total post-employment benefit costs 0.2 0.4 0.7 0.8
Amounts Recognized in the Statement of financial position:
(in millions of dollars)
pension planspost-employment
benefit plans
June 30, 2012
December 31, 2011
June 30, 2012
December 31, 2011
Benefit obligation (1,927.8) (1,860.5) (17.5) (16.8)
Fair value of plan assets 1,625.7 1,586.1 - -
Deficit (302.1) (274.4) (17.5) (16.8)
unamortized past service costs - - 0.5 0.7
unamortized net actuarial loss 502.9 461.3 4.1 3.6
Net asset (liability) 200.8 186.9 (12.9) (12.5)

36
VIA
RA
Il C
An
Ad
A /
se
Co
nd
Qu
AR
teR
Re
po
Rt
2012
/ n
ote
s to
th
e In
terI
m c
on
den
sed
FIn
an
cIa
l st
atem
ents
36
11. emPloyee beneFIts (cont’d) b) long-term employee benefit plAns
Based on these actuarial valuations and projections to june 30, the summary of the principal valuation results for the self-insured workers’ compensation benefits and other long-term employee benefits is as follows:
(in millions of dollars)June 30,
2012December
31, 2011
ACCrueD benefit obligAtion:
Balance at beginning of the period 22.2 20.9
Current service cost 2.6 5.0
Interest cost 0.4 1.0
Benefits paid (3.0) (6.6)
Actuarial losses - 1.9
Balance at end of the period 22.2 22.2
fAir vAlue of plAn Assets:
Balance at beginning of the period - -
employer contributions 3.0 6.6
Benefits paid (3.0) (6.6)
Balance at end of the period - -
Components of cost:
quarters ended June 30
six month periods ended June 30
(in millions of dollars) 2012 2011 2012 2011
Current service cost 1.3 1.3 2.6 2.6
Interest cost 0.2 0.3 0.4 0.6
Total cost 1.5 1.6 3.0 3.2
Amounts Recognized in the Statement of financial position:
(in millions of dollars)June 30,
2012December
31, 2011
Benefit obligation (22.2) (22.2)
Fair value of plan assets - -
Net liability (22.2) (22.2)

37
VIA
RA
Il C
An
Ad
A /
se
Co
nd
Qu
AR
teR
Re
po
Rt
2012
/ n
ote
s to
th
e In
terI
m c
on
den
sed
FIn
an
cIa
l st
atem
ents
37
C) summAry of pensions plAns, post-employment benefit plAns AnD long-term employee benefit plAns reCognizeD in the finAnCiAl stAtements
Total amounts recognized in the Statement of financial position:
(in millions of dollars)June 30,
2012December
31, 2011
Assets:
pension plans 200.8 186.9
Liabilities:
post-employment benefit plans (12.9) (12.5)
long-term employee benefit plans (22.2) (22.2)
network Restructuring obligation (0.7) (0.7)
Total (35.8) (35.4)
Total amounts recognized in the Statement of Operations and Comprehensive Income:
quarters ended June 30
six month periods ended June 30
(in millions of dollars) 2012 2011 2012 2011
pension plans 8.6 4.2 21.0 8.3
post employment Benefit plans 0.2 0.4 0.7 0.8
long-term employee benefit plans 1.5 1.6 3.0 3.2
Total 10.3 6.2 24.7 12.3
the total component of costs is presented in the Compensation and employee benefits line in the statement of operation and Comprehensive income. the cost for the network restructuring obligation is presented in the other expense line in the statement of operation and Comprehensive income.
38
VIA
RA
Il C
An
Ad
A /
se
Co
nd
Qu
AR
teR
Re
po
Rt
2012
/ n
ote
s to
th
e In
terI
m c
on
den
sed
FIn
an
cIa
l st
atem
ents
38
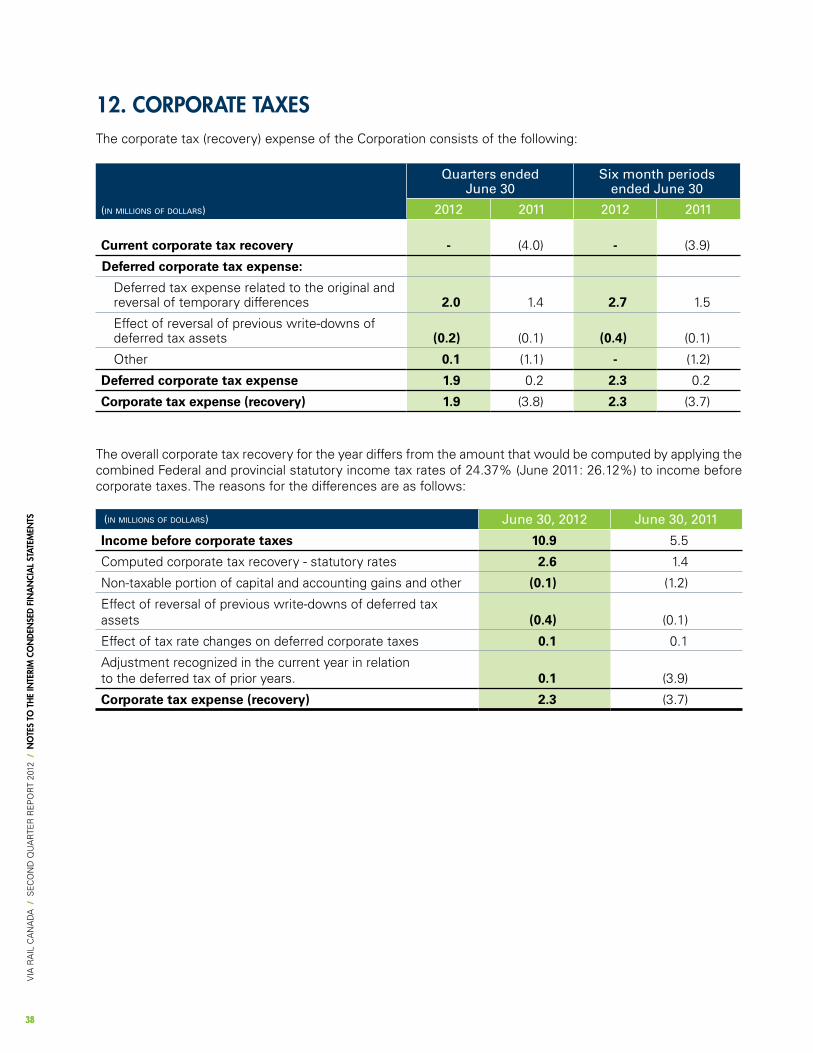
12. corPorate taXesthe corporate tax (recovery) expense of the Corporation consists of the following:
quarters ended June 30
six month periods ended June 30
(in millions of dollars) 2012 2011 2012 2011
Current corporate tax recovery - (4.0) - (3.9)
Deferred corporate tax expense:
deferred tax expense related to the original and reversal of temporary differences 2.0 1.4 2.7 1.5
effect of reversal of previous write-downs of deferred tax assets (0.2) (0.1) (0.4) (0.1)
other 0.1 (1.1) - (1.2)
Deferred corporate tax expense 1.9 0.2 2.3 0.2
Corporate tax expense (recovery) 1.9 (3.8) 2.3 (3.7)
the overall corporate tax recovery for the year differs from the amount that would be computed by applying the combined Federal and provincial statutory income tax rates of 24.37% (june 2011: 26.12%) to income before corporate taxes. the reasons for the differences are as follows:
(in millions of dollars) June 30, 2012 June 30, 2011
Income before corporate taxes 10.9 5.5
Computed corporate tax recovery - statutory rates 2.6 1.4
non-taxable portion of capital and accounting gains and other (0.1) (1.2)
effect of reversal of previous write-downs of deferred tax assets (0.4) (0.1)
effect of tax rate changes on deferred corporate taxes 0.1 0.1
Adjustment recognized in the current year in relation to the deferred tax of prior years. 0.1 (3.9)
Corporate tax expense (recovery) 2.3 (3.7)

39
VIA
RA
Il C
An
Ad
A /
se
Co
nd
Qu
AR
teR
Re
po
Rt
2012
/ n
ote
s to
th
e In
terI
m c
on
den
sed
FIn
an
cIa
l st
atem
ents
39
deferred corporate tax reflects the net tax effects of temporary differences between the carrying amounts of assets and liabilities for financial reporting purposes and the amounts used for income tax purposes.
significant components of the deferred corporate tax liabilities of the Corporation are as follows:
DeferreD tAx bAlAnCes - June 30, 2012
(in millions of dollars)
opening balance
recognized in net income
Closing balance
Deferred corporate tax liabilities:
Government assistance 1.5 (1.5) -
property, plant and equipment 21.6 0.8 22.4
Contingencies, other liabilities and net amounts 3.8 1.2 5.0
Accrued benefit liability 7.4 0.3 7.7
unrealized loss on derivative financial instruments (0.3) 0.7 0.4
Accrued Benefit Asset (44.4) (4.4) (48.8)
(10.4) (2.9) (13.3)
loss carry-forward 10.4 0.6 11.0
Deferred corporate tax liabilities - (2.3) (2.3)
the Corporation has $52.2 million (december 31, 2011: $50.3 million) of unused Quebec non-capital tax losses carried forward and expiring in 2029 and 2031.
unrecognized deductible temporary differences, unused tax losses and unused tax credits for which no deferred tax assets have been recognized are attributed to the following:
(in millions of dollars) June 30, 2012 31 décembre 2011
Federal:
Contingencies, other liabilities and net amounts 0.3 0.3
Quebec:
Government assistance - 7.0
property, plant and equipment 262.0 275.2
Accrued benefit liability 35.2 34.8
loss carry forward 52.2 50.3
unrealized loss on derivative financial instruments 2.0 -
Contingencies, other liabilities and net amounts 23.5 18.6
374.9 385.9

40
13. deFerred caPItal FundInGdeferred capital funding represents the unamortized portion of the funding used to purchase property, plant and equipment and intangible assets.
(in millions of dollars) June 30, 2012 December 31, 2011
Balance, beginning of the period 1,143.8 965.6
Government funding for property, plant and equipment and intangible assets (including the cost of land) 82.6 224.7
Amortization of deferred capital funding (29.4) (46.5)
Balance, end of the period 1,197.0 1,143.8
14. commItmentsAs at june 30, 2012, the Corporation has outstanding major contract commitments amounting to $ 43.9 million (december 31, 2011: $182.8 million) consisting mainly in maintenance and completion of rolling stock refurbishment and rail improvements projects. the Corporation expects to make payments under these commitments over the next 2 years.
In the first quarter of 2012 the Corporation decided to cancel some major contracts involving the refurbishment of rail passenger cars. these cancellations have caused a reduction in the amount of the commitments but the costs related to the required completion of these projects will have a financial impact on the Corporation.
15. FInancIal Instrumentsthe Corporation financial instruments are exposed to the same risk as disclose in its annual IFRs financial statements for the year ended december 31, 2011.
VIA
RA
Il C
An
Ad
A /
se
Co
nd
Qu
AR
teR
Re
po
Rt
2012
/ n
ote
s to
th
e In
terI
m c
on
den
sed
FIn
an
cIa
l st
atem
ents

41
16. derIvatIve FInancIal Instrumentsthe Corporation uses commodity or price swaps where it exchanges cash payments based on changes in the price of a commodity (i.e. heating oil) or a market index. the Corporation also enters into foreign exchange forward contracts to either buy or sell usd at a specified price and date in the future. these contracts are related to fuel swaps and a future capital project.
At the end of the period, the fair value of the derivative financial instruments is as follows:
Crude swap June 30, 2012 December 31, 2011
notional quantity (000’s of u.s.
gallons)
fair value CAD
(000’s)
notional quantity (000’s of u.s.
gallons)
fair value CAD
(000’s)
Assets 2,520 327 4,032 1,509
liabilities 14,364 2,842 9,324 1,173
As at june 30, 2012, the fuel swaps have a fixed price per u.s. gallon in usd between 1.957 and 3.149 and the maturity dates are 2012 to 2014. these financial instruments have a monthly settlement schedule.
foreign exchange contracts June 30, 2012 December 31, 2011
notional quantity (000’s of u.s.
gallons)
fair value CAD
(000’s)
notional quantity (000’s of u.s.
gallons)
fair value CAD
(000’s)
Assets 29,847 1,114 37,697 716
liabilities 29,587 638 - -
As at june, 2012, the forward contracts rates are between 0.954 and 1.042 for these forwards contracts in us dollars and the maturity dates are 2012 to 2014. these financial instruments have a monthly settlement schedule.
June 30, 2012 December 31, 2011
fair value CAD
(000’s)
fair value CAD
(000’s)
total assets 1,441 2,225
total liabilities 3,480 1,173
VIA
RA
Il C
An
Ad
A /
se
Co
nd
Qu
AR
teR
Re
po
Rt
2012
/ n
ote
s to
th
e In
terI
m c
on
den
sed
FIn
an
cIa
l st
atem
ents