sédimentation grand bassam exploration de mesures de
TRANSCRIPT

1 White Paper on Vulnerability of Coral Reef Protected Coastlines in a Changing Environment
Sédimentation Grand Bassam
Exploration de mesures de mitigation -
Rapport -
Authors: Dano Roelvink Unesco-IHE
Cilia Swinkels Deltares
Robert Hasselaar Deltares
Marten Hillen RoyalHaskoningDHV

2 White Paper on Vulnerability of Coral Reef Protected Coastlines in a Changing Environment

3 White Paper on Vulnerability of Coral Reef Protected Coastlines in a Changing Environment
Figure 1: Aerial photo channel Grand-Bassam (1989)
1 Introduction
1.1 Problem statement At the city of Grand-Bassam (Côte d’Ivoire) there is currently no sustainable connection between the Ébrié lagoon and the Atlantic Ocean. This results in an increased risk of flooding during high river discharges and has had a negative impact on the water quality in the region. Potential economic development in the tourism and fishery sector cannot develop due to lack of this connection with the ocean.
Several attempts to open this access channel were
conducted in the last decades (see Figure 1). The
channel connecting Grand-Bassam (Côte d’Ivoire)
with the Atlantic Ocean silted on all of these
occasions. Longshore sediment transport is seen as
the main reason for this sedimentation. In this note
engineering measures are explored and presented
to connect the channel at Grand-Bassam with the
Atlantic Ocean.
Royal HaskoningDHV was asked to draft conceptual designs for connecting the lagoon with the ocean.
Other potential measures to address the challenges
at Grand-Bassam were not evaluated and are
outside the scope of this memo.
1.2 Approach The research institute Deltares developed a set of numerical models to evaluate the hydrodynamics of
the Ébrié lagoon and the coastal and lagoon dynamics around Grand-Bassam. The model outcomes and
further insight in the systems dynamics from literature served as input for Haskoning to define a number
of conceptual engineering measures to open the access channel at Grand Bassam. The measures were
evaluated in an engineering expert meeting regarding three criteria:
1. effectiveness in local conditions
2. technical complexity for implementation
3. expected construction, operation and maintenance costs.
Based on these criteria, four alternatives were selected, which were subsequently assessed with the
Deltares morphodynamic model for a dry season scenario. From the model results, the morphological

4 White Paper on Vulnerability of Coral Reef Protected Coastlines in a Changing Environment
development of the inlet for the different alternatives is computed and conclusions are drawn on the
preferred alternative based on its effectiveness in maintaining Grand Bassam inlet open.
1.3 Structure du rapport Après l'Introduction, dans Chapitre 2 nous donnons une brève description du système de l'embouchure
de Grand Bassam connectant le système lagunaire et fluvial avec l'Océan.
En Chapitre 3 nous présentons les mesures conceptuelles avec leurs avantages et inconvénients et leurs
aspects pratiques.
Chapter 4 presents the model evaluation of the proposed alternatives.

5 White Paper on Vulnerability of Coral Reef Protected Coastlines in a Changing Environment
2 Description du système
2.1 Marée
La marée est caractérisée par un régime micro-tidale. Elle est semi-diurne avec une inégalité diurne. Le
marnage est entre 1.1 m à vive eau et 0.4 m à morte eau.
Dans la vaste et peu profonde Lagune d'Ebrié la marée est réduite beaucoup et ne surpasse pas
quelques décimètres près de Grand Bassam.
2.2 River discharges
Three main rivers discharge into the Ebrié estuary: the Mé, Agneby and Comoé. The Agneby and the Mé
are rivers with an equatorial runoff regime. The wet season falls in the months June to August, when the
average discharge of both rivers is approximately 50 m3/s. The average discharge in the dry season is
12.5 m3/s. The Comoé is a river with a tropical regime that drains part of the southern Sahel region. The
wet season falls in the months September to November with an average wet season discharge of 550
m3/s. Historically, wet season run off rates were much higher, with average peak discharges upto 1100
m3/s. A significant decrease in wet season runoff was observed over the last decades, which is
presumably related to a drier period in the Sahel since the 1970’s. It is not quite clear whether this is a

6 White Paper on Vulnerability of Coral Reef Protected Coastlines in a Changing Environment
continuous trend or caused by a decadal climate oscillation; climate projections for the region show no
consensus on this matter.
2.3 Wave climate

7 White Paper on Vulnerability of Coral Reef Protected Coastlines in a Changing Environment
The wave climate off the Ivorian coast is characterized by long swells coming from the south to
southwest sector. These swells originate in the Southern Atlantic Ocean and travel 1000’s of kilometres
before hitting the coast of Northern Africa. Locally, sea breezes generate smaller, shorter period wind
waves that are superimposed on the swell wave climate.
Most waves arrive from the south to southwest sector, with average wave directions typically between
160 and 220°N. The highest waves occur between May and August, with a mean significant wave height
upto 2m and mean peak wave period between 10 and 14 s. In the months September to November, the
wave climate is characterized by slightly lower wave heights and more southerly wave directions.
The wave roses presented in Figure xx are based on 30 year of hindcast data (1979 to 2009) from the
NOAA WaveWatch III model. The roses clearly illustrate the long period dominated wave climate and
the narrow directional sector from which wave energy approaches the Ivorian coastline.

8 White Paper on Vulnerability of Coral Reef Protected Coastlines in a Changing Environment
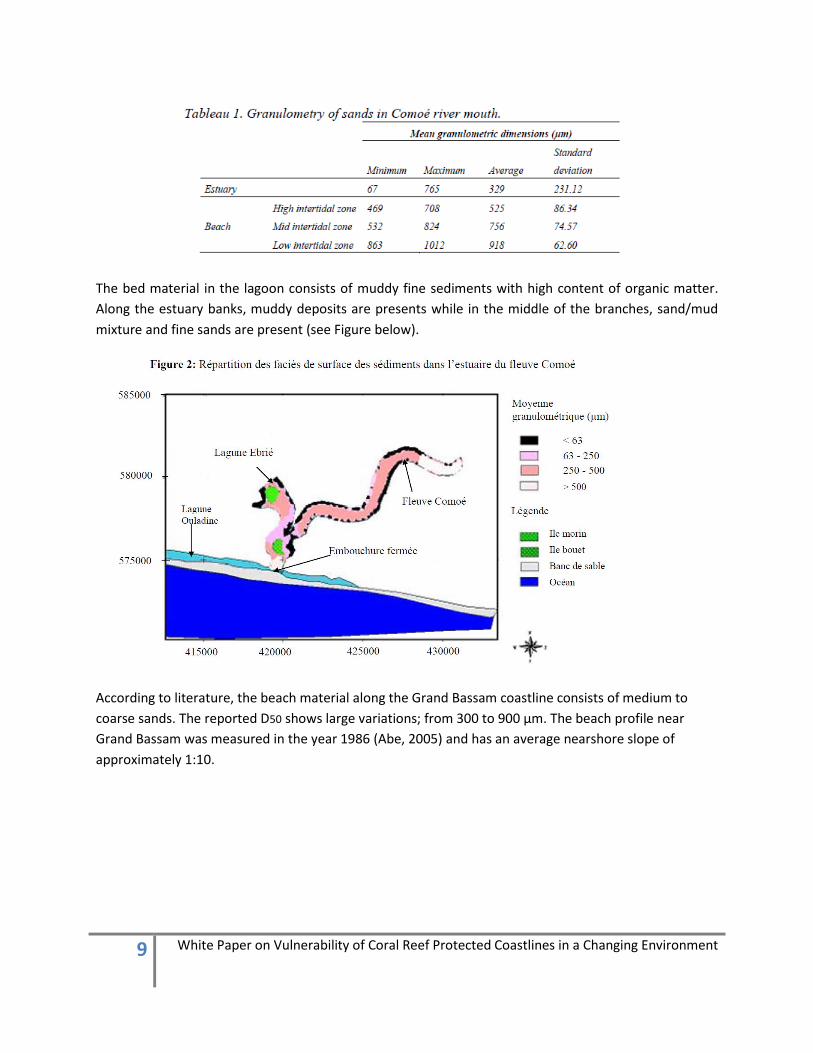
2.4 Sediment characteristics and littoral transport According to Laurent et al (1996), in the Comoe river mouth, the grain size increases from the high
intertidal zone (525 μm on average) to the low intertidal zone (918 μm on average), see table below.
Sign
. wav
e h
eigh
t (m
) P
eak
wav
e p
erio
d (
s)
Mea
n w
ave
dir
ecti
on
(°N
)
9 White Paper on Vulnerability of Coral Reef Protected Coastlines in a Changing Environment
The bed material in the lagoon consists of muddy fine sediments with high content of organic matter.
Along the estuary banks, muddy deposits are presents while in the middle of the branches, sand/mud
mixture and fine sands are present (see Figure below).
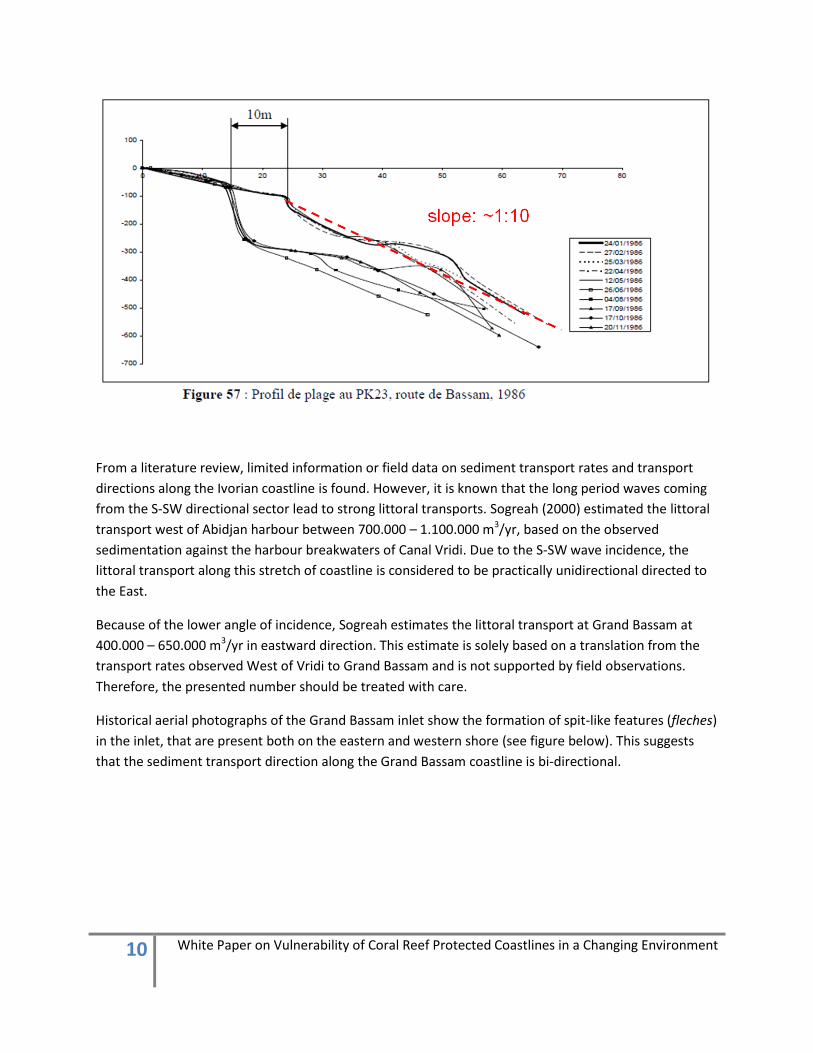
According to literature, the beach material along the Grand Bassam coastline consists of medium to
coarse sands. The reported D50 shows large variations; from 300 to 900 μm. The beach profile near
Grand Bassam was measured in the year 1986 (Abe, 2005) and has an average nearshore slope of
approximately 1:10.
10 White Paper on Vulnerability of Coral Reef Protected Coastlines in a Changing Environment
From a literature review, limited information or field data on sediment transport rates and transport
directions along the Ivorian coastline is found. However, it is known that the long period waves coming
from the S-SW directional sector lead to strong littoral transports. Sogreah (2000) estimated the littoral
transport west of Abidjan harbour between 700.000 – 1.100.000 m3/yr, based on the observed
sedimentation against the harbour breakwaters of Canal Vridi. Due to the S-SW wave incidence, the
littoral transport along this stretch of coastline is considered to be practically unidirectional directed to
the East.
Because of the lower angle of incidence, Sogreah estimates the littoral transport at Grand Bassam at
400.000 – 650.000 m3/yr in eastward direction. This estimate is solely based on a translation from the
transport rates observed West of Vridi to Grand Bassam and is not supported by field observations.
Therefore, the presented number should be treated with care.
Historical aerial photographs of the Grand Bassam inlet show the formation of spit-like features (fleches)
in the inlet, that are present both on the eastern and western shore (see figure below). This suggests
that the sediment transport direction along the Grand Bassam coastline is bi-directional.

11 White Paper on Vulnerability of Coral Reef Protected Coastlines in a Changing Environment
2.5 Grand Bassam Inlet
In the past, several attempts have been done to re-open the Grand Bassam inlet. However, le débit en
saison sèche de la Comoé est de 5 m3/s contre 550 m3/s en saison des pluies et en saison sèche le flot
devient insuffisant pour ouvrir l’embouchure. La fermeture de l’embouchure est inéluctable sans
aménagement.
The below table presents a brief overview of the historic (artificial) openings of the Grand Bassam Inlet
and associated estimates of dredged volumes.
Historique des ouvertures et observations (Lombardo, 2010):
1987 : chenal 820 x 40 x 4. Dragage de 105 000 m3 à 130 M CFA.
spit formation
Photo aérienne 1989 – courtoisie BNETD/CCT
12 White Paper on Vulnerability of Coral Reef Protected Coastlines in a Changing Environment
Ouverte de Sept 87 à Août 89 (23 mois). Largeur passée à 150 m le 5.10.87
1992 : Chenal de 890 m, dragage de 250 000 m3 à 220 M. CFA . (7 mois d’ouverture)
1997 : Percement d'un nouveau chenal, colmaté la même année
1998 : Nouveau chenal entretenu jusqu’en 1999 par le Port d’Abidjan
2001 : demi chenal avec bouchon de 60 m formant un verrou de 1,5 m de large
2009 : forte sédimentation par l’Océan (de plus de 3 m) en 5 mois dans le chenal sur
toute sa longueur, représentant 80 000 m3 de dépôts
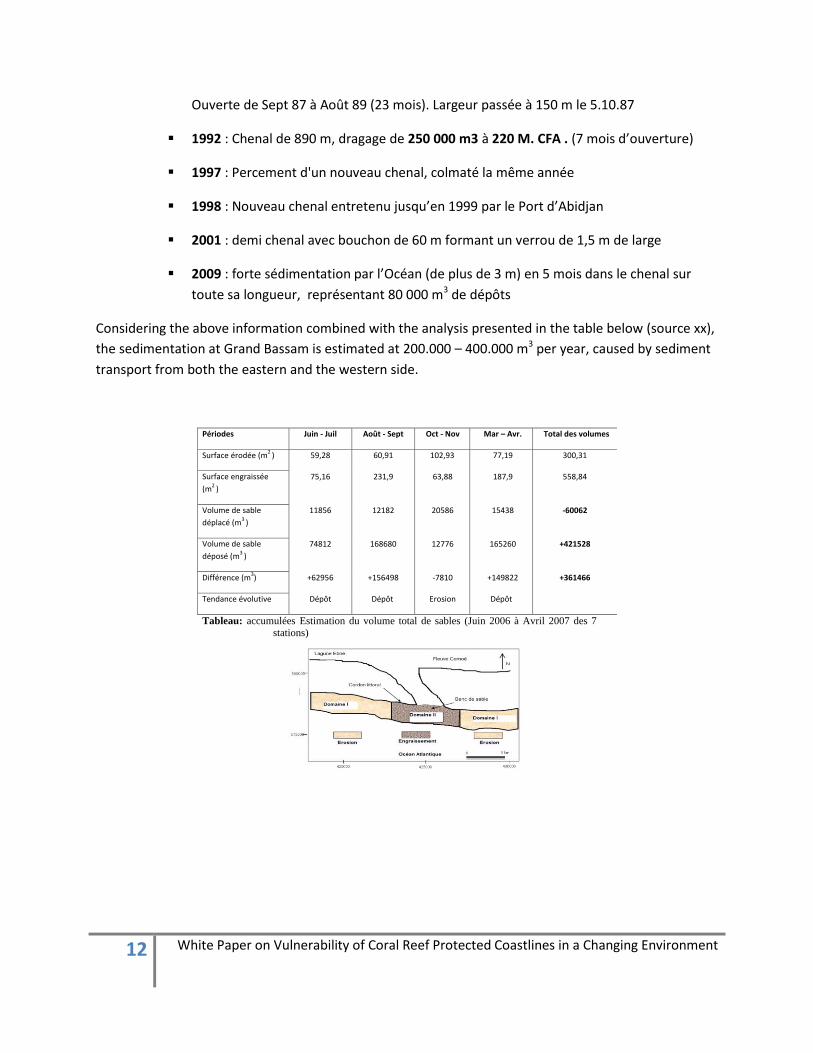
Considering the above information combined with the analysis presented in the table below (source xx),
the sedimentation at Grand Bassam is estimated at 200.000 – 400.000 m3 per year, caused by sediment
transport from both the eastern and the western side.
Périodes Juin - Juil Août - Sept Oct - Nov Mar – Avr. Total des volumes
Surface érodée (m2
) 59,28 60,91 102,93 77,19 300,31
Surface engraissée
(m2
)
75,16 231,9 63,88 187,9 558,84
Volume de sable
déplacé (m3
)
11856 12182 20586 15438 -60062
Volume de sable
déposé (m3
)
74812 168680 12776 165260 +421528
Différence (m3) +62956 +156498 -7810 +149822 +361466
Tendance évolutive Dépôt Dépôt Erosion Dépôt
Tableau: accumulées Estimation du volume total de sables (Juin 2006 à Avril 2007 des 7
stations)

13 White Paper on Vulnerability of Coral Reef Protected Coastlines in a Changing Environment
3 Mesures conceptuelles
This reconnaissance study evaluates several concepts based on previous model studies, limited data on
the hydraulic boundary conditions and historic attempts to connect the Ébrié lagoon and the Atlantic
Ocean via a(n) (access) channel. In drafting these conceptual designs the following basic assumptions
are made:
The longshore sediment transport is mainly caused by swell from the Atlantic Ocean;
The net sediment transport direction is in Eastern direction;
Due to the dynamic environment at Grand-Bassam, both Westward and Eastward sediment
transport are significant;
Tide (and the basin size) and river flow are considered too small to keep the access channel
open in the current situation;
The bridge land inward from the opening does not allow for (large) dredging equipment;
therefore this equipment can only enter Grand Bassam from the ocean side.
Before evaluating the outcomes of modelling the different alternatives, the following a priori
assessment can be made:
0. Create an opening before every rain season
Flooding due to high river flows can be solved fairly
straightforward. A small channel can be dug before a
flood arrives and the water will widen the small
channel itself. This work could be done by a few
bulldozers. Water quality will then improve for a
short period until the opening is filled again with
sand due to longshore sediment transport. This work
could be done with local equipment.
Pros:
Minimal costs
Low impact on coastal profile
Work can be done with local equipment
Local straightforward implementation.
Cons:

14 White Paper on Vulnerability of Coral Reef Protected Coastlines in a Changing Environment
Not effective all year, does not answer the
water quality challenge (additional measures
may be required)
Opening only for a short period during the
year
500 m
Annual dredging
1. Annual dredging (only)
In this solution the channel is dredged annually. No
additional engineering measures are constructed.
Based on the sedimentation numbers from the
Sogreah reports (2000), it is estimated that 200,000
to 400,000 m3 will have to be dredged annually. As
the net longshore sediment transport (from West to
East), the dredged material should be deposited
along the coast East from the channel. In this way
additional erosion of the coastline is prevented.
Initial re-opening of the channel should probably be
executed by a larger dredging vessel such as a (small)
cutter suction dredger. This work will take a few
weeks to a few months, depending on the size and
type of equipment.
Maintenance dredging could be performed with a
hopper dredger, if there is sufficient channel depth;
otherwise, a backhoe or cutter dredger is necessary.
Pros:
low investments costs
leeside erosion problems limited
Straightforward construction method
Maintenance dredging expected to be most
suitable for capacity building of contractors
in Cote d’Ivoire
As this is a ‘soft’ engineering measure, it
allows for an adaptive sedimentation policy
Cons:
channel stability very low, channel likely to
migrate
high maintenance dredging costs
required dredging frequency for maintaining
the channel. The amount of dredging will
strongly depend on yearly wave and current

15 White Paper on Vulnerability of Coral Reef Protected Coastlines in a Changing Environment
conditions
Keeping the required depth of the channel
appropriate for shipping will require
intensive maintenance.
2. Groynes
With this solution groynes combined with bank
protections are proposed to block the longshore
sediment transport. The groynes will have to be
protected with large blocks (for instance acropods) to
resist wave attack (comparable to Canal de Vridi; see
figure 2). Engineering has to be optimized during
feasibility study and detailed design phase.
To stabilize the channel’s location (parallel to the
coast), bank protections are constructed. Due to the
construction of the groynes, sediment will
accumulate west of the groynes. East from the
channel the coast will erode. Sand by-passing will be
required to prevent erosion of the coast east of the
channel. Furthermore, maintenance dredging in the
channel is required as physical model studies
(Sogreah, 2000) show significant sedimentation in the
channel.
The Eastern groyne is required to prevent westward
sediment transport. Whether or not this groyne is
required is yet unknown at this stage. Hydrodynamic
modelling could clarify this.
Initial re-opening of the channel can be executed
with a small cutter dredger or a backhoe. The groyne
and bank protections can be constructed with land
based equipment. A cutter dredger or backhoe is
required for by-passing of sand. Dredging of the
access channel will take weeks to a couple of months
depending on weather conditions. Construction of
the groynes requires detailed design to be conducted
during a feasibility study and construction can take
up to 6 months, depending on wave conditions (and

16 White Paper on Vulnerability of Coral Reef Protected Coastlines in a Changing Environment
down time of equipment).
Pros:
less frequent dredging and therefore lower
maintenance costs
channel width/depth can be optimized for
shipping and in and outflow of the
backwaters;
Cons:
high investment costs
leeside erosion (sand by-passing necessary)
cutter dredger or backhoe needed for by-
passing of sand.
500 m
Groyne Sand trap
Bank protections
Maintenance dredging
3. Off-shore groyne with sand trap
With this solution an off-shore groyne is constructed
west of the channel to reduce the wave-induced
sediment transport. Groyne design likely requires
large acropods and or block protection to prevent
erosion due to wave attack (Hs: 1.5m, Tp: 12.5s).
Sedimentation in a (man-made) sand trap (pit) will
occur and prevent sedimentation of the channel. The
sand trap can be emptied with a hopper dredger.
Sand by-passing will be required to prevent erosion
of the coast east of the channel.
Again bank protections are constructed to prevent
movement of the channel (parallel to the coast).
Initial re-opening of the channel can be executed
with a small cutter dredger or a backhoe. The groyne
has to be constructed with waterborne equipment.
The bank protections can be made with landbased
equipment. A hopper dredger can by-pass sand. This
work will take a few months to a year, depending on
the type of equipment and the time available for
construction (down time). Due to the use of
waterborne equipment the downtime of this option
will be larger than option 2 (groynes).

17 White Paper on Vulnerability of Coral Reef Protected Coastlines in a Changing Environment
Pros:
channel width/depth can be optimized for
shipping and in and outflow of the
backwaters;
less frequent dredging and therefore lower
maintenance costs
sand trap can be emptied by hopper dredger
(similar equipment as is applied for dredging
the port of Abidjan) and by-passed.
limited influence on coastline
Cons:
Feasibility of this option is uncertain due to
the highly dynamic sediment transport
conditions and because Westward sediment
transport is not blocked in this conceptual
design.
high(er) investment costs;
leeside erosion (sand by-passing necessary)
Among the options which were also considered were;
Permanent dredging installation: an installation which permanently dredges material from the
proposed channel location. Unpredictable sediment dynamics require high-end engineering to
set up this proposed measures. Furthermore, operating and maintaining this type of installation
is costly and will require well trained staff.
Pipe line: A pipe line can connect water of the Atlantic Ocean with that of Grand-Bassam. It
could solve the water quality issue, but does not allow for shipping and does not solve flooding.
This option only partly solves the problem and for large quantities of water it will be a costly
solution.

18 White Paper on Vulnerability of Coral Reef Protected Coastlines in a Changing Environment
4 Mise en place des modèles et résultats
4.1 Approche
A set of hydrodynamic models is developed for the present study, which are used to assess the different
alternatives for Grand Bassam. In a first step, a D-Flow Flexible Mesh (FM) model is set up to study the
detailed hydrodynamics of the lagoon system. The recently developed D-Flow FM software allows for
very flexible 2D gridding, making it possible to construct a detailed mesh that captures the full
characteristics of the lagoon system. This is especially suitable for the complex geometry of Lagune Ebrié
with its several tidal branches, islands and double inlet configuration.
As D-Flow FM does not yet allow for the modelling of waves and morphology, in a second step, a
Delft3D model is set up. The model grid in this case does not capture the full detail of the lagoon, but is
set up in such a way that it reproduces the main characteristics of the system (tidal storage capacity and
distribution of discharges between the two inlets). The hydrodynamic results of the Delft3D model are
validated against the detailed results of the D-Flow FM model.
Subsequently, wave processes, sediment transport and morphological updating are included in the
validated Delft3D model. This fully morphodynamic model is used to study the morphodynamic
evolution of Grand Bassam Inlet in detail and ultimately to assess the proposed measures to maintain
the inlet open. The modelling approach is schematically shown in the chart below.
Modèle Flexible Mesh (FM)
Lagune de Ebrié hydrodynamique
(en detail)
Modèle Delft3D
Hydrodynamique
(moins résolution en lagune,
plus de détail en embouchure),
validation contre résultats FM
Processus de propagation et dissipation des ondes
Transports de Sédiment
Changements Morphologiques
Évaluation des alternatives

19 White Paper on Vulnerability of Coral Reef Protected Coastlines in a Changing Environment
4.2 Modèle FM
Model grid
The detailed FM model is set up with two objectives:
1. To reproduce the tidal propagation through the lagoon system
2. To investigate the inlet hydrodynamics at Canal Vridi and Grand Bassam and
reproduce the distribution of tidal discharges over the two inlets
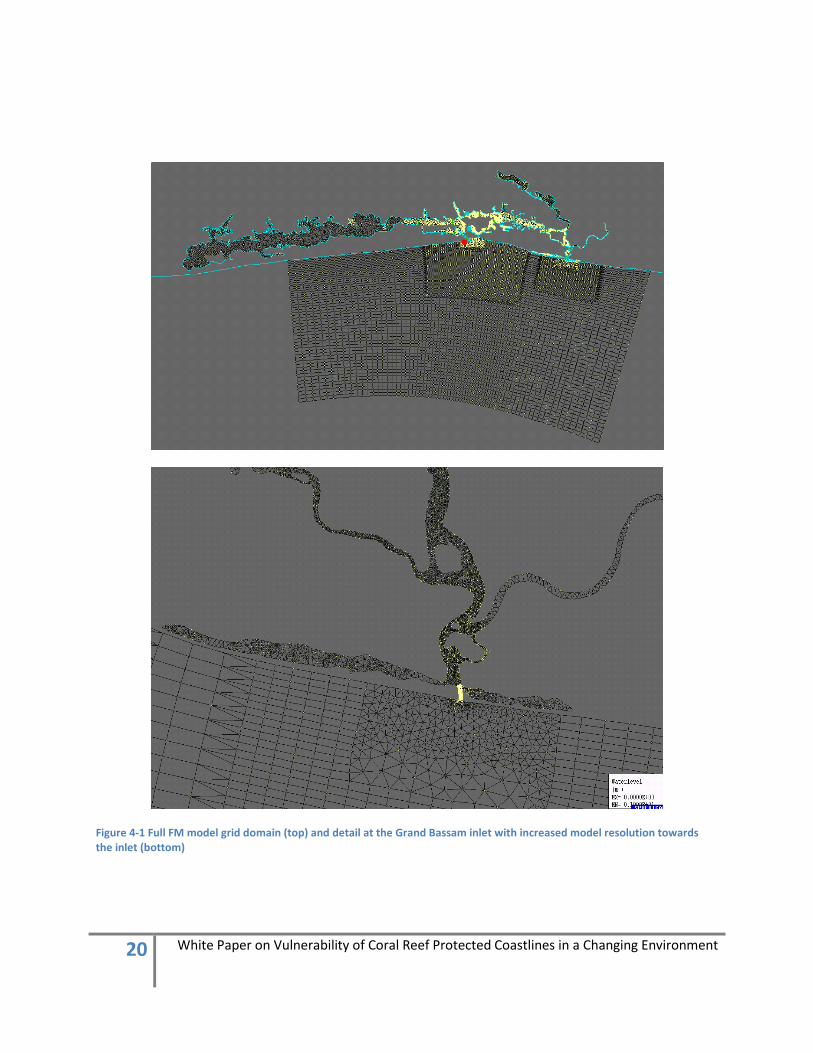
To achieve this, a FM model grid is set up with highest resolution in the two inlet regions to model the
local hydrodynamics with sufficient detail, and coarser resolution offshore and inside the lagoon
branches to resolve the tidal storage capacity of the lagoon (see Figure 4-1).
Model bathymetry
The model bathymetry is constructed from the following data sources (in order of usage):
1. Depth survey conducted by IHE (region Grand Bassam, survey date xx-xx-2012,
see Figure 4-2)
2. Admiralty Chart 3103 – Port d’Abidjan (1:10 000)
3. Admiralty Chart 3101 – Outer approaches to Port d’Abidjan (1:100 000)
4. Admiralty Chart 3100 – Sassandra to Lagune Aby (1:350 000)
5. Bathymetry as presented in Sogreah (2000)
6. Nearshore zone: Dean profile up to -20m MSL
It should be noted that only the survey conducted by IHE consists of detailed and recent information; all
other sources are either coarse in resolution or typically based on surveys that were carried out before
1990.
By lack of survey data, assumptions have to be made on the dimensions on the Grand Bassam inlet. In
literature, an average width of the channel of about 150m and average depth of about 3.5m are
reported for the historic natural situation. These dimensions are therefore adopted in the model.
Boundary conditions
The offshore sea boundaries are forced with tidal constituents derived from the Topex-Poseidon 7.2
Global Inverse Tide model. Initially, no river discharges are incorporated in the model. In the ultimate
scenarios to evaluate the different alternatives, the run off of the rivers Agneby, Mé and Comoé are
included in the model as total discharge imposed on the upstream boundaries.
20 White Paper on Vulnerability of Coral Reef Protected Coastlines in a Changing Environment
Modèle détaillé LaguneEbrié
Objectif: reproduir propagation de marée dans la lagune rechercher l’hydrodynamiquedes embouchures de Vridi et
Grand Bassam
Figure 4-1 Full FM model grid domain (top) and detail at the Grand Bassam inlet with increased model resolution towards the inlet (bottom)

21 White Paper on Vulnerability of Coral Reef Protected Coastlines in a Changing Environment
Figure 4-2 Measured bathymetry around Grand Bassam (IHE, 2012)
Model validation
There is limited data available for validation of the model results levels. The only observed water level
time series was found for the period 1982 to 1988 at Abidjan – Canal Vridi, downloaded from xx.
Furthermore, at the Port of Abidjan, the IHO constituents presented in Table 4-1 are known.
Figure 4-3 shows a comparison between the observed, predicted and modelled tidal water level at Canal
Vridi. The three time series show good resemblance in main characteristics, such as the spring-neap
cycle, diurnal inequality and tidal amplitude. In the model, no meteorological effects or river runoff was
incorporated, which can explain (part of) the difference between the observed water levels and the
model results. Qualitatively, the comparison shows that the tidal reproduction of the model from the
offshore boundary to the entrance of the lagoon is adequate.
Constituent Amplitude (m) Phase (°)
K1 0.095 343.5
O1 0.014 321.4
P1 0.032 343.5
Q1 0.006 126.0
M2 0.286 139.9
S2 0.126 168.6
N2 0.073 134.5
K2 0.034 168.6 Table 4-1 IHO Observed tidal constants - Port of Abidjan

22 White Paper on Vulnerability of Coral Reef Protected Coastlines in a Changing Environment
Figure 4-3 Comparison of predicted, observed and modeled tidal water levels at Canal Vridi (top) and between predicted (IHO) and modeled water levels (bottom)
To further validate the tidal propagation (tidal damping, phase shift) from the lagoon entrances towards
the inland lagoon limits, information presented in Varlet (1978) is used. Varlet presents the tidal
characteristics of the lagoon as the relation between the offshore tidal range near Canal Vridi and the
tidal range at several locations inside the lagoon, as well as the phase shift in timing of High Water (HW)
and Low Water (LW) between the offshore and inshore locations. This information is partly based on
observations but largely empirically determined and should therefore be considered with caution. This
information is presented in Figure 4-4.

23 White Paper on Vulnerability of Coral Reef Protected Coastlines in a Changing Environment
From the Figure, it is found that the model matches the tidal damping of the system, as presented by
Varlet, very well. Regarding phase shift of the high and low waters, there is a larger discrepancy
between the model and the information presented by Varlet. However, Varlet mentions that the tidal
retard is more difficult to determine than the tidal damping with the empirical method he uses, so this
comparison has a lower significance.
Overall, it is concluded that the FM model represents the tidal propagation through Lagune Ebrié
sufficiently accurate for the present exploratory modelling study. However, it is noted that the
validation is based on limited data only and the model results therefore contain large uncertainty. If the
model is to be used for more detailed studies in the near future, this aspect may have to be addressed
again.
Figure 4-4 Comparison between ‘observed’ (dashed line, based on Varlet) and modeled (solid line) tidal water levels at several locations in Lagoon Ebrié, expressed as ratio between offshore tidal range and local tidal range (left), and in phase lag between offshore location and local station (mid and right). The colors of the lines match with the locations indicated in the top figure, whilst the offshore location is indicated by the black dot.

24 White Paper on Vulnerability of Coral Reef Protected Coastlines in a Changing Environment
Hydrodynamic results
Even though the tidal range dampens quickly away from the entrances of the lagoon, a large tidal
volume passes the two inlets. The discharge through Grand Bassam inlet is found to be around 500-700
m3/s at spring tides (wet season, run off of Comoé is 550 m3/s). This is nearly 10% of the discharge
passing Canal Vridi (~4000-5000 m3/s) because of the much smaller cross-sectional area of the Grand
Bassam inlet (see Figure 4-5). By reducing the cross-sectional area of Grand Bassam inlet, which would
naturally occur during siltation of the inlet, the discharge through Grand Bassam rapidly reduces to 0
m3/s. Very high flow velocities are observed in both inlets, with peak velocities during spring tides
ranging up to 1.5 to 2 m/s (see Figure 4-6).
Figure 4-7 illustrates the flow velocities in Grand Bassam inlet over a spring-neap cycle, both for a wet
season scenario (discharge Comoé = 550 m3/s) and a dry season scenario (discharge Comoé = 5 m3/s).
The large difference between the ebb currents and flood currents in the wet season is clearly visible in
this graph; it is this asymmetry that is considered to be responsible for scouring the inlet open during
the wet season. The tidal asymmetry is less pronounced in the dry season, which can explain the
sedimentation that mainly occurs during this period.
Figure 4-5 Instantaneous discharges through Canal Vridi (top) and Grand Bassam inlet (bottom) for different opening scenarios of Grand Bassam inlet.
Grand Bassam fully open
Grand Bassam 2/3 open
Grand Bassam 1/3 open
Grand Bassam closed
Grand Bassam fully open
Grand Bassam 2/3 open
Grand Bassam 1/3 open
Grand Bassam closed

25 White Paper on Vulnerability of Coral Reef Protected Coastlines in a Changing Environment
Figure 4-6 Flow velocities around Grand Bassam inlet at a moment of maximum ebb currents during a spring tide, wet season, Grand Bassam fully open.
Figure 4-7 Modelled flow velocities in Grand Bassam inlet for a spring-neap cycle. Wet season (blue) and dry season (red)
ebb flood

26 White Paper on Vulnerability of Coral Reef Protected Coastlines in a Changing Environment
4.3 Modèle Delft3D-FLOW
The less detailed Delft3D model is set up with the objective:
1. To reproduce the tidal dynamics of the lagoon system schematically
2. To investigate the inlet morphodynamics around Grand Bassam in detail
The model incorporates wave processes, sediment transport and ultimately bed updating to assess the
different proposed measures to keep Grand Bassam inlet open.
Model setup
For the above purpose, a model grid is constructed with large detail around Grand Bassam (see Figure
4-8). The local grid resolution near the inlet is in the order of 5m to resolve the cross-section of the inlet
and the surf zone dynamics adequately. In the offshore sea area and inside the lagoon, the resolution
quickly coarsens in order to reduce computational times. The inlet of Canal Vridi is also incorporated in
the computational grid in order to let the model resolve the distribution of the tidal volumes and river
discharges over the two inlets.
The model bathymetry is again derived from the sources as presented for the FM model. The tidal
boundary conditions are extracted from the FM model.
Hydrodynamic model validation
The Delft3D model results are validated against the FM results under the assumption that the FM model
is sufficiently accurate for the study purpose. In Figure 4-9, the modeled tidal water levels at several
stations are compared between the two models. It is found that, after tuning of the bottom roughness
and surface area of certain lagoon branches in the Delft3D model, the qualitative performance of the
Delft3D model is adequate compared to the FM model.
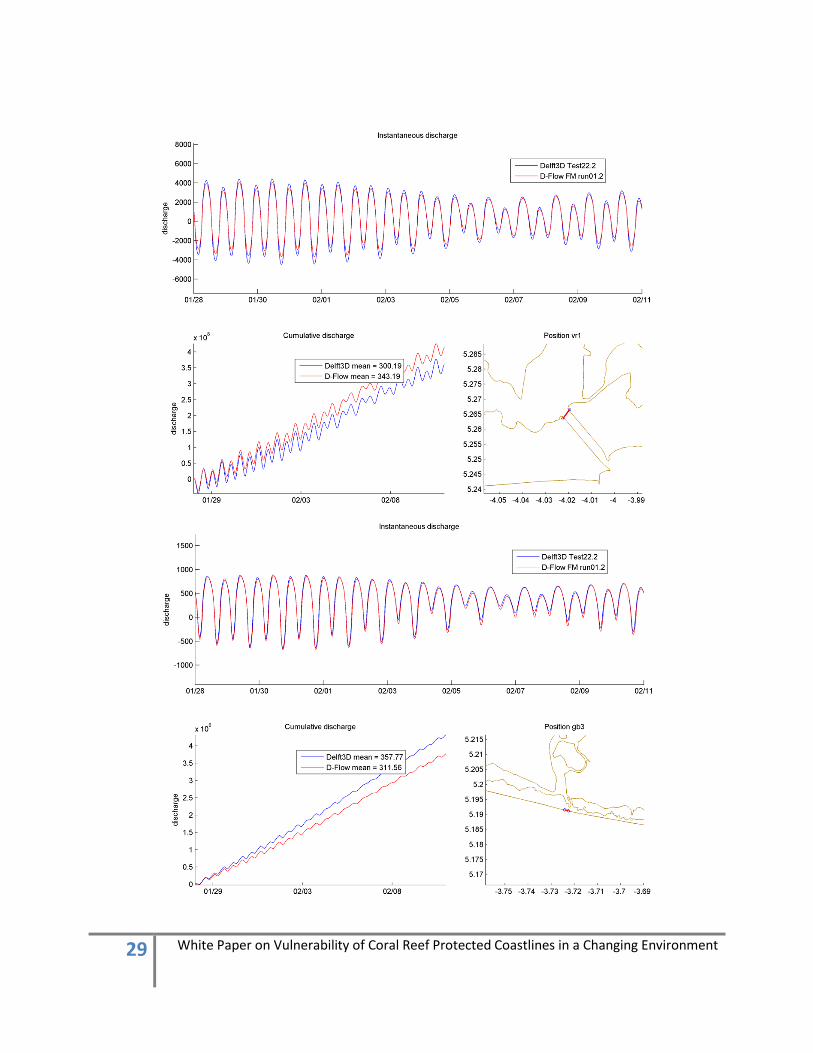
A further comparison of the tidal discharges is made in order to investigate whether the Delft3D model
reproduces the distribution of the tidal volume and river runoff over the two inlets comparable to the
FM model. Figure 4-10 presents the results for a wet season scenario with a Comoé river runoff of 550
m3/s. The discharge distribution over the two inlets is nearly similar, although Delft3d predicts slightly
higher dischages at Grand Bassam and lower discharges at Canal Vridi than the FM model. However,
taking into account the large model uncertainties in tidal ranges inside the system and tidal storage
volumes, this difference is considered to be acceptable.
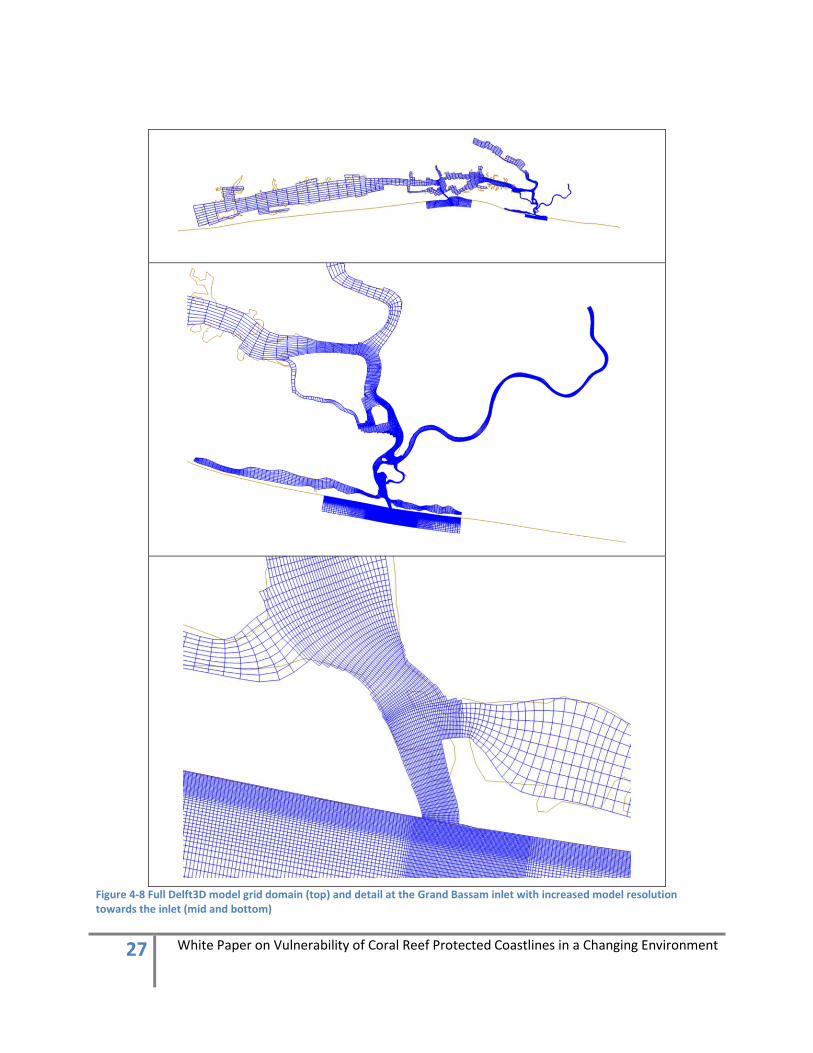
27 White Paper on Vulnerability of Coral Reef Protected Coastlines in a Changing Environment
Figure 4-8 Full Delft3D model grid domain (top) and detail at the Grand Bassam inlet with increased model resolution towards the inlet (mid and bottom)

28 White Paper on Vulnerability of Coral Reef Protected Coastlines in a Changing Environment
Figure 4-9 Comparison between modeled water levels of FM model (red) and Delft3D model (blue), for 4 stations in the Lagune Ebrie.
29 White Paper on Vulnerability of Coral Reef Protected Coastlines in a Changing Environment

30 White Paper on Vulnerability of Coral Reef Protected Coastlines in a Changing Environment
Figure 4-10 Comparison between modeled discharges of FM model (red) and Delft3D model (blue) for Canal Vridi (top) and Grand Bassam inlet (bottom).
4.4 Modèle Delft3D-WAVE
A dedicated wave model is setup in order to transform the offshore wave data (NOAA data, presented in
Figure xx Chapter 2) to nearshore. Figure 4-11 presents the wave model grid and bathymetry. A higher
resolution nested wave grid is set up around Grand Bassam (shown in blue). The offshore wave
boundary is chosen such that it coincides with the NOAA data location 4 30.00'N, 4 30.00'W, where
wave timeseries are available for the period 1979-2009.
The offshore wave climate is schematized into four representative conditions, which are derived based
on a classification on wave directions. Table 4-1 presents the four conditions and their yearly percentage
of occurrence. Although the wave heights are comparable for the four conditions, the peak wave period
increases from the southeasterly condition (1) to the southwesterly condition (4); this is related to the
longer swell waves that predominantly arrive from the S-SW sector, whereas the S-SE sector also
contains more locally generated wind waves. The coast normal at Grand Bassam is 190°N, which implies
that conditions 1 and 2 will lead to westward directed transports for about 30% of time. Conditions 3
and 4 will generate eastward directed transports for about 70% of time.
Figure 4-12 shows an example of the computed wave heights and wave directions for condition 4. From
the wave height field, wave refraction over the Trou sans Fond is clearly visible, leading to a localized
sheltered area and increased wave heights further East.
There is no nearshore wave data available to validate the wave model results, therefore the model
setup and performance is accepted as is for the present study.
Table 4-2 Schematized wave climate
Condition Hs (m) Tp (s) Dir (°N) % Occurence
1 1.5 10 167 16
2 1.7 12 183 14
3 1.6 13 199 45
4 1.6 14 209 25

31 White Paper on Vulnerability of Coral Reef Protected Coastlines in a Changing Environment
Figure 4-11 Wave model grid and bathymetry. The blue grid shows the nested high resolution wave grid around Grand Bassam.
Figure 4-12 Example computed wave height field with directions (white arrows) for condition 4
NOAA data •

32 White Paper on Vulnerability of Coral Reef Protected Coastlines in a Changing Environment
4.5 Modèle D3D de transport
As explained in Paragraph 2.4, the Ivorian coastal zone is characterized by strong wave-driven sediment
transports. This littoral transport is considered to be responsible for the closure of Grand Bassam inlet.
To model the wave-driven sediment transports processes, a coupled flow-wave-sediment model is
developed, which incorporates both tidal and wave-driven currents, as well as the interaction between
the two processes. The objective of the model is to investigate the sediment transports in the Grand
Bassam littoral region and inlet.
Model settings
The D50 considered in the model is 500μm, but the large uncertainty range associated with the sediment
size (see Paragraph 2.4) should be kept in mind. The transport rates are computed with the Van Rijn
(1993) formulation. As wave boundary conditions, the four representative conditions as presented in
the previous paragraph are considered.
Transport results
First of all, the transports west of Canal Vridi are investigated in Figure 4-13. From the natural observed
sedimentation against the harbour moles, the average longshore transport rate was estimated at a net
eastward directed transport in the order of 700.000 to 1.100.000 m3/year (Sogreah, 2000).
The modelled weighted average yearly transport rates (Figure 4-13) show strongly unidirectional
transports between 850.000 and 1.100.000 m3/year. These rates are derived by computing the
integrated transports over the transects over a full tidal cycle for the four individual wave conditions,
which are scaled to annual rates and summed taking into account the individual percentage of
occurrence. The computed transports match the Sogreah estimates very well.
Figure 4-13 Computed longshore sediment transport rates in 103 m
3/yr west of Canal Vridi based on the schematized wave
climate. Blue arrows indicate the gross annual westward transport, red arrows the gross annual eastward transport and black arrows the net annual transport.

33 White Paper on Vulnerability of Coral Reef Protected Coastlines in a Changing Environment
Sogreah also estimated the littoral transport rates near Grand Bassam from the sedimentation against
the harbour moles by taking into account the difference in coastline orientation between the Canal Vridi
and Grand Bassam areas. The annual transports were estimated between 400.000 – 650.000 m3/yr in
eastward direction. However, these numbers are not supported by any field observations and are in this
study therefore merely considered as guideline. From the observed time to close after previous artificial
openings of the inlet and known dredging figures (Paragraph 2.5), we expect that the Sogreah estimates
are on the high end. We estimate deposition rates in the order of 200.000 to 400.000 m3/yr in the inlet
and longshore transports of the same order of magnitude.
Figure 4-14 presents the model results near Grand Bassam inlet. The gross eastward directed transport
is in the order of 200.000 to 300.000 m3/yr, whereas the gross westward directed transport is in the
order of 100.000 m3/yr. The net resulting transport is therefore around 100.000 m3/yr. The deposition in
Grand Bassam inlet is fed by the gross longshore transports from both directions, which totals to around
300.000 m3/yr. This figure matches the expected deposition rates well.
The predicted transport rates contain large uncertainty by lack of proper field data to calibrate or
validate the model. However, from the validation of the transports West of Vridi, we conclude that the
model is sufficiently adequate to reproduce the general littoral transport processes in the region.
Figure 4-14 Computed longshore sediment transport rates in 103 m
3/yr near Grand Bassam based on the schematized wave
climate. Blue arrows indicate the gross annual westward transport, red arrows the gross annual eastward transport and black arrows the net annual transport.

34 White Paper on Vulnerability of Coral Reef Protected Coastlines in a Changing Environment
4.6 Modèle morphologique D3D
Approche de modélisation
To investigate the morphological development of Grand Bassam inlet, a full morphodynamic model is
constructed, including tides, wave processes, sediment transports and bed updating. This model is
ultimately used in Chapter 5 to assess the proposed measures to maintain the inlet open.
The aim of the model is to predict the morphological development of the inlet over a period of 1 year.
As sedimentation of the inlet takes place mainly during the dry season, we reduce the simulation to the
8 months period from December to July (low Comoé discharge) and neglect the wet season, during
which reopening of the inlet is expected. It is not feasible to simulate a full period of 8 months due to
computational times, therefore a number of reduction techniques are used to reduce the computational
effort:
1. A full spring-neap tidal cycle is reduced into a representative tide, which is commonly taken as
1.1 times the mean tidal range. In this case, a representative tidal range of 0.65 m is derived.
2. A schematized wave climate of 4 representative conditions is considered, in which the full wave
climate is classified based on wave directions.
3. A significant further computational efficiency increase is obtained by simulating the separate
wave conditions in parallel but simultaneously upscaling and coupling the modeled bathymetry
at each flow time step. This so-called MorMerge-approach allows for relatively high MorFac
upscaling factors (see bullet 4 below) as the updated bathymetry is the weighted net result of all
wave conditions. Figure 4-15 presents a schematic overview of the MorMerge approach and
Roelvink (2006) describes the details of this technique.
4. To further speed up the simulation, a morphological scale factor (Morfac) of 30 is used. At each
time step, the computed bed level change is multiplied by this factor. By carrying out a
simulation of 8 days, a full dry season (8 x 30 days = 8 months) of morphological development is
obtained in this manner. The use of a Morfac is justified by the discrepancy in hydrodynamic and
morphological time scales (flow responds in matter of seconds to minutes, whereas bed levels
changes take place in the order of days to weeks).
Boundary conditions
In the model, river discharges representative for the dry season are included (Comoé = 5 m3/s, Agneby /
Mé = 25 m3/s) and the representative tide with tidal range of 0.65m is applied. The four considered
wave conditions are slightly different than those presented in Paragraph 4.4 and are representative for
the dry season period only (Table 4-3).

35 White Paper on Vulnerability of Coral Reef Protected Coastlines in a Changing Environment
Figure 4-15 Flow diagram of the morphodynamic MorMerge-approach (Roelvink, 2006).
Other model settings
Dans le simulation de base, un chenal initial est dragué avec largeur de 120 m, longueur de environ 500
m, profondeur de 3.5 m. Le sédiment a un diamètre median de 500μm et les profiles de plage, par
manque de données, suivent un profil théoretique de Dean.
Après un nombre de simulations de calibration les résultats réalistes ont été obtenus où les profils de
plage restent plus ou moins sur place sauf un léger engraissement en haut de plage. No data to further
calibrate or validate the morphodynamic model.
Table 4-3 Schematized wave climate
Condition Hs (m) Tp (s) Dir (°N) % Occurence
1 1.5 10 173 25
2 1.6 13 194 25
3 1.6 13 202 25
4 1.5 14 208 25

36 White Paper on Vulnerability of Coral Reef Protected Coastlines in a Changing Environment
5 Simulation des alternatives
With the full morphodynamic model as presented in Paragraph 4.6, the morphological development
over a full dry season is evaluated for the base situation and for the 3 alternatives presented in Chapter
3:
1. Base situation
2. Continuous dredging of inlet
3. Two groynes
4. Detached groyne and sand pit
5.1 Alternative 0: Simulation de base
Dans les figures ci-dessous nous montrons d'abord la bathymétrie initiale pour le situation de base; dans
le milieu la bathymétrie finale et en bas la distribution de l'érosion (en bleu) et de l'engraissement (en
rouge), après la saison sèche qui dure 8 mois.
Our la simulation de base, qui simule le dragage d'un chenal initial sans autres mesures, un
engraissement rapide est observé, menant à une fermeture complète ou presque complète dans une
saison sèche. Dans les animations de l'évolution temporelle on voit clairement la propagation de bancs
de sable initiés à l'embouchure vers l'intérieur, aux deux cotés du chenal. À cause de la dominance
légere de vagues de l'Ouest l'engraissement dans l'embouchure est le plus fort au coté Ouest; le chenal
est diminué graduellement et poussé contre le bord Est du chenal, avant d'être complètement fermé.
En général la simulation a l'air réaliste, comme ont confirmé les scientifiques Ivoiriens du Comité
Interministériel. L'évolution, la forme et les dimensions des bancs de sable sont très similaires à ceux
observées dans des images aériennes et satellites.
Clairement visible dans le panneau en bas est la forte érosion des côtes aux deux cotés de l'embouchure
et la formation d'un delta de jusant. Cette érosion côtière a souvent été observé après des ouvertures
artificielles et forme un aspecte important dans l'évaluation des alternatives.

37 White Paper on Vulnerability of Coral Reef Protected Coastlines in a Changing Environment
Figure 5-1 Bathymétrie initiale (haut), bathymétrie finale (mileiu) et érosion/deposition (bas) arès une saison sèche. Simulation de base.
5.2 Alternative 1: Dragage continu
Dans les simulations avec dragage continu on prescrit une profondeur minimum; si la profondeur
devient moins de ça le module de dragage enlève automatiquement le volume de trop et l'ajoute au

38 White Paper on Vulnerability of Coral Reef Protected Coastlines in a Changing Environment
volume cumulatif de dragage. Nous avons fait trois simulations: une avec dragage dans l'intérieur de
l'embouchure (voir Figure 5-2), une avec dragage dans la partie extérieure de l'embouchure (voir Figure
5-3) et une avec dragage dans l'embouchure entière.
Dans le cas de dragage de la partie intérieure (Figure 5-2) l'effet est de juste laisser ouvert le chenal,
mais avec un engraissement de l'embouchure important et une forte érosion du bord Est et des plages
aux deux cotés. Cette érosion pourrait être évité par placement du sable dragué sur les plages en
érosion, mais ça donnerait un gène quasi-continu sur ces plages et mènerait probablement à une hausse
de l'ensablement de l'embouchure et du volume de dragage.
Le dragage dans la partie extérieure (Figure 5-3) laisse ouverte et à profondeur toute l'embouchure mais
aussi mène à une forte érosion des plages aux deux cotés.
Dans Figure 5-4 l'évolution du volume cumulatif de dragage est montré pour les trois alternatives de
dragage. Clairement, dragage de la partie intérieure est associé avec des volumes les moins importants,
mais encore jusqu'à 200.000 m3dans une saison sèche; dans les autres alternatives ça monte jusqu'à
500.000 m3. Il faut admettre que ce sont des volumes importants qui ne peuvent pas être déplacé par
une modeste opération locale mais qui doivent être dragué par gros équipement spécialisé.

39 White Paper on Vulnerability of Coral Reef Protected Coastlines in a Changing Environment
Figure 5-2 Bathymétrie initiale (haut), bathymétrie finale (mileiu) et érosion/deposition (bas) arès une saison sèche. Simulation de dragage continu, interieur.

40 White Paper on Vulnerability of Coral Reef Protected Coastlines in a Changing Environment
Figure 5-3 Bathymétrie initiale (haut), bathymétrie finale (mileiu) et érosion/deposition (bas) arès une saison sèche. Simulation de dragage continu, extérieur.

41 White Paper on Vulnerability of Coral Reef Protected Coastlines in a Changing Environment
Figure 5-4 Évolution du volume de dragage cumulatif dans la saison sèche.

42 White Paper on Vulnerability of Coral Reef Protected Coastlines in a Changing Environment
5.3 Alternative 2: Épis avec dragage d'aménagement
Dans cette option l'ensablement de l'embouchure et réduit par l'emplacement de deux épis qui
bloquent le transport littoral et séparent les courants de marée et le courant littoral. L'effet de cet
arrangement est montré en Figure 5-5. In est clair qu'à la fin de la saison sèche le chenal est encore bien
ouvert. À l'extérieur des épis un delta de jusant se forme à cause d'unes sédimentation importante, mais
reste encore bien sous la surface de l'eau. La question à répondre est en combien de temps le banc de
sable se développera en manière de bloquer l'entrée. Probablement ça prendra plusieurs années, par ce
que après une croissance rapide même à la fin de la première saison sèche on voit déjà des processus de
'bypass' s'installer sur le delta de jusant. À la plage Est l'érosion est modéré et pourrait bien être
prévenu par un placement de sable venant du dragage du chenal initial.

43 White Paper on Vulnerability of Coral Reef Protected Coastlines in a Changing Environment
Figure 5-5 Bathymétrie initiale (haut), bathymétrie finale (mileiu) et érosion/deposition (bas) arès une saison sèche. Simulation de deux épis.

44 White Paper on Vulnerability of Coral Reef Protected Coastlines in a Changing Environment
5.4 Alternative 3: Brise-lames avec piège de sable
La simulation montré dans la Figure 5-6 ne donne pas une image optimiste sur l'efficacité de cette
solution. Clairement, à cause de la nature bidirectionnelle du climat d'houles à cette location le
transport venant de l'Est est encore capable d'ensable presque complètement l'embouchure. La piège
de sable est très vite rempli et ne prévient pas l'ensablement. À la plage Est il y a une érosion
importante

45 White Paper on Vulnerability of Coral Reef Protected Coastlines in a Changing Environment
Figure 5-6 Bathymétrie initiale (haut), bathymétrie finale (mileiu) et érosion/deposition (bas) après une saison sèche. Simulation avec brise-lames et piège de sable

46 White Paper on Vulnerability of Coral Reef Protected Coastlines in a Changing Environment
6 Evaluation des alternatives
6.1 Critères Pour arriver à une option préférée à base de ces simulations nous avons considéré les critères suivants:
1. L'embouchure devra rester bien ouverte après une saison sèche
2. Si dragage est nécessaire pendant la saison sèche, les volumes impliqués ne doivent pas
dépasser 50.000 à 100.000 m3, afin qu'une opération locale, assez simple, puisse l'opérer.
3. L'érosion des plages devra êtres limitée afin qu'il ne soit pas nécessaire de supplémenter
plusieurs fois par an ou de façon permanente
4. La solution choisie doit être robuste et donner la confiance qu'elle va fonctionner même après
une tempête, même si une opération de dragage tombe en panne pendant une période ou si le
modèle s'a trompé un peu.
Nous considérons ces critères comme primordiales: la question posée est quel option est viable en
principe; d'autres considération viennent après (coût, effets secondaires)
6.2 Evaluation contre les critères
Nous avons évalué les options contre ces critères; évidemment l'alternative de base ne fonctionne pas,
comme elle a montré dans le passé récent. Dragage seulement nécessite d'interférer pendant la saison
sèche, c'est à dire plusieurs fois par an, en volumes considérables. L'alternative avec le brise-lames ne
fonctionne pas sur plusieurs points et est très expérimentale. Clairement, la solution avec deux épis est
la seule qui nous donne assez confiance de mener à une embouchure ouverte pérenne, même s'il sera
nécessaire d'aménager la sédimentation de l'entrée et l'érosion de la plage de Mondoukou.
Critère
Alternative
1
Rester ouverte
2
Dragage pendant
saison sèche
3
Érosion des plages
4
Robuste
0 - base - - -- --
1 - dragage +/- -- -- -
2 - épis ++ ++ +/- +

47 White Paper on Vulnerability of Coral Reef Protected Coastlines in a Changing Environment
3 - brise-lame - +/- - -
6.3 Coûts globales des alternatives
RoyalHaskoningDHV
7 Conclusions
Une série de modèles numériques a été construit, calibré et validé de façon qualitative, afin de
reproduire la propagation des marées et les courants de marée et fluviales dans tout le système
lagunaire, afin de pouvoir modéliser correctement les débits et courants dans l'embouchure de Grand
Bassam, en fonction du degré d'ouverture de la bouche. Cela a mené à un modèle hydrodynamique et
morphodynamique assez détaillé pour évaluer de différentes options d'ouverture de l'embouchure. Ce
modèle rend compte des processus des marées, débits fluviales, propagation des ondes, courant littoral,
transport de sédiment et le changement de la morphologie. Le comportement de ce modèle a été validé
de façon qualitative contre le comportement observé après plusieurs ouvertures artificielles dans le
passé récent.
À part d'une simulation de base, trois options principales ont été évalué: dragage fréquent du chenal;
deux épis avec dragage d'entretien moins fréquent, et un brise-lame avec piège de sable. À base d'un
nombre de critères de viabilité, la solution avec deux épis a été choisie comme seule option à détailler
dans une prochaine phase d'une étude de faisabilité.
Les résultats de l'étude décrite ici ont été présenté par Prof. Dano Roelvink de l'UNESCO-IHE au Comité
Scientifique Ivoirien sur l'ouverture de Grand Bassam, qui a supporté les résultats comme assez réaliste
et qui a confirmé le choix pour la solution avec deux épis.
8 Termes de Référence d'une étude de faisabilité
8.1 Modélisation détaillée et probabiliste de l‘option choisie
8.1.1 Validation de la performance du modèle
8.1.2 Prévision de développement moyenne sur plusieurs années
Dimensionnement de l’ouvrage

48 White Paper on Vulnerability of Coral Reef Protected Coastlines in a Changing Environment
Fréquence et ampleur de dragage
Interventions pour l’atténuation de l’érosion
8.1.3 Variations saisonnières et interannuelles
8.1.4 Effet de conditions extrêmes
8.1.5 Étude de stabilité de l’ouvrage
8.1.6 Évaluation des effets hydrauliques et morphologiques du projet
8.2 Étude de l'impact environnemental et social
8.2.1 Collection de données sur la situation présente
8.2.2 Estimation des paramètres possiblement impactés
8.2.3 Modélisation des paramètres et validation pour la situation existante
8.2.4 Simulation des impactes des mesures proposées
Développement autonome
Alternative de préférence
Alternative le plus adapté à l’environnement
Alternative le plus économique
8.2.5 Analyse des impactes socio-economiques
Plages
Inondations
Pêche
Port de plaisance
Développement touristique
Enjeux
Faune et flore
Patrimoine culturelle

49 White Paper on Vulnerability of Coral Reef Protected Coastlines in a Changing Environment
Valeur marchande des terrains et des bâtiments
8.2.6 Analyse et avis sur les impactes
8.3 Estimation de coûts initiaux et récurrents
8.4 Préparation de plans détaillés
8.4.1 Proposition d’un plan d’aménagement de la zone d’étude.
8.4.2 Préparation de plans de construction des structures
8.4.3 Préparation d’un plan de gestion des sédiments côtières
8.5 Formation de capacité en exécution de suivis
8.5.1 Suivis bathymétriques en fonction du comportement du chenal
8.5.2 Courantométrie
8.5.3 Salinité, concentration, température
8.5.4 Qualité d’eau
8.5.5 Écologie
8.5.6 Dynamique de la population
8.6 Préparation de documents d'appel d'offre
9 Littérature
Roelvink, J. A. (2006). "Coastal morphodynamic evolution techniques." Coastal Engineering 53(2–3): 277-
287.