scottmcleod.net (click on workshops) dangerouslyirrelevant.org
TRANSCRIPT

scottmcleod.net(click on Workshops)
dangerouslyirrelevant.org

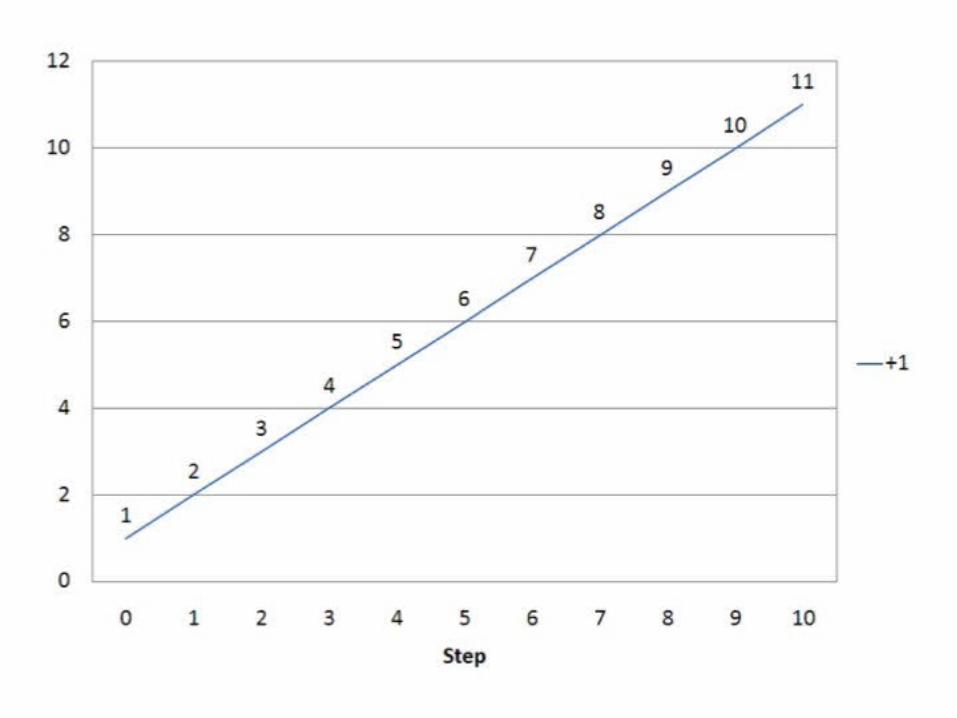


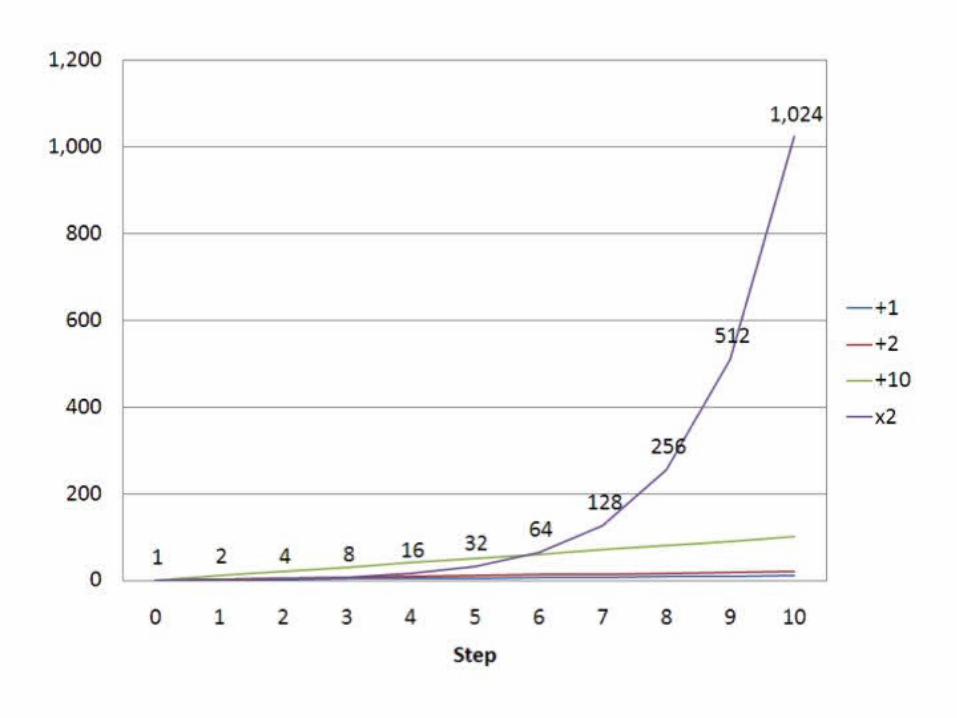

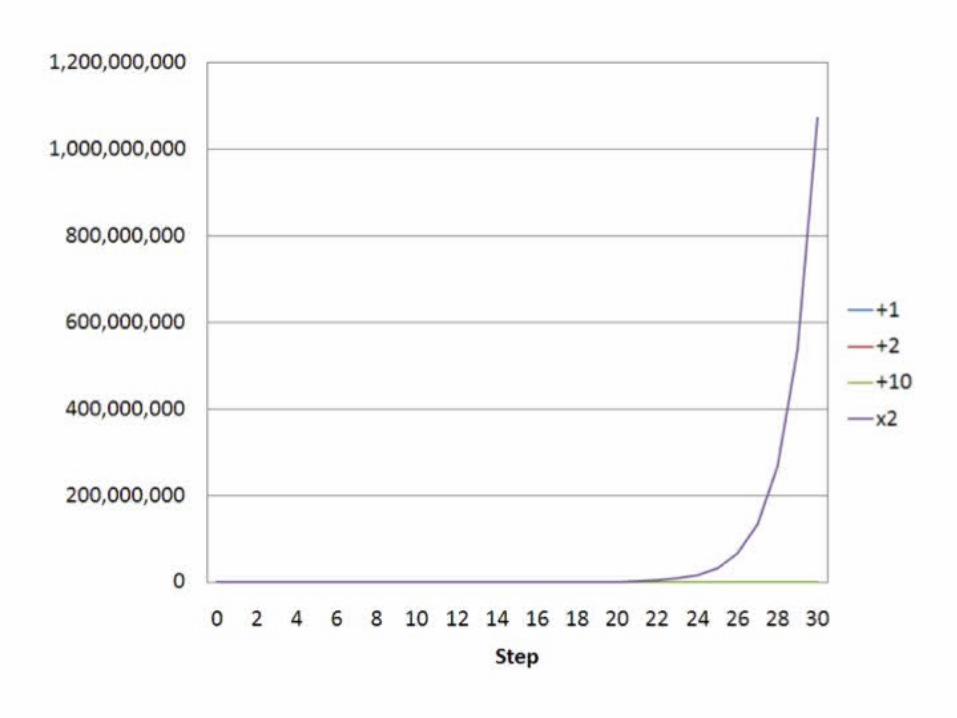
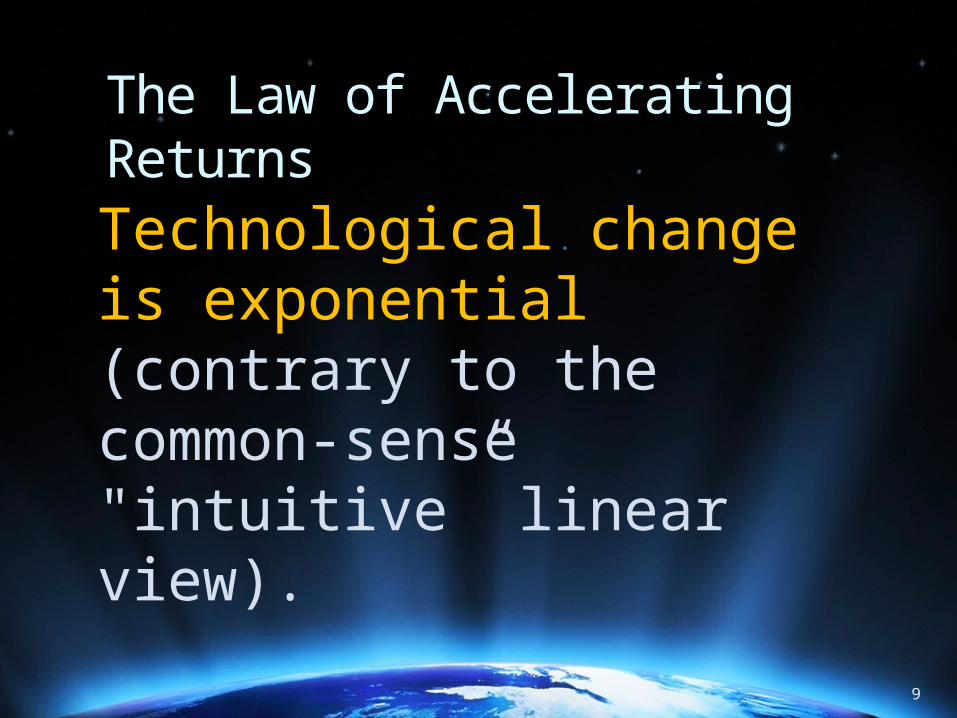
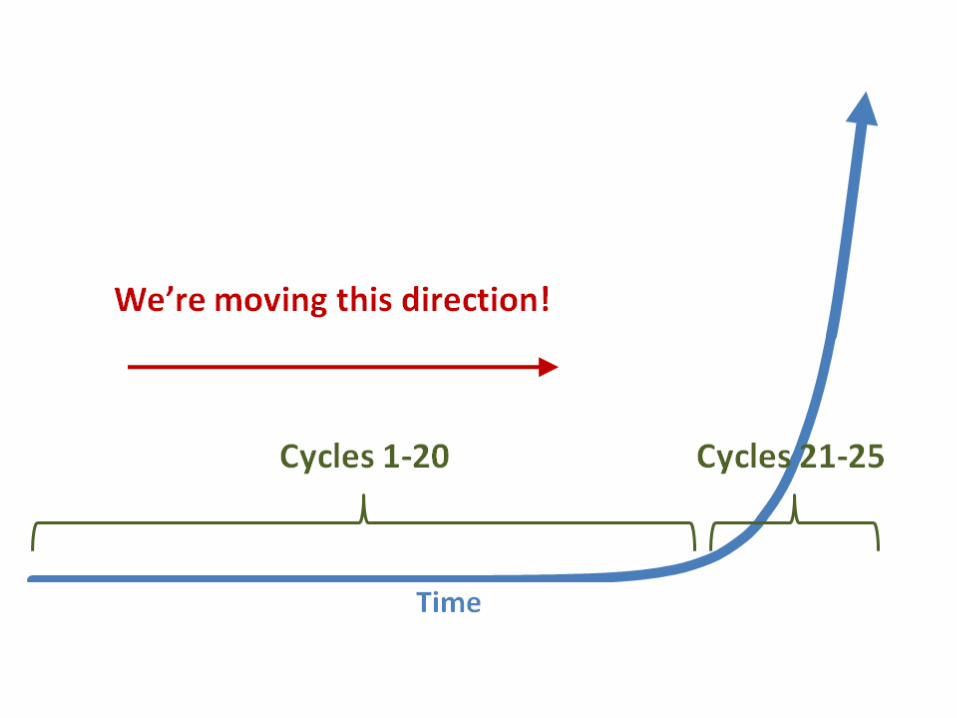
The Law of Accelerating Returns
Technological change is exponential (contrary to the common-sense "intuitive” linear view).
9

Internet Hosts(computers or machines with IP
addresses)
Year
Host
s
`
Linear Plot
Internet Hosts(computers or machines with IP
addresses)
Year
H
osts
Logarithmic Plot
10

1E+09
1E+16
VP2600/10SX-3/44
CM-5/1024Num. Wind Tun.
Num. Wind Tun.SR2201/1024
CP-PACS/2048ASCI Red
ASCI RedASCI WhiteASCI White
Earth SimulatorSX-8
Blue Gene /L
Blue Gene /L
Blue Gene /LBlue Gene /L
Roadrunner
Pleiades,Blue Waters, or RIKEN (announced)
First Exaflop Super-computer (forecast)
Year
Flo
ps
(Fl
oa
tin
g-p
oin
t O
pe
rati
on
s p
er
Se
con
d)
Growth in Supercomputer Power
40048008
8080 8086286
386486
PentiumPentium II
Pentium IIIPentium 4 (1700)
Pentium 4 (3066)Pentium D 830
Core 2 Extreme QX6700
C2E QX9770
Processor Performance (MIPS)
Year
`
Doubling time: x years
MIPS
Logarithmic Plot
Logarithmic Plot
1970 1980 1990 2000 2010
400480088080
8086
286386
486 DXPentium
Pentium IIPentium III
Pentium 4
Itanium 2 Itanium 2 (2003)
Itanium 2 (2004)Xeon MPDual-Core Itanium 2
Itanium 'Tukwila'
Transistors Per Chip (Intel processors)
YearTran
sist
ors
per
ch
ip
Logarithmic Plot
11

Random Access Memory Bits per Dollar (1950-2008)
Year
Bit
s per
Dolla
r(i
n y
ear
2000 d
olla
rs)
`
Doubling time: x years
Logarithmic Plot
12
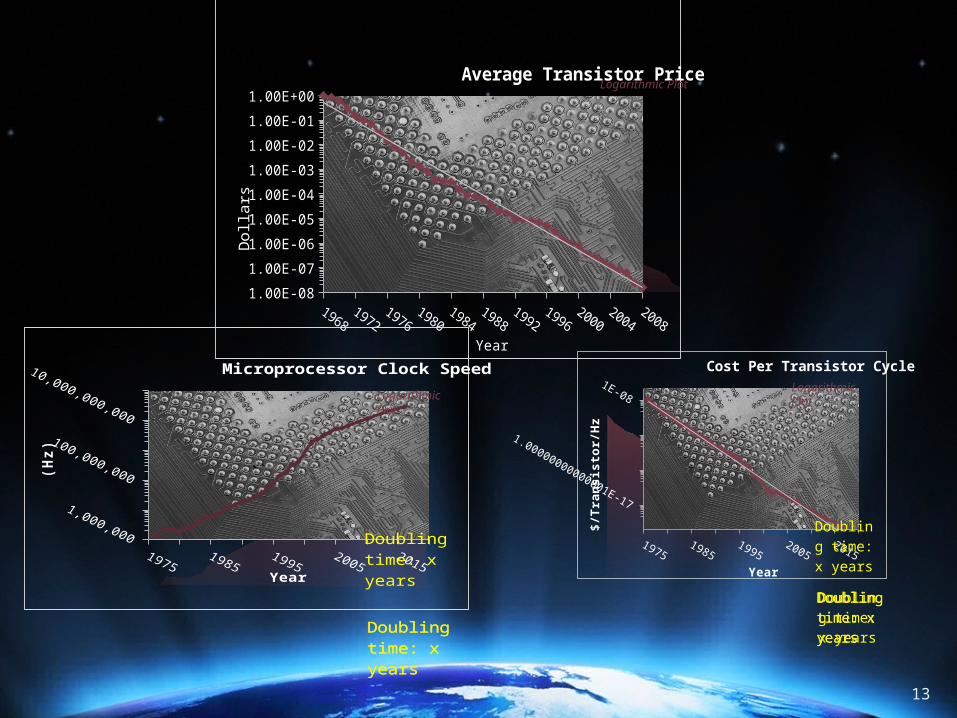
Cost Per Transistor Cycle
Year $
/Tra
nsis
tor/
Hz
Doubling time: x years
Doubling time: x years
Doubling time: x years
Doubling time: x years
1.00E-08
1.00E-07
1.00E-06
1.00E-05
1.00E-04
1.00E-03
1.00E-02
1.00E-01
1.00E+00
Average Transistor Price
Year
Dol
lars
Logarithmic Plot
Microprocessor Clock Speed
Year
(H
z)
`
Doubling time: x years
`
Doubling time: x years
`
Doubling time: x years
Logarithmic Plot
Logarithmic Plot
13

Magnetic Data Storage Bits Per Dollar
Year
Bit
s/$
Logarithmic Plot
14

Total Bits Shipped
Year
Total Bits Shipped
Source: ITRS
`
`
Doubling time: x years
`
Doubling time: x years
Logarithmic Plot
15

1990 1992 1994 1996 1998 2000 2002 2004 2006 20080
0
1
10
100
1,000
10,000
100,000
Internet Data Traffic (U.S.)
Year
Peta
byte
s/Ye
ar
.1
.01
Logarithmic Plot
16

1990 1992 1994 1996 1998 2000 2002 20041
10
100
1,000
10,000
100,000
Price-performance of wireless data devices
YearB
its p
er
seco
nd/$
19651970
19751980
19851990
19952000
20052010
1E+04
1E+06
1E+08
1E+10
Internet Backbone Bandwidth (Bits per Second)
Year
Bit
s p
er
Se
co
nd
Logarithmic Plot
Logarithmic Plot
17
INFORMATION TECHNOLOGIES (OF ALL KINDS)
DOUBLE THEIR POWER ABOUT (PRICE PERFORMANCE, CAPACITY, BANDWIDTH)
EVERY YEAR
18
100
1,000
10,000
100,000
1,000,000
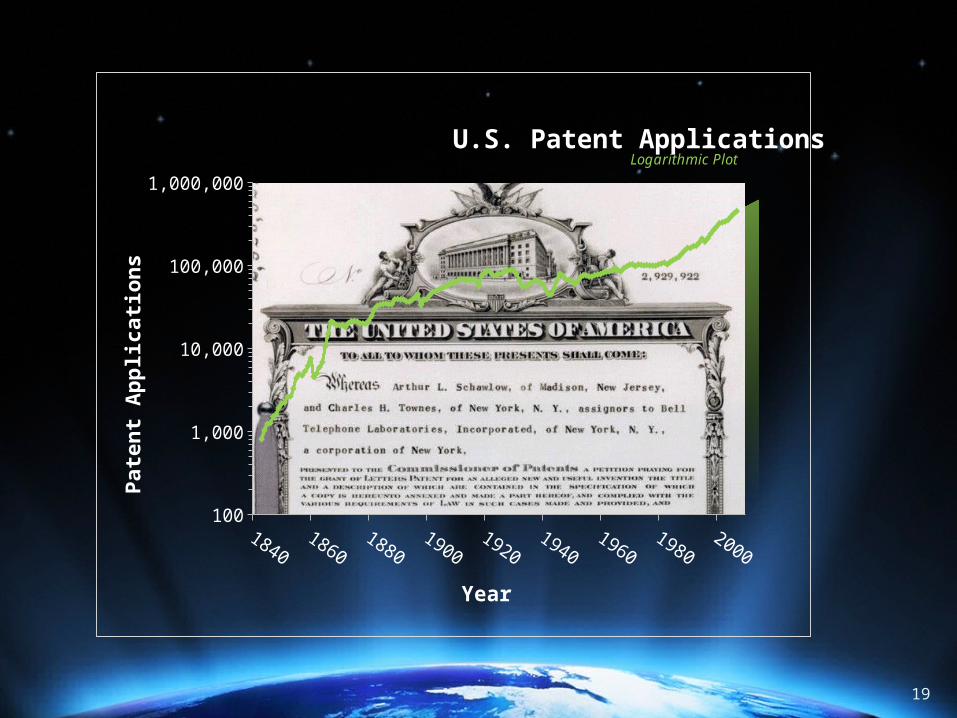
U.S. Patent Applications
Year
Pate
nt
Ap
plica
tion
s
Logarithmic Plot
19

1975 1980 1985 1990 1995 2000 2005 20100
1,000
2,000
3,000
4,000
5,000
World Annual Photovoltaic Pro-duction
Year
Megawatts
1975 1980 1985 1990 1995 2000 2005 20101
10
100
1,000
10,000
World Annual Photovoltaic Production
Year
Megawatts
Logarithmic PlotLinear Plot
1975 1980 1985 1990 1995 2000 2005 20101
10
100
1,000
10,000
100,000
World Cumulative Photovoltaic Production
Year
Megaw
att
s
Logarithmic PlotLinear Plot
1975 1980 1985 1990 1995 2000 2005 20100
5,000
10,000
15,000
World Cumulative Photovoltaic Production
Year
Me
ga
wa
tts
20

0.00000
0.00001
0.00010
0.00100
0.01000
0.10000
1.00000
10.00000
100.00000
1,000.00000
10,000.00000
DNA Seqencing Cost
Year
Cost
in D
ollars
19801985
19901995
20002005
2010
1E+02
1E+04
1E+06
1E+08
1E+10
Growth in Genbank DNA Sequence Data
Base Pairs
Year
Ba
se P
airs a
nd
Se
qu
en
ces
Logarithmic Plot
Logarithmic Plot
21

1975 1980 1985 1990 1995 20000
2
4
6
8
10
IT's Share of the Economy
Year
% o
f G
DP
`
Doubling time: x years
Logarithmic Plot
22
10
100
1,000
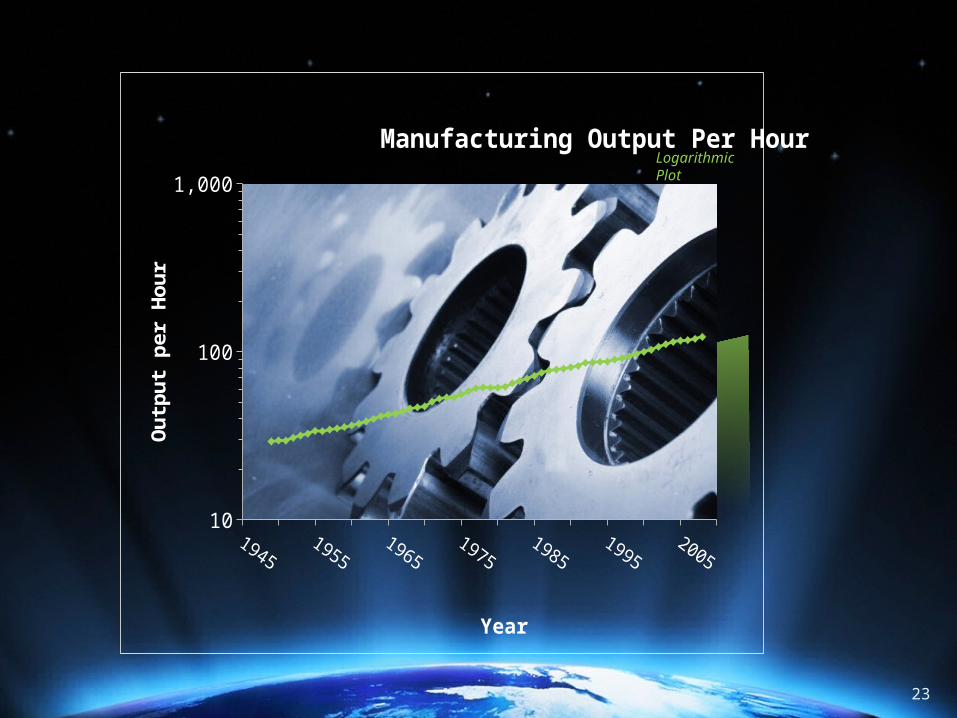
Manufacturing Output Per Hour
Year
Ou
tpu
t p
er
Hou
r
Logarithmic Plot
23

We won’t experience 100 years of progress in the 21st century. It will be more like 20,000 years of progress (at today’s rate).
24

25


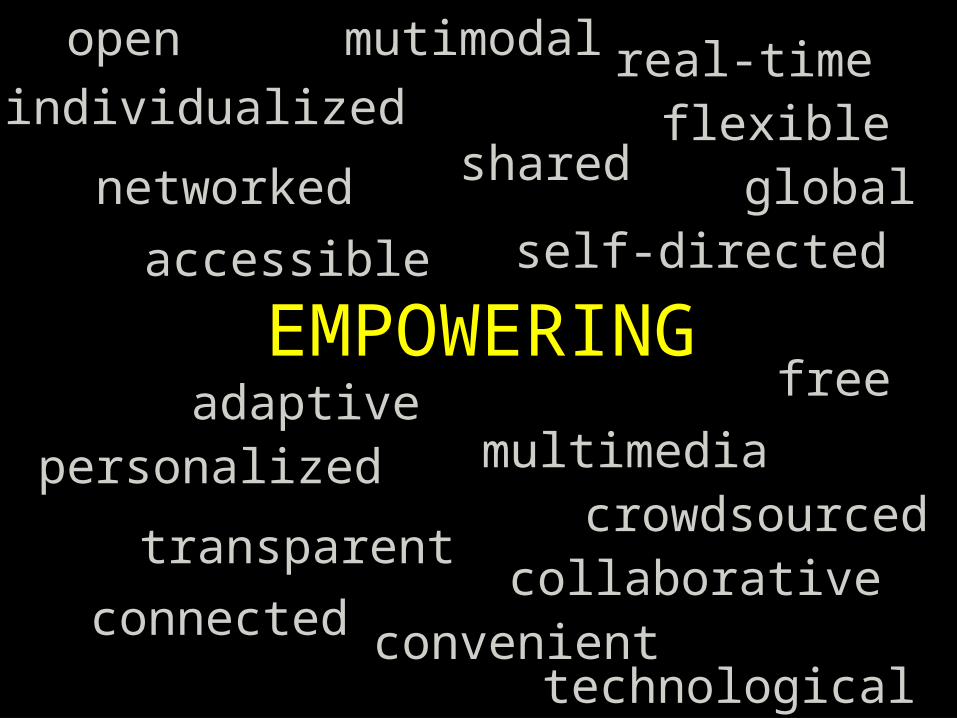
Every year learning will be more …

open
accessible
transparent
free
real-time
convenient
networked
connected
global
collaborative
shared
crowdsourced
flexible
adaptive
individualized
personalized
mutimodal
technological
multimedia
self-directed
open
accessible
transparent
free
real-time
convenient
networked
connected
global
collaborative
shared
crowdsourced
flexible
adaptive
individualized
personalized
EMPOWERING
mutimodal
technological
multimedia
self-directed

Are youmoving
fast enough?