scotney castle, lamberhurst, kent archaeological survey (april
TRANSCRIPT
Scotney Castle, Lamberhurst, Kent
Archaeological Survey (April 2011)
Topographic and Geophysical Survey: Interim Report (July 2012)
University of Southampton, Department of Archaeology

Page | 2
Table of Contents
1 Introduction & Background ............................................................................................................ 4
1.1 Location ................................................................................................................................... 4
1.2 Geological Background ........................................................................................................... 5
1.3 Archaeological & Historical Background ................................................................................. 5
1.3.1 Pre-Medieval (before 1066) ............................................................................................ 5
1.3.2 Medieval (1066-1500) ..................................................................................................... 5
1.3.3 Post-Medieval (1500-1900)............................................................................................. 6
1.3.4 Modern (1900- Present).................................................................................................. 6
1.4 Aims......................................................................................................................................... 7
2 Survey Methodology ....................................................................................................................... 7
2.1 Overview ................................................................................................................................. 7
2.2 Methods & Equipment ............................................................................................................ 8
2.3 Survey Strategy ....................................................................................................................... 8
2.3.1 Topographic Survey......................................................................................................... 8
2.3.2 Geophysical Survey ......................................................................................................... 9
3 Survey Results & Interpretation ...................................................................................................... 9
3.1 Overview of Site ...................................................................................................................... 9
3.2 Central Section ...................................................................................................................... 14
3.3 South Section ........................................................................................................................ 19
3.4 East Section ........................................................................................................................... 23
4 Conclusion ..................................................................................................................................... 26
4.1 Recommendations for further work ..................................................................................... 26
5 Bibliography .................................................................................................................................. 27

Page | 3
Table of Figures
Figure 1 - OS Map of site and surrounding area. Scale: 1:50,000 – Source: Digimap.
http://digimap.edina.ac.uk ..................................................................................................................... 4
Figure 2 - 1:625000 scale geology map demonstrating Scotney’s Position in the Wealden Group-
mudstone, sandstone and siltstone. Image Reproduced with the permission of the British Geological
Survey ©NERC. All rights Reserved......................................................................................................... 5
Figure 3 - 1:2500 scale. -1ST Edition Map of Scotney Castle, Kent, from 1870. Source: Historic
Digimap. .................................................................................................................................................. 6
Figure 4 - Aerial Photo of site, Viewing Altitude 1.39km. Possible location of Mill Highlighted. ©
Google Earth. .......................................................................................................................................... 7
Figure 5 - OS Map of site and surrounding area. Scale: 1:10,000, with highlighted survey area
approximation 1.6km2 – Source: Digimap. http://digimap.edina.ac.uk ................................................. 9
Figure 6 - Representation of complete survey area. ............................................................................ 10
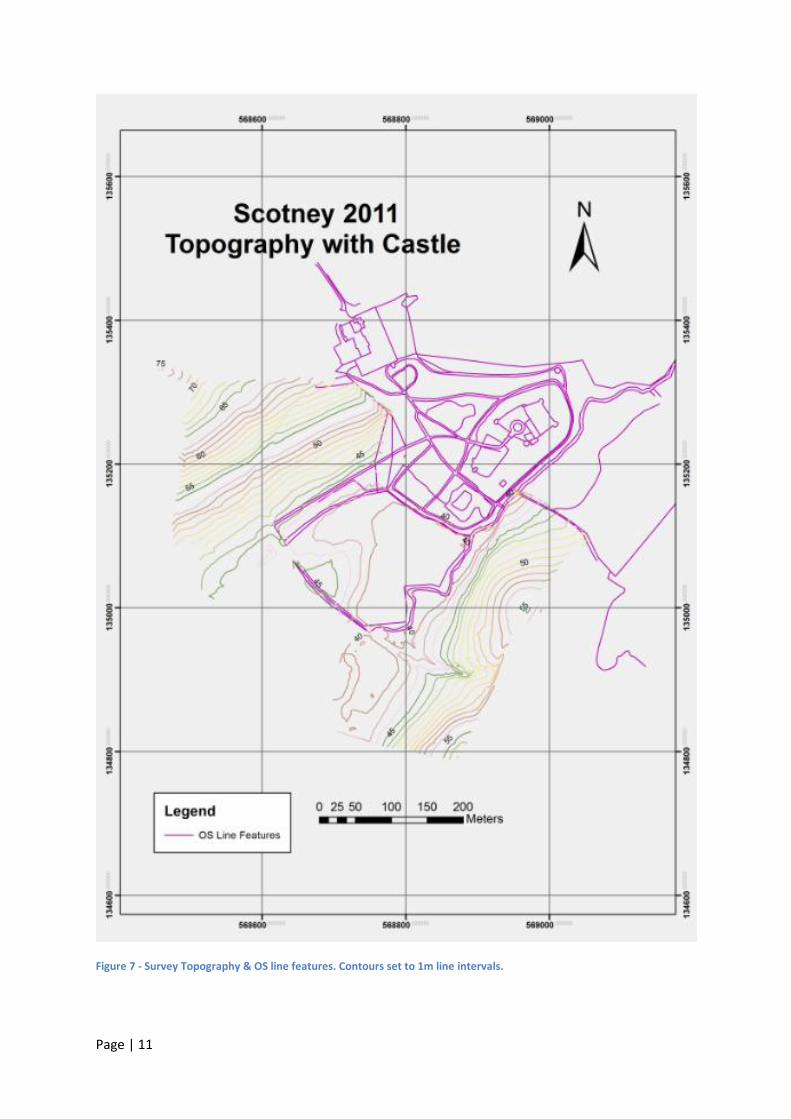
Figure 7 - Survey Topography & OS line features. Contours set to 1m line intervals. ......................... 11
Figure 8 - Feature Map of Survey Area. ................................................................................................ 12
Figure 9 - Topography and Features of Survey Area. ........................................................................... 13
Figure 10 - Central section from Easterly perspective, light direction is set to south 161.6° at an angle
of 17.5°. ................................................................................................................................................. 14
Figure 11 - Central section from Westerly perspective, light direction is set to south 161.6° at an
angle of 17.5° - Scene using spline raster to accentuate features........................................................ 15
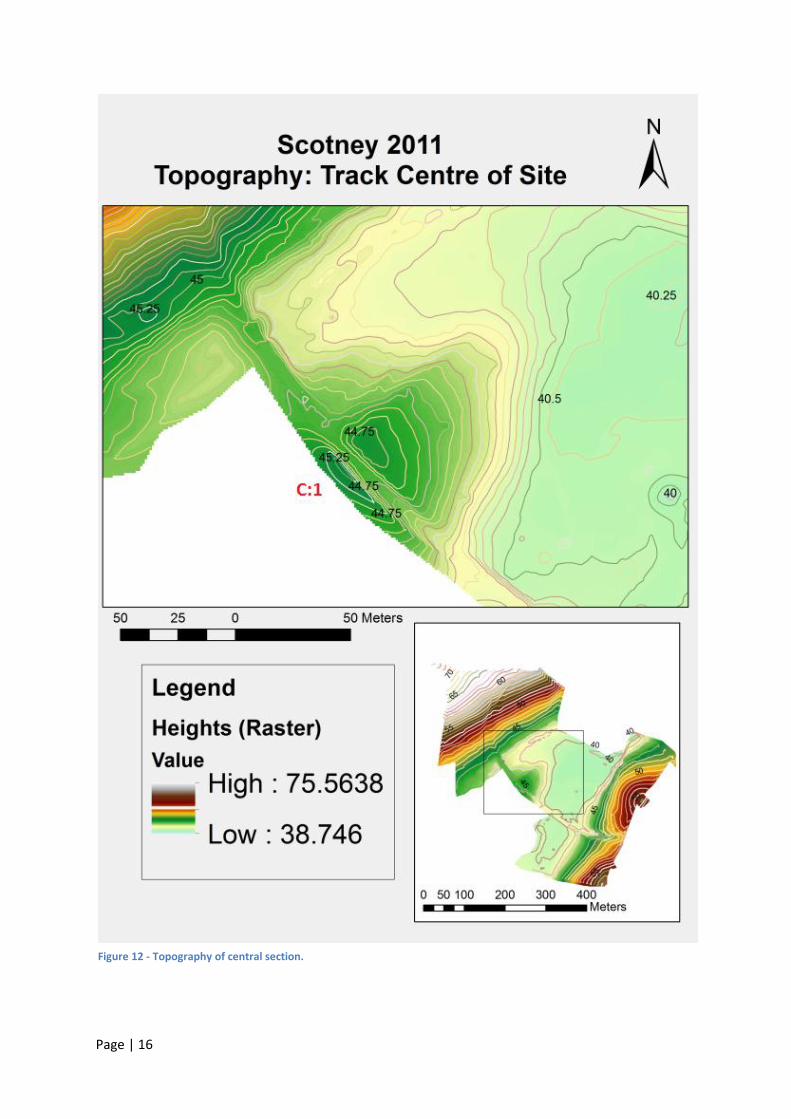
Figure 12 - Topography of central section. ........................................................................................... 16
Figure 13 - Features of central section. ................................................................................................ 17
Figure 14 - Resistivity for central section. ............................................................................................. 18
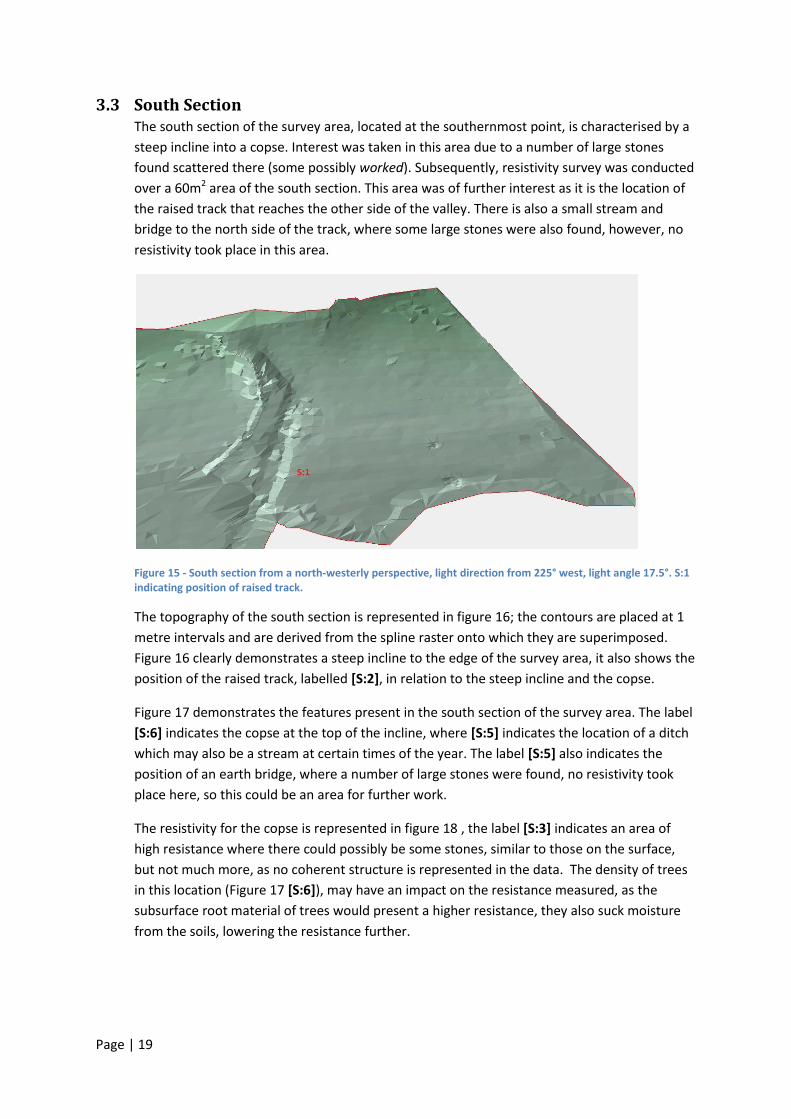
Figure 15 - South section from a north-westerly perspective, light direction from 225° west, light
angle 17.5°. S:1 indicating position of raised track. .............................................................................. 19
Figure 16 - Topography of south section. ............................................................................................. 20
Figure 17 - Features of south section. .................................................................................................. 21
Figure 18 - Resistivity of south section. ................................................................................................ 22
Figure 19 - East section from a westerly perspective, light direction from 350.8° west, light angle
17.5°. Label E:1 indicates the bank and ditch. ...................................................................................... 23
Figure 20 - Topography of east section................................................................................................. 24
Figure 21 - Features of east section. ..................................................................................................... 25

Page | 4
1 Introduction & Background Between the 4th to the 8th April 2011 a topographical and geophysical survey of Scotney Castle,
Lamberhurst, Kent was undertaken by the Department of Archaeology, of the University of
Southampton. The survey was conducted by students and staff of the University. The survey
was not confined to within the moat area of the Castle, as in previous survey work (Martin, D.
et al 2008). The survey was conducted over a larger area in order to assess the surrounding
landscape.
The project work was in collaboration with The National Trust and with local archaeologists and
historians. As a National Trust owned estate, the survey was ‘on show’ to the public, and
therefore demonstrating an element of engagement with the local community.
1.1 Location Scotney Castle is located in the county of Kent, near the border with East Sussex. It lies 1.5km
south-east of the village of Lamberhurst (Hancock. A. 2008) (Figure1). The site of ‘Old Scotney
Castle’ lies at E:568969 N:135233 (Figure 2), which is the point of the old ruins inside the moat
area. The old ruins of Scotney Castle lie in the valley floodplain of the River Bewl.
Figure 1 - OS Map of site and surrounding area. Scale: 1:50,000 – Source: Digimap. http://digimap.edina.ac.uk

Page | 5
1.2 Geological Background The soils within the Scotney Castle area are of the Wickhan 1 association and of the Curtisden
Association (Hancock. A. 2008 p.4). The overlying geology is referred to as being part of the
‘Hastings group’, consisting of Ashdown beds, Wadhurst Clay and Tunbridge Wells Sand; these
are freshwater floodplain deposits. Due to the Castles proximity to the River Bewl, and
continuous landscaping, this overlying geology may have been disrupted or buried by the river,
or human activity (Hancock. A. 2008 p.4). The underlying geology belongs to the Wealden
Group, characterised by mudstone, sandstone and siltstone (Figure 2). This geology is
potentially porous, which may affect water content in soils and subsequent resistivity results.
1.3 Archaeological & Historical Background
1.3.1 Pre-Medieval (before 1066)
No pre-medieval material is known at the site.
1.3.2 Medieval (1066-1500)
Scotney Castle was built around c.1378-80, by Sir Roger Ashburnham. The Landscape was
predominantly wooded at this time. The Castle itself consisted of ‘curtain’ walls, though little
else is known about the 14th Century configuration as little of it survives (Hancock. A. 2008
p.7). The base of the gatehouse and the south-eastern tower remain, the latter of which is
known as the ‘Ashburnham Tower’. A deer park was also present, possibly to the north-west
of the castle around the location of the later Victorian country house (Hancock. A. 2008 p.7)
(Martin, D. et al 2008 p.6).
Figure 2 - 1:625000 scale geology map demonstrating Scotney’s Position in the Wealden Group- mudstone, sandstone and siltstone. Image Reproduced with the permission of the British Geological Survey ©NERC. All rights Reserved.

Page | 6
1.3.3 Post-Medieval (1500-1900)
Through the late 15th to early 16th centuries the estate was owned by the Darrell family,
during which time they reconstructed and added to the castle (c. 1580 & c. 1640). The estate
was then bought in 1778 by Edward Hussey. His grandson in the 1830s commissioned
Anthony Salvin to design a Victorian, or ‘Neo-Tudor’, country house on the hill to the north-
west of the castle, as demonstrated in Figure 7 (ADS 2008) (Martin, D. et al 2008 p.1.). Later
phases of the Castle can be seen to have undergone constant renegotiation and construction
into the mid-17th century and later (Martin, D. et al 2008 – Appendix B).
1.3.4 Modern (1900- Present)
The area of the estate within the moat became a Scheduled Ancient Monument in 1933 and
the remains of the old castle are a grade 1 listed building. The gardens of the estate are also
protected under the English Heritage Register of Historic Parks and Gardens. The Estate was
left to the National Trust in 1970, on the death of Edward Hussey III’s grandson.
Archaeology South East commissioned a Geophysical survey for the National Trust in
September 2008. An area of 0.25 hectares, within the confines of the moat, underwent
geophysical survey. The aim of the work was to identify the presence of sub-surface remains
of the Castles outbuildings.
The National Trust commissioned an Interpretative Historic Building Survey which was
completed in November 2008 (Martin, D. et al 2008). The survey was conducted during a
period of repairs which gave access to areas otherwise rarely seen. The aim of the work was
to better understand how the building developed over time.
Figure 3 - 1:2500 scale. -1ST Edition Map of Scotney Castle, Kent, from 1870. Source: Historic Digimap.

Page | 7
1.4 Aims The project aims to locate and identify features in order to better understand the surrounding
landscape of the castle. One of the features expected to be found was site of the Medieval
mill, located to the south-west, and upstream, of the Castle (ADS 2001) (Figure 8). This will be
a point of focus in interpreting the results from the survey.
Figure 4 - Aerial Photo of site, Viewing Altitude 1.39km. Possible location of Mill Highlighted. © Google Earth.
2 Survey Methodology
2.1 Overview Geophysical and topographical survey techniques were employed for the work carried out at
Scotney Castle. Topographical survey was chosen as it provides an effective means for
mapping the topography on a macro-scale, in a relatively small timeframe. Resistivity was
chosen as the geophysical technique due to its cost effective nature and simplicity. Combining
both survey methods should allow for an appreciation of both surface and sub-surface
features.

Page | 8
2.2 Methods & Equipment Topographical survey was conducted using Leica TCR 800 Series (Reflectorless) Total Stations,
with readings taken with one person manning the total station, another at a target point with
prism set at known target height and a final person recording point information and other
metadata in a notebook, a notebook associated to one specific total station. Changes ranging
from string, spot-heights and features were all noted accordingly and cross-referenced with
data downloaded to LISCAD from a total station.
The resistivity survey was conducted using a Geoscan RM15 Resistance Meter. The survey was
conducted in teams of four people, one operating the resistance meter, another aiding, and
two people moving 1m marker tape. Grids were marked out in the appropriate areas.
2.3 Survey Strategy
2.3.1 Topographic Survey
Three total stations were used for the topographical survey of the site, with teams of four
operating each total station in a different location, to cover as much of the site as possible. A
series of station points were set up in different locations, from which readings were taken.
Throughout the week new stations were setup to provide a means to survey more of the site,
however, these new stations had to be within the line of site of a previous station for
orientation purposes.
Details of the site were taken during the survey, these included the obvious topographical
and physical geography features, for example the top and toes of slope, bank or ditch,
watercourses and vegetation. Features not associated with the physical geography of the
site were also recorded, including; paths, tracks, sign posts, boundaries and gates. It is worth
noting here that the completeness of certain features, and the entire survey itself, was
limited by the accessibility and visibility of certain features. Points taken for a certain feature
were coded in relation to said feature prior to those points being taken, with the purpose of
providing clear features through the download and interpretation stages.
General spot heights, used in generating the topography of the site, were taken at 5 metre
intervals along transects placed 5 metres apart. This was achieved using ranging poles to
mark out transects, and 5 paces to approximate 5 metre intervals.

Page | 9
2.3.2 Geophysical Survey
The geophysical survey was conducted over 30 x 30 metre squares, with readings taken at 1
metre intervals. Survey was conducted in a ‘zigzag’ fashion with a total of 900 readings in
each square.
3 Survey Results & Interpretation An area of approximately 1.6km2 was covered in the topographical survey, with an area of 60m2
covered in each geophysical survey. Three key locations across the site have been picked out as
areas of interest, these are; the potential site of the mill or central section, the south section or
copse, and the east section. These locations were identified as areas of interest either prior to
arrival at the site, as with the potential mill location, or were deemed an area of interest at the
site. In this section an overview of the site will be provided before reporting on specific
locations.
3.1 Overview of Site Using all the spot height data, including specifically coded surface features, a representation
of the relief and general nature of the site could be constructed; this is demonstrated in figure
6.
Figure 5 - OS Map of site and surrounding area. Scale: 1:10,000, with highlighted survey area approximation 1.6km2 –
Source: Digimap. http://digimap.edina.ac.uk

Page | 10
Figure 6 - Representation of complete survey area.
The specifically coded feature data allowed for the creation of feature maps, these were
created for specific sections of the site, but also one was created for the whole site (Figure 8).
Feature maps are particularly useful in outlining relief features which may not be accurately
represented in height maps or 2.5D representations of the site.
The topographical data also allowed for the construction of contour and height maps, further
demonstrating the relief of the site, but also providing a quantification of the changes in
elevation around the site (Figures 7 & 9).
The two small 60m2 sections of resistivity can be placed in their correct position, relative to
the rest of the site, demonstrated in figures 14 & 18; height data has been included to provide
a clearer context for their interpretation.
Page | 11
Figure 7 - Survey Topography & OS line features. Contours set to 1m line intervals.

Page | 12
Figure 8 - Feature Map of Survey Area.

Page | 13
Figure 9 - Topography and Features of Survey Area.

Page | 14
3.2 Central Section This area of the site is where the track leading up the hill to Scotney house begins its incline.
This area is characterised by what can best be described as a small knoll. This knoll is cut by
the track which leads to the house. This is an area of interest as it is the potential location of
the mill. Resistivity was carried out over a 60m2 area of this section to try and identify any
subsurface features which may relate to the mill.
Figure 10 - Central section from Easterly perspective, light direction is set to south 161.6° at an angle of 17.5°.
The topography of the central section can be clearly demonstrated in figure 12, where using
the nearest neighbour raster interpolation and contour values set to 0.25 metre intervals, the
knoll is clearly depicted. The track is also visible as it dissects the knoll close to the survey
boundary, labelled [C:1].
Figure 13 demonstrates the features surrounding the track and possible mill, with associated
topography. Label [C:2] indicates a bank top and toe running perpendicular to the track and
cutting across the knoll. This feature is visible in the reconstruction figure 11, label [C:4], and it
may have some association with a potential mill. Two other bank features are present in the
central section, found to the north of the knoll, these are clearly represented in figure 10.
These bank features may be contemporary earth works, especially considering one runs
parallel to a fence (Figure 13). However, this may not be the case, meaning there is room for
further investigation here.
The resistivity conducted in this region is represented in figure 14, where the resistivity is
superimposed over a spline raster interpolation. A spline raster interpolation was chosen for
this figure as it demonstrates higher sensitivity towards changes in topography, and in some
instances accentuates them. Label [C:3] demonstrates a linear feature of higher resistance,
which can be associated to the bank indicated in label [C:2], demonstrating an area of high
resistance which fits into the confines of the bank top and toe. This may indicate some
remnants of a possible mill, however this area of high resistance, and the rest of the data,
does not demonstrate any coherent structures which can define the mill, or any other
structure.

Page | 15
The central section is an interesting location for a number of reasons. Firstly it is likely that
the track was cut into the knoll at some point, perhaps during the 1830’s construction of
Scotney house; it is very unlikely to be a natural feature. Secondly, the knolls location could
relate to both; a possible Medieval processional route to Scotney Castle, and the more
probable processional route to Scotney House, as these were common for both Medieval and
17th-18th century manor houses (Johnson, M. 2002 p.180).
Figure 11 - Central section from Westerly perspective, light direction is set to south 161.6° at an angle of 17.5° - Scene using spline raster to accentuate features.
Page | 16
Figure 12 - Topography of central section.

Page | 17
Figure 13 - Features of central section.

Page | 18
Figure 14 - Resistivity for central section.
Page | 19
3.3 South Section The south section of the survey area, located at the southernmost point, is characterised by a
steep incline into a copse. Interest was taken in this area due to a number of large stones
found scattered there (some possibly worked). Subsequently, resistivity survey was conducted
over a 60m2 area of the south section. This area was of further interest as it is the location of
the raised track that reaches the other side of the valley. There is also a small stream and
bridge to the north side of the track, where some large stones were also found, however, no
resistivity took place in this area.
Figure 15 - South section from a north-westerly perspective, light direction from 225° west, light angle 17.5°. S:1 indicating position of raised track.
The topography of the south section is represented in figure 16; the contours are placed at 1
metre intervals and are derived from the spline raster onto which they are superimposed.
Figure 16 clearly demonstrates a steep incline to the edge of the survey area, it also shows the
position of the raised track, labelled [S:2], in relation to the steep incline and the copse.
Figure 17 demonstrates the features present in the south section of the survey area. The label
[S:6] indicates the copse at the top of the incline, where [S:5] indicates the location of a ditch
which may also be a stream at certain times of the year. The label [S:5] also indicates the
position of an earth bridge, where a number of large stones were found, no resistivity took
place here, so this could be an area for further work.
The resistivity for the copse is represented in figure 18 , the label [S:3] indicates an area of
high resistance where there could possibly be some stones, similar to those on the surface,
but not much more, as no coherent structure is represented in the data. The density of trees
in this location (Figure 17 [S:6]), may have an impact on the resistance measured, as the
subsurface root material of trees would present a higher resistance, they also suck moisture
from the soils, lowering the resistance further.

Page | 20
Figure 16 - Topography of south section.

Page | 21
Figure 17 - Features of south section.

Page | 22
Figure 18 - Resistivity of south section.

Page | 23
3.4 East Section The east section of the site was of interest due to the presence of a bank and ditch positioned
on the hill facing the south side of the castle. The bank and ditch was surrounded in areas by
thick vegetation and was therefore hard to access. The nature of the vegetation limited how
much of the bank and ditch could be recorded, however, enough data was collected for it to
be reconstructed to a certain extent (Figure 19).
The topography of the east section is represented in figures 20 and 21. Figure 20 shows
contours derived from a spline raster and then superimposed over that spline raster. The
spline raster and contours for this section were chosen as they highlight the difference in
elevation effectively. Labels [E:2] and [E:3] indicate locations where there is up to a 5 metre
difference in height over a short distance. A slightly more conservative representation of the
topography for this section is demonstrated in figure 21, though it still shows there to be
significant changes in elevations over a short distance. The contours for this representation
are derived from a nearest neighbour raster and are set to 0.5 metre intervals.
Figure 21 also represents the features present in the east section, with the label [E:4]
indicating the location of the bank and ditch. Figure 21 also demonstrates how vegetated the
area was, with large portions of the area marked out as being the edge of vegetation, and the
top and toe of slope (bank and ditch) only occupying a small area. It is almost certain that the
bank and ditch continues through the vegetation to some extent.
Figure 19 - East section from a westerly perspective, light direction from 350.8° west, light angle 17.5°. Label E:1 indicates the bank and ditch.

Page | 24
Figure 20 - Topography of east section.

Page | 25
Figure 21 - Features of east section.

Page | 26
4 Conclusion The work carried out at Scotney Castle has been successful in producing a topographical survey
of 1.6km2 of the land surrounding the castle. The topography has allowed for the identification
of areas of archaeological potential, most notably the bank running across the knoll in the
central section and the bank and ditch present in the east section. The topography of the south
section demonstrates an undulating landscape in the copse, where certain large stones were
present. The 2.5D reconstruction of the survey area provides a clear representation of the
raised track, which runs south to north in an arc across the site. This track may have been
originally created when Scotney House began construction in the 1830’s; since then it may have
been added to and managed by owners of the estate, including the National Trust.
The geophysical survey of the possible mill site, in the central section, produced results that
were inconclusive. Nevertheless, the resistivity results highlighted an area of higher resistance
which aligned with the bank running across the knoll. The resistivity survey of the copse in the
south section also proved inconclusive with no coherent features becoming apparent, however,
higher areas of resistivity present could indicate the location of more large stones, similar to
those found on the surface in the copse.
4.1 Recommendations for further work Proceeding with further resistivity over the knoll in the central section would be a good
starting point in trying to deduce whether a mill existed in that location. If possible, the use of
test pits would help establish if the higher levels of resistivity associated with the bank is
archaeology, or if it is a geological feature.
At the north of the south section a ditch feature and earthen bridge was present (Figure 17
[S:5]) Resistivity here may indicate the origin of loose stone found around the ‘earth’ bridge.
The bank and ditch present in the east section and the surrounding area could be further
investigated by implementing a geophysical survey in that area. This may highlight any
subsurface features associated with the bank and ditch, it may also identify any other features
surrounding the bank and ditch.

Page | 27
5 Bibliography Literature:
Hancock.A.2008. Geophysical Survey : Old Scotney Castle NR Lamberhurst Kent. Unpublished.
Johnson, M. 2002. Behind the Castle Gate: From Medieval to Renaissance. Abingdon: Routledge.
Martin, D. et al 2008. An Archaeological Interpretative Survey of The Old Castle, Scotney,
Lamberhurst, Kent. Unpublished.
Archaeology Data Service , 2001.Scotney Castle with courtyards and garden terrace, Scotney Castle
Estate, at;
http://ads.ahds.ac.uk/catalogue/search/fr.cfm?rcn=NTSMR-MNA127999
accessed 09/03/2011
Archaeology Data Service, 2008. Mill Garden, South Park, Scotney Castle Estate, at; http://ads.ahds.ac.uk/catalogue/search/fr.cfm?rcn=NTSMR-MNA127999 accessed 09/03/2011
The National Trust. Scotney Castle, at;
http://www.nationaltrust.org.uk/main/w-vh/w-visits/w-findaplace/w-scotneycastlegarden.htm
accessed 12/03/2011
Cartographic:
Digimap
http://digimap.edina.ac.uk
accessed 07/03/2011
British Geological Survey
http://www.bgs.ac.uk/education/geology_of_britain/home.html
accessed 07/03/2011