school of la w • wagner school of public service state of...
TRANSCRIPT
State of New York City’s Subsidized Housing: 2011
F u r m a n C e n t e r F o r r e a l e s t a t e & u r b a n p o l i C y
n e w y o r k u n i v e r s i t y school of law • wagner school of pub l ic serv ice

state of new York citY’s subsid ized housing: 2011 2
state of new york City’s subsidized housing: 2011
executive summary . . . . . . . . . . . . . . . . . . . . . . . . . . . . . . . . . . . . . . . . . . . . . . . 6
section 1. introduction . . . . . . . . . . . . . . . . . . . . . . . . . . . . . . . . . . . . . . . . . . 9
section 2. hud financing and insurance . . . . . . . . . . . . . 20
section 3. HuD project-based rental assistance . . . 28
section 4. mitchell-lama . . . . . . . . . . . . . . . . . . . . . . . . . . . . . . . . . . . . . 35
section 5. low-income Housing tax Credits . . . . . . . . . . 42
section 6. state of subsidized housing: preservation opportunities . . . . . . . . . . . . . . . . . . . . . . . . . . . . . . . . . . 48
list of acronyms . . . . . . . . . . . . . . . . . . . . . . . . . . . . . . . . . . . . . . . . . . . . . . . . 54

state of new York citY’s subsid ized housing: 2011 3
AuthorsJaclene Begley
Caitlyn Brazill
Vincent Reina
Max Weselcouch
EditorsVicki Been
Ingrid Gould Ellen
Sarah Gerecke
Jerry Salama
Research Assistance and SupportKen Adler
Brice Chaney
Maxwell Harris
Tyler Jaeckel
Matthew Murphy
Sajan Ravindran
Paul Salama
Rushin Shah
Samantha Wright
Hayley Wynn
Special ThanksCaroline Bhalla
Allegra Glashausser
John Krauss
Stephen Roberts
Michael Williams
FundersThe John D. and Catherine
T. MacArthur Foundation
The F.B. Heron Foundation
Herbert Z. Gold (’40)
Advisory CommitteeVictor Bach
John Cicero
Toby Halliday
Deb Howard
John Kelly
Robert Knakal
Sam Marks
Vincent O’Donnell
Danilo Pelletiere
Abby Jo Sigal
Jeff Adams, Azavea
Christopher Allred, NYC Department of Housing Preservation and Development
Priscilla Almodovar, JP Morgan Chase, Community Development Banking
Douglas Apple, NYC Department of Housing Preservation and Development
Cynthia Barton, New York City Office of Emergency Management
Joshua Bloodworth, Bryant Burgher Jaffe & Roberts LLP
Dawn St. Clair Bodden, NYS Homes and Community Renewal
Katy Bordonaro, Prep for Prep
Raphael Bostic, U.S. Department of Housing & Urban Development
Isabelle Brantley, NYC Department of Housing Preservation and Development
Bill Brauner, Community Economic Development Assistance Corporation
Craig Brown, Duval and Stachenfeld LLP
Jim Buckley, University Neighborhood Housing Program
Elaine Calos, NYC Department of Housing Preservation and Development
William Carbine, NYC Department of Housing Preservation and Development
Adolfo Carrion, U.S. Department of Housing & Urban Development
Rafael Cestero, L+M Development Partners
Francia Chandler, NYC Department of Housing Preservation and Development
Arlo Chase, Alembic Development Corporation
David Chase, U.S. Department of Housing & Urban Development
Robert Cheetham, Azavea
Joseph Cicciu, Belmont Arthur LDC
Mandy Clarke, U.S. Department of Housing & Urban Development
Miriam Colon, NYC Department of Housing Preservation and Development
Henry Comas, U.S. Department of Housing & Urban Development
acknowledgments
Additionally, the Furman Center and its Institute for Affordable Housing Policy would like to thank the many people who contributed data, time, editorial assistance and feedback on the report and the database:

state of new York citY’s subsid ized housing: 2011 4ACknowlEdgmEnTS
Hannah Creeley, NYC Department of Housing Preservation and Development
Yelena Dayen, NYC Department of Housing Preservation and Development
Megan DeCrappeo, National Low Income Housing Coalition
Annemarie DiCola, Trepp, LLC
Tom Delaney, New York University
Lisa Deller, National Equity Fund
David Dietrich, NYS Homes and Community Renewal
Shaun Donovan, U.S. Department of Housing & Urban Development
Tolga Ergunay, New York University
Rachel Fee, NYC Department of Housing Preservation and Development
Thomas Fink, Trepp, LLC
Veronica Flanders, NYS Homes and Community Renewal
Richard Froelich, NYC Department of Housing Preservation and Development
Elizabeth Gaumer, NYC Department of Housing Preservation and Development
Terry Gigliello, NYC Department of Housing Preservation and Development
Adam Glantz, U.S. Department of Housing & Urban Development
Emily Goldstein, Tenants and Neighbors
Stephanie Green, West Side Federation for Senior and Supportive Housing, Inc.
Elizabeth Greenstein, NYC Department of Housing Preservation and Development
John Griffin, NYC Department of Housing Preservation and Development
Rachel Grossman, Wachovia Capital Markets LLC
David Hanzel, Association of Neighborhood Housing Developers
Mitchell Hill, Troutman Sanders
Chip Hitchens, Azavea
Sarah Hovde, LISC New York City
Delores Jacobs, NYC Department of Housing Preservation and Development
Marc Jahr, NYC Housing Development Corporation
Leora Jontef, NYC Department of Housing Preservation and Development
Edward Josephson, South Brooklyn Legal Services
Gregory Jost, University Neighborhood Housing Program
Sydelle Knepper, SKA Marin
Becky Koepnick, U.S. Department of Housing & Urban Development
Drew Kiriazides, Pratt Area Community Council
Annie Koo, NYC Department of Housing Preservation and Development
Rebecca Koopman, WHEDCo
Brian Lawlor, NYS Homes and Community Renewal (formerly)
Jonah Lee, NYC Housing Development Corporation
Dina Levy, United Homesteading Assistance Board
Rhonda Lewis, Bridge Street Development Corporation
Ariel Lipper, NYC Department of Housing Preservation and Development
Angela Lowery, NYC Department of Housing Preservation and Development
Yvette Lugo, U.S. Department of Housing & Urban Development
Peter Madden, NYC Department of Housing Preservation and Development
Kaye Matheny, NYC Department of Housing Preservation and Development
John McCarthy, Community Preservation Corporation
Richmond McCurnin, NYS Homes and Community Renewal
Matt McFarland, Azavea
Sean McGinnis, Azavea
Marc Migliacci, NYC Department of Housing Preservation and Development
Peter Monica, NYU School of Law
David Muniz, NYS Homes and Community Renewal
Vito Mustaciuolo, NYC Department of Housing Preservation and Development
Urmas Naeris, NYC Housing Development Corporation
Donald Notice, West Harlem Group Assistance
Aaron Ogle, Azavea
Susan O’Neill, NYC Housing Development Corporation
Cheryl Pahaham, Community Board 12, Manhattan
Molly Park, NYC Department of Housing Preservation and Development
Erika Poethig, U.S. Department of Housing & Urban Development
Ann Ray, Shimberg Center, University of Florida
Gary Rodney, Omni New York LLC

state of new York citY’s subsid ized housing: 2011 5ACknowlEdgmEnTS
L. Nicolas Ronderos, Regional Plan Association
Maggie Russell-Ciardi, Tenants & Neighbors
AnnMarie Santiago, NYC Department of Housing Preservation and Development
Renee Schoonbeek, Hudson Square Connection
Denise Scott, LISC New York City
Ellen Seitz, NYS Homes and Community Renewal
Victoria Shire, Enterprise Community Partners, Inc
Joseph Singleton, NYC Department of Environmental Protection
Martin Siroka, Bingham McCutchen
Michael Skrebutenas, NYS Homes and Community Renewal
Gary Sloman, NYC Department of Housing Preservation and Development
Ismene Speliotis, MHANY Management Inc.
David Stein, Empire State Development Corporation
Lydia Taghavi, U.S. Department of Housing & Urban Development
Joan Tally, NYC Housing Development Corporation
Todd Trehubenko, Recap Real Estate Advisors
Monica Valente, NY State Assembly
Deborah VanAmerongen, Nixon Peabody
RuthAnne Visnauskas, NYC Department of Housing Preservation and Development
Mijo Vodopic, John D. and Catherine T. MacArthur Foundation
Alfred Walcott, NYS Homes and Community Renewal
Julie Walpert, NYC Department of Housing Preservation and Development
David Walsh, NYS Homes and Community Renewal
Mathew Wambua, NYC Department of Housing Preservation and Development
Tom Waters, Community Service Society of New York
Robin Weinstein, NYC Department of Housing Preservation and Development
Gerard Wickham, NYS Homes and Community Renewal
Eric Williams, NYS Homes and Community Renewal
Joy Willig, NYS Homes and Community Renewal (formerly)
Ben Winter, U.S. Department of Housing & Urban Development
Christina Wray, NYC Department of Housing Preservation and Development
Sheena Wright, Abyssinian Development Corporation
Stacie Young, Community Investment Corporation
Thomas Yu, Downtown Manhattan CDC, Affiliate of Asian Americans for Equality
Elizabeth Zeldin, Enterprise Community Partners, Inc.
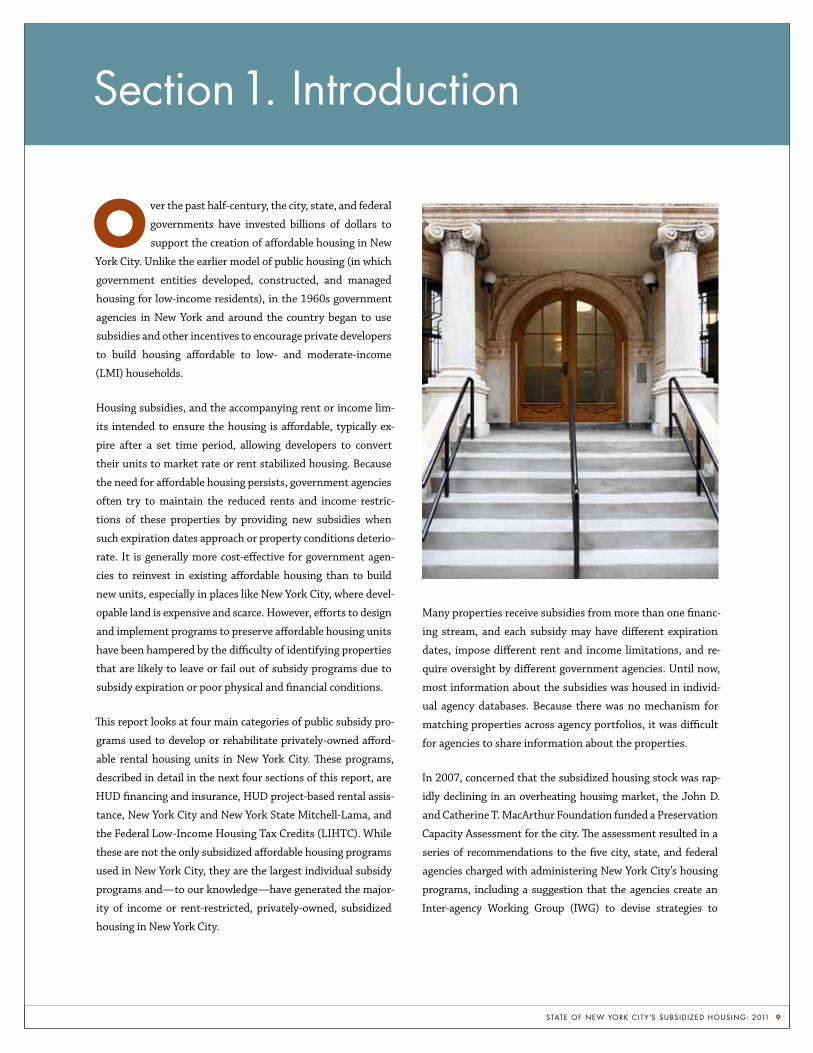
All photos: L. Racioppo/New York City Department of Housing Preservation and Development
state of new York citY’s subsid ized housing: 2011 6
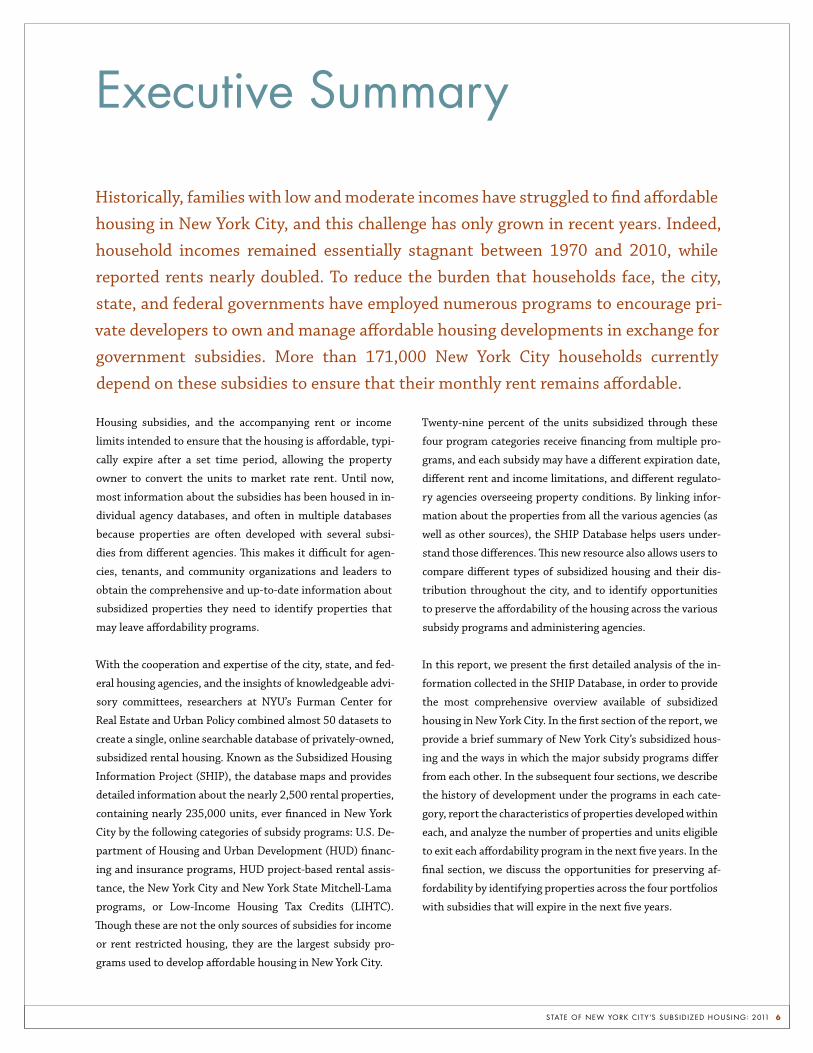
Historically, families with low and moderate incomes have struggled to find affordable housing in New York City, and this challenge has only grown in recent years. Indeed, household incomes remained essentially stagnant between 1970 and 2010, while reported rents nearly doubled. To reduce the burden that households face, the city, state, and federal governments have employed numerous programs to encourage pri-vate developers to own and manage affordable housing developments in exchange for government subsidies. More than 171,000 New York City households currently depend on these subsidies to ensure that their monthly rent remains affordable.
Housing subsidies, and the accompanying rent or income
limits intended to ensure that the housing is affordable, typi-
cally expire after a set time period, allowing the property
owner to convert the units to market rate rent. Until now,
most information about the subsidies has been housed in in-
dividual agency databases, and often in multiple databases
because properties are often developed with several subsi-
dies from different agencies. This makes it difficult for agen-
cies, tenants, and community organizations and leaders to
obtain the comprehensive and up-to-date information about
subsidized properties they need to identify properties that
may leave affordability programs.
With the cooperation and expertise of the city, state, and fed-
eral housing agencies, and the insights of knowledgeable advi-
sory committees, researchers at NYU’s Furman Center for
Real Estate and Urban Policy combined almost 50 datasets to
create a single, online searchable database of privately-owned,
subsidized rental housing. Known as the Subsidized Housing
Information Project (SHIP), the database maps and provides
detailed information about the nearly 2,500 rental properties,
containing nearly 235,000 units, ever financed in New York
City by the following categories of subsidy programs: U.S. De-
partment of Housing and Urban Development (HUD) financ-
ing and insurance programs, HUD project-based rental assis-
tance, the New York City and New York State Mitchell-Lama
programs, or Low-Income Housing Tax Credits (LIHTC).
Though these are not the only sources of subsidies for income
or rent restricted housing, they are the largest subsidy pro-
grams used to develop affordable housing in New York City.
Twenty-nine percent of the units subsidized through these
four program categories receive financing from multiple pro-
grams, and each subsidy may have a different expiration date,
different rent and income limitations, and different regulato-
ry agencies overseeing property conditions. By linking infor-
mation about the properties from all the various agencies (as
well as other sources), the SHIP Database helps users under-
stand those differences. This new resource also allows users to
compare different types of subsidized housing and their dis-
tribution throughout the city, and to identify opportunities
to preserve the affordability of the housing across the various
subsidy programs and administering agencies.
In this report, we present the first detailed analysis of the in-
formation collected in the SHIP Database, in order to provide
the most comprehensive overview available of subsidized
housing in New York City. In the first section of the report, we
provide a brief summary of New York City’s subsidized hous-
ing and the ways in which the major subsidy programs differ
from each other. In the subsequent four sections, we describe
the history of development under the programs in each cate-
gory, report the characteristics of properties developed within
each, and analyze the number of properties and units eligible
to exit each affordability program in the next five years. In the
final section, we discuss the opportunities for preserving af-
fordability by identifying properties across the four portfolios
with subsidies that will expire in the next five years.
executive summary

state of new York citY’s subsid ized housing: 2011 7ExECuTIvE SummARy
properties in the sHip DatabaseThe 2,132 rental properties that currently receive subsidies
through at least one of the four program categories covered
in the SHIP Database contain 171,500 housing units, repre-
senting approximately eight percent of New York City’s total
current rental housing stock. Properties catalogued in the
SHIP Database are located in every borough and nearly every
community district in the city. Manhattan has 65,000 units
located in subsidized properties, the highest number of any
borough. However, the Bronx has the highest share of its
rental housing subsidized by the programs catalogued in the
SHIP Database; 13 percent of Bronx housing units receive fi-
nancing from at least one of the program categories. In con-
trast, Staten Island has just 4,200 units, representing seven
percent of its rental housing stock.
Properties in the SHIP Database tend be larger than typical
New York City properties, with high numbers of units and
slightly larger apartments, generally because they were de-
signed for families rather than single adults. The average pri-
vately-owned subsidized rental property includes 80 units,
compared to 25 for market rate multi-family rental properties
and 540 for public housing. Properties catalogued in the SHIP
Database also tend to be newer than the typical New York City
rental property, with an average age of 72 years compared to
82 years for a market rate multi-family rental property.
More than 62,000 (27%) of the 233,900 units originally fi-
nanced through the four program categories are no longer
subject to affordability restrictions through any of the pro-
grams covered in SHIP. These units may have left the pro-
gram for one of two reasons: because the property owner did
not comply with the subsidy requirements (“failing out”) or
because the program restrictions reached their expiration
date and the owner did not renew the subsidy or enter an-
other subsidy program tracked by the SHIP Database (“opt-
ing out”). Currently, these units may be market rate, rent
stabilized, or subject to affordability restrictions not covered
in the SHIP Database.1
1 If a property failed out of a program catalogued in SHIP, but was preserved by another program in SHIP, is still counted as affordable.
Hud Financing and Insurance Since the 1920s, the Federal Housing Administration and HUD
have financed affordable housing by insuring mortgage loans
made by private banks or directly lending to private developers.
These programs have facilitated the development of 630
properties with 86,600 units of affordable housing in New
York City. Just under half of those properties (309) currently
have HUD financing and insurance; the others are now mar-
ket rate, rent stabilized, or subject to affordability restric-
tions through one of the smaller programs not tracked by the
SHIP Database. Twenty-five of these 309 properties will
reach the end of all affordability restrictions tracked in the
SHIP Database within the next five years.
Hud Project-based Rental AssistanceOne of HUD’s primary financing tools is a direct rental sub-
sidy to property owners who agree to rent units to low or
moderate-income tenants. Project-based rental assistance
programs require landlords to enter into an agreement with
HUD whereby the tenant pays a certain percentage of the
household’s income in monthly rent and HUD pays the own-
er the difference between the tenant’s payment and the
HUD-approved contract rent. Project-based rental assistance
subsidies are the only subsidies provided to privately-owned,
multi-family housing that guarantee that a tenant will not
pay more than 30 percent of his or her income in rent.
Project-based rental assistance was used to develop 697 prop-
erties in New York City, containing 104,000 units. Currently,
593 properties (85% of those originally financed), containing
83,000 units, receive subsidies from a HUD project-based
rental assistance program. Of these, 193 properties have a
contract with fewer than five years remaining and no other
affordability restrictions tracked by the SHIP Database. Four-
teen of these properties have non-renewable contracts expir-
ing in the next five years and will require new subsidies or in-
centives in order to remain affordable; the other 179 properties
have contracts that are renewable at the owner’s discretion.
mitchell-lama ProgramNew York State created the Mitchell-Lama program in 1955 to
address the perceived shortage of safe and sanitary housing for
moderate-to-middle-income families. The program offered de-
velopers of rental and co-op properties free or low-cost land,
property-tax abatements, and subsidized below-market rate
mortgages for up to 95 percent of the project cost. In exchange
for subsidies, developers agreed to regulations regarding rents
charged and tenant selection. The restrictions expire after a set
state of new York citY’s subsid ized housing: 2011 8ExECuTIvE SummARy
period of time, and the property owner then may leave the
program or refinance the loan to remain in the program.
From 1955 to 1978, 174 rental properties, containing 69,800
units, were developed in New York City under the Mitchell-
Lama program. Currently, there are 78 rental properties
(45% of those originally financed), containing 33,700 units,
still receiving Mitchell-Lama subsidies. Twenty-six proper-
ties with 7,500 units are currently eligible to opt out if the
owner gives tenants a year’s notice. In the next five years, one
additional property in Manhattan, with 120 units, will be-
come eligible to opt-out for the first time.
low-Income Housing Tax CreditsCongress authorized the LIHTC program in 1986 to encourage
the private sector to provide financing for affordable housing
developments. Under the LIHTC program, the Internal Reve-
nue Service (IRS) allocates tax credits to state and local hous-
ing agencies, which offer them to developers who build or re-
habilitate affordable housing. The developers then sell the tax
credits to investors in order to raise capital for the project.
The LIHTC program has been the primary source of afford-
able housing development financing nationwide since the
1990s. By the end of 2010, 80,400 units had been financed in
New York City, and nearly all (93%) of those units remain af-
fordable. There are no LIHTC properties that will be eligible
to leave affordability before 2015; however, by 2020, 24
LIHTC properties with 1,700 units will be eligible to exit
affordability and rent their units at the market rate.
preservation opportunitiesOur analysis of the SHIP Database identifies four categories
of affordable properties that warrant attention in the next
five years.
non-renewable programsThirty-four properties, containing nearly 11,000 units, will
reach the end of afford ability requirements imposed by a non-
renewable subsidy program and have no requirements im-
posed by any other SHIP subsidy program. If affordability is to
be maintained, a new subsidy would likely be required to main-
tain affordability for cur rent and future tenants.
Renewable programsBy the end of 2015, 166 properties are set to ex pire from a
renewable program. These programs may be short term con-
tracts, such as project-based Section 8, or they may be longer
term mortgages. In either case, any owner already receiving
subsidies is eligible to take advantage of new or extended
subsi dies under the same program. We are currently conduct-
ing research to identify which of these properties are at the
greatest risk of exiting affordability.
mitchell-lama PropertiesCurrently, 26 Mitchell-Lama properties are already eligible to
leave the program, but have not exercised that option. Owners
of these properties could leave the program after giving one
years’ notice, and have no other financing tracked in the SHIP
Database that would prevent them from leaving the Mitchell
Lama program.
distressed PropertiesNinety-nine properties with HUD financing and insurance or
project-based rental assistance (16% of the total stock of
such buildings) failed their most recent HUD Real Estate As-
sessment Center (REAC) inspection and will require correc-
tive action to avoid foreclosure. They will likely need govern-
ment subsidies to improve building conditions, or may need
new ownership in order to maintain the properties as safe,
quality affordable housing.
We hope that this first report on the city’s subsidized housing
helps arm housing agencies, owners of subsidized housing,
tenants, and community organizations with the information
they need to work together to develop the efficient and effec-
tive preservation efforts today’s fiscal pressures demand. Our
researchers are using the SHIP Database to better understand
the factors leading owners to opt out rather than renew subsi-
dies, with the aim of providing policymakers with an evidence-
based early warning/opportunity system to predict which
properties are at the greatest risk of leaving their affordability
restrictions. We will work with policymakers, tenant advocates,
and the real estate industry to analyze which preservation
strategies have the greatest potential to efficiently preserve af-
fordability for the current and future tenants of those proper-
ties. In these days of limited government resources, targeted,
highly efficient preservation efforts are critical if New York
City is to maintain its extraordinary commitment to housing a
diverse and growing population.
state of new York citY’s subsid ized housing: 2011 9
o ver the past half-century, the city, state, and federal
governments have invested billions of dollars to
support the creation of affordable housing in New
York City. Unlike the earlier model of public housing (in which
government entities developed, constructed, and managed
housing for low-income residents), in the 1960s government
agencies in New York and around the country began to use
subsidies and other incentives to encourage private developers
to build housing affordable to low- and moderate-income
(LMI) households.
Housing subsidies, and the accompanying rent or income lim-
its intended to ensure the housing is affordable, typically ex-
pire after a set time period, allowing developers to convert
their units to market rate or rent stabilized housing. Because
the need for affordable housing persists, government agencies
often try to maintain the reduced rents and income restric-
tions of these properties by providing new subsidies when
such expiration dates approach or property conditions deterio-
rate. It is generally more cost-effective for government agen-
cies to reinvest in existing affordable housing than to build
new units, especially in places like New York City, where devel-
opable land is expensive and scarce. However, efforts to design
and implement programs to preserve affordable housing units
have been hampered by the difficulty of identifying properties
that are likely to leave or fail out of subsidy programs due to
subsidy expiration or poor physical and financial conditions.
This report looks at four main categories of public subsidy pro-
grams used to develop or rehabilitate privately-owned afford-
able rental housing units in New York City. These programs,
described in detail in the next four sections of this report, are
HUD financing and insurance, HUD project-based rental assis-
tance, New York City and New York State Mitchell-Lama, and
the Federal Low-Income Housing Tax Credits (LIHTC). While
these are not the only subsidized affordable housing programs
used in New York City, they are the largest individual subsidy
programs and—to our knowledge—have generated the major-
ity of income or rent-restricted, privately-owned, subsidized
housing in New York City.
Many properties receive subsidies from more than one financ-
ing stream, and each subsidy may have different expiration
dates, impose different rent and income limitations, and re-
quire oversight by different government agencies. Until now,
most information about the subsidies was housed in individ-
ual agency databases. Because there was no mechanism for
matching properties across agency portfolios, it was difficult
for agencies to share information about the properties.
In 2007, concerned that the subsidized housing stock was rap-
idly declining in an overheating housing market, the John D.
and Catherine T. MacArthur Foundation funded a Preservation
Capacity Assessment for the city. The assessment resulted in a
series of recommendations to the five city, state, and federal
agencies charged with administering New York City’s housing
programs, including a suggestion that the agencies create an
Inter-agency Working Group (IWG) to devise strategies to
section 1. introduction
state of new York citY’s subsid ized housing: 2011 10SECTIon 1. InTRoduCTIon
protect the affordability of subsidized properties.1 The assess-
ment also highlighted the need for an independent and objec-
tive source of information about the subsidized housing stock.
Accordingly, the IWG (formed in 2008) selected NYU’s Furman
Center for Real Estate and Urban Policy to create a single data-
base of all properties ever subsidized by HUD, the Mitchell-La-
ma programs, and the LIHTC.
Over the last two and a half years, researchers at the Furman
Center, with the cooperation and expertise of the city, state,
and federal housing agencies, and the insights of knowledge-
able advisory committees, combined 50 datasets with infor-
mation on over 20 unique subsidy programs. The resulting
SHIP Database also incorporates reviews of legal agreements,
mortgages, and other documents in the agencies’ files and in
public records. Further, it standardizes address data and
maps every affordable property ever financed in New York
City using HUD financing or insurance, HUD project-based
rental assistance, Mitchell-Lama, and LIHTC. The SHIP Data-
base, available online at www.furmancenter.org/data/search,
is a unique resource; nowhere else in the country can local
policy makers and housing professionals access such compre-
hensive information on so many properties receiving subsi-
dies from such complex sources.
1 Originally, the IWG included the New York City Department of Housing Pres-ervation and Development (HPD), the New York City Housing Development Corporation (HDC), the New York State Division of Housing and Community Renewal (DHCR), the New York State Housing Finance Agency (HFA), and the U.S. Department of Housing and Urban Development (HUD). In September 2010, DHCR and HFA were integrated into New York State Homes and Com-munity Renewal (HCR).
The MacArthur Foundation’s Window of Opportunity: Pre-
serving Affordable Rental Housing Initiative, the F.B. Heron
Foundation, and Herbert Z. Gold (’40), an alumnus of the
NYU School of Law, all generously supported the develop-
ment of the SHIP Database. The New York City Council has
also committed to support technical assistance and training
for community-based organizations on how to use the data-
base in their preservation efforts and advocacy.
In this report, we present the first comprehensive analysis of
the state of the subsidized properties found in the SHIP Data-
base. The database includes both properties currently receiv-
ing subsidies and properties that once received financing but
no longer do. From 1962 through 2010, a total of 2,454 prop-
erties containing 233,900 units were developed in New York
City through the four subsidy programs catalogued in the SHIP
Database. Of these, 2,132 properties containing 171,500 units
continued to have income or rent limits designed to make
them affordable to low or moderate-income New Yorkers as of
the end of 2010. The other properties have left all of the afford-
ability programs documented in the SHIP Database.
In this introductory section, we discuss the need for afford-
able housing in New York City, briefly describe how the SHIP-
tracked programs have provided affordable housing in New
York City over the last six decades, and explain why some of
the currently-affordable properties may convert to market
rate apartments in the future.
state of new York citY’s subsid ized housing: 2011 11SECTIon 1. InTRoduCTIon
affordable Housing in new York city: a persistent and growing challengeHouseholds with low, moderate, and even middle incomes2
have consistently struggled to find affordable housing in New
York City’s expensive real estate market. Despite the recent
dips in the housing market, both owner-occupied and rental
housing are more expensive today than they were a decade
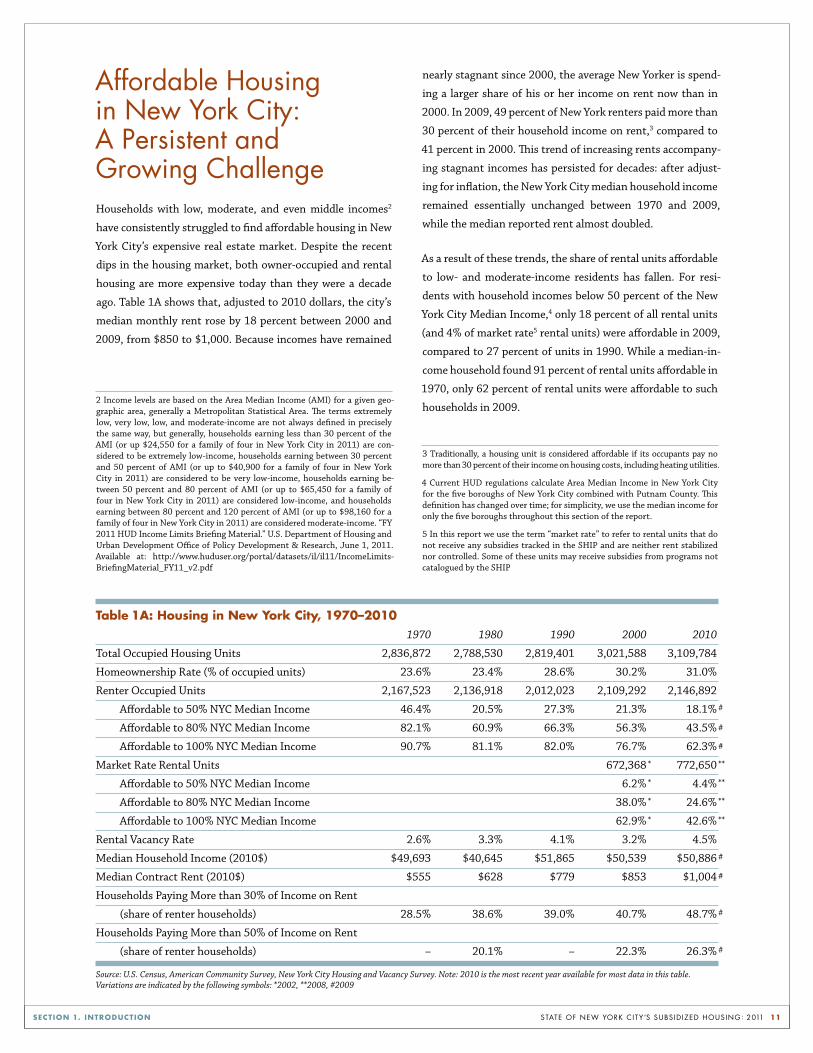
ago. Table 1A shows that, adjusted to 2010 dollars, the city’s
median monthly rent rose by 18 percent between 2000 and
2009, from $850 to $1,000. Because incomes have remained
2 Income levels are based on the Area Median Income (AMI) for a given geo-graphic area, generally a Metropolitan Statistical Area. The terms extremely low, very low, low, and moderate-income are not always defined in precisely the same way, but generally, households earning less than 30 percent of the AMI (or up $24,550 for a family of four in New York City in 2011) are con-sidered to be extremely low-income, households earning between 30 percent and 50 percent of AMI (or up to $40,900 for a family of four in New York City in 2011) are considered to be very low-income, households earning be-tween 50 percent and 80 percent of AMI (or up to $65,450 for a family of four in New York City in 2011) are considered low-income, and households earning between 80 percent and 120 percent of AMI (or up to $98,160 for a family of four in New York City in 2011) are considered moderate-income. “FY 2011 HUD Income Limits Briefing Material.” U.S. Department of Housing and Urban Development Office of Policy Development & Research, June 1, 2011. Available at: http://www.huduser.org/portal/datasets/il/il11/IncomeLimits-BriefingMaterial_FY11_v2.pdf
nearly stagnant since 2000, the average New Yorker is spend-
ing a larger share of his or her income on rent now than in
2000. In 2009, 49 percent of New York renters paid more than
30 percent of their household income on rent,3 compared to
41 percent in 2000. This trend of increasing rents accompany-
ing stagnant incomes has persisted for decades: after adjust-
ing for inflation, the New York City median household income
remained essentially unchanged between 1970 and 2009,
while the median reported rent almost doubled.
As a result of these trends, the share of rental units affordable
to low- and moderate-income residents has fallen. For resi-
dents with household incomes below 50 percent of the New
York City Median Income,4 only 18 percent of all rental units
(and 4% of market rate5 rental units) were affordable in 2009,
compared to 27 percent of units in 1990. While a median-in-
come household found 91 percent of rental units affordable in
1970, only 62 percent of rental units were affordable to such
households in 2009.
3 Traditionally, a housing unit is considered affordable if its occupants pay no more than 30 percent of their income on housing costs, including heating utilities.
4 Current HUD regulations calculate Area Median Income in New York City for the five boroughs of New York City combined with Putnam County. This definition has changed over time; for simplicity, we use the median income for only the five boroughs throughout this section of the report.
5 In this report we use the term “market rate” to refer to rental units that do not receive any subsidies tracked in the SHIP and are neither rent stabilized nor controlled. Some of these units may receive subsidies from programs not catalogued by the SHIP
Table 1A: Housing in new york City, 1970–2010 1970 1980 1990 2000 2010
Total Occupied Housing Units 2,836,872 2,788,530 2,819,401 3,021,588 3,109,784
Homeownership Rate (% of occupied units) 23.6% 23.4% 28.6% 30.2% 31.0%
Renter Occupied Units 2,167,523 2,136,918 2,012,023 2,109,292 2,146,892
Affordable to 50% NYC Median Income 46.4% 20.5% 27.3% 21.3% 18.1%
Affordable to 80% NYC Median Income 82.1% 60.9% 66.3% 56.3% 43.5%
Affordable to 100% NYC Median Income 90.7% 81.1% 82.0% 76.7% 62.3%
Market Rate Rental Units 672,368 772,650
Affordable to 50% NYC Median Income 6.2% 4.4%
Affordable to 80% NYC Median Income 38.0% 24.6%
Affordable to 100% NYC Median Income 62.9% 42.6%
Rental Vacancy Rate 2.6% 3.3% 4.1% 3.2% 4.5%
Median Household Income (2010$) $49,693 $40,645 $51,865 $50,539 $50,886
Median Contract Rent (2010$) $555 $628 $779 $853 $1,004
Households Paying More than 30% of Income on Rent
(share of renter households) 28.5% 38.6% 39.0% 40.7% 48.7%
Households Paying More than 50% of Income on Rent
(share of renter households) – 20.1% – 22.3% 26.3%
Source: U.S. Census, American Community Survey, New York City Housing and Vacancy Survey. Note: 2010 is the most recent year available for most data in this table. Variations are indicated by the following symbols: *2002, **2008, #2009
*
*
*
*
**
**
**
**
#
#
#
#
#
#
#
state of new York citY’s subsid ized housing: 2011 12SECTIon 1. InTRoduCTIon
Although renter households make up a smaller share of all
New York City households today (69%) than they have at any
point in the last four decades, homeownership remains out of
reach for most New Yorkers. Despite housing price declines in
recent years, in 2010, just six percent of home sales were af-
fordable to New Yorkers making the median income. The me-
dian home price for 1-4 family homes and condominiums in
2010 was $507,000, over $200,000 beyond what would be
considered affordable to a household earning the median in-
come. Thus, rental housing remains the only realistic option
for most New Yorkers.
affordable Housing strategies: programs in the sHip Database To reduce the burden that households living in a high cost
market face, the federal, state, and city governments have em-
ployed a myriad of programs to create and maintain afford-
able housing. This first comprehensive report based upon the
information in the SHIP Database analyzes subsidized hous-
ing that received financing from one or more of four major
program categories: HUD financing and insurance, HUD proj-
ect-based rental assistance, Mitchell-Lama programs, and the
LIHTC. While the SHIP Database is not a comprehensive cata-
log of all federal, state, and local programs used to develop
affordable housing, the properties analyzed in this report rep-
resent the largest portfolios of privately-owned, publicly-sub-
sidized, income-limited affordable rental housing in New York
City.6 Together, the programs analyzed in this report provided
financing for properties containing 233,900 units7 of afford-
able housing developed from 1962 to 2010.
The four program categories analyzed in this report share sev-
eral notable similarities. Properties financed through the pro-
grams catalogued by the SHIP Database are privately-owned,
multi-family rental properties funded with a mix of private
capital and public subsidy, which may include below-market
interest rate loans, capital subsidies, rental subsidies, tax ex-
emptions, tax abatements, mortgage insurance, low-cost land,
or other benefits that serve to reduce the cost of housing de-
velopment or operation. The subsidies were used both to con-
struct new housing and to rehabilitate existing properties in
6 Other programs include, for example, the Homeless Housing Assistance Pro-gram, Housing Trust Fund Program, Participation Loan Program (PLP), Article 8A loans, and the Tenant Interim Lease Program. Each of these programs are administered by HUD, New York State Homes and Community Renewal, the Homeless Housing Assistance Corporation or the New York City Department of Housing Preservation and Development. As funding becomes available, the Furman Center intends to incorporate these programs in the SHIP Database.
7 Throughout this report, we count all units in properties that have received subsidies, even though some units in these properties may be market rate. Generally, all of the units in properties developed with HUD financing and in-surance, HUD project-based rental assistance, or Mitchell-Lama subsidies are affordable. In properties with LIHTC financing, at least 20 to 40 percent of units must be affordable; however in the vast majority of LIHTC properties a much larger share of units are subsidized. Given the data available, we can-not reliably estimate the number of units that were ever rent-restricted or the number that currently are rent-restricted.
state of new York citY’s subsid ized housing: 2011 13SECTIon 1. InTRoduCTIon
substandard condition. In exchange for these subsidies, the
developers or owners of these properties must agree to spe-
cific rent and/or tenant-income restrictions to ensure that the
properties are affordable to low, moderate, or middle-income
families. However, in order to make such arrangements at-
tractive to private developers, the rent restrictions for each of
the programs expire after a set number of years, which varies
across programs. These expiration dates allow the developer
to benefit from the subsidy during the set term and gain full
decision-making authority over rent levels and maintenance
investments in the future.
While the four categories of programs covered in the SHIP Da-
tabase share a basic model of private ownership, public subsi-
dy, and income or rent restrictions, they differ from one an-
other in important and complex ways. First, each is funded
and administered by a different agency. HUD funds and ad-
ministers both the HUD financing and insurance programs
and project-based rental assistance programs, while several
different state and local agencies have funded, refinanced, or
monitored Mitchell-Lama developments. The IRS regulates
the LIHTC program, but the program is administered by state
and city agencies.
Each program also uses a different mix of subsidy types and a
unique method for allocating funds. For example, the project-
based rental assistance program guarantees that tenants pay
no more than 30 percent of their income on rent by subsidiz-
ing the difference between that amount and market rents
through supplemental payments directly to the owner.8 Other
programs offer low-interest loans and property tax abate-
ments, rather than direct operating subsidies. Some programs
provide funds to any development meeting certain criteria;
others, such as certain LIHTC programs, require a competi-
tive application process.
8 Rental Assistance Payments and Rental Charges, 24 C.F.R. § 236.735 (2010).
The programs covered by the SHIP incentivize developers to
create housing that is affordable to different populations.
Most HUD project-based rental assistance properties target
low-income households (less than 80% of AMI), while Mitch-
ell-Lama properties target moderate- and middle-income
households (80–130% of AMI) and LIHTC targets households
making 50 to 60 percent of AMI. Further, some programs are
restricted to special needs populations such as the elderly or
disabled.
Additionally, each program uses a different method to calcu-
late affordable rents. LIHTC rents, for instance, are based on
the rate that the target population should be able to pay, while
Mitchell-Lama rents were initially set through the negotia-
tion process with the administering agency based on average
rents and projected operating costs, among other factors.
Finally, the programs vary in the process owners must use to
leave the program (and thereby avoid its affordability
restrictions).9 Some programs, such as HUD project-based
rental assistance, require specific rent restrictions and income
guidelines throughout the length of the contract, but impose
no obligations on landlords after the contracts end. Other
programs, such as Mitchell-Lama, require affordability for a
specific duration, but even after that period has elapsed prop-
erty owners must actively opt out in order to leave the pro-
gram. Some HUD financing and insurance programs, on the
other hand, require affordability for the duration of the mort-
gage, which could be 40 years, but allow property owners to
refinance to a private mortgage and thereby avoid the pro-
gram’s affordability restrictions after 20 years.
9 Properties that were developed and occupied prior to January 1, 1974 may become subject to rent stabilization upon leaving the affordability programs tracked in the SHIP. However, as discussed in the box Affordable Housing De-velopment Strategies: Other Approaches on page 14, rent stabilization is not a means-tested program and is not considered an extension of affordability re-strictions.

state of new York citY’s subsid ized housing: 2011 14SECTIon 1. InTRoduCTIon
affordable housing development strategies: other approaches
Public-private development partnerships are not the
only strategy policymakers have employed in the past 50
years to create affordable housing. Two other subsidy
strategies also have created significant affordable hous-
ing opportunities: public housing, which is directly
owned and operated by the government, and tenant-
based rental vouchers. These subsidy programs differ
from SHIP programs in critical ways, including their fi-
nancing approach, administration, and likelihood of per-
petual affordability. Additionally, rent regulation, which
is not a government subsidy program, is also used to
make rental units more affordable to tenants.
Public housing provides approximately 178,000 units
for low-income households. Unlike units tracked in the
SHIP Database, their initial development was entirely
financed through a mix of federal, state, and city funds,
with no private capital.10 Additionally, they are managed
directly by the New York City Housing Authority
(NYCHA), rather than through public-private partner-
ships. Finally, existing units remain in the program in-
definitely; greatly reducing the risk that they will be con-
verted to market-rate units.
Over 120,000 households in New York City receive Sec-
tion 8 vouchers from HUD, NYCHA, or HPD to supple-
10 In a notable exception, the New York City Housing Authority (NYCHA) sold 21 of its developments to a limited partnership between the agency and Citigroup in 2010 in order to fund their rehabilitation. The sale qualified the developments for federal subsidies under a provi-sion of the American Recovery and Reinvestment Act of 2009 that sup-ported “mixed-finance modernization” of public housing. In addition, the Hope for Elderly Independence (HOPE VI) program and so-called
“mixed financing” create redevelopment opportunities for public housing that introduce the use of private debt and LIHTCs. Proposals are under consideration to expand the use of mixed financing and to convert pub-lic housing operating subsidies to Section 8, while maintaining public control over ownership of this housing. See Cara Buckley, “City’s Public Housing Agency Gets $305 Million in Aid,” N.Y. Times, Mar. 15, 2010 at A21; New York City Housing Authority, “NYCHA Seeks to Qualify its 21 State and City Public Housing Developments for Federal Public Hous-ing Subsidies through a Unique Opportunity Provided by the Federal Government’s Economic Stimulus Program,” http://www.nyc.gov/html/nycha/downloads/pdf/federalization _factsheet_English.pdf.
ment their rent payments to private property owners in
market-rate or subsidized units. Because these vouchers
are tenant-based, rather than tied to a specific property,
the payments are transferred to a new rental unit if the
tenant moves, and the original landlord must find a new
tenant (who will not necessarily have a voucher).11 While
these tenant-based subsidies are not tracked in the SHIP
Database, some voucher holders do live in properties ana-
lyzed in this report.
New York City’s rent stabilization and rent control sys-
tems also make some apartments more affordable to their
tenants. Those programs, however, are not means-test-
ed—eligibility for the apartments is not limited to house-
holds who can prove that they earn low, moderate, or
middle incomes. The rent restrictions therefore are not
necessarily providing affordable housing to the house-
holds that affordability programs target. However, on av-
erage, stabilized apartments serve households with lower
incomes than market rate apartments. In 2008, the me-
dian income of households living in stabilized units was
$36,000, compared to $50,000 for households living in
market-rate rental units. Over 50 percent of rental units
in the city are governed by rent stabilization or rent con-
trol. Properties governed by rent stabilization are mark-
edly different from SHIP properties. Rent-stabilized
property owners do not receive a public subsidy to com-
pensate for rent restrictions (although, owners can
choose to enter new units into rent regulation by accept-
ing tax abatements or incentives).12
11 In recent years in New York City, some new developments have been coupled with Section 8 vouchers for all tenants. However, unlike a proj-ect-based voucher, these vouchers stay with the tenant when they leave the building. Therefore, only the original tenants are guaranteed vouch-ers, and future tenants will pay the full rent. Properties developed with these vouchers are not included in the SHIP Database.
12 Units financed by Mitchell-Lama, HUD project-based rental assis-tance or HUD financing and insurance may have contracts requiring units to enter rent stabilization after their subsidy period ends, or may apply for tax abatements which require the properties to enter rent sta-bilization.
state of new York citY’s subsid ized housing: 2011 15SECTIon 1. InTRoduCTIon
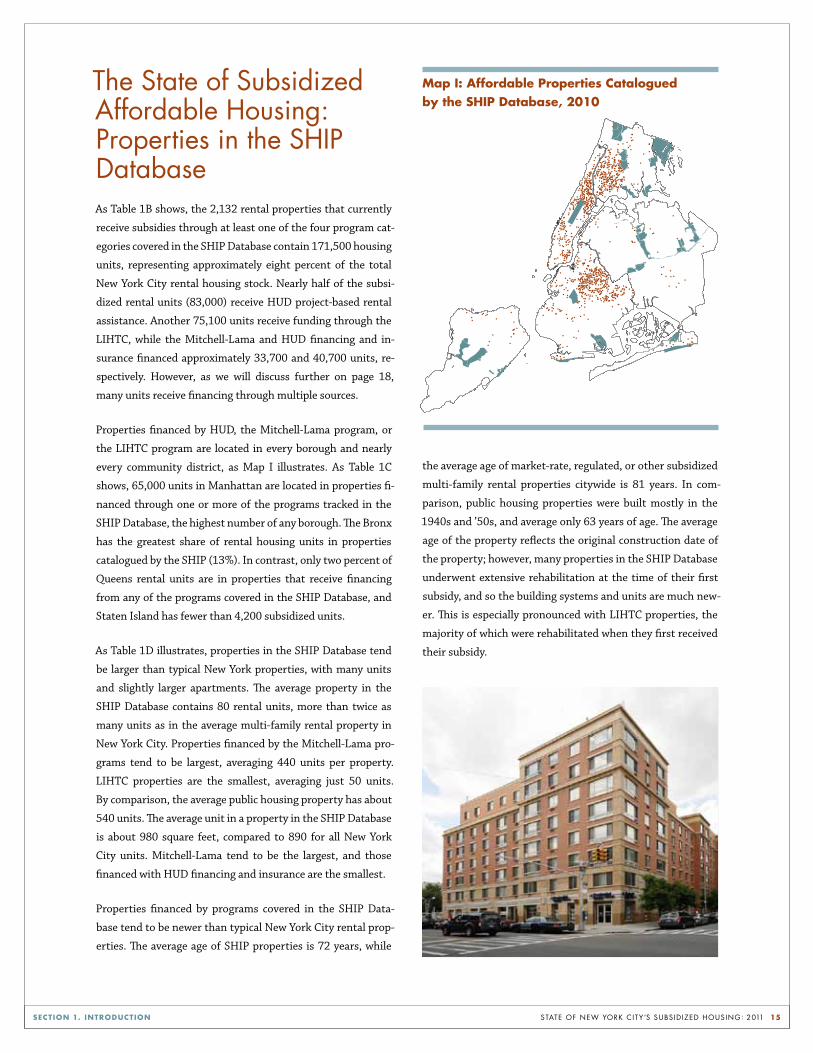
the state of subsidized affordable housing: properties in the sHip DatabaseAs Table 1B shows, the 2,132 rental properties that currently
receive subsidies through at least one of the four program cat-
egories covered in the SHIP Database contain 171,500 housing
units, representing approximately eight percent of the total
New York City rental housing stock. Nearly half of the subsi-
dized rental units (83,000) receive HUD project-based rental
assistance. Another 75,100 units receive funding through the
LIHTC, while the Mitchell-Lama and HUD financing and in-
surance financed approximately 33,700 and 40,700 units, re-
spectively. However, as we will discuss further on page 18,
many units receive financing through multiple sources.
Properties financed by HUD, the Mitchell-Lama program, or
the LIHTC program are located in every borough and nearly
every community district, as Map I illustrates. As Table 1C
shows, 65,000 units in Manhattan are located in properties fi-
nanced through one or more of the programs tracked in the
SHIP Database, the highest number of any borough. The Bronx
has the greatest share of rental housing units in properties
catalogued by the SHIP (13%). In contrast, only two percent of
Queens rental units are in properties that receive financing
from any of the programs covered in the SHIP Database, and
Staten Island has fewer than 4,200 subsidized units.
As Table 1D illustrates, properties in the SHIP Database tend
be larger than typical New York properties, with many units
and slightly larger apartments. The average property in the
SHIP Database contains 80 rental units, more than twice as
many units as in the average multi-family rental property in
New York City. Properties financed by the Mitchell-Lama pro-
grams tend to be largest, averaging 440 units per property.
LIHTC properties are the smallest, averaging just 50 units.
By comparison, the average public housing property has about
540 units. The average unit in a property in the SHIP Database
is about 980 square feet, compared to 890 for all New York
City units. Mitchell-Lama tend to be the largest, and those
financed with HUD financing and insurance are the smallest.
Properties financed by programs covered in the SHIP Data-
base tend to be newer than typical New York City rental prop-
erties. The average age of SHIP properties is 72 years, while
the average age of market-rate, regulated, or other subsidized
multi-family rental properties citywide is 81 years. In com-
parison, public housing properties were built mostly in the
1940s and ’50s, and average only 63 years of age. The average
age of the property reflects the original construction date of
the property; however, many properties in the SHIP Database
underwent extensive rehabilitation at the time of their first
subsidy, and so the building systems and units are much new-
er. This is especially pronounced with LIHTC properties, the
majority of which were rehabilitated when they first received
their subsidy.
•
••
•
•
•
•
•
•
•
•
•
••
••
••
•
•
• •
•
•
•
•
•
•
••
•
•
•
•
•
••
•
•
•
•
••
•
•••
•
•
•
•
••
••
•
••
•
•
•
•
••
••
•
•
•
•
•
•
•
•
••
•
•
•
•
•
•
•
•
•
•
•
•
•
•
•
•
••
•
•
•
•
••
•
•
•
•
•
•
•
•
•
•
••
••
••
•
•
•
•
•
•
•
•
•
•
•
•
•
•
•
•
•
•
•
• ••
•
•
•
•
••
•
•
•
•
•
•
•
•
•
••
•
••
•
•
•
•
•
•
•
•
• ••
•
•
•
•
•
•
•
•
•
•
•
•
•
•
•
••
•
•
•
•
•
• ••
•
••
•
••
•
•
•
•
•
•
•
•
•
•
•
•
•
••
•
•
•
•
••
•
•
••
•
•
•
•
•
•
••
•
•
•
• •
•
•
•
•
•
••
•
•
•
•
•
•
•
•
•••
•
•
•
•
•
••
•
• • •
•
•
•
•
•
•
•
•
•
•
•
•
•
••
••
•
•
•
•
•
•
•
•
•
•
•
•
•
•
•
•
•
•
•
•
•
•
•
•••
•
•
•
•
••
•
•
•••
•
•
• ••
••
••
•
•
•
•
•
•
•
•
•
•
•
•
••
•
•
•
•
•
•
•
•
•
•
•
•
•
•
•
••
••
•
•
•
•
•
•
•
•
•
•
•
•
•••
•
•
••
•
•
•
•
•
•
•
•
••
••
•
•
•
•
•
•
•
•
••
•
•
•
•
••
•
•
•
•
•
••
•
•
•
•
•
•
•
•
•
•
•
•
•
•
•
•
•
•
•
••
•
••
•
•
•
•
•
•
•
• • •••
• •
•••
•
•
•
•
•
•
•
•
•
•
•
•
••
•
•
•
•
•
•
•
•
•
•
•
••• ••
••
••
••
••
•
•
•
•
•
•
•
•
•
•
•
•••
•
•
•••
• •
•• •
•
•
••
•
•
•
••
•
••
•
••••
•
••
•
•
••
•
•
•
•
•
•
•
• •
•
•
•
•
•
• •
•
•
•
•
•
•
•
•
•
•
•
••
•
•
•
•
•
•
••
•
•
•
•
•
•
•
•
•
•
•
•
•
•
••
•
•
•
•
• •
•
••
•
•
•
•
••
•
•
•
•
•
••
•
•
••
•
••
•
•
•
•
•
•
•
•
•
•
•
•
••
•
•
••
•
•
•
• •
••
• •
•
• •• ••
• ••
•
•
• ••••••••
•••
•
•
•
••• ••
•
•
••
•
•
•
•
•
•
•
•
• •••
•••
••
•
•
•
••
•••
•
•• •••
••
• •••
••
•
•
•• •••
••
•
••••
•
•
•
•
•
•
••
•
•
••
•••
•
••••••
•
•• •
• •••••
•
•
•
•
•
•
•
••• ••
•
•
••• •
•
•
• • •
••••
•
•
•• •• •
•
•
••
•
••
••
••••
•••••
•
•••
••
•
••••
•
•
•
•
•
•
• ••••
•
••••
•
•
•
••
••
•
•
•••
••
••• •••
••
•
•
•
•
•
•
••
••• • •••••
•
•
•
•
•
•
•
•
•
•
••
•
•
•
•
••
•
•
••
•
•
•
•••
•
•
•
•
•
•
•
•
••
•
• •
•
•
••
•
••
•
• •• •••
•
••
•
•
•••••
•
• •
•••••••
•
•••••
••
• •
•• •••••
•
•
•
••
•
••• ••••
•
•
•
•
••
•
•
•
•• •
••••
•
••
•
•
•••
••
••
•
•••
•
•••• ••••
•
••• •••
•
•
•
••
•••••••••
•
• •••
•••
•
•
••
••
•
••••
•
•
•
••
•••
•
•
•••
• •••
••
••••
••• •••
•••••• •• •
•• ••
••••
•
•
•••••
•
•
••
•••
•• • •••
•
•
•
•
•
•
•
•
••••
•
••
••
••• ••••
•
•••••
• •• •• •
••
••
•
••
•
•
•
•
•••
•
•
••
•
map I: Affordable Properties Catalogued by the SHIP database, 2010

state of new York citY’s subsid ized housing: 2011 16SECTIon 1. InTRoduCTIon
Table 1d: Property Characteristics Average Number of Average Square Footage Average Years Since Average Years Since Units per Property per Unit Property Construction First Subsidy
All SHIP Properties 80 980 72 15
HUD Financing or Insurance Program 130 910 44 24
HUD Project-based Rental Assistance 140 920 57 27
Mitchell-Lama 440 1,500 40 38
LIHTC 50 980 78 10
Other Rental Properties
Public Housing 540 900 63 –
Market Rate, Regulated, and Other Subsidized Rentals 25 880 82 –
All NYC Multifamily Rental Units 30 890 81 –
Table 1C: Rental Housing Stock by Borough, 2010 Bronx Brooklyn Manhattan Queens Staten Island New York City
Total Number of Rental Units 390,348 662,615 589,885 444,663 59,381 2,146,892
Units in Properties Catalogued by the SHIP Database 48,932 42,927 65,030 10,463 4,192 171,544
Share of Rental Units that are in Properties Catalogued by the SHIP Database 12.5% 6.5% 11.0% 2.4% 7.1% 8.0%
Table 1B: new york City Housing Stock, 2010 Share of all NYC Share of all NYC Units Rental Units in (Rental and Ownership) Unit Type Total Units Program in Program
Occupied Rental Units 2,146,892
SHIP Properties 171,544 8.0% 5.6%
HUD Financing or Insurance Program 40,701 1.9% 1.3%
HUD Project-based Rental Assistance 82,981 3.9% 2.7%
Mitchell-Lama 33,680 1.6% 1.1%
LIHTC 75,076 3.5% 2.4%
Other Programs that Provide Affordable Housing
Public Housing 178,017 8.3% 5.7%
Tenant Based Section 8 Vouchers 123,843 5.8% 4.0%
Rent Control/Stabilization 1,063,148 49.5% 34.2%
Market Rate and Other Subsidized Rentals 772,650 36.0% 24.8%
Occupied Ownership Units 962,892
Mitchell-Lama Coops 65,612 2.1%
Other Ownership Units 897,280 28.9%
All Occupied Housing Units 3,109,784 Note: Figures in this table do not add up to totals because properties may receive funding support from multiple program categories, and some subsidized proper-ties may also be rent stabilized. Ownership units include cooperative apartments, condominiums, and one-to-four family homes. Units in affordability programs not captured by the SHIP Database may appear in either the rent stabilized or market rate and other subsidized rental categories.
state of new York citY’s subsid ized housing: 2011 17SECTIon 1. InTRoduCTIon
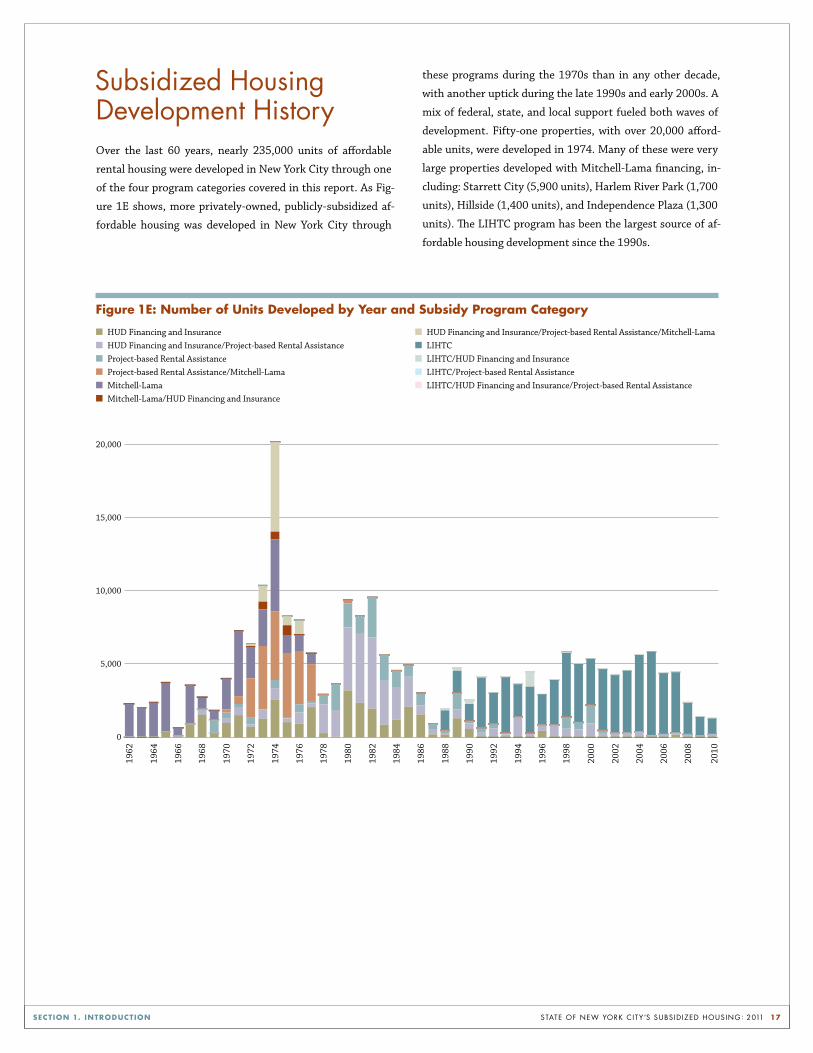
Figure 1E: number of units developed by year and Subsidy Program Category
n HUD Financing and Insurancen HUD Financing and Insurance/Project-based Rental Assistancen Project-based Rental Assistancen Project-based Rental Assistance/Mitchell-Laman Mitchell-Laman Mitchell-Lama/HUD Financing and Insurance
n HUD Financing and Insurance/Project-based Rental Assistance/Mitchell-Laman LIHTCn LIHTC/HUD Financing and Insurancen LIHTC/Project-based Rental Assistancen LIHTC/HUD Financing and Insurance/Project-based Rental Assistance
subsidized Housing Development History Over the last 60 years, nearly 235,000 units of affordable
rental housing were developed in New York City through one
of the four program categories covered in this report. As Fig-
ure 1E shows, more privately-owned, publicly-subsidized af-
fordable housing was developed in New York City through
these programs during the 1970s than in any other decade,
with another uptick during the late 1990s and early 2000s. A
mix of federal, state, and local support fueled both waves of
development. Fifty-one properties, with over 20,000 afford-
able units, were developed in 1974. Many of these were very
large properties developed with Mitchell-Lama financing, in-
cluding: Starrett City (5,900 units), Harlem River Park (1,700
units), Hillside (1,400 units), and Independence Plaza (1,300
units). The LIHTC program has been the largest source of af-
fordable housing development since the 1990s.
0
5,000
10,000
15,000
20,000
1962
1964
1966
1968
1970
1972
1974
1976
1978
1980
1982
1984
1986
1988
1990
1992
1994
1996
1998
2000
2002
2004
2006
2010
2008

state of new York citY’s subsid ized housing: 2011 18SECTIon 1. InTRoduCTIon
Table 1g: Currently Affordable Properties in the SHIP database That Receive Financing Through listed Programs Properties Units
421(a) or J-51 Tax Abatements 1,135 53.2% 56,281 32.8%
HDC Bonds 191 9.0% 26,009 15.2%
HFA Bonds 5 0.2% 1,318 0.8%
HUD Insurance Without Affordability Restrictions 94 4.4% 13,572 7.9%
Inclusionary Zoning 16 0.8% 1,370 0.8% Note: There are several other programs such as 420(c), Article 8A, Article XI and Article V that likely overlap with properties in the SHIP Database but are not included in this table because the data about those subsidies are not available.
Table 1F: overlap of Financing Sources Across Currently Affordable Properties
HUD Financing HUD Project-based Number of Number of Subsidy Sources LIHTC Mitchell-Lama and Insurance Rental Assistance Properties Units
Single Subsidy Source ✓ 1,468 70,239
Single Subsidy Source ✓ 36 11,408
Single Subsidy Source ✓ 21 4,884
Single Subsidy Source ✓ 274 34,912
Total Single Subsidy Source 1,800 121,577
Two Subsidy Sources ✓ ✓ 2 82
Two Subsidy Sources ✓ ✓ 21 2,898
Two Subsidy Sources ✓ ✓ 8 1,730
Two Subsidy Sources ✓ ✓ 19 10,607
Two Subsidy Sources ✓ ✓ 253 23,611
Total Two Subsidy Sources 303 38,928
Three Subsidy Sources ✓ ✓ ✓ 1 559
Three Subsidy Sources ✓ ✓ ✓ 11 1,018
Three Subsidy Sources ✓ ✓ ✓ 13 9,230
Total Three Subsidy Sources 25 10,807
Four Subsidy Sources ✓ ✓ ✓ ✓ 1 146
Total 2,129 171,458 Note: There are three additional properties with 86 units that have left the LIHTC program but remain affordable through inclusionary zoning regulations. They are counted as affordable throughout the remainder of this report, but are not reported in this table.
Many of the properties financed through SHIP programs re-
ceived financing from multiple sources. Table 1F shows the
overlap of SHIP financing sources across the 2,100 currently-
affordable properties. Fifteen percent of those proper ties, con-
taining 29 percent of units, currently receive financ ing through
multiple SHIP programs. Over 88 percent of currently active
units financed with HUD financing and insur ance are also re-
ceiving subsidies from other SHIP programs, while only 6 per-
cent of units using the LIHTC have other SHIP subsidy sources.
Additionally, financing through any of the four program cate-
gories can be combined with other incentives. As Table 1G
shows, 9 percent of properties in the SHIP Database receive
additional financing through the New York State Housing Fi-
nance Agency, or through New York City Housing Develop-
ment Corporation bonds. An additional 53 percent benefit
from city tax abatement programs, including 421-a and J-51
abatements. Oftentimes, these additional financing sources
have their own affordability restrictions and expiration dates.
state of new York citY’s subsid ized housing: 2011 19SECTIon 1. InTRoduCTIon
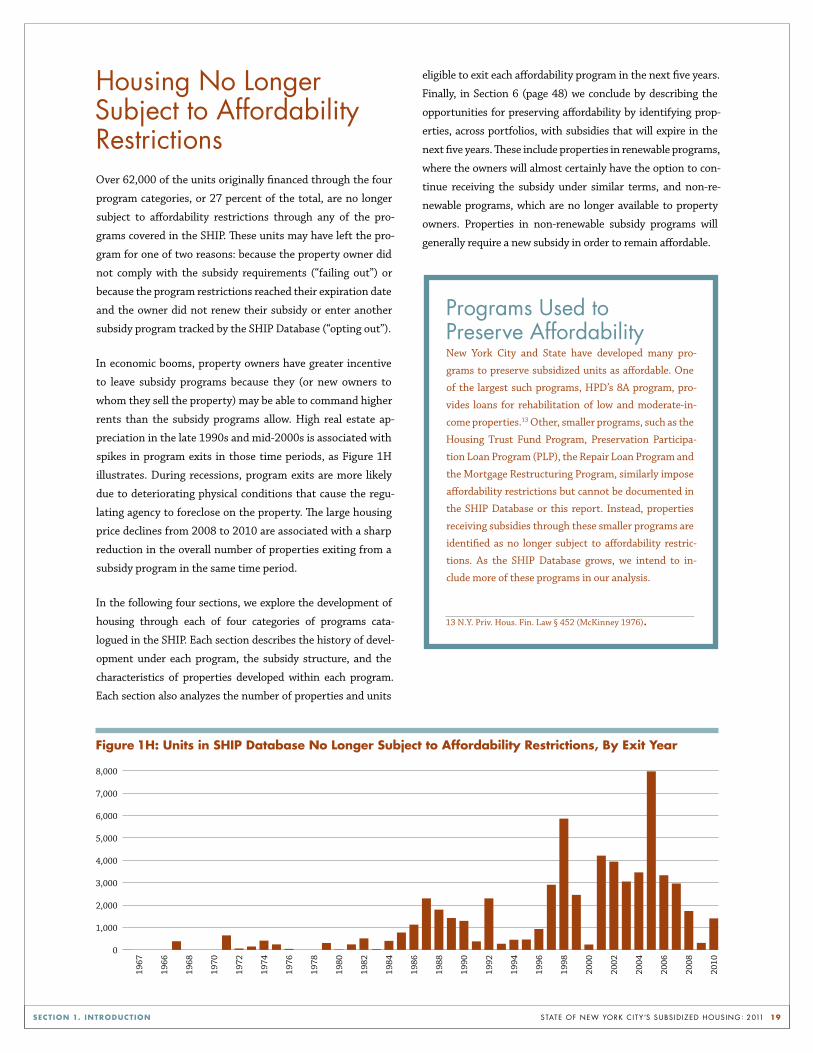
Housing no longer subject to affordability restrictionsOver 62,000 of the units originally financed through the four
program categories, or 27 percent of the total, are no longer
subject to affordability restrictions through any of the pro-
grams covered in the SHIP. These units may have left the pro-
gram for one of two reasons: because the property owner did
not comply with the subsidy requirements (“failing out”) or
because the program restrictions reached their expiration date
and the owner did not renew their subsidy or enter another
subsidy program tracked by the SHIP Database (“opting out”).
In economic booms, property owners have greater incentive
to leave subsidy programs because they (or new owners to
whom they sell the property) may be able to command higher
rents than the subsidy programs allow. High real estate ap-
preciation in the late 1990s and mid-2000s is associated with
spikes in program exits in those time periods, as Figure 1H
illustrates. During recessions, program exits are more likely
due to deteriorating physical conditions that cause the regu-
lating agency to foreclose on the property. The large housing
price declines from 2008 to 2010 are associated with a sharp
reduction in the overall num ber of properties exiting from a
subsidy program in the same time period.
In the following four sections, we explore the development of
housing through each of four categories of programs cata-
logued in the SHIP. Each section describes the history of devel-
opment under each program, the subsidy structure, and the
characteristics of properties developed within each program.
Each section also analyzes the number of properties and units
eligible to exit each affordability program in the next five years.
Finally, in Section 6 (page 48) we conclude by describing the
opportunities for preserving affordability by identifying prop-
erties, across portfolios, with subsidies that will expire in the
next five years. These include properties in renewable programs,
where the owners will almost certainly have the option to con-
tinue receiving the subsidy under similar terms, and non-re-
newable programs, which are no longer available to property
owners. Properties in non-renewable subsidy programs will
generally require a new subsidy in order to remain affordable.
programs used to preserve affordability New York City and State have developed many pro-
grams to preserve subsidized units as affordable. One
of the largest such programs, HPD’s 8A program, pro-
vides loans for rehabilitation of low and moderate-in-
come properties.13 Other, smaller programs, such as the
Housing Trust Fund Program, Preservation Participa-
tion Loan Program (PLP), the Repair Loan Program and
the Mortgage Restructuring Program, similarly impose
affordability restrictions but cannot be documented in
the SHIP Database or this report. Instead, properties
receiving subsidies through these smaller programs are
identified as no longer subject to affordability restric-
tions. As the SHIP Database grows, we intend to in-
clude more of these programs in our analysis.
13 N.Y. Priv. Hous. Fin. Law § 452 (McKinney 1976).
Figure 1H: units in SHIP database no longer Subject to Affordability Restrictions, By Exit year
1967
1966
1968
1970
1972
1974
1976
1978
1980
1982
1984
1986
1988
1990
1992
1994
1996
1998
2000
2002
2004
2006
2008
2010
0
1,000
2,000
3,000
4,000
5,000
6,000
7,000
8,000
state of new York citY’s subsid ized housing: 2011 20
I n 1965, President Lyndon B. Johnson signed the law creat-
ing the U.S. Department of Housing and Urban Develop-
ment.1 Since then, HUD has employed several means of fi-
nancing the development of housing across the country,
including mortgage insurance, direct loans, direct grants, and
operating support. In this section, we will explore the mort-
gage financing and insurance programs HUD offers through
the Federal Housing Administration (FHA), which guarantees
private mortgages that non-profit or for-profit developers use
to finance affordable housing projects.
HUD financing and insurance reduce risk for lenders, which
makes some private mortgage lenders willing to provide capi-
tal for projects they would otherwise consider too risky, and
allows some lenders to lend at lower rates, providing an indi-
rect subsidy to the developer. This section will also discuss sub-
sidized mortgages, through which HUD provides a direct sub-
sidy to the lender to reduce the interest rate, and low-cost
loans and grants HUD provides directly to developers.
In New York City, 630 properties with 86,600 units have been
financed using HUD financing and insurance programs, and
309 properties with 40,700 units still have HUD financing and
insurance today. An additional 170 properties with 22,000
units no longer have HUD financing and insurance but remain
affordable through another program catalogued by the SHIP,
and 151 properties have left all affordability programs cata-
logued by the SHIP.
1 Department of Housing and Urban Development Act, Pub. L. No. 89-174 (1965) (codified at 42 U.S.C. § 3532 (2006)).
programs for low- and moderate-income FamiliesWhen HUD was established, it assumed management of sev-
eral key FHA mortgage insurance programs, including Section
221(d)(3), Section 221(d)(3) Below Market Interest Rate
(BMIR), and Section 221(d)(4). These programs were autho-
rized by the National Housing Act of 1961 and administered
by the FHA before HUD assumed responsibility.2 The Section
221(d)(3) and 221(d)(4) programs, which still exist today, al-
low developers to obtain HUD mortgage insurance to finance
the construction or substantial rehabilitation of multi-family
housing for low- and moderate-income families.3 Non-profit
developers are able to obtain guarantees for 100 percent of
their financing under Section 221(d)(3), and for-profit devel-
opers can receive guarantees of up to 90 percent under Sec-
tion 221(d)(4).4, 5 In exchange for HUD financing and insur-
ance, developers are required to set rents at levels affordable
to low- and moderate-income families, based on a property’s
costs, after negotiations with HUD. HUD must approve rent
increases in these projects for the length of the mortgage.6
2 National Housing Act of 1961, Pub. L. No. 87-70 (codified as amended at 12 U.S.C. § 1715l (2006)).3 Although the Housing Act included the language “low- and moderate- in-come,” there were never formal income limits set for occupancy of 221(d)(3) and 221(d)(4) projects.
4 Housing for Moderate Income and Displaced Families, 12 U.S.C. § 1715l(d)(3)-(4) (2006).
5 In 1977, after the Supplemental Housing Authorization Act was passed, non-profit and public developers were also able to use 221(d)(4). However, in prac-tice few did because the 221(d)(3) program was more attractive.
6 HUD Handbook 4350.1 REV-1, Multifamily Asset Management and Project Servicing, ch. 7 (1992).
section 2. hud financing and insurance
state of new York citY’s subsid ized housing: 2011 21SECTIon 2. Hud FInAnCIng And InSuRAnCE
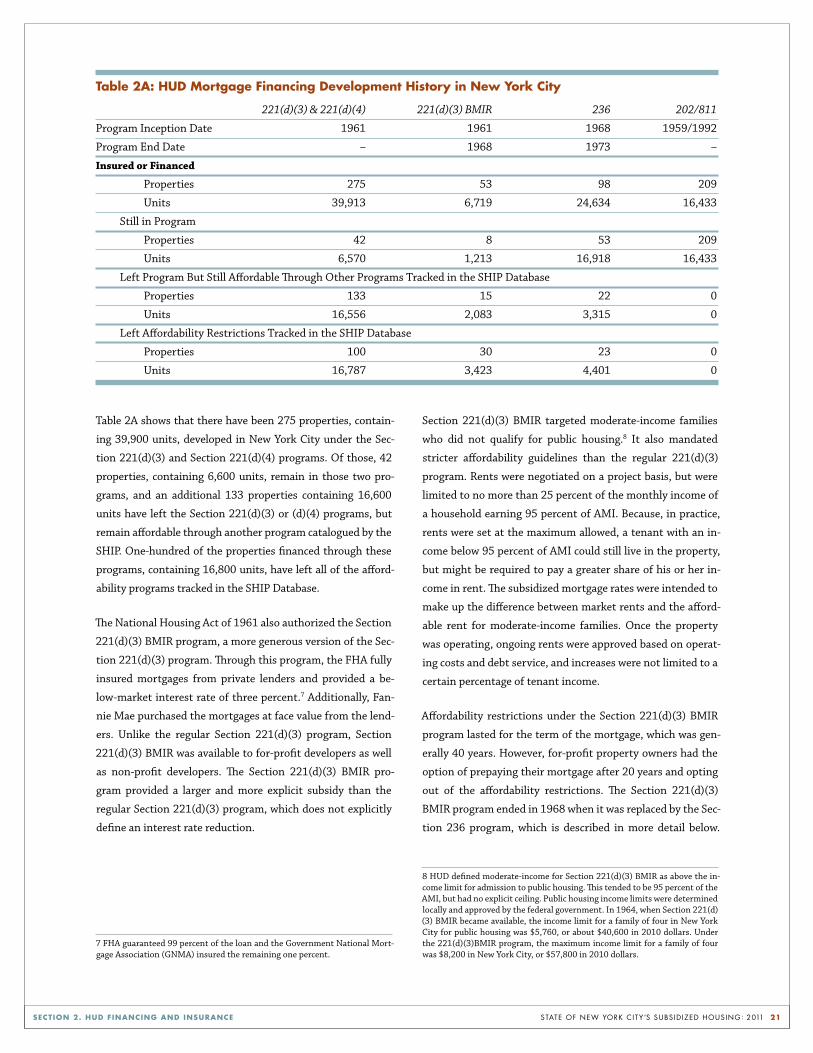
Table 2A shows that there have been 275 properties, contain-
ing 39,900 units, developed in New York City under the Sec-
tion 221(d)(3) and Section 221(d)(4) programs. Of those, 42
properties, containing 6,600 units, remain in those two pro-
grams, and an additional 133 properties containing 16,600
units have left the Section 221(d)(3) or (d)(4) programs, but
remain affordable through another program catalogued by the
SHIP. One-hundred of the properties financed through these
programs, containing 16,800 units, have left all of the afford-
ability programs tracked in the SHIP Database.
The National Housing Act of 1961 also authorized the Section
221(d)(3) BMIR program, a more generous version of the Sec-
tion 221(d)(3) program. Through this program, the FHA fully
insured mortgages from private lenders and provided a be-
low-market interest rate of three percent.7 Additionally, Fan-
nie Mae purchased the mortgages at face value from the lend-
ers. Unlike the regular Section 221(d)(3) program, Section
221(d)(3) BMIR was available to for-profit developers as well
as non-profit developers. The Section 221(d)(3) BMIR pro-
gram provided a larger and more explicit subsidy than the
regular Section 221(d)(3) program, which does not explicitly
define an interest rate reduction.
7 FHA guaranteed 99 percent of the loan and the Government National Mort-gage Association (GNMA) insured the remaining one percent.
Section 221(d)(3) BMIR targeted moderate-income families
who did not qualify for public housing.8 It also mandated
stricter affordability guidelines than the regular 221(d)(3)
program. Rents were negotiated on a project basis, but were
limited to no more than 25 percent of the monthly income of
a household earning 95 percent of AMI. Because, in practice,
rents were set at the maximum allowed, a tenant with an in-
come below 95 percent of AMI could still live in the property,
but might be required to pay a greater share of his or her in-
come in rent. The subsidized mortgage rates were intended to
make up the difference between market rents and the afford-
able rent for moderate-income families. Once the property
was operating, ongoing rents were approved based on operat-
ing costs and debt service, and increases were not limited to a
certain percentage of tenant income.
Affordability restrictions under the Section 221(d)(3) BMIR
program lasted for the term of the mortgage, which was gen-
erally 40 years. However, for-profit property owners had the
option of prepaying their mortgage after 20 years and opting
out of the affordability restrictions. The Section 221(d)(3)
BMIR program ended in 1968 when it was replaced by the Sec-
tion 236 program, which is described in more detail below.
8 HUD defined moderate-income for Section 221(d)(3) BMIR as above the in-come limit for admission to public housing. This tended to be 95 percent of the AMI, but had no explicit ceiling. Public housing income limits were determined locally and approved by the federal government. In 1964, when Section 221(d)(3) BMIR became available, the income limit for a family of four in New York City for public housing was $5,760, or about $40,600 in 2010 dollars. Under the 221(d)(3)BMIR program, the maximum income limit for a family of four was $8,200 in New York City, or $57,800 in 2010 dollars.
Table 2A: Hud mortgage Financing development History in new york City
221(d)(3) & 221(d)(4) 221(d)(3) BMIR 236 202/811
Program Inception Date 1961 1961 1968 1959/1992
Program End Date – 1968 1973 –
Insured or Financed
Properties 275 53 98 209
Units 39,913 6,719 24,634 16,433
Still in Program
Properties 42 8 53 209
Units 6,570 1,213 16,918 16,433
Left Program But Still Affordable Through Other Programs Tracked in the SHIP Database
Properties 133 15 22 0
Units 16,556 2,083 3,315 0
Left Affordability Restrictions Tracked in the SHIP Database
Properties 100 30 23 0
Units 16,787 3,423 4,401 0
state of new York citY’s subsid ized housing: 2011 22SECTIon 2. Hud FInAnCIng And InSuRAnCE
Properties already active in the 221(d)(3) BMIR program con-
tinued with their existing regulatory agreements and mort-
gages. However, the Section 221(d)(3) BMIR subsidy cannot
be extended after the underlying mortgage matures, so we
classify it as a non-renewable subsidy.
In New York City, 53 properties, containing 6,700 units, were
developed through the Section 221(d)(3) BMIR program be-
fore it ended, as Table 2A shows. Eight properties developed
in New York City remain in the 221(d)(3) BMIR program,9 15
properties remain affordable through another program in
SHIP, and 30 have left all affordability programs catalogued by
the SHIP Database.
The Housing and Urban Development Act of 1968 authorized
the Section 236 program, which combined mortgage insur-
ance and a subsidized mortgage.10 Section 236 provided a
monthly interest rate reduction payment (IRP) to reduce debt
service costs for developers who were able to secure loans from
private lenders. The IRP provided a direct monthly subsidy to
the lender for the difference between the actual mortgage pay-
ment and the amount owed if the interest rate were one per-
cent. Further, HUD insured the mortgage, greatly reducing
risk to the private lender.11 Because it provided the functional
equivalent of a one percent interest rate, the Section 236 pro-
gram provided a deeper subsidy than the Section 221(d)(3)
BMIR program. The Section 236 program mortgage subsidy
and insurance was also available for mortgages issued by state
or local housing finance agencies, such as HFA or HDC, which
were not insured by other HUD financing and insurance pro-
grams. In New York City, nearly all of the properties developed
through the Section 236 program also received project-based
rental assistance or Mitchell-Lama financing.
Under Section 236, two rent schedules were created for quali-
fying low-income residents—the first, the “Section 236 Mar-
ket Rent,” was set at a level that would cover the costs of a
market rate mortgage and the other was based on a “basic
rent” calculated to cover the lower operating costs and debt
service associated with a one percent mortgage.12 Under Sec-
9 Although financing for the program ended in 1968, many properties had long development timelines. The last 221(d)(3)BMIR project was completed in 1978, so its 40-year affordability timeline extends until 2018.
10 Housing and Urban Development Act of 1968, Pub. L. No. 90-448 (codified as amended at 12 U.S.C. § 1715z-1 (2006)).
11 Mortgage Insurance and Interest Reduction Payment for Rental Projects, 24 C.F.R. § 236.520 (2010).
12 12 U.S.C. § 1715z-1(f) (2006).
tion 236, the tenant paid the greater of the basic rent or 25
percent of their income, but in no case would rent payments
exceed the Section 236 Market Rent.
Nearly one hundred properties with approximately 24,600
units were developed in New York City under the Section 236
program.13 Currently, 16,900 units remain in the program,
3,300 have left the Section 236 program but remain affordable
through another program catalogued by the SHIP and 4,400
have left all affordability restrictions catalogued by the SHIP.
The Section 236 program was halted in 1973 when President
Nixon put a moratorium on all housing subsidies; the program
was never revived, except for completion of properties for which
funds were committed before 1973.14 Like the Section 221(d)(3)
BMIR subsidy, Section 236 is a non-renewable subsidy.
section 223(f) insuranceIn 1974, HUD developed the Section 223(f) program, a
mortgage financing and insurance program exclusively
for refinancing projects that require only a moderate
level of rehabilitation.15 HUD will insure up to 85 per-
cent of the building’s estimated value or acquisition
cost, provided the building has sustaining occupancy16
and has been operating for at least three years. The
223(f) program does not impose specific income or af-
fordability restrictions, but HUD negotiates with the
property owner to determine an acceptable rent level,
and must approve all rent increases. Additionally, it is
generally used in conjunction with other programs that
impose specific affordability requirements. Sixty-nine
properties with 15,300 units have received funding
through both Section 223(f) and another program that
imposes affordability restrictions. Thirty-one of those
properties, containing 4,300 units, are still receiving
Section 223(f) insurance today. Nineteen properties
with 5,900 units have left Section 223(f) but remain af-
fordable through other programs and 19 properties
with 5,100 units have left all affordability restrictions
tracked in the SHIP.
13 These only include properties developed through HUD. There were also some Section 236 properties developed through HFA, but they are not in-cluded here.
14 President Richard Nixon, Special Message to the Congress Proposing Leg-islation and Outlining Administration Actions to Deal With Federal Housing Policy (Sept. 19, 1973).
15 Miscellaneous Mortgage Insurance, 12 U.S.C. § 1715n(f) (2006).
16 “Sustaining occupancy” is defined as having sufficient income to pay all oper-ating expenses, monthly debt service, escrow, and make payments to a reserve for replacement requirements (capital repairs) for three consecutive months.

state of new York citY’s subsid ized housing: 2011 23SECTIon 2. Hud FInAnCIng And InSuRAnCE
The Section 221(d)(3), Section 221(d)(4), and Section 223(f)
programs are the only HUD financing and insurance pro-
grams for first position mortgages still available to finance
new construction or substantial rehabilitation for low-income
families in New York City. Multi-family developers who re-
ceive this insurance may be subject to affordability require-
ments because these financing and insurance programs are
often coupled with other subsidies, but developers are not
necessarily held to a certain rent formula. Because these sub-
sidies can be extended and are still available for development,
we refer to them as renewable.
programs for elderly and special-needs tenantsThe Section 202 and Section 811 programs are used to develop
housing for low-income individuals who are also elderly or
have special needs. The Housing Act of 1959 authorized the
Section 202 program, which enabled non-profit organizations
to build and operate rental housing for low-income people
aged 62 years and older, with a small percentage of units for
non-elderly people with disabilities.17 In contrast to the other
programs discussed in this section, Section 202 is not an insur-
ance program for private loans. Instead, Section 202 allows
HUD to provide loans directly. Originally, HUD provided 40-
year direct loans, typically with a three percent fixed interest
rate. Starting in 1977, HUD charged market-rate interest, but
combined financing with long-term project-based Section 8 as-
sistance (typically 20 year contracts, subject to annual renew-
als) to offset the higher financing costs.
17 Housing Act of 1959, Pub. L. No. 86-372, (codified as amended at 12 U.S.C. § 1701q-3 (2006)).
In 1990, Congress amended the Section 202 program by re-
placing loans with capital grants.18 The 1990 amendments also
limited Section 202 developments to the elderly and created
Section 811, a new and similar program targeting individuals
with disabilities. The programs were separated because of the
belief that non-elderly, disabled populations had previously
not received an equitable share of the assistance available un-
der Section 202.19 Section 811 provides capital grants to non-
profit organizations for new construction or rehabilitation of
housing for people with special needs, defined as families with
at least one adult who has a long-term physical, mental, or
emotional impairment that impedes his or her ability to live
independently.20 Both the Section 202 and Section 811 pro-
grams serve very low-income tenants (below 50 percent of
AMI), requiring tenants to pay the greater of 10 percent of
their gross monthly income or 30 percent of their adjusted
monthly income towards their rent.
One distinctive feature of the Section 202 and 811 programs is
that since 1974, most properties have received project based
rental assistance in addition to their loan or grants to cover the
difference between rental income and total operating costs for
the properties, including supportive housing services such as
cooking and cleaning. For properties developed between 1977
and 1990, Section 202 loans were paired with Section 8 proj-
ect-based rental assistance. Since the Section 202 program was
overhauled in 1990, new contracts have been paired with the
Project Rental Assistance Contract (PRAC) program. These
subsidies will be discussed in further detail starting on page 28.
As Table 2A on page 21 shows, 209 properties with 16,400
units of affordable housing were developed using the Section
202 and 811 programs in New York City, and all still remain in
those programs.
18 Cranston-Gonzalez National Affordable Housing Act, Pub. L. No. 101-625, §507 (1990) (codified at 12 U.S.C. § 1437g (2006)).
19 Sandra Newman, Housing Policy and Home-Based Care., The Milbank Quar-terly 73(3): 407-441 (1995).
20 Supportive Housing for Persons with Disabilities, 42 U.S.C. § 8013 (2006).

state of new York citY’s subsid ized housing: 2011 24SECTIon 2. Hud FInAnCIng And InSuRAnCE
property profilesProperties with HUD financing and insurance are consider-
ably larger than the typical New York City apartment build-
ing—as Table 2B shows, the average property with HUD fi-
nancing and insurance contains 130 units. Among the
program categories in the SHIP Database, HUD project-based
rental assistance and Mitchell-Lama properties are larger.
Further, units in properties with HUD financing and insur-
ance are, on average, 910 square feet, which is smaller than
those in any other subsidy programs covered by the SHIP, but
larger than units in market-rate, regulated, or other subsi-
dized multifamily properties. At an average of approximately
44 years of age, properties with HUD financing and insurance
are newer than market-rate multi-family properties and
LIHTC properties, but older than Mitchell-Lama properties.
Many properties with HUD financing and insurance were
substantially rehabilitated at the beginning of their subsidies.
As Map II shows, properties with HUD financing and insur-
ance are concentrated in Brooklyn, Manhattan, and the Bronx.
Staten Island has just eight properties, containing 1,200 units,
with HUD financing and insurance and Queens has 23 proper-
ties with 2,700 units.
signs of DistressFor properties with HUD financing and insurance, physical
and financial distress can both affect tenant living conditions
and also jeopardize the continued subsidy. When a property
with HUD financing or insurance suffers from physical or fi-
nancial distress, HUD may be able to foreclose on the mort-
gage and take control of the property (see Fail Outs: Properties
at Risk due to Physical or Financial Distress on page 25 for more
information). In New York City, seven properties with HUD
financing and insurance and project-based rental assistance
have failed out (three more with HUD project-based rental as-
sistance only have also failed out). All of those properties also
had Section 8 project-based rental assistance contracts and all
were preserved as affordable housing when they were trans-
ferred to a new owner after the foreclosure.
Among the current properties with HUD financing and insur-
ance in New York City, 13 percent had failing REAC scores at
their last inspection, which will require them to take corrective
actions before the next inspection. Completing the needed re-
pairs may also require city, state, and federal housing agencies
to cooperate on financing and enforcement actions to improve
these buildings’ conditions.
•
•
•••
•
•
•
•
• ••••
•
•
•
•
•••
•
•
•
••
•
•
••
•
••
••
••
•
••••
••
•••
•
•••
•
••
•
•
•
•
•
•
•
• •
••••
•
•
•
•••
•
• •
•
• ••• •
• •
•
•
••• ••
••
••• •
••
• ••
•
•
••••
••
•
•
•
••
•
••••
•
•
•
•
•
•
•
•
••
•••
••
•
•
•
•
•
•
•
• ••
•
•
••
••
• ••
•
•
•
•
•
•••
••
•••
•
••
•
••
•
••
••
•
••
••
•
•
••
•• •
•
•
•
••••
•
•
•
•
•
•
• •••
••
• ••
•• •
•
•
•
•
•
••
•
••
•
••
•
••••
•
•
•
•• • ••• •
•
•
••
• •
•
•
•
•
•
••
••
•
•
•
••
••
•
•
•
•
• ••
•
map II: Affordable Properties with Hud Financing and Insurance, 2010
Table 2B: Characteristics of Properties with Hud Financing and Insurance HUD Financing and All NYC Multi-family Insurance Rental Properties
Average Number of Units per Property 130 30
Average Square Footage per Unit 910 890
Average Years Since Property Construction 44 81
Average Years Since First Subsidy 24 –
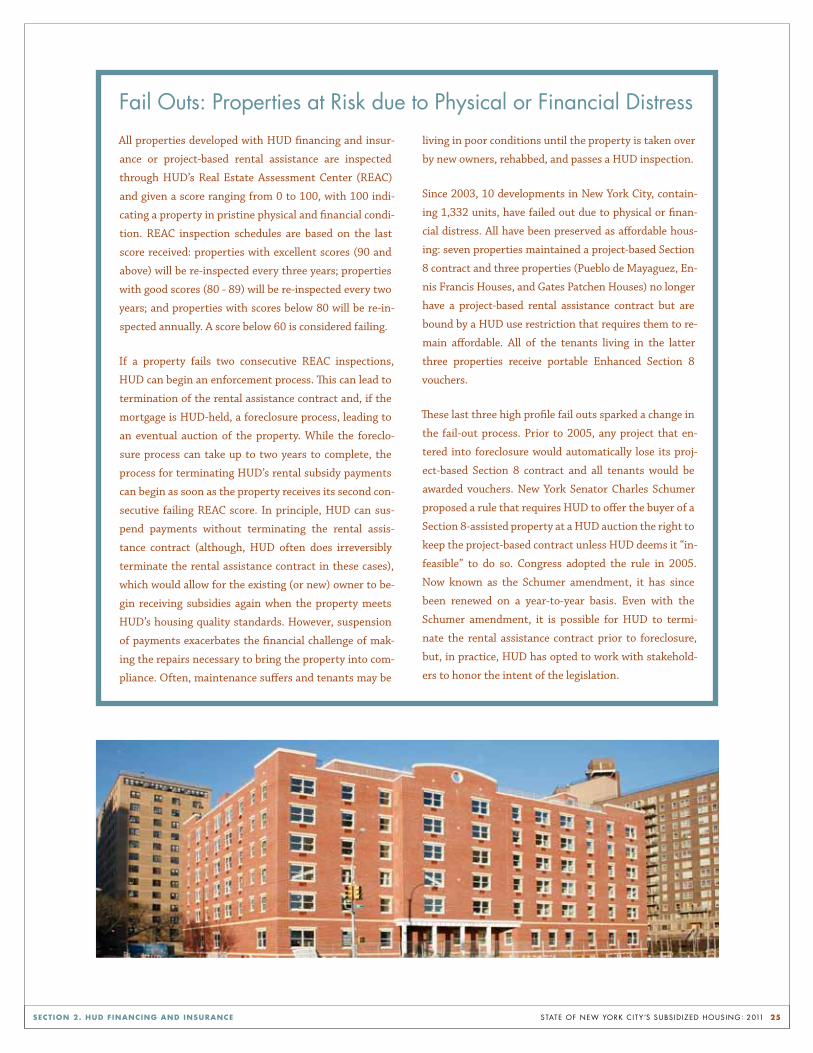
state of new York citY’s subsid ized housing: 2011 25SECTIon 2. Hud FInAnCIng And InSuRAnCE
fail outs: properties at risk due to physical or financial distress
All properties developed with HUD financing and insur-
ance or project-based rental assistance are inspected
through HUD’s Real Estate Assessment Center (REAC)
and given a score ranging from 0 to 100, with 100 indi-
cating a property in pristine physical and financial condi-
tion. REAC inspection schedules are based on the last
score received: properties with excellent scores (90 and
above) will be re-inspected every three years; properties
with good scores (80 - 89) will be re-inspected every two
years; and properties with scores below 80 will be re-in-
spected annually. A score below 60 is considered failing.
If a property fails two consecutive REAC inspections,
HUD can begin an enforcement process. This can lead to
termination of the rental assistance contract and, if the
mortgage is HUD-held, a foreclosure process, leading to
an eventual auction of the property. While the foreclo-
sure process can take up to two years to complete, the
process for terminating HUD’s rental subsidy payments
can begin as soon as the property receives its second con-
secutive failing REAC score. In principle, HUD can sus-
pend payments without terminating the rental assis-
tance contract (although, HUD often does irreversibly
terminate the rental assistance contract in these cases),
which would allow for the existing (or new) owner to be-
gin receiving subsidies again when the property meets
HUD’s housing quality standards. However, suspension
of payments exacerbates the financial challenge of mak-
ing the repairs necessary to bring the property into com-
pliance. Often, maintenance suffers and tenants may be
living in poor conditions until the property is taken over
by new owners, rehabbed, and passes a HUD inspection.
Since 2003, 10 developments in New York City, contain-
ing 1,332 units, have failed out due to physical or finan-
cial distress. All have been preserved as affordable hous-
ing: seven properties maintained a project-based Section
8 contract and three properties (Pueblo de Mayaguez, En-
nis Francis Houses, and Gates Patchen Houses) no longer
have a project-based rental assistance contract but are
bound by a HUD use restriction that requires them to re-
main affordable. All of the tenants living in the latter
three properties receive portable Enhanced Section 8
vouchers.
These last three high profile fail outs sparked a change in
the fail-out process. Prior to 2005, any project that en-
tered into foreclosure would automatically lose its proj-
ect-based Section 8 contract and all tenants would be
awarded vouchers. New York Senator Charles Schumer
proposed a rule that requires HUD to offer the buyer of a
Section 8-assisted property at a HUD auction the right to
keep the project-based contract unless HUD deems it “in-
feasible” to do so. Congress adopted the rule in 2005.
Now known as the Schumer amendment, it has since
been renewed on a year-to-year basis. Even with the
Schumer amendment, it is possible for HUD to termi-
nate the rental assistance contract prior to foreclosure,
but, in practice, HUD has opted to work with stakehold-
ers to honor the intent of the legislation.

state of new York citY’s subsid ized housing: 2011 26SECTIon 2. Hud FInAnCIng And InSuRAnCE
Housing code violations, tax delinquencies, and outstanding
water and sewer bills also may be signs that properties are in
distress. One percent of properties with HUD financing and
insurance received more than one hazardous or immediately
hazardous housing code violation per unit in 2010, a lower
rate than for properties in the project-based rental assistance
or LIHTC programs.
Because the Furman Center does not have access to data about
a property’s mortgage payments or operating costs, it is often
difficult to assess the financial condition of a property. One key
measure is unpaid water or sewer bills. Less than two percent of
properties with HUD financing and insurance qualified for the
2011 lien sale because of an outstanding water or sewer debt,
and the average outstanding balance for delinquent properties
was $1,100. As of October 2010, nine percent of properties
with HUD financing and insurance had a tax delinquency of
more than $1,000 per unit for at least a year. This is the highest
rate among properties in portfolios catalogued by the SHIP.
preservation opportunitiesSince 1920, HUD financing and insurance programs have fa-
cilitated the development of 630 properties with 86,600 units
of affordable housing in New York City. As Table 2D shows,
just under half of those properties (309) remain in HUD fi-
nancing and insurance programs. An additional 170 proper-
ties have left HUD financing and insurance but remain afford-
able due to other subsidy programs in the SHIP Database,
generally project-based rental assistance. One hundred-fifty
one properties with nearly 24,000 units are now market rate,
rent stabilized or have rent restrictions due to one of the small-
er affordability programs not covered by the SHIP.
Table 2C: Signs of distress in Properties with Hud Financing and Insurance
REAC Scores
Average REAC Score (most recent inspection) 79
Share of Properties with a Failing REAC Score (most recent inspection) 13.0%
Hazardous or Immediately Hazardous Housing Code Violations (Issued in 2010)#
Share of Properties with More Than 1 Violation per Unit 1.0%
Tax Delinquencies (Delinquent for > 1 year as of October 2010)*
Share of Properties with a delinquency > $1,000 per unit 8.7%
Water and Sewer Debt: Eligible for the 2011 Lien Sale (90-Day Notice)*^
Share of Properties Eligible for the 2011 Lien Sale 1.6%
Average Water and Sewer Debt (for delinquent properties) $1,101 # HPD Housing Code Violations categorized as B or C* Some portion of these properties are likely applying for exemptions that, when approved, will retroactively abate these bills.^ To be eligible for the lien sale, a property must have at least $1,000 of outstanding charges for at least a year. No properties with HUD financing and insurance had liens that were sold in the 2011 lien sale. The owners either paid their past due bills or arrranged another workout with DOF or HPD.
Table 2d: Affordable Housing units developed with Hud Financing and Insurance, by Borough Staten New YorkPROPERTIES Bronx Brooklyn Manhattan Queens Island City
HUD Financing and Insurance Properties Ever Created 181 187 200 39 23 630
Currently Have HUD Financing and Insurance 97 86 95 23 8 309
No Longer Have HUD Financing and Insurance 84 101 105 16 15 321
Have Affordability Restrictions Through Other SHIP Programs 50 52 48 12 8 170
No Longer Subject to Affordability Restrictions* 34 49 57 4 7 151
UNITS
HUD Financing and Insurance Units Ever Created 23,011 25,580 27,349 6,179 4,483 86,602
Currently Have HUD Financing and Insurance 10,312 14,823 11,695 2,706 1,165 40,701
No Longer Have HUD Financing and Insurance 12,699 10,757 15,654 3,473 3,318 45,901
Have Affordability Restrictions Through Other SHIP Programs 7,115 4,743 5,713 2,455 1,928 21,954
No Longer Subject to Affordability Restrictions* 5,584 6,014 9,941 1,018 1,390 23,947 *As catalogued by the SHIP Database. Projects may have other affordability restrictions through non-SHIP programs.

state of new York citY’s subsid ized housing: 2011 27SECTIon 2. Hud FInAnCIng And InSuRAnCE
Owners of the 40,700 units that remain affordable due to HUD
financing and insurance affordability programs will reach their
mortgage end date or have the option of refinancing their loan
and converting to market rate-over the next two decades. Twen-
ty-five of these 309 properties will reach the end of their mort-
gage and all other affordability restrictions tracked by the SHIP
Database in the next five years. Twenty-three of those proper-
ties, containing 4,000 units, received financing through Section
221(d)(3) BMIR or Section 236—programs which are no longer
available to owners. Owners of these properties may have to
find a different subsidy program in order to cover their operat-
ing costs. Four properties, containing 600 units, have HUD
mortgages that will expire in the next five years but are bound
by other restrictions that will require them to remain affordable
beyond the expiration of their HUD financing and insurance.
Table 2E: Currently-Affordable Properties developed with Hud Financing and Insurance with mortgages Ending 2011–2015 Staten New York Bronx Brooklyn Manhattan Queens Island City
All Affordability Restrictions Expiring in the Next Five Years*
Non-renewable Mortgages Ending (221(d)(3) BMIR, 236)
Properties 9 7 4 2 1 23
Units 1,613 882 1,047 234 178 3,954
Renewable Mortgages Ending (221(d)(3), 221(d)(4), 202/811)
Properties 0 0 2 0 0 2
Units 0 0 84 0 0 84
Affordability Restrictions Continuing For At Least Five Years
Mortgages Ending but Affordability Restrictions Continuing Through Another Program
Properties 1 1 1 1 0 4
Units 56 103 146 257 0 562
Mortgages Terminating After 2015
Properties 87 78 88 20 7 280
Units 8,643 13,838 10,418 2,215 987 36,101 *As catalogued by the SHIP Database

state of new York citY’s subsid ized housing: 2011 28
o ne of HUD’s primary financing tools is a direct rent-
al subsidy to property owners who agree to rent
units to low- and moderate-income tenants. Proj-
ect-based rental assistance programs require landlords to enter
into an agreement with HUD whereby the tenant pays a cer-
tain percentage of income in monthly rent and HUD pays the
owner the difference between the tenant’s payment and the
HUD-approved “Contract Rent.” While project-based rental as-
sistance programs provide a direct rental subsidy similar to
tenant vouchers, they are linked to a specific property, and, un-
like tenant vouchers, remain in effect for future tenants.
HUD offers direct project-based rental assistance contracts
through the following four programs: the Rent Supplement
Program (Rent Supp), the Section 236 Rental Assistance Pay-
ment program (RAP), project-based Section 81, and the Project
Rental Assistance Contract Program (PRAC). Since 1965, 697
properties with 104,000 units have received HUD project-
based rental assistance in New York City. Nearly six hundred
properties with 83,000 units were still receiving assistance as
of the end of 2010.
This section of the report will describe each of the HUD project-
based rental assistance programs, the types of properties fund-
ed through these programs in New York City, and the prospects
for ongoing affordability for these properties. Because many
properties were developed using both HUD financing and in-
surance and HUD project-based rental assistance, this section
will also explore this overlap. Project-based rental assistance
was also sometimes used for moderate rehabilitation of exist-
ing units, but those are not covered in this report or tracked in
the SHIP Database because reliable data are not available.
1 There are several forms of direct project-based Section 8: New Construction, Substantial Rehabilitation, Moderate Rehabilitation, and Loan Management Set-aside, which will all be discussed later in this section.
non-renewable rental ContractsProject-based rental assistance contracts provide a particularly
attractive subsidy for property owners because they essentially
guarantee rental payments at a predicable contract rent over
the life of the contract, subject to Congressional appropriations.
Two of the programs currently offering this reliable and signifi-
cant subsidy—the Rental Supplement and Rental Assistance
Payment programs—are no longer available for new property
development and cannot be renewed once a property reaches
the end of its mortgage term. Therefore, new subsidies will be
required for properties in those programs to remain affordable.
Rental Supplement (“Rent Supp”): The Housing and
Urban Development Act of 1965 authorized the creation of
Rent Supp to spur the development of rental housing for low-
income families. Rent Supp was often offered to property own-
ers in conjunction with Section 221d(3) insurance, and with
Section 236 rental assistance, once that program was estab-
lished. Under Rent Supp, a tenant is required to pay the greater
of 30 percent of monthly adjusted income or 30 percent of Fair
Market Rent (FMR) for the area. HUD then pays the difference
between the tenant’s payment and the actual HUD approved
rent amount, up to the FMR (as the sidebar Calculating Rent
for Units with HUD Rental Supplements shows). Rent Supp
contracts are coterminous with a project’s original mortgage,
meaning that the subsidies end and cannot be renewed after
the original mortgage term, which usually lasts 30 or 40 years.
Table 3A shows that 41 properties, containing 13,600 units
of housing, were financed with Rent Supp in New York City.
New Rent Supp contracts were available through 1973, after
which the program was replaced by the project-based Section
8 program.
section 3. HuD project-based rental assistance

state of new York citY’s subsid ized housing: 2011 29SECTIon 3. Hud PRojECT-BASEd REnTAl ASSISTAnCE
Many of the properties that were financed using Rent Supp
also received HUD financing and insurance or financing
through the New York State and/or City Mitchell-Lama pro-
grams. Seventy-three percent of all Rent Supp contracts (30
properties) also received financing from the Mitchell-Lama
program and 22 percent (9 properties) also received HUD fi-
nancing and insurance at some point. In the 1970s, HUD al-
lowed properties with both Rent Supp and HUD financing and
insurance to convert to project-based Section 8.2 This was at-
tractive for many property owners because project-based Sec-
tion 8 contracts can be renewed after the original mortgage
matures. However, the option of converting Rent Supp units
to project-based Section 8 is not available under current law,
though HUD has allowed conversions on a case by case basis.
Rental Assistance Payment (RAP): The RAP program
is a project-based program authorized by the Housing and
Community Development Act of 1974, and is applicable only
to Section 236 properties.3 Under this program, rents are set at
the Section 236 “Basic Rent” level, based on the lower operat-
ing costs associated with the one percent mortgage provided
under Section 236. Additionally, the tenant pays no more than
30 percent of income in rent, and HUD pays the difference be-
tween the basic rent level and the rent affordable to the ten-
2 In the future, we hope to be able to quantify precisely how many properties converted from the Rent Supp program to Project Based Section 8. However, this is not possible with the data currently available to the Furman Center.
3 Housing and Community Development Act of 1974, Pub. L. No. 93-383 (codified as amended at 12 U.S.C. § 1715z-1 (2006)).
ant.4 Like Rent Supp, a RAP contract is conterminous with the
project’s original mortgage, which is generally 40 years, and
cannot be renewed.5
As Table 3A shows, 25 properties containing 17,100 units were
financed with RAP in New York City. All of the properties that
received RAP subsidies in New York City were also financed
through the Mitchell-Lama program and 24 percent also re-
ceived HUD financing and insurance.
4 Rental Assistance Payments and Rental Charges, 24 C.F.R. § 236.735 (2010).
5 Term of Contract, 24 C.F.R. §236.725 (2010).
Table 3A: Properties and units developed using Project-based Rental Assistance
Project-based Rental Assistance Properties Developed 697
Units in these Properties 104,018
Properties Developed Through:
Rent Supp 41
units 13,605
RAP 25
units 17,139
Section 8 538
units 73,614
PRAC 104
units 7,382
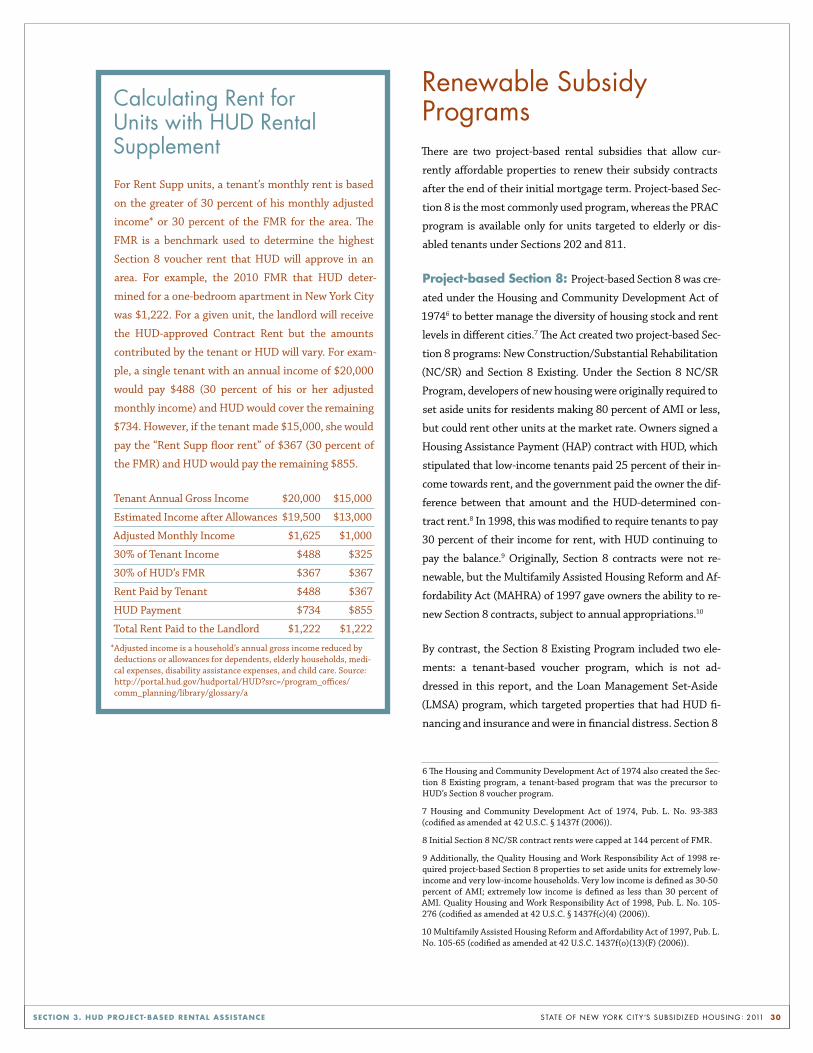
state of new York citY’s subsid ized housing: 2011 30SECTIon 3. Hud PRojECT-BASEd REnTAl ASSISTAnCE
Calculating rent for units with HuD rental supplement
For Rent Supp units, a tenant’s monthly rent is based
on the greater of 30 percent of his monthly adjusted
income* or 30 percent of the FMR for the area. The
FMR is a benchmark used to determine the highest
Section 8 voucher rent that HUD will approve in an
area. For example, the 2010 FMR that HUD deter-
mined for a one-bedroom apartment in New York City
was $1,222. For a given unit, the landlord will receive
the HUD-approved Contract Rent but the amounts
contributed by the tenant or HUD will vary. For exam-
ple, a single tenant with an annual income of $20,000
would pay $488 (30 percent of his or her adjusted
monthly income) and HUD would cover the remaining
$734. However, if the tenant made $15,000, she would
pay the “Rent Supp floor rent” of $367 (30 percent of
the FMR) and HUD would pay the remaining $855.
Tenant Annual Gross Income $20,000 $15,000
Estimated Income after Allowances $19,500 $13,000
Adjusted Monthly Income $1,625 $1,000
30% of Tenant Income $488 $325
30% of HUD’s FMR $367 $367
Rent Paid by Tenant $488 $367
HUD Payment $734 $855
Total Rent Paid to the Landlord $1,222 $1,222
*Adjusted income is a household’s annual gross income reduced by deductions or allowances for dependents, elderly households, medi-cal expenses, disability assistance expenses, and child care. Source: http://portal.hud.gov/hudportal/HUD?src=/program_offices/comm_planning/library/glossary/a
renewable subsidy programsThere are two project-based rental subsidies that allow cur-
rently affordable properties to renew their subsidy contracts
after the end of their initial mortgage term. Project-based Sec-
tion 8 is the most commonly used program, whereas the PRAC
program is available only for units targeted to elderly or dis-
abled tenants under Sections 202 and 811.
Project-based Section 8: Project-based Section 8 was cre-
ated under the Housing and Community Development Act of
19746 to better manage the diversity of housing stock and rent
levels in different cities.7 The Act created two project-based Sec-
tion 8 programs: New Construction/Substantial Rehabilitation
(NC/SR) and Section 8 Existing. Under the Section 8 NC/SR
Program, developers of new housing were originally required to
set aside units for residents making 80 percent of AMI or less,
but could rent other units at the market rate. Owners signed a
Housing Assistance Payment (HAP) contract with HUD, which
stipulated that low-income tenants paid 25 percent of their in-
come towards rent, and the government paid the owner the dif-
ference between that amount and the HUD-determined con-
tract rent.8 In 1998, this was modified to require tenants to pay
30 percent of their income for rent, with HUD continuing to
pay the balance.9 Originally, Section 8 contracts were not re-
newable, but the Multifamily Assisted Housing Reform and Af-
fordability Act (MAHRA) of 1997 gave owners the ability to re-
new Section 8 contracts, subject to annual appropriations.10
By contrast, the Section 8 Existing Program included two ele-
ments: a tenant-based voucher program, which is not ad-
dressed in this report, and the Loan Management Set-Aside
(LMSA) program, which targeted properties that had HUD fi-
nancing and insurance and were in financial distress. Section 8
6 The Housing and Community Development Act of 1974 also created the Sec-tion 8 Existing program, a tenant-based program that was the precursor to HUD’s Section 8 voucher program.
7 Housing and Community Development Act of 1974, Pub. L. No. 93-383 (codified as amended at 42 U.S.C. § 1437f (2006)).
8 Initial Section 8 NC/SR contract rents were capped at 144 percent of FMR.
9 Additionally, the Quality Housing and Work Responsibility Act of 1998 re-quired project-based Section 8 properties to set aside units for extremely low-income and very low-income households. Very low income is defined as 30-50 percent of AMI; extremely low income is defined as less than 30 percent of AMI. Quality Housing and Work Responsibility Act of 1998, Pub. L. No. 105-276 (codified as amended at 42 U.S.C. § 1437f(c)(4) (2006)).
10 Multifamily Assisted Housing Reform and Affordability Act of 1997, Pub. L. No. 105-65 (codified as amended at 42 U.S.C. 1437f(o)(13)(F) (2006)).

state of new York citY’s subsid ized housing: 2011 31SECTIon 3. Hud PRojECT-BASEd REnTAl ASSISTAnCE
LMSA contracts were project-based, and could be added as a
rental subsidy to an existing property with Section 221(d)(3)
or Section 236 insurance if the property was at risk of going
into foreclosure due to low operating income. Originally, the
five-year contracts could be renewed only twice, allowing for
15 years of subsidy, but MAHRA allowed for an indefinite
number of renewals starting in 1997.
In 1983, President Reagan’s Commission on Housing ex-
pressed concern that the project-based Section 8 program al-
lowed owners to inflate their costs.11 After a lengthy Congres-
sional debate on this issue, the Housing and Urban-Rural
Recovery Act of 1983 eliminated the Section 8 New Construc-
tion/Substantial Rehabilitation program entirely.12 Only the
Section 8 Existing program, including both the tenant-based
subsidy and the project-based LMSA program, remained. No
funds have been authorized since then for new project-based
Section 8 contracts for new construction or rehabilitation.
Contract renewal under this program is now optional for own-
ers, but if the owner requests a renewal, HUD must comply
with the request, subject to available appropriations.
As illustrated in Table 3A on page 29, project-based Section 8
rental assistance was used to develop 538 properties with
73,600 units in New York City. Fifty-eight of these properties,
containing 36,700 units, were developed under NC/SR, and an
additional 102 properties with 17,000 units forestalled fore-
closure with the LMSA program.
Project Rental Assistance Contract (PRAC): The
Cranston-Gonzalez National Affordable Housing Act of 1990
authorized the PRAC program, a rental subsidy that can be
used only in conjunction with HUD’s Section 202 or 811 pro-
grams for elderly or disabled tenants.13 It pays the difference
between rental income (the greater of 10% of gross income
and 30% of the tenant’s adjusted monthly income) and HUD-
approved operating expense levels. PRAC contracts have
three-year terms and are renewable, subject to the availability
of federal funds.14 PRAC is the only project-based rental assis-
11 The President’s Commission on Housing, The Report of the President’s Commission on Housing (1982), available at http://www.michaelcarliner.com/files/Commiss/ReportOfThePersidentsComm1982s.pdf.
12 Housing and Urban-Rural Recovery Act, Pub. L. No. 98-181, §§ 208-09 (codified at 42 U.S.C. 1427f (2006)).
13 Cranston-Gonzalez National Affordable Housing Act, Pub. L. No. 101-625 (1990) (codified at 12 U.S.C. §1701q (2006)).
14 Prior to 1990, Section 202 properties were awarded a Section 8 contract that covered repayment of the Section 202 loan and operating expenses.
tance program still available for new construction, and has
been used to develop 104 properties, containing 7,400 units,
in New York City, all of which remain affordable.
property profilesNearly 600 properties, containing 83,000 units of affordable
rental housing currently receive subsidies from one of the four
HUD project-based rental assistance programs in New York
City. As Table 3B shows, properties with project-based rental
assistance have an average of 140 units per property, which
makes them larger than the average LIHTC property but small-
er than the average Mitchell-Lama. The average size of a unit
with a HUD project-based rental assistance subsidy is 920
square feet, making them the smallest units of the properties
tracked in the SHIP Database, but still larger than the citywide
average for rental units in market-rate, regulated, or other sub-
sidized multi-family properties.
The median age of a project-based rental assistance property in
New York City is nearly 60 years, but many of these properties
were rehabilitated in the past three decades. The average time
since a project-based rental assistance property received its
first subsidy is just 27 years. Properties with HUD project-
based rental assistance are newer than the average market-
rate, regulated, or other subsidized rental, as well as those with
HUD financing and insurance or LIHTC, but are older than
Mitchell-Lama properties.15
15 The small size of these units is likely related the high percentage of single occupancy elderly and disabled units in this portfolio.
Table 3B: Characteristics of Hud Project-based Rental Assistance Properties
HUD Project-based All NYC Multi-family Rental Assistance Properties Rental Properties
Average Number of Units per Property 140 30
Average Square Footage per Unit 920 890
Average Years Since Property Construction 57 81
Average Years Since First Subsidy 27 –
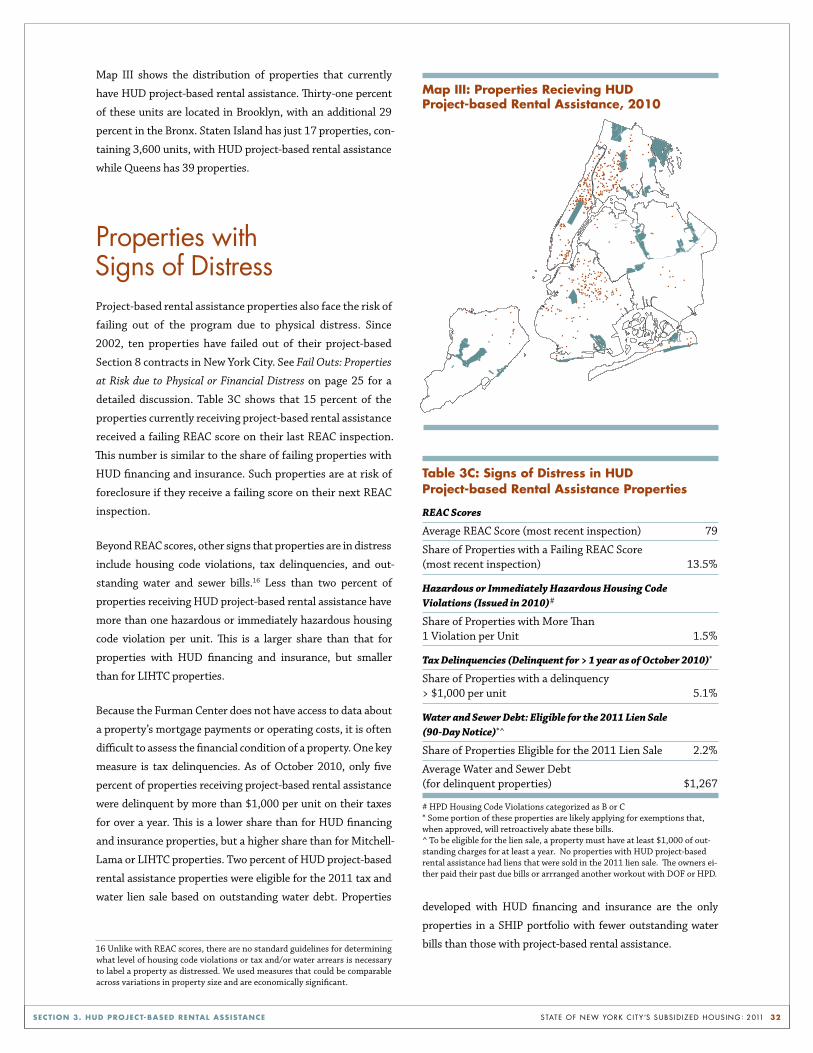
state of new York citY’s subsid ized housing: 2011 32SECTIon 3. Hud PRojECT-BASEd REnTAl ASSISTAnCE
Map III shows the distribution of properties that currently
have HUD project-based rental assistance. Thirty-one percent
of these units are located in Brooklyn, with an additional 29
percent in the Bronx. Staten Island has just 17 properties, con-
taining 3,600 units, with HUD project-based rental assistance
while Queens has 39 properties.
properties with signs of DistressProject-based rental assistance properties also face the risk of
failing out of the program due to physical distress. Since
2002, ten properties have failed out of their project-based
Section 8 contracts in New York City. See Fail Outs: Properties
at Risk due to Physical or Financial Distress on page 25 for a
detailed discussion. Table 3C shows that 15 percent of the
properties currently receiving project-based rental assistance
received a failing REAC score on their last REAC inspection.
This number is similar to the share of failing properties with
HUD financing and insurance. Such properties are at risk of
foreclosure if they receive a failing score on their next REAC
inspection.
Beyond REAC scores, other signs that properties are in distress
include housing code violations, tax delinquencies, and out-
standing water and sewer bills.16 Less than two percent of
properties receiving HUD project-based rental assistance have
more than one hazardous or immediately hazardous housing
code violation per unit. This is a larger share than that for
properties with HUD financing and insurance, but smaller
than for LIHTC properties.
Because the Furman Center does not have access to data about
a property’s mortgage payments or operating costs, it is often
difficult to assess the financial condition of a property. One key
measure is tax delinquencies. As of October 2010, only five
percent of properties receiving project-based rental assistance
were delinquent by more than $1,000 per unit on their taxes
for over a year. This is a lower share than for HUD financing
and insurance properties, but a higher share than for Mitchell-
Lama or LIHTC properties. Two percent of HUD project-based
rental assistance properties were eligible for the 2011 tax and
water lien sale based on outstanding water debt. Properties
16 Unlike with REAC scores, there are no standard guidelines for determining what level of housing code violations or tax and/or water arrears is necessary to label a property as distressed. We used measures that could be comparable across variations in property size and are economically significant.
developed with HUD financing and insurance are the only
properties in a SHIP portfolio with fewer outstanding water
bills than those with project-based rental assistance.
•
•
•
•
•
•
•
• •• •
•
•
•
•
••
•
•
•
•
• •
••
•
•
•
•
•
•••
•
•
•
•
•
•
•
•
•
•
•
••
•
•
••
•
•
•
•
••
••
•
•
•
•
•
•
•
•
•
•
•
•
•
•
• •
•
•
•
•
• • •
•
•
•
•
•
•
•
•
••
•
••
•
•
•
•
•
••
•
••
•
•
•
••
•
•
••
• •
•
•
•
•
•
•
•
•
•
••
•
•
•
•
•
•
••
••
•
•
•
••
•
•
•
•
••
••
•
•
•
•
•
•
•
••
•••
•
•
•
•
•
••
•
••
••
•
•
••
•••
••• •
•
•
•
•
•
••
•
••
•
•
•
•
•••
•
•
• •••••
•
•
•
•
••
•
•
•
•
•
•
•
• •
•
•
•
•
••
•
•
•
•
•
•
•
•
•
••
•
•
•
•
•
•
•
••
••
•••
•
•
•
•
•
•
••
•
•
••
•
•
•
••
•
•
••••
••
•
•
•
••
•
•
•
•••
•
•••••
•
•
•
•
•
•
•
•
••
•
•
•
•
•
•
•
•
•
••
•
•
•
•
•
•
•
••
•
••
•
•
••
•
•
•
•
•
•
•
•
•
•
•
•
•
••
•
•
•
••
•
•
•
•
•
•
•
•
•
•
•
•
•
•
••
•
•••
•
•
•
•
•
•
• • •
••
••••
•
•
•
•
•
•
•
•
•
•
•
•
•
•
•
••••
•
•
•
•
•
•
•
•
•
•
•
•
•
•
•
•
••• ••
• ••
•
••
•••
•
•
•
•
•
•
•
•
•
•
•
•
••
•
•
•
••••
• •
••
•
•
•
•
•••
•
••
•
••
•
•
••••
•
•••
•
•
•••
•
•
•
•
map III: Properties Recieving Hud Project-based Rental Assistance, 2010
Table 3C: Signs of distress in Hud Project-based Rental Assistance Properties
REAC Scores
Average REAC Score (most recent inspection) 79
Share of Properties with a Failing REAC Score (most recent inspection) 13.5%
Hazardous or Immediately Hazardous Housing Code Violations (Issued in 2010)#
Share of Properties with More Than 1 Violation per Unit 1.5%
Tax Delinquencies (Delinquent for > 1 year as of October 2010)*
Share of Properties with a delinquency > $1,000 per unit 5.1%
Water and Sewer Debt: Eligible for the 2011 Lien Sale (90-Day Notice)*^
Share of Properties Eligible for the 2011 Lien Sale 2.2%
Average Water and Sewer Debt (for delinquent properties) $1,267 # HPD Housing Code Violations categorized as B or C* Some portion of these properties are likely applying for exemptions that, when approved, will retroactively abate these bills.^ To be eligible for the lien sale, a property must have at least $1,000 of out-standing charges for at least a year. No properties with HUD project-based rental assistance had liens that were sold in the 2011 lien sale. The owners ei-ther paid their past due bills or arrranged another workout with DOF or HPD.
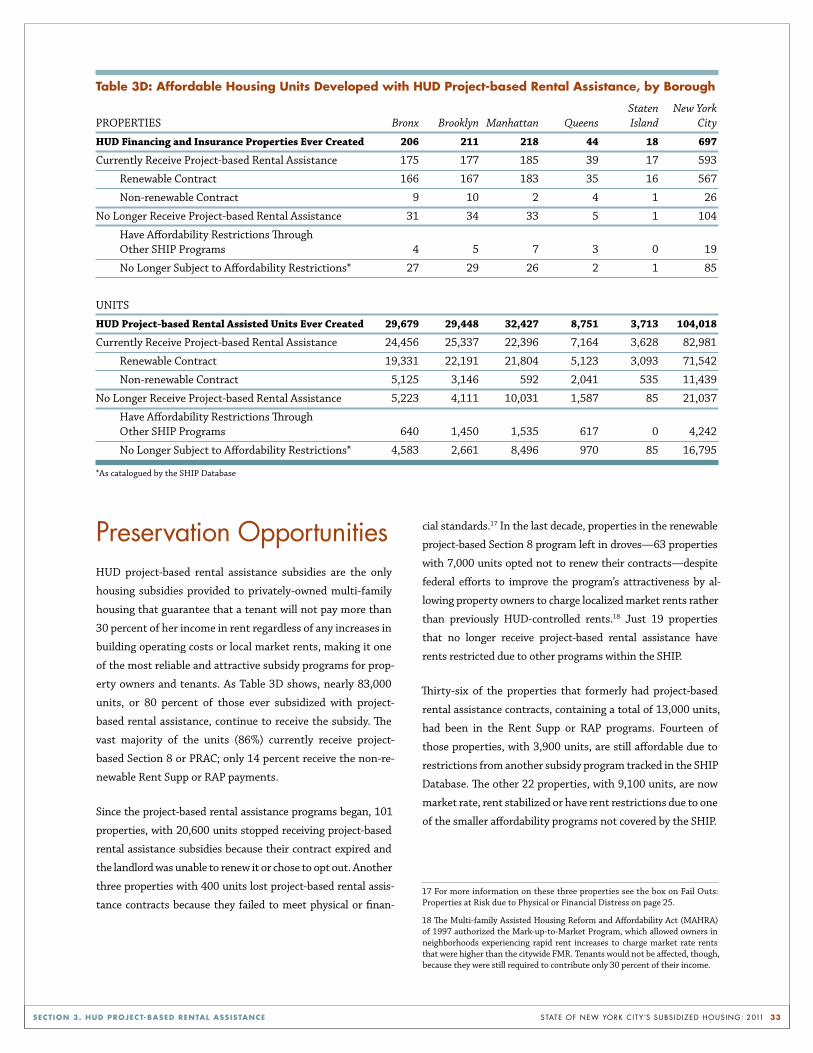
state of new York citY’s subsid ized housing: 2011 33SECTIon 3. Hud PRojECT-BASEd REnTAl ASSISTAnCE
preservation opportunitiesHUD project-based rental assistance subsidies are the only
housing subsidies provided to privately-owned multi-family
housing that guarantee that a tenant will not pay more than
30 percent of her income in rent regardless of any increases in
building operating costs or local market rents, making it one
of the most reliable and attractive subsidy programs for prop-
erty owners and tenants. As Table 3D shows, nearly 83,000
units, or 80 percent of those ever subsidized with project-
based rental assistance, continue to receive the subsidy. The
vast majority of the units (86%) currently receive project-
based Section 8 or PRAC; only 14 percent receive the non-re-
newable Rent Supp or RAP payments.
Since the project-based rental assistance programs began, 101
properties, with 20,600 units stopped receiving project-based
rental assistance subsidies because their contract expired and
the landlord was unable to renew it or chose to opt out. Another
three properties with 400 units lost project-based rental assis-
tance contracts because they failed to meet physical or finan-
cial standards.17 In the last decade, properties in the renewable
project-based Section 8 program left in droves—63 properties
with 7,000 units opted not to renew their contracts—despite
federal efforts to improve the program’s attractiveness by al-
lowing property owners to charge localized market rents rather
than previously HUD-controlled rents.18 Just 19 properties
that no longer receive project-based rental assistance have
rents restricted due to other programs within the SHIP.
Thirty-six of the properties that formerly had project-based
rental assistance contracts, containing a total of 13,000 units,
had been in the Rent Supp or RAP programs. Fourteen of
those properties, with 3,900 units, are still affordable due to
restrictions from another subsidy program tracked in the SHIP
Database. The other 22 properties, with 9,100 units, are now
market rate, rent stabilized or have rent restrictions due to one
of the smaller affordability programs not covered by the SHIP.
17 For more information on these three properties see the box on Fail Outs: Properties at Risk due to Physical or Financial Distress on page 25.
18 The Multi-family Assisted Housing Reform and Affordability Act (MAHRA) of 1997 authorized the Mark-up-to-Market Program, which allowed owners in neighborhoods experiencing rapid rent increases to charge market rate rents that were higher than the citywide FMR. Tenants would not be affected, though, because they were still required to contribute only 30 percent of their income.
Table 3d: Affordable Housing units developed with Hud Project-based Rental Assistance, by Borough Staten New YorkPROPERTIES Bronx Brooklyn Manhattan Queens Island City
HUD Financing and Insurance Properties Ever Created 206 211 218 44 18 697
Currently Receive Project-based Rental Assistance 175 177 185 39 17 593
Renewable Contract 166 167 183 35 16 567
Non-renewable Contract 9 10 2 4 1 26
No Longer Receive Project-based Rental Assistance 31 34 33 5 1 104
Have Affordability Restrictions Through Other SHIP Programs 4 5 7 3 0 19
No Longer Subject to Affordability Restrictions* 27 29 26 2 1 85
UNITS
HUD Project-based Rental Assisted Units Ever Created 29,679 29,448 32,427 8,751 3,713 104,018
Currently Receive Project-based Rental Assistance 24,456 25,337 22,396 7,164 3,628 82,981
Renewable Contract 19,331 22,191 21,804 5,123 3,093 71,542
Non-renewable Contract 5,125 3,146 592 2,041 535 11,439
No Longer Receive Project-based Rental Assistance 5,223 4,111 10,031 1,587 85 21,037
Have Affordability Restrictions Through Other SHIP Programs 640 1,450 1,535 617 0 4,242
No Longer Subject to Affordability Restrictions* 4,583 2,661 8,496 970 85 16,795 *As catalogued by the SHIP Database
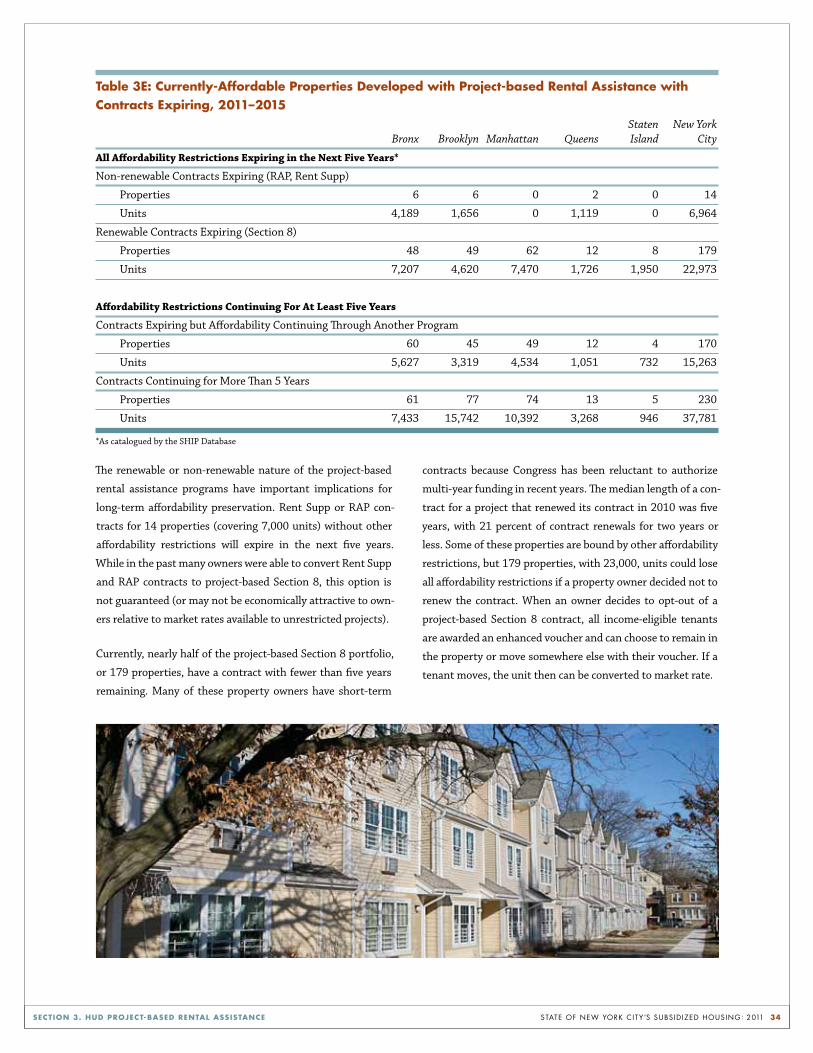
state of new York citY’s subsid ized housing: 2011 34SECTIon 3. Hud PRojECT-BASEd REnTAl ASSISTAnCE
The renewable or non-renewable nature of the project-based
rental assistance programs have important implications for
long-term affordability preservation. Rent Supp or RAP con-
tracts for 14 properties (covering 7,000 units) without other
affordability restrictions will expire in the next five years.
While in the past many owners were able to convert Rent Supp
and RAP contracts to project-based Section 8, this option is
not guaranteed (or may not be economically attractive to own-
ers relative to market rates available to unrestricted projects).
Currently, nearly half of the project-based Section 8 portfolio,
or 179 properties, have a contract with fewer than five years
remaining. Many of these property owners have short-term
contracts because Congress has been reluctant to authorize
multi-year funding in recent years. The median length of a con-
tract for a project that renewed its contract in 2010 was five
years, with 21 percent of contract renewals for two years or
less. Some of these properties are bound by other affordability
restrictions, but 179 properties, with 23,000, units could lose
all affordability restrictions if a property owner decided not to
renew the contract. When an owner decides to opt-out of a
project-based Section 8 contract, all income-eligible tenants
are awarded an enhanced voucher and can choose to remain in
the property or move somewhere else with their voucher. If a
tenant moves, the unit then can be converted to market rate.
Table 3E: Currently-Affordable Properties developed with Project-based Rental Assistance with Contracts Expiring, 2011–2015 Staten New York Bronx Brooklyn Manhattan Queens Island City
All Affordability Restrictions Expiring in the Next Five Years*
Non-renewable Contracts Expiring (RAP, Rent Supp)
Properties 6 6 0 2 0 14
Units 4,189 1,656 0 1,119 0 6,964
Renewable Contracts Expiring (Section 8)
Properties 48 49 62 12 8 179
Units 7,207 4,620 7,470 1,726 1,950 22,973
Affordability Restrictions Continuing For At Least Five Years
Contracts Expiring but Affordability Continuing Through Another Program
Properties 60 45 49 12 4 170
Units 5,627 3,319 4,534 1,051 732 15,263
Contracts Continuing for More Than 5 Years
Properties 61 77 74 13 5 230
Units 7,433 15,742 10,392 3,268 946 37,781 *As catalogued by the SHIP Database

state of new York citY’s subsid ized housing: 2011 35
n ew York State created the Mitchell-Lama program
in 1955 to address the perceived shortage of safe
and sanitary housing for moderate- to middle-in-
come families.1 The program provides subsidies to both rental
and cooperative ownership properties throughout the state.
Participating properties are subject to rent restrictions. Tenant
income restrictions vary based on the household size, unit size,
and the overseeing agency.
Over 400 Mitchell-Lama rental properties with 165,000 units
were funded from 1955 to 1978 in New York State. Of those,
271 properties, containing 139,400 units, were developed in
New York City, including 174 rental properties with 69,800
units and 97 cooperative properties with 69,800 units (see
Mitchell-Lama Cooperatives on this page). Currently, there are
78 rental properties, containing 33,700 units, still receiving
Mitchell-Lama subsidies in New York City.
The Mitchell-Lama program offered developers low-cost land,
property tax exemptions,2 and subsidized below-market rate
mortgages for up to 95 percent of the project cost.3 Mitchell-
Lama program loans are financed through bonds issued by
government agencies and state and local governments.4 In ex-
1 The program was authorized under Article II of the New York State Private Housing Finance Law. This report does not address rental housing developed through Limited Dividend Housing Corporations, a predecessor to the Mitchell-Lama program that started in 1926. The Limited Dividend program built rental properties for moderate-income tenants and provided developers with property tax exemptions for a period of up to 50 years in exchange for a six percent cap (or “limit”) on profits. These corporations were allowed to voluntarily dissolve in 1962. For more on Limited Dividend Housing Corporations, see William C. Thompson, Affordable No More 6-7 (Office of the Comptroller, 2004).
2 A housing company is exempt from local and municipal real estate taxes on land and improvements based on assessments above the assessment in place when the housing company purchased the property. Thus, the company only pays mu-nicipal and local taxes based on the current tax rates in a given year and its prop-erty assessment from the year the housing company purchased the land. This exemption is granted at the discretion of the local municipality, but is required, in practice, to induce the formation of a housing company. The tax exemption may reduce a company’s tax liability to ten percent of its annual shelter rent (total rent less electricity, gas, heat, and other utilities). Shelter rent includes rent supple-ments and subsidies received but excludes interest rate reductions received under the Section 236 program. N.Y. Priv. Hous. Fin. Law § 33(1)(a) (McKinney 1976).
3 The program may fund the full project costs for housing for staff members, employees, or students of a college, university, hospital, or childcare institu-tion; a municipally-aided nonprofit or municipally-aided mutual company; or the construction of low-income nonprofit housing. N.Y. Priv. Hous. Fin. Law §§ 23, 33 (McKinney 1976).
4 New York State Division of Housing & Community Renewal, Annual Report: Mitchell-Lama Housing Companies in New York State (2007).
change for these subsidies, housing developers agreed to sub-
ject themselves to government regulations regarding rents
charged and tenant selection, and to limit the annual return
on their investment to six percent.
mitchell-lama Cooperatives what are they? While not discussed in detail in this re-port, Mitchell-Lama limited equity cooperatives are included in the SHIP Database. Resident owners purchase shares in the cooperative that entitle the shareholders to occupy a specific unit of the building
who are the target cooperative unit owners? The cooperative program has the same tenant restrictions as the rental program, discussed on page 37.
How many cooperatives are there? Ninety-seven cooperative properties, with 69,700 units, were built in New York City, of which 90 properties, with 65,900 units, remain restricted.
what are the financial requirements? Owners are responsible for their proportional share of common charges. Personal loans are allowed to fund co-op purchases, but if the apartment is seized by the lender, occupancy rights will con-tinue to be governed by the Mitchell-Lama rules.
How much can a unit in a cooperative be sold for? The resale price for Mitchell-Lama cooperative units is limited to the original purchase price, plus the unit’s share of the amortized mortgage and capital assessment payments on the property.
what are the program exit requirements? The regulations for leaving the program are similar to rental regulations, but also must obtain a two-thirds majority of shareholders to support submitting an offering plan to the Attorney General, and actually deciding to dissolve the coop-erative. If the loan was made prior to May 1959, the owner must wait 35 years to opt-out and must repay all accrued taxes for which they were exempted. There are six Mitchell-Lama cooperative properties subject to these additional re-strictions for pre-May 1959 loans.
Sources: (HPD), (HCR), N.Y. Comp. Codes R. & Regs. tit. 9 § 1750.4 (2011).
section 4. mitchell-lama

state of new York citY’s subsid ized housing: 2011 36SECTIon 4. mITCHEll-lAmA
To become eligible for the program, investors and developers
were required to incorporate as “Limited-Profit Housing Com-
panies,” often referred to as Article II Companies, which be-
came the Mitchell-Lama entities. These entities supervise con-
struction and provide ongoing asset management for
Mitchell-Lama projects. Mitchell-Lama projects were original-
ly required to adhere to program restrictions for the full dura-
tion of their mortgage terms, generally 50 years. In order to
attract additional private developers and increase overall pro-
gram participation, the New York legislature amended the re-
quirements in the early years of the program. In 1957, for ex-
ample, the legislature relaxed the program requirements to
allow companies to voluntarily dissolve and opt out of the pro-
gram after 35 years of participation.5 In 1959, the 35-year
commitment was reduced again, to 20 years.6
The New York City Department of Housing Preservation and
Development and New York State Homes and Community
Renewal (HCR) each respectively supervise developments for
which the City or State was the original lender in New York
City. The Empire State Development Corporation (ESDC),
Housing Development Corporation, and some private banks
hold some of the Mitchell-Lama loans in their portfolios and
may have varying degrees of joint oversight of the properties,7
but they are not supervising agencies. Although enforcement
of the Mitchell-Lama law and its regulations is primarily per-
formed by HPD or HCR, HUD has joint oversight of any
property that receives subsidies through the federal project-
based rental assistance and Section 236 programs or insur-
ance through the Section 223(f) program. The overseeing
5 N.Y. Priv. Hous. Fin. Law § 35(1) (McKinney 1976).
6 N.Y. Priv. Hous. Fin. Law § 35(2) (McKinney 1976).
7 For example, HDC in some cases conducts physical inspections and regulates the reserve accounts. ESDC must consent to opt out requests in addition to HCR.
agencies provide asset management, determine the allow-
able rental increases, conduct physical inspections, regulate
capital reserve accounts, monitor waiting lists and apart-
ment rentals, and supervise the process for developments
that wish to exit the program.
There are several types of Mitchell-Lama rental develop-
ments including those that are designated for families and
those that are designated for senior citizens.8 A few of the
developments designated for senior citizens also provide lim-
ited social services.9 Apartment units have specific house-
hold size guidelines associated with them. Preferential treat-
ment in the admission and waitlist process is given to
veterans and their surviving spouses.10
Rents in Mitchell-Lama developments are set for each indi-
vidual property by the supervising agency at a level that will
provide sufficient revenue for the property to meet its finan-
cial obligations, including a limited annual return to the land-
lord of approximately six percent, while balancing the need
for the developments to remain affordable. Housing compa-
nies are required to request a rent increase from their respec-
tive supervising agency. As part of the rental increase process,
HPD conducts a public hearing and HCR holds a public meet-
ing. Developments that share joint oversight with HUD must
follow HUD’s rent increase requirements for the specific HUD
program in use at the property. For example, for Mitchell-
8 For the Mitchell-Lama program, New York City defines senior citizen hous-ing as housing in which the head of the household or his or her spouse is 62 years of age or older. N.Y. Priv. Hous. Fin. Law § 31 (McKinney 1976). The SHIP Database does not currently contain information that allows us to distinguish between senior and family housing for those properties supervised by HPD, so these programs are grouped for reporting purposes.
9 For more information, see NYC Department for the Aging. http://www.nyc.gov/html/dfta/html/senior/housing.shtml.
10 HCR, State Supervised Middle Income Housing Developments for Families and Senior Citizens, http://www.dhcr.state.ny.us/Apps/hsgdevls/hsgdevls.asp.
Table 4A: mitchell-lama Rental Property development 1960s 1970s 1980s Total
Mitchell-Lama Properties Developed 52 121 1 174
Units in these Properties 16,495 53,012 248 69,755
Properties Developed 0
City of New York 28 58 0 86
units 7,376 23,433 0 30,809
State of New York 24 63 1 88
units 9,119 29,579 248 38,946
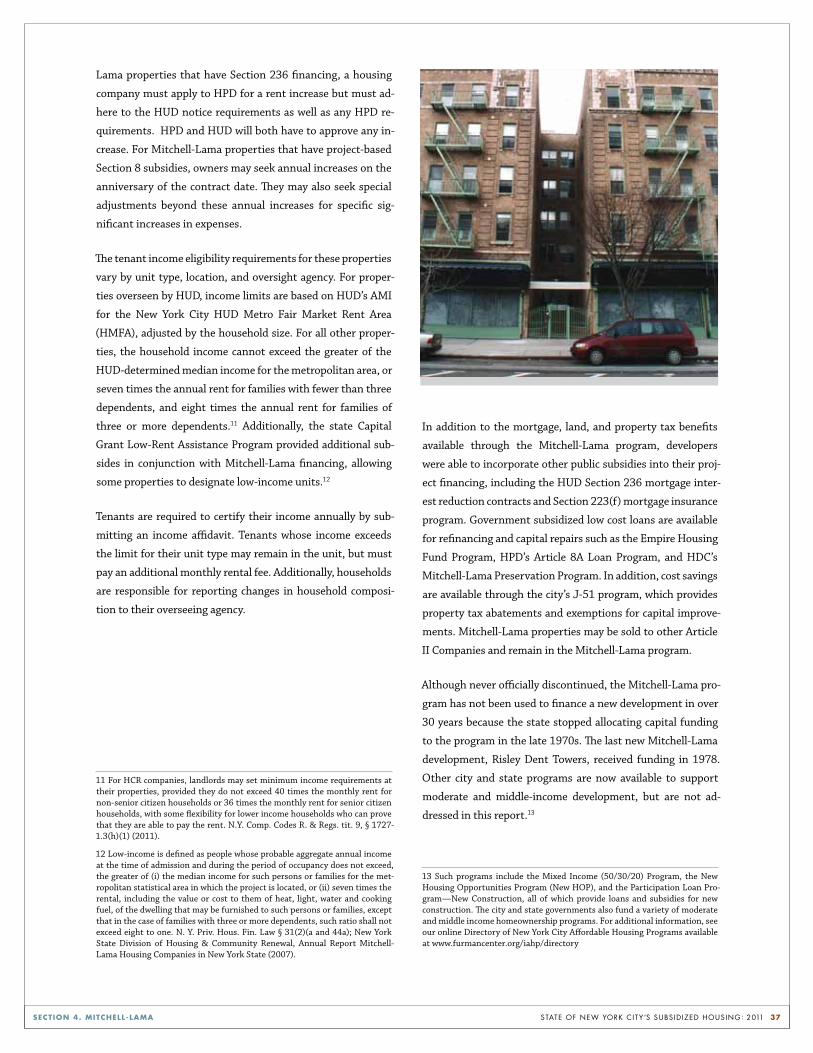
state of new York citY’s subsid ized housing: 2011 37SECTIon 4. mITCHEll-lAmA
Lama properties that have Section 236 financing, a housing
company must apply to HPD for a rent increase but must ad-
here to the HUD notice requirements as well as any HPD re-
quirements. HPD and HUD will both have to approve any in-
crease. For Mitchell-Lama properties that have project-based
Section 8 subsidies, owners may seek annual increases on the
anniversary of the contract date. They may also seek special
adjustments beyond these annual increases for specific sig-
nificant increases in expenses.
The tenant income eligibility requirements for these properties
vary by unit type, location, and oversight agency. For proper-
ties overseen by HUD, income limits are based on HUD’s AMI
for the New York City HUD Metro Fair Market Rent Area
(HMFA), adjusted by the household size. For all other proper-
ties, the household income cannot exceed the greater of the
HUD-determined median income for the metropolitan area, or
seven times the annual rent for families with fewer than three
dependents, and eight times the annual rent for families of
three or more dependents.11 Additionally, the state Capital
Grant Low-Rent Assistance Program provided additional sub-
sides in conjunction with Mitchell-Lama financing, allowing
some properties to designate low-income units.12
Tenants are required to certify their income annually by sub-
mitting an income affidavit. Tenants whose income exceeds
the limit for their unit type may remain in the unit, but must
pay an additional monthly rental fee. Additionally, households
are responsible for reporting changes in household composi-
tion to their overseeing agency.
11 For HCR companies, landlords may set minimum income requirements at their properties, provided they do not exceed 40 times the monthly rent for non-senior citizen households or 36 times the monthly rent for senior citizen households, with some flexibility for lower income households who can prove that they are able to pay the rent. N.Y. Comp. Codes R. & Regs. tit. 9, § 1727-1.3(h)(1) (2011).
12 Low-income is defined as people whose probable aggregate annual income at the time of admission and during the period of occupancy does not exceed, the greater of (i) the median income for such persons or families for the met-ropolitan statistical area in which the project is located, or (ii) seven times the rental, including the value or cost to them of heat, light, water and cooking fuel, of the dwelling that may be furnished to such persons or families, except that in the case of families with three or more dependents, such ratio shall not exceed eight to one. N. Y. Priv. Hous. Fin. Law § 31(2)(a and 44a); New York State Division of Housing & Community Renewal, Annual Report Mitchell-Lama Housing Companies in New York State (2007).
In addition to the mortgage, land, and property tax benefits
available through the Mitchell-Lama program, developers
were able to incorporate other public subsidies into their proj-
ect financing, including the HUD Section 236 mortgage inter-
est reduction contracts and Section 223(f) mortgage insurance
program. Government subsidized low cost loans are available
for refinancing and capital repairs such as the Empire Housing
Fund Program, HPD’s Article 8A Loan Program, and HDC’s
Mitchell-Lama Preservation Program. In addition, cost savings
are available through the city’s J-51 program, which provides
property tax abatements and exemptions for capital improve-
ments. Mitchell-Lama properties may be sold to other Article
II Companies and remain in the Mitchell-Lama program.
Although never officially discontinued, the Mitchell-Lama pro-
gram has not been used to finance a new development in over
30 years because the state stopped allocating capital funding
to the program in the late 1970s. The last new Mitchell-Lama
development, Risley Dent Towers, received funding in 1978.
Other city and state programs are now available to support
moderate and middle-income development, but are not ad-
dressed in this report.13
13 Such programs include the Mixed Income (50/30/20) Program, the New Housing Opportunities Program (New HOP), and the Participation Loan Pro-gram—New Construction, all of which provide loans and subsidies for new construction. The city and state governments also fund a variety of moderate and middle income homeownership programs. For additional information, see our online Directory of New York City Affordable Housing Programs available at www.furmancenter.org/iahp/directory
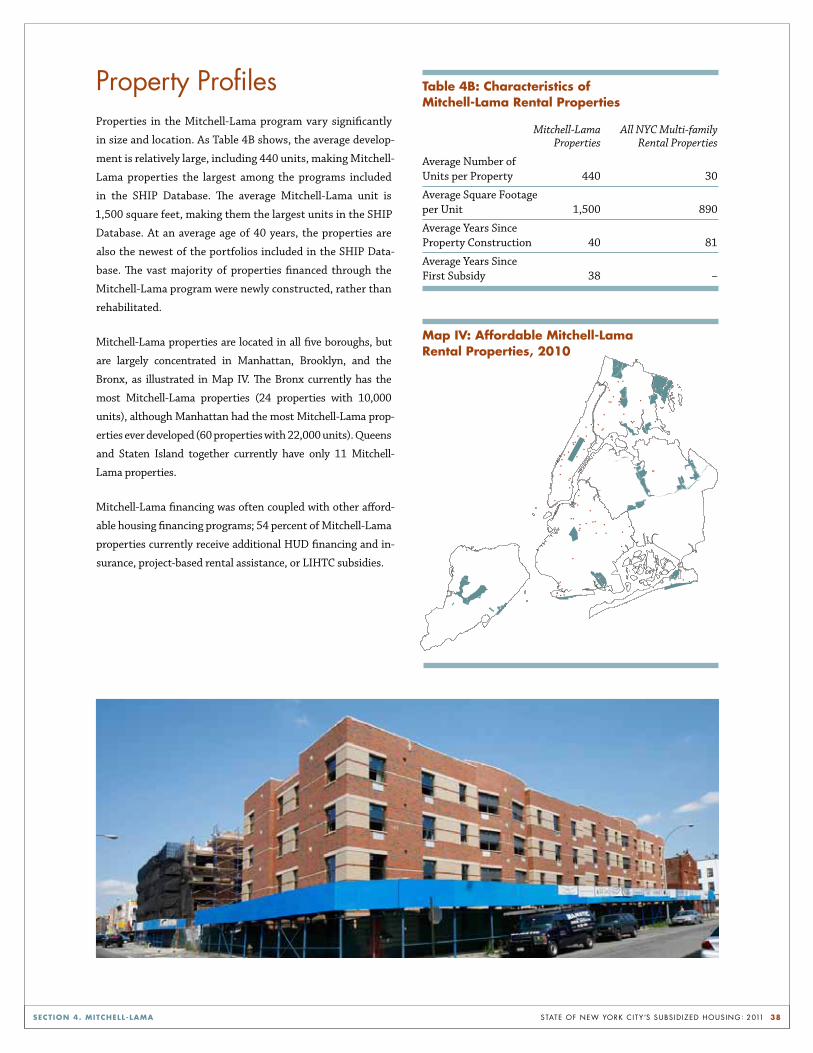
state of new York citY’s subsid ized housing: 2011 38SECTIon 4. mITCHEll-lAmA
property profilesProperties in the Mitchell-Lama program vary significantly
in size and location. As Table 4B shows, the average develop-
ment is relatively large, including 440 units, making Mitchell-
Lama properties the largest among the programs included
in the SHIP Database. The average Mitchell-Lama unit is
1,500 square feet, making them the largest units in the SHIP
Database. At an average age of 40 years, the properties are
also the newest of the portfolios included in the SHIP Data-
base. The vast majority of properties financed through the
Mitchell-Lama program were newly constructed, rather than
rehabilitated.
Mitchell-Lama properties are located in all five boroughs, but
are largely concentrated in Manhattan, Brooklyn, and the
Bronx, as illustrated in Map IV. The Bronx currently has the
most Mitchell-Lama properties (24 properties with 10,000
units), although Manhattan had the most Mitchell-Lama prop-
erties ever developed (60 properties with 22,000 units). Queens
and Staten Island together currently have only 11 Mitchell-
Lama properties.
Mitchell-Lama financing was often coupled with other afford-
able housing financing programs; 54 percent of Mitchell-Lama
properties currently receive additional HUD financing and in-
surance, project-based rental assistance, or LIHTC subsidies.
Table 4B: Characteristics of mitchell-lama Rental Properties
Mitchell-Lama All NYC Multi-family Properties Rental Properties
Average Number of Units per Property 440 30
Average Square Footage per Unit 1,500 890
Average Years Since Property Construction 40 81
Average Years Since First Subsidy 38 –
•
•
•
••
•
•
•
•
•
•
•
•
•
•
••
•
•
•
•
•• •
•
•
•
•
•
•
•
•
•
•
•
•
••
•
•
•
••
•
•
•
•
•
•
•
•
•
•
•
•
•
••••
•
•
•
•
•
•
•
•
• •
••
•
•
••
•
••
•
•
map Iv: Affordable mitchell-lama Rental Properties, 2010
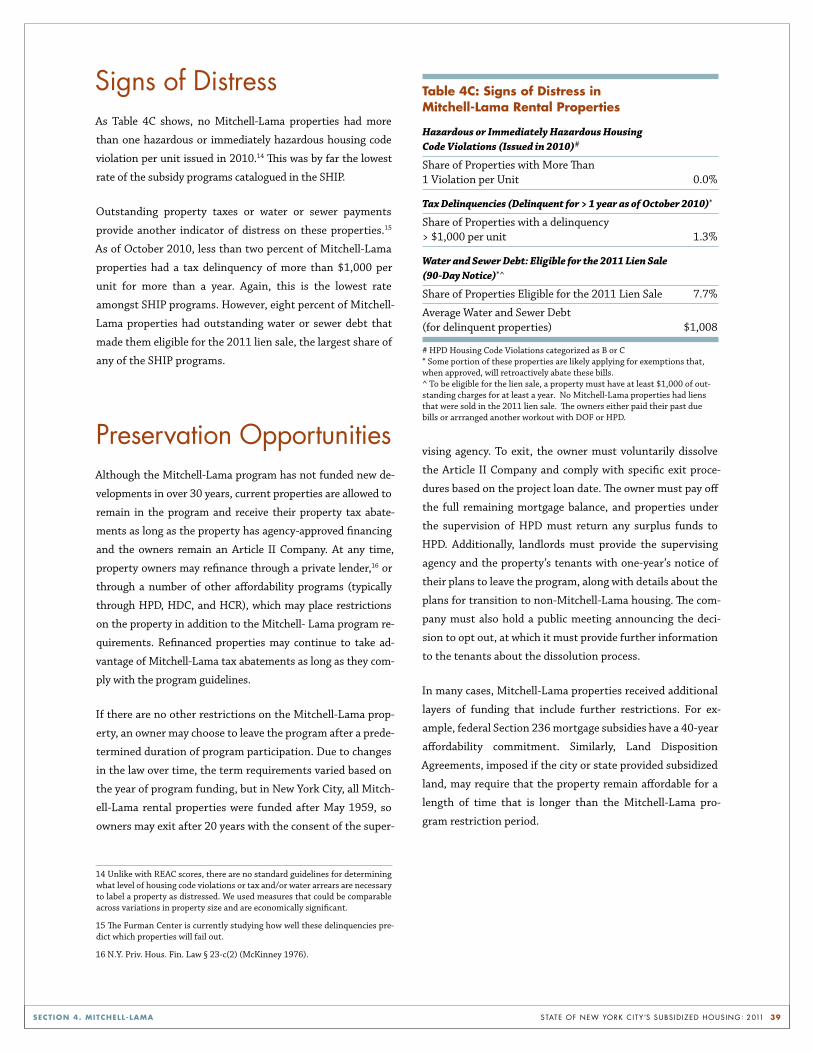
state of new York citY’s subsid ized housing: 2011 39SECTIon 4. mITCHEll-lAmA
signs of DistressAs Table 4C shows, no Mitchell-Lama properties had more
than one hazardous or immediately hazardous housing code
violation per unit issued in 2010.14 This was by far the lowest
rate of the subsidy programs catalogued in the SHIP.
Outstanding property taxes or water or sewer payments
provide another indicator of distress on these properties.15
As of October 2010, less than two percent of Mitchell-Lama
properties had a tax delinquency of more than $1,000 per
unit for more than a year. Again, this is the lowest rate
amongst SHIP programs. However, eight percent of Mitchell-
Lama properties had outstanding water or sewer debt that
made them eligible for the 2011 lien sale, the largest share of
any of the SHIP programs.
preservation opportunitiesAlthough the Mitchell-Lama program has not funded new de-
velopments in over 30 years, current properties are allowed to
remain in the program and receive their property tax abate-
ments as long as the property has agency-approved financing
and the owners remain an Article II Company. At any time,
property owners may refinance through a private lender,16 or
through a number of other affordability programs (typically
through HPD, HDC, and HCR), which may place restrictions
on the property in addition to the Mitchell- Lama program re-
quirements. Refinanced properties may continue to take ad-
vantage of Mitchell-Lama tax abatements as long as they com-
ply with the program guidelines.
If there are no other restrictions on the Mitchell-Lama prop-
erty, an owner may choose to leave the program after a prede-
termined duration of program participation. Due to changes
in the law over time, the term requirements varied based on
the year of program funding, but in New York City, all Mitch-
ell-Lama rental properties were funded after May 1959, so
owners may exit after 20 years with the consent of the super-
14 Unlike with REAC scores, there are no standard guidelines for determining what level of housing code violations or tax and/or water arrears are necessary to label a property as distressed. We used measures that could be comparable across variations in property size and are economically significant.
15 The Furman Center is currently studying how well these delinquencies pre-dict which properties will fail out.
16 N.Y. Priv. Hous. Fin. Law § 23-c(2) (McKinney 1976).
vising agency. To exit, the owner must voluntarily dissolve
the Article II Company and comply with specific exit proce-
dures based on the project loan date. The owner must pay off
the full remaining mortgage balance, and properties under
the supervision of HPD must return any surplus funds to
HPD. Additionally, landlords must provide the supervising
agency and the property’s tenants with one-year’s notice of
their plans to leave the program, along with details about the
plans for transition to non-Mitchell-Lama housing. The com-
pany must also hold a public meeting announcing the deci-
sion to opt out, at which it must provide further information
to the tenants about the dissolution process.
In many cases, Mitchell-Lama properties received additional
layers of funding that include further restrictions. For ex-
ample, federal Section 236 mortgage subsidies have a 40-year
affordability commitment. Similarly, Land Disposition
Agreements, imposed if the city or state provided subsidized
land, may require that the property remain affordable for a
length of time that is longer than the Mitchell-Lama pro-
gram restriction period.
Table 4C: Signs of distress in mitchell-lama Rental Properties
Hazardous or Immediately Hazardous Housing Code Violations (Issued in 2010)#
Share of Properties with More Than 1 Violation per Unit 0.0%
Tax Delinquencies (Delinquent for > 1 year as of October 2010)*
Share of Properties with a delinquency > $1,000 per unit 1.3%
Water and Sewer Debt: Eligible for the 2011 Lien Sale (90-Day Notice)*^
Share of Properties Eligible for the 2011 Lien Sale 7.7%
Average Water and Sewer Debt (for delinquent properties) $1,008 # HPD Housing Code Violations categorized as B or C* Some portion of these properties are likely applying for exemptions that, when approved, will retroactively abate these bills.^ To be eligible for the lien sale, a property must have at least $1,000 of out-standing charges for at least a year. No Mitchell-Lama properties had liens that were sold in the 2011 lien sale. The owners either paid their past due bills or arrranged another workout with DOF or HPD.
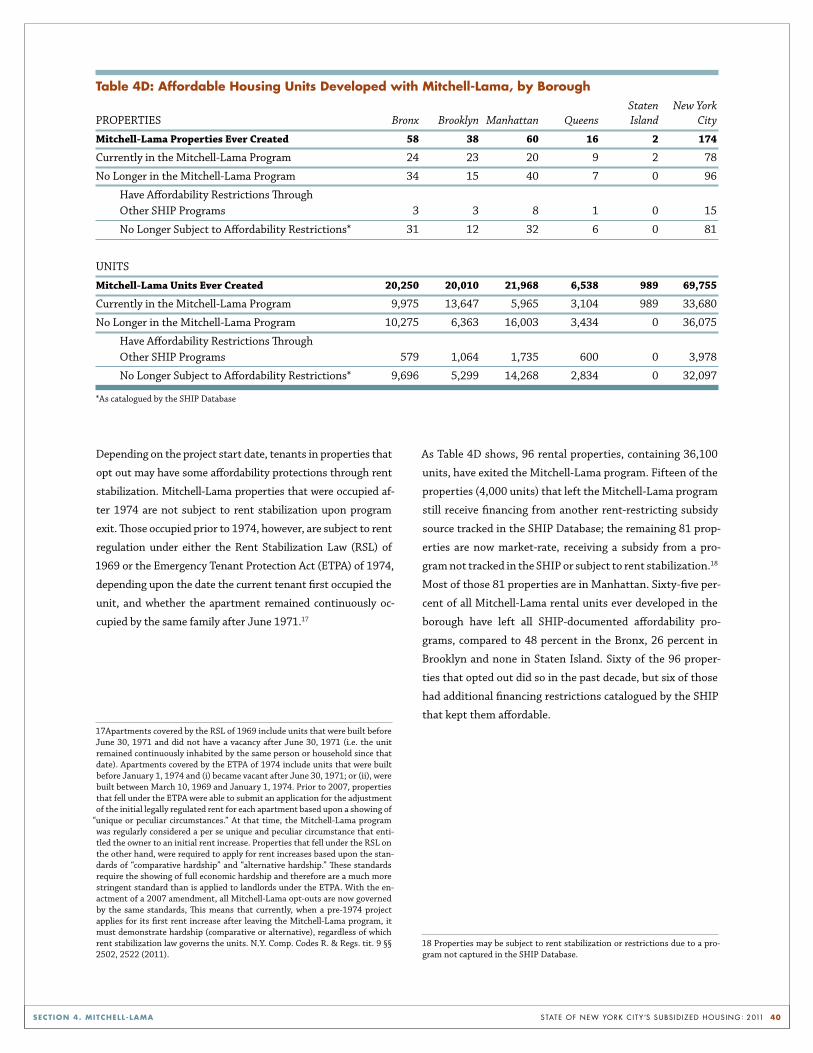
state of new York citY’s subsid ized housing: 2011 40SECTIon 4. mITCHEll-lAmA
Depending on the project start date, tenants in properties that
opt out may have some affordability protections through rent
stabilization. Mitchell-Lama properties that were occupied af-
ter 1974 are not subject to rent stabilization upon program
exit. Those occupied prior to 1974, however, are subject to rent
regulation under either the Rent Stabilization Law (RSL) of
1969 or the Emergency Tenant Protection Act (ETPA) of 1974,
depending upon the date the current tenant first occupied the
unit, and whether the apartment remained continuously oc-
cupied by the same family after June 1971.17
17Apartments covered by the RSL of 1969 include units that were built before June 30, 1971 and did not have a vacancy after June 30, 1971 (i.e. the unit remained continuously inhabited by the same person or household since that date). Apartments covered by the ETPA of 1974 include units that were built before January 1, 1974 and (i) became vacant after June 30, 1971; or (ii), were built between March 10, 1969 and January 1, 1974. Prior to 2007, properties that fell under the ETPA were able to submit an application for the adjustment of the initial legally regulated rent for each apartment based upon a showing of
“unique or peculiar circumstances.” At that time, the Mitchell-Lama program was regularly considered a per se unique and peculiar circumstance that enti-tled the owner to an initial rent increase. Properties that fell under the RSL on the other hand, were required to apply for rent increases based upon the stan-dards of “comparative hardship” and “alternative hardship.” These standards require the showing of full economic hardship and therefore are a much more stringent standard than is applied to landlords under the ETPA. With the en-actment of a 2007 amendment, all Mitchell-Lama opt-outs are now governed by the same standards, This means that currently, when a pre-1974 project applies for its first rent increase after leaving the Mitchell-Lama program, it must demonstrate hardship (comparative or alternative), regardless of which rent stabilization law governs the units. N.Y. Comp. Codes R. & Regs. tit. 9 §§ 2502, 2522 (2011).
As Table 4D shows, 96 rental properties, containing 36,100
units, have exited the Mitchell-Lama program. Fifteen of the
properties (4,000 units) that left the Mitchell-Lama program
still receive financing from another rent-restricting subsidy
source tracked in the SHIP Database; the remaining 81 prop-
erties are now market-rate, receiving a subsidy from a pro-
gram not tracked in the SHIP or subject to rent stabilization.18
Most of those 81 properties are in Manhattan. Sixty-five per-
cent of all Mitchell-Lama rental units ever developed in the
borough have left all SHIP-documented affordability pro-
grams, compared to 48 percent in the Bronx, 26 percent in
Brooklyn and none in Staten Island. Sixty of the 96 proper-
ties that opted out did so in the past decade, but six of those
had additional financing restrictions catalogued by the SHIP
that kept them affordable.
18 Properties may be subject to rent stabilization or restrictions due to a pro-gram not captured in the SHIP Database.
Table 4d: Affordable Housing units developed with mitchell-lama, by Borough Staten New YorkPROPERTIES Bronx Brooklyn Manhattan Queens Island City
Mitchell-Lama Properties Ever Created 58 38 60 16 2 174
Currently in the Mitchell-Lama Program 24 23 20 9 2 78
No Longer in the Mitchell-Lama Program 34 15 40 7 0 96
Have Affordability Restrictions Through Other SHIP Programs 3 3 8 1 0 15
No Longer Subject to Affordability Restrictions* 31 12 32 6 0 81
UNITS
Mitchell-Lama Units Ever Created 20,250 20,010 21,968 6,538 989 69,755
Currently in the Mitchell-Lama Program 9,975 13,647 5,965 3,104 989 33,680
No Longer in the Mitchell-Lama Program 10,275 6,363 16,003 3,434 0 36,075
Have Affordability Restrictions Through Other SHIP Programs 579 1,064 1,735 600 0 3,978
No Longer Subject to Affordability Restrictions* 9,696 5,299 14,268 2,834 0 32,097 *As catalogued by the SHIP Database
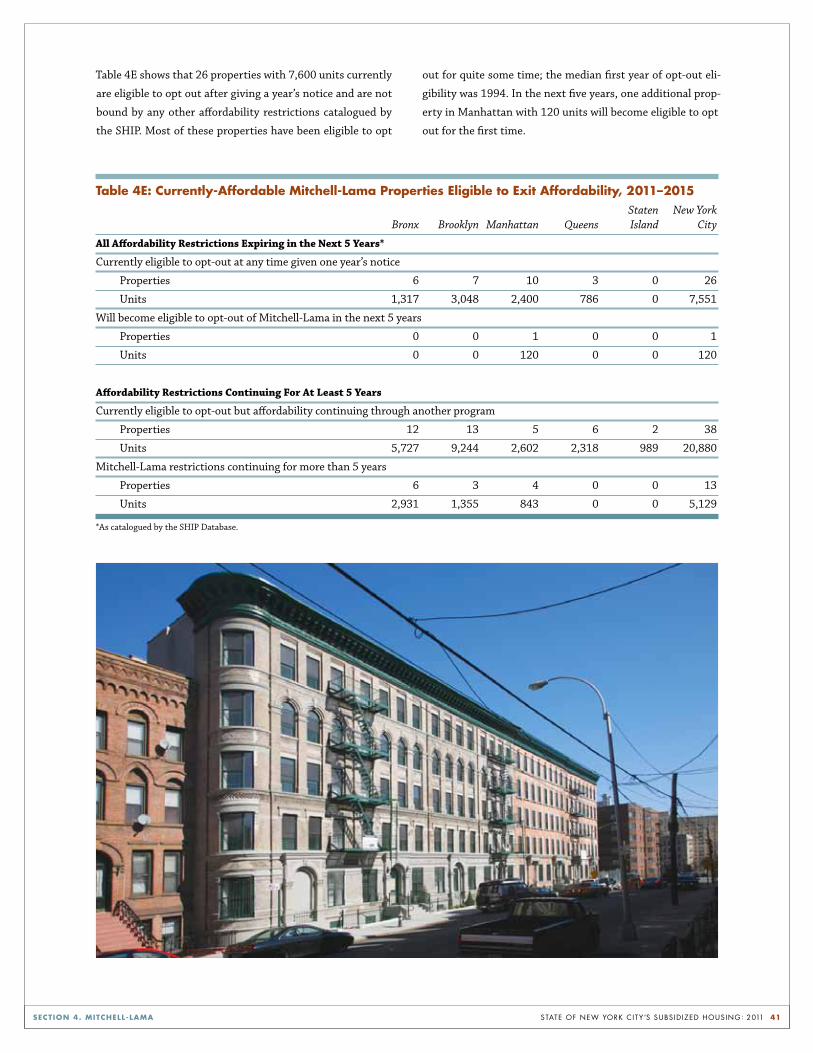
state of new York citY’s subsid ized housing: 2011 41SECTIon 4. mITCHEll-lAmA
Table 4E: Currently-Affordable mitchell-lama Properties Eligible to Exit Affordability, 2011–2015 Staten New York Bronx Brooklyn Manhattan Queens Island City
All Affordability Restrictions Expiring in the Next 5 Years*
Currently eligible to opt-out at any time given one year’s notice
Properties 6 7 10 3 0 26
Units 1,317 3,048 2,400 786 0 7,551
Will become eligible to opt-out of Mitchell-Lama in the next 5 years
Properties 0 0 1 0 0 1
Units 0 0 120 0 0 120
Affordability Restrictions Continuing For At Least 5 Years
Currently eligible to opt-out but affordability continuing through another program
Properties 12 13 5 6 2 38
Units 5,727 9,244 2,602 2,318 989 20,880
Mitchell-Lama restrictions continuing for more than 5 years
Properties 6 3 4 0 0 13
Units 2,931 1,355 843 0 0 5,129 *As catalogued by the SHIP Database.
Table 4E shows that 26 properties with 7,600 units currently
are eligible to opt out after giving a year’s notice and are not
bound by any other affordability restrictions catalogued by
the SHIP. Most of these properties have been eligible to opt
out for quite some time; the median first year of opt-out eli-
gibility was 1994. In the next five years, one additional prop-
erty in Manhattan with 120 units will become eligible to opt
out for the first time.

state of new York citY’s subsid ized housing: 2011 42
T he Low-Income Housing Tax Credit program was ad-
opted in 1986 to encourage the private sector to provide
equity for affordable housing developments.1 Under the
LIHTC program, the Internal Revenue Service allocates tax
credits to state housing agencies, which then allocate them to
developers who build or rehabilitate affordable housing. The
developers then sell the tax credits to investors in order to
raise capital for the project. Investors are able to use each dol-
lar of tax credit they purchase to offset one dollar of taxes due
each year for a ten-year period. From 1986 to 2007 (the latest
year for which national data is available), the LIHTC program
helped to finance 1.4 million units nationwide, with five per-
cent of those in New York City. By the end of 2010, 80,400
units had been financed in New York City. Nearly all (93%) of
those units remain affordable.
In order for a project to qualify for LIHTCs, either the devel-
oper must rent at least 20 percent of the project’s units to
households whose incomes are 50 percent or less of HUD’s cal-
culated AMI or the developer must rent 40 percent of the units
to households whose incomes are 60 percent or less of the
AMI.2 The federal law imposes different requirements in New
York City, where developers must rent at least 20 percent of
the project’s units to households whose incomes are 50 per-
cent or less of HUD’s calculated AMI or 25 percent of the units
to households whose incomes are 60 percent or less of the
AMI.3 Developers must offer these units at rents no higher
than 30 percent of the monthly income of the target group,
with annual adjustments thereafter.4
There are two forms of LIHTCs: allocated tax credits and non-
allocated tax credits. Allocated credits are often referred to as
“nine percent credits,” because the annual credit is equal to ap-
proximately nine percent of eligible project costs. By contrast,
1 Tax Reform Act of 1986, Pub. L. No. 99-514 (codified at 26 U.S.C. § 42 (2006)).
2 Low Income Housing Credit, 26 U.S.C. § 42(g)(1)(B) (2006).
3 Low Income Housing Credit, 26 U.S.C. § 42(g)(4) (2006).
4 Low Income Housing Credit, 26 U.S.C. § 42(g)(2) (2006).
non-allocated credits only provide approximately four percent
of most project costs annually, making the allocated “nine per-
cent” credits more valuable, thus enabling a developer to access
more capital. The federal government, however, limits the num-
ber of allocated nine percent tax credits that can be offered each
year by allocating to each state a certain number of tax credits
based on population.5 Because they are limited, the nine per-
cent credits are awarded on a competitive basis. Each allocating
agency is required to develop an annual Qualified Allocation
Plan as a basis for awarding their nine percent tax credits. The
Qualified Allocation Plan details the specific local regulations
governing the agency’s allocation procedure and explains how
it will score applications and monitor project compliance.
The non-allocated “four percent” credit offers developers ac-
cess to less capital, but the federal government does not di-
rectly limit the available amount of these credits. These credits
are issued “as-of-right” to any developer who applies for and
meets the program requirements. One requirement is that a
minimum of 50 percent of project costs must be financed with
tax-exempt revenue bonds.6 A developer that finances a project
with tax-exempt bonds but fails to meet this 50 percent
threshold may claim “as-of-right credits” on the portion of the
building to which the bonds are allocated.7 There is an implicit
limit on the amount of as-of-right LIHTCs that can be issued
each year because the annual authority for a state to issue
these bonds is also limited by the IRS on the basis of popula-
tion. Since 1986, 50,100 units of housing have been financed
in New York City using the nine percent tax credit, while
30,300 units have been financed with the four percent credit.
5 The amount of tax credits allocated to each state per resident has changed over time. At the inception of the LIHTC program, states received $1.25 of tax credits per resident. The Consolidated Appropriations Act of 2001 increased the per capita amount to $1.75 in 2002 and indexed the amount to inflation beginning in 2003. In 2009, under the Housing and Economic Recovery Act of 2008 (HERA), each state received $2.20 per capita. In 2010, Congress reduced this amount to $2.10 per resident. In the future, the allocation will be infla-tion-adjusted each year from this base amount. Low Income Housing Credit, 26 U.S.C. § 42 (h) (2006)).
6 Low Income Housing Credit, 26 U.S.C. § 42(h)(4)(B) (2006).
7 Low Income Housing Credit, 26 U.S.C. § 42(h)(4)(A) (2006).
section 5. low-income Housing tax Credits

state of new York citY’s subsid ized housing: 2011 43SECTIon 5. low-InComE HouSIng TAx CREdITS
Each allocating agency decides independently how to distribute
its share of LIHTCs. HCR allocates tax credits among qualifying
projects throughout New York State, including New York City.
HPD also receives a sub-allocation of nine percent tax credits
from New York State which it can only award to projects in New
York City. To date, 40 percent of the LIHTC units developed in
New York City have used credits allocated by HCR and 60 per-
cent of the units used credits allocated by HPD.
In order to benefit from the LIHTC program, a developer (the
“general partner”) typically forms a limited partnership with an
investor (the “limited partner”). An intermediary that con-
nects the developer with the investor, called a “syndicator,” of-
ten facilitates this partnership. The developer or syndicator
then sells the tax credits received from an allocating agency to
the investor in exchange for an equity interest in the partner-
ship that owns the property. The limited partnership is created
for a minimum 15-year period and includes the investor, who
owns at least a 99 percent share of the limited partnership,
and the general partner (developer), who owns at most a one
percent share. In the first ten years of the limited partnership,
investors use the ensuing tax credit benefits to reduce their tax
liability. However, the partnership continues for a minimum of
five additional years and is structured such that the investor’s
return is dependent on the property remaining in stable phys-
ical and financial condition for the full fifteen years and re-
maining in compliance with LIHTC regulations. This equity fi-
nancing structure enables the developer to charge the lower
rents required through the program because the developer can
reduce its long-term debt burden by using the funds received
in exchange for the tax credits to pay off a portion of the con-
struction loan, which results in a smaller permanent loan. The
equity proceeds are also used to create project reserves.
Under the original terms of the LIHTC program, participating
developers agreed to keep the housing affordable by continu-
ing to comply with the income requirements for the full term
of the 15-year limited partnership.8 This 15-year term is
known as the compliance period.9 In 1989, Congress over-
hauled the 15-year compliance period by establishing an ex-
tended-use period for an additional 15 years, effectively man-
dating a 30-year affordability restriction on post-1989 limited
partnerships. In addition to extending the affordability period
of many projects, the 1989 amendments allowed owners to
sell properties after fifteen years, for a set price based on the
adjusted investor equity (the aggregate amount invested ad-
justed by a cost of living factor) plus the outstanding debt on
the property, to a purchaser who agrees to maintain afford-
ability for the extended-use period. The allocating agency is
responsible for finding the purchaser. If such a purchaser can-
not be found, the extended-use mandate is terminated and the
affordability mandate is nullified.10
LIHTCs are often used in conjunction with other financing
sources, particularly in high cost markets, because the equity
from tax credits alone may not be sufficient to render a project
financially viable. Additionally, while the LIHTC program, un-
like other existing subsidies, can serve households with in-
comes below 50 to 60 percent of AMI, the tax credit financing
alone is often insufficient to allow developers to offer the units
to tenants with lower incomes.
8 The LIHTC was created by the Tax Reform Act of 1986. The program was originally set to expire in 1989, but it was extended several times before end-ing in 1992. The LIHTC was subsequently reintroduced and made a permanent part of the Internal Revenue Code by the Revenue Reconciliation Act of 1993, Pub. L. No. 103-66, § 13142)
9 26 U.S.C. § 42(i) (2006).
10 26 U.S.C. § 42(h)(6)(D) – (G) (2006).
Table 5A: lIHTC development History in new york City 1980s 1990s 2000s Total
LIHTC Properties Developed 39 581 965 1,585
Units in these Properties 3,011 32,326 45,058 80,395
Properties Developed
4 Percent Credits 0 37 158 195
units 0 6,157 24,188 30,345
9 Percent Credits 39 544 811 1,390
units 3,011 26,169 20,870 50,050
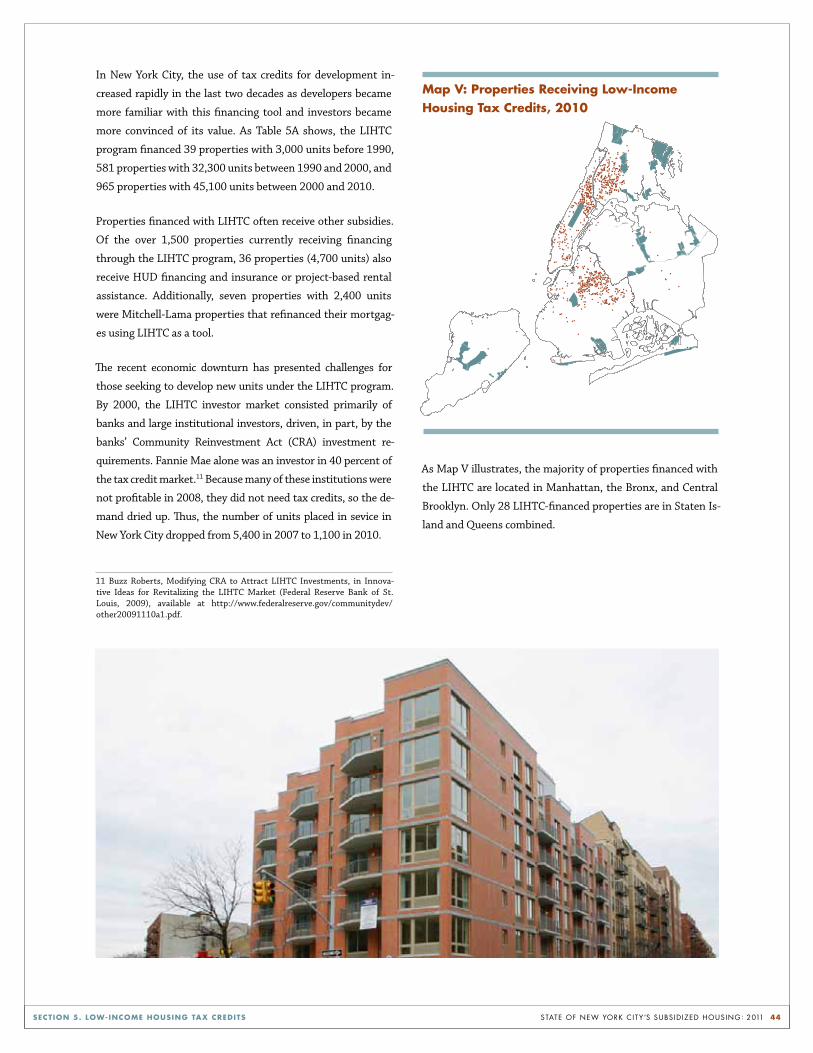
state of new York citY’s subsid ized housing: 2011 44SECTIon 5. low-InComE HouSIng TAx CREdITS
In New York City, the use of tax credits for development in-
creased rapidly in the last two decades as developers became
more familiar with this financing tool and investors became
more convinced of its value. As Table 5A shows, the LIHTC
program financed 39 properties with 3,000 units before 1990,
581 properties with 32,300 units between 1990 and 2000, and
965 properties with 45,100 units between 2000 and 2010.
Properties financed with LIHTC often receive other subsidies.
Of the over 1,500 properties currently receiving financing
through the LIHTC program, 36 properties (4,700 units) also
receive HUD financing and insurance or project-based rental
assistance. Additionally, seven properties with 2,400 units
were Mitchell-Lama properties that refinanced their mortgag-
es using LIHTC as a tool.
The recent economic downturn has presented challenges for
those seeking to develop new units under the LIHTC program.
By 2000, the LIHTC investor market consisted primarily of
banks and large institutional investors, driven, in part, by the
banks’ Community Reinvestment Act (CRA) investment re-
quirements. Fannie Mae alone was an investor in 40 percent of
the tax credit market.11 Because many of these institutions were
not profitable in 2008, they did not need tax credits, so the de-
mand dried up. Thus, the number of units placed in sevice in
New York City dropped from 5,400 in 2007 to 1,100 in 2010.
11 Buzz Roberts, Modifying CRA to Attract LIHTC Investments, in Innova-tive Ideas for Revitalizing the LIHTC Market (Federal Reserve Bank of St. Louis, 2009), available at http://www.federalreserve.gov/communitydev/other20091110a1.pdf.
As Map V illustrates, the majority of properties financed with
the LIHTC are located in Manhattan, the Bronx, and Central
Brooklyn. Only 28 LIHTC-financed properties are in Staten Is-
land and Queens combined.
• • •
•
•
•
•
•
•
•
••
•
•
••
•
••
•
•
• •
•
•
•
•
•
•
•
••
•
•
•••
•
••
••
•
•
••
•
••
••
•
••
•
•
••
••
••
•
•
•••
•
•
••
•
•
•
•
•
••
•
•
••
•
•
•
•
••
•
•
•
•
•
•
•
•
•
•
•
•
•
•
•
•
••
•
•
•
•
••
•
•
•
•
•
•
•••
•
•
•
•
•
•
•
•
••
•
•
•
•
•
•
•
•
•
•
•
•
•
•
•
••
••
•
•
•
•
••
•
••
•
•
•
••
•
•
•
•
•
•
•
•
•
•
•
•
•
•
•
•
•
•
•
•
•
•
•
•
•
•
•
•
•
•
•
•
•
•
•
•
•
•
•
•
•
••
•
•
••
•
•
•
•
•
•
• •
•
•
•
•
•
•
••
•
••
•
•
•
•••
•
•
•
•
•
•
•
••
•••
•
•
•
•
•
•
••
•
•
•
•
• •
••
••
•
••
•
•
•
•
••
•
•
•
•
••
•
••
•
•
•
•
•
•
•
•
•
•
•
•
•
•
•
•
•
•
••
•
•
•
••••
•
•
••
••
•••••
••• •
•
•
•• ••••••••
•••••
••• •
•
•
•
•
••
••
•
•
• •••
••••
••
•
•
•
••••
••
•
• •••
•••
••• ••
•
•
••• ••
••
••••••
•
•
•
•
•
•
••
•
•
••
••
••
•
•
•••••
•
•••
•
•• •••
• •••••
•
•
•
•
• •
•
••• ••
•
•
•
•• •
•
•
• • •
•••
•
•
•• •• ••
•
••
•
••
••
••• ••••
•••
•
•
•••••
•
•
•
•
•
•
• ••••
•
••••
•
•
•
••••
•
•••
••
•••••
••
•
•
•
•
•
•
•
••
•••• •• ••••
•
•
•
•
•
• •
•
•
••
••
•
•
••
•
•
•
•••
•
•
•
•
•
•
• •
•
••
•
• •
•
•
•
•
••
•
• •• •••
••
•
••
••••• ••
• •
•••••••
•
••
••
•• ••
•••••
•
•
•
••
•
••• ••••
•
•
••
•
••
•
•
•
••• •
••
•
••
•
•
••
•
•
•
••
•
•
•
• •••••
••••••
•• •• •••
•
•
•
••
•••••••••
•
•
••••
••••
•
•
••
•••
•
••
•
•
•
••
•••
•
•
•
•••
• •••
•
•••
• •••
••••••• •• •
•• ••
•••
••
•
••••
••
•
••
•••
•••• • •••
•
•
•
•
•
•
•
•
••••
•
••
••
•••••
•••••
• •• •• •
•••
••
•
•
•
•
•
•
•••
•
•
••
•
map v: Properties Receiving low-Income Housing Tax Credits, 2010

state of new York citY’s subsid ized housing: 2011 45SECTIon 5. low-InComE HouSIng TAx CREdITS
property profileWhen compared to other properties in the SHIP portfolio,
LIHTC projects tend to be older buildings with fewer units. The
median age of all multi-family rental apartment buildings in
New York City is 81 years, and the median age of LIHTC build-
ings is 78 years. This contrasts with a median age of 40 years
for Mitchell-Lama properties, 44 years for properties with
HUD financing and insurance, and 57 years for properties with
a HUD rental subsidy. The major reason that LIHTC properties
are older than other properties tracked in the SHIP Database is
that HPD has used most of its nine percent credits to rehabili-
tate existing properties through such programs as the Neigh-
borhood Entrepreneurs Program (NEP) and the Neighbor-
hood Revitalization Program (NRP). These two renovation
programs account for 61 percent of the nine percent tax credit
properties developed in New York City. The buildings rehabili-
tated through the NEP and NRP programs tend to be smaller
and older than the other tax credit properties, with an average
of 18 units per building, and an average age of 93 years.
signs of DistressLIHTC properties do not receive REAC scores to assess their
physical and financial condition unless they also have HUD fi-
nancing and insurance or project-based rental assistance. A
sample of these properties do receive an annual inspection
from their allocating agency; however, that information is not
available to the public. Thus, we must explore other ways of
assessing the health of these properties. Nearly three percent
of LIHTC properties received more than one hazardous or im-
mediately hazardous housing code violation per unit in 2010,
the highest rate of programs tracked in the SHIP Database.
Outstanding property taxes or water payments can offer some
indication of financial condition. As of October 2010, three
percent of LIHTC properties had a tax delinquency of at least
$1,000 per unit for more than a year, as Table 5C shows. This
were the second smallest share of any of the portfolios we
studied after the Mitchell-Lama portfolio. One possible expla-
nation for the relatively low signs of financial distress is that
the owner of an LIHTC project in financial distress can usually
access an operating reserve that was created at the same time
as the limited partnership. Also, LIHTC properties are usually
overseen by a private asset manager in addition to a govern-
ment regulating agency. Five percent of LIHTC properties
were eligible for the 2011 lien sale based on outstanding water
or sewer charges; none of these properties had liens that were
sold in the final sale.
Table 5B: Characteristics of lIHTC Properties
All NYC Multi-family LIHTC Properties Rental Properties
Average Number of Units per Property 50 30
Average Square Footage per Unit 980 890
Average Years Since Property Construction 78 81
Average Years Since First Subsidy 10 -
Table 5C: Signs of distress in lIHTC Properties
Hazardous or Immediately Hazardous Housing Code Violations (Issued in 2010)#
Share of Properties with More Than 1 Violation per Unit 2.8%
Tax Delinquencies (Delinquent for > 1 year as of October 2010)*
Share of Properties with a Delinquency of > $1,000 per Unit 2.7%
Water and Sewer Debt: Eligible for the 2011 Lien Sale (90-Day Notice)*^
Share of Properties Eligible for the 2011 Lien Sale 5.0%
Average Water and Sewer Debt (for delinquent properties) $1,393 # HPD Housing Code Violations categorized as B or C* Some portion of these properties are likely applying for exemptions that, when approved, will retroactively abate these bills.^ To be eligible for the lien sale, a property must have at least $1,000 of outstanding charges for at least a year. No properties with HUD financing and insurance had liens that were sold in the 2011 lien sale. The owners either paid their past due bills or arrranged another workout with DOF or HPD.

state of new York citY’s subsid ized housing: 2011 46SECTIon 5. low-InComE HouSIng TAx CREdITS
preservation opportunitiesSince the Low-Income Housing Tax Credit program’s inception
twenty-four years ago, 1,585 properties with 80,400 units
have been developed in New York City, as Table 5D shows.
Eighty properties with 5,300 units were subject to the shorter
15-year affordability restrictions and have left the LIHTC pro-
gram. Of those, 74 properties, with 5,000 units, are now mar-
ket-rate, rent stabilized, or have rent restrictions due to one of
the smaller affordability programs not covered by the SHIP.
The remaining six properties, with 320 units, continue to have
affordability restrictions based on new LIHTC financing or an-
other SHIP subsidy program.
For the 75,100 units developed after the 1989 changes to the
LIHTC program, “Year 15” is still a critical time period for pre-
serving affordability. Properties leave their limited partner-
ship after fifteen years, but owners can only convert the units
to market-rate rent before the end of the thirty year compli-
ance period if they can sell the property to a qualified buyer or
the regulating agency cannot find another purchaser who can
arrange a financing package that will enable them to meet the
affordability requirements. So far, 254 properties with 16,900
units have reached Year 15 and had the opportunity to leave
their limited partnership, but all remain subject to affordabili-
ty requirements. As Table 5E on page 47 shows, an additional
332 properties with 13,900 units will reach Year 15 by 2015.
Based on historical experience, it is unlikely that any of these
properties will be able to exit affordability at that point, but
some may require additional financing.
5d: Affordable Housing units developed with lIHTC, by Borough Staten New YorkPROPERTIES Bronx Brooklyn Manhattan Queens Island City
LIHTC Properties Ever Created 395 577 583 18 12 1,585
Currently in the LIHTC Program 379 551 547 18 10 1,505
Currently in their Limited Partnership 313 473 442 16 7 1,251
Have reached Year 15 66 78 105 2 3 254
No Longer in the LIHTC Program 16 26 36 0 2 80
Have Affordability Restrictions Through Other SHIP Programs 1 1 4 0 0 6
No Longer Subject to Affordability Restrictions* 15 25 32 0 2 74
UNITS
LIHTC Units Ever Created 21,643 16,638 39,039 2,433 642 80,395
Currently in the LIHTC Program 19,748 15,553 36,778 2,433 564 75,076
Currently in their Limited Partnership 15,655 12,266 27,700 2,075 447 58,143
Have reached Year 15 4,093 3,287 9,078 358 117 16,933
No Longer in the LIHTC Program 1,895 1,085 2,261 0 78 5,319
Have Affordability Restrictions Through Other SHIP Programs 104 21 199 0 0 324
No Longer Subject to Affordability Restrictions* 1,791 1,064 2,062 0 78 4,995
*As catalogued by the SHIP Database.
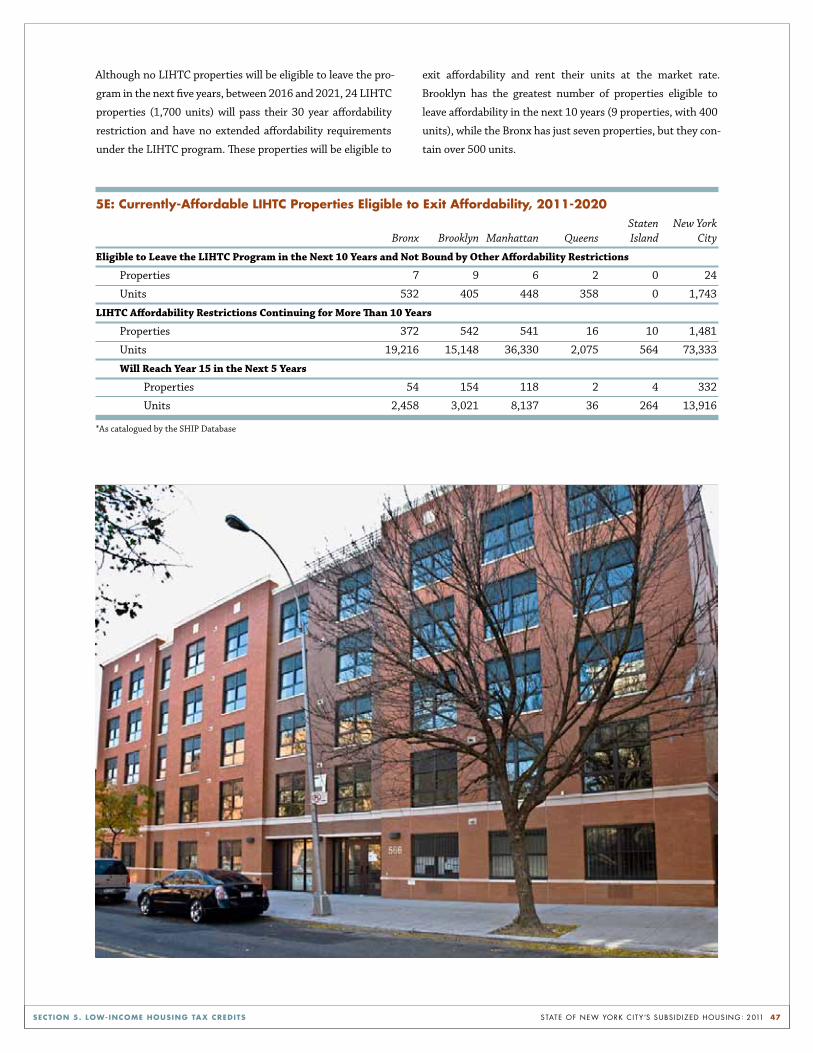
state of new York citY’s subsid ized housing: 2011 47SECTIon 5. low-InComE HouSIng TAx CREdITS
5E: Currently-Affordable lIHTC Properties Eligible to Exit Affordability, 2011-2020 Staten New York Bronx Brooklyn Manhattan Queens Island City
Eligible to Leave the LIHTC Program in the Next 10 Years and Not Bound by Other Affordability Restrictions
Properties 7 9 6 2 0 24
Units 532 405 448 358 0 1,743
LIHTC Affordability Restrictions Continuing for More Than 10 Years
Properties 372 542 541 16 10 1,481
Units 19,216 15,148 36,330 2,075 564 73,333
Will Reach Year 15 in the Next 5 Years
Properties 54 154 118 2 4 332
Units 2,458 3,021 8,137 36 264 13,916 *As catalogued by the SHIP Database
Although no LIHTC properties will be eligible to leave the pro-
gram in the next five years, between 2016 and 2021, 24 LIHTC
properties (1,700 units) will pass their 30 year affordability
restriction and have no extended affordability requirements
under the LIHTC program. These properties will be eligible to
exit affordability and rent their units at the market rate.
Brooklyn has the greatest number of properties eligible to
leave affordability in the next 10 years (9 properties, with 400
units), while the Bronx has just seven properties, but they con-
tain over 500 units.

state of new York citY’s subsid ized housing: 2011 48
section 6. state of subsidized housing: preservation opportunities
Table 6A: Affordable Housing Properties developed with SHIP Financing Staten New YorkPROPERTIES Bronx Brooklyn Manhattan Queens Island City
Properties Financed Through Any Programs Catalogued by the SHIP Database 649 821 876 72 36 2,454
Currently Subject to Affordability Restrictions 567 727 750 61 27 2,132
Have Extended Affordability Requirements Since 2000 21 39 33 7 6 106
No Longer Subject to Affordability Restrictions 82 94 126 11 9 322
Have Left Affordability Requirements Since 2000 57 63 76 7 4 207
UNITS
Units Financed Through Any Programs Catalogued by the SHIP Database 66,198 56,160 91,491 14,369 5,660 233,878
Currently Subject to Affordability Restrictions 48,932 42,927 65,030 10,463 4,192 171,544
Have Extended Affordability Requirements Since 2000 3,443 12,650 4,698 2,079 1,303 24,173
No Longer Subject to Affordability Restrictions* 17,266 13,233 26,461 3,906 1,468 62,334
Have Left Affordability Requirements Since 2000 11,110 4,347 16,505 1,793 249 34,004 *As catalogued by the SHIP Database
nearly 235,000 units of privately-owned and publicly-
subsidized affordable rental housing have been de-
veloped in New York City in the last fifty years under
the four categories of programs tracked by the SHIP Database.
Thus far, as Table 6A shows, 62,300 units in 322 properties,
representing nearly 27 percent of units ever subsidized in New
York City under these programs, have left all subsidy pro grams
tracked in the SHIP Database.1 A smaller share of those proper-
ties in Brooklyn have left affordability (13%) than other bor-
oughs; 33 percent of the properties ever subsidized in Staten
Is land are no longer receiving subsidies and in Manhattan, 17
1 It is possible that some properties have received financing through subsidy programs that are not yet included in the SHIP Database and have affordability restrictions through those programs. Additionally, many properties entered rent stabilization after their subsidy expired due to previous agreements or in exchange for tax abatements. In many HUD subsidized properties, while the rents may have increased to market rate, the current tenants often received Section 8 vouchers.
percent of the properties ever subsidized are now market rate,
rent stabilized, or have rent restrictions due to one of the
smaller affordability programs not covered by the SHIP.
In the 2000s, home prices rapidly appreciated and new resi-
dential construction increased dramatically. From 2000 to the
height of the market in 2006, home prices increased by 124
percent and by the end of 2008, over 170,000 new residential
units were completed, increasing the city’s housing stock by
nearly six percent.2 High demand for housing, along with the
increased availability of private financing, made converting to
market rate housing considerably more attractive for subsi-
dized property owners. In 2003, Mayor Bloomberg also
2 Home prices are based on the Furman Center’s repeat sales index, calculated based on data from the New York City Department of Finance. For more in-formation on this indicator, see: Furman Center for Real Estate and Urban Policy, “State of New York City’s Housing and Neighborhoods:2010.” Available at: http://furmancenter.org/research/sonychan/
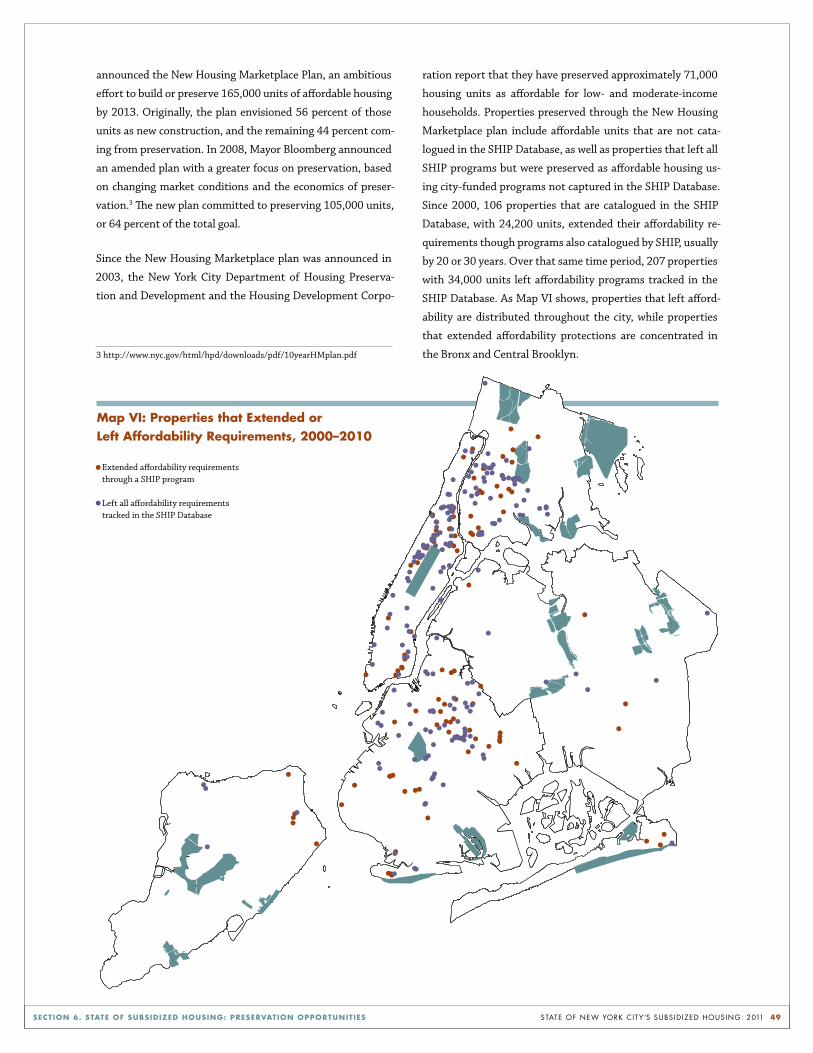
state of new York citY’s subsid ized housing: 2011 49SECTIon 6. STATE oF SuBSIdIzEd HouSIng: PRESERvATIon oPPoRTunITIES
map vI: Properties that Extended or left Affordability Requirements, 2000–2010
announced the New Housing Marketplace Plan, an ambitious
effort to build or preserve 165,000 units of affordable housing
by 2013. Originally, the plan envisioned 56 percent of those
units as new construction, and the remaining 44 percent com-
ing from preservation. In 2008, Mayor Bloomberg announced
an amended plan with a greater focus on preservation, based
on changing market conditions and the economics of preser-
vation.3 The new plan committed to preserving 105,000 units,
or 64 percent of the total goal.
Since the New Housing Marketplace plan was announced in
2003, the New York City Department of Housing Preserva-
tion and Development and the Housing Development Corpo-
3 http://www.nyc.gov/html/hpd/downloads/pdf/10yearHMplan.pdf
ration report that they have preserved approximately 71,000
housing units as affordable for low- and moderate-income
households. Properties preserved through the New Housing
Marketplace plan include affordable units that are not cata-
logued in the SHIP Database, as well as properties that left all
SHIP programs but were preserved as affordable housing us-
ing city-funded programs not captured in the SHIP Database.
Since 2000, 106 properties that are catalogued in the SHIP
Database, with 24,200 units, extended their affordability re-
quirements though programs also catalogued by SHIP, usually
by 20 or 30 years. Over that same time period, 207 properties
with 34,000 units left affordability programs tracked in the
SHIP Database. As Map VI shows, properties that left afford-
ability are distributed throughout the city, while properties
that extended affordability protections are concentrated in
the Bronx and Central Brooklyn.
•
••••
••
••
••
•••••••• ••
•• •
•
•• •• ••
•
•••
•••
•••
•• •
•
••
•
•
•
•
•
••
•
•
•
•
•
•
••
•
••
•
•
• •••
•
•
•
••
•
•••
••
•
•
•• •
••
••
•
••••
••
••
•
••
••
• •••••••••
••••• •• •••
••• •
•••••
• •••
••••
•••••
••
•
••
••
•••
•
•
••••
•
•
•
•••
••
•••
• ••••
•••
•••
••
•
•
••
•••
••
• •••
••
•
•
•
•
•
••
••
• •
•
•
••
•
•
•
••
•
•• •
•
•
• •
••
••
•••
•
•
•
•••
•
• •• •
•
•••
•
•
•
•
••
•••
••••••
••••••
• ••
•
•
•
•
•
•
•
•
••
•••
•
Extended affordability requirements through a SHIP program
Left all affordability requirements tracked in the SHIP Database

state of new York citY’s subsid ized housing: 2011 50SECTIon 6. STATE oF SuBSIdIzEd HouSIng: PRESERvATIon oPPoRTunITIES
tenants in properties leaving subsidy programsWhen properties leave affordability programs, whether or not
tenants must leave their units depends on the individual prop-
erty owner and the subsidy program it is exiting. In some cases,
the landlord may increase rents to levels unaffordable for exist-
ing tenants and they likely will be forced to leave. In other
cases, the landlord may not be able to command rents much
higher than existing tenants are paying, so tenants may be
able to stretch to pay the rent and remain in the unit. As dis-
cussed earlier, Mitchell-Lama properties generally enter rent
stabilization when they exit the program; this is sometimes
the case for other programs, particularly if property owners
seek tax abatements.
When the owner of a property chooses not to renew an expir-
ing project-based Section 8 contract, HUD offers tenants who
wish to stay in their units enhanced vouchers, provided they
are income-eligible. Tenants who choose to move receive a
tenant-based voucher that they can use to defray the rental
costs of a market rate apartment elsewhere. New tenants that
move into the property, though, will not receive a voucher.
preservation opportunities: a Five year outlookAs Table 6B shows, we find that 227 properties, with 38,800
units, will be eligible to leave affordability restrictions in the
next five years (by the end of 2015), because the affordability
requirements of all of the financing streams on the property
will expire. Many of these property owners, though, are un-
likely to exercise that right and forgo the subsidies they can
receive in exchange for continued affordability. Government
agencies, non-profit organizations, and developers with an
interest in preserving affordability will need a more nuanced
analysis to determine where to focus their preservation re-
sources.
To help guide that analysis, in this section, we analyze four cat-
egories of properties that will reach the end of an affordability
program in the next five years: properties expiring from a non-
renewable program; properties expiring from a renewable pro-
gram; Mitchell-Lama properties that already have the ability
to opt out at any time; and properties across the four portfoli-
os that have the potential to fail out of their subsidy program.
To determine the earliest date a property can leave its afford-
ability restrictions, we identify the financing source with the
latest expiration date on a particular property.
properties expiring from a non-renewable programThirty-four properties, containing more than 10,300 units,
will reach the end of their affordability requirements for all
subsidy programs, and will not be able to renew at least one
of their existing subsidy programs. This includes properties
receiving project-based rental assistance from the RAP or
Rent Supp programs, along with properties in Section 221(d)
(3) BMIR and Section 236 HUD insurance programs with
mortgages ending in 2015 or earlier. In order to adequately
finance these properties, the non-renewable program would
have to be replaced with some other subsidy program. Non-
renewable programs typically provide greater subsidy than
currently-available project-based rental assistance as well as
mortgage financing and insurance programs, so replacing
these lost subsidies generally requires creative or complex fi-
nancing arrangements.
Fourteen of the 34 properties, containing 7,000 units, have
non-renewable RAP or Rent Supp contracts that will expire
in the next five years, and are not bound by any other afford-
ability requirements in the SHIP Database. In the past, HUD,
working with local agencies, has converted some RAP and
Rent Supp contracts into project-based Section 8 contracts.
That option is not guaranteed, however; such conversions
must be negotiated on a case-by-case basis for each property.
Nearly half of these units are located in the Bronx: six prop-
erties in that borough with 4,200 units will come to the end
of Rent Supp or RAP contracts without another program in
place to preserve affordability.
The HUD Section 221(d)(3) BMIR and Section 236 programs
offered some of the deepest subsidies of any of the HUD fi-
nancing and insurance programs. Twenty-three properties
containing 4,000 units have non-renewable Section 221(d)(3)
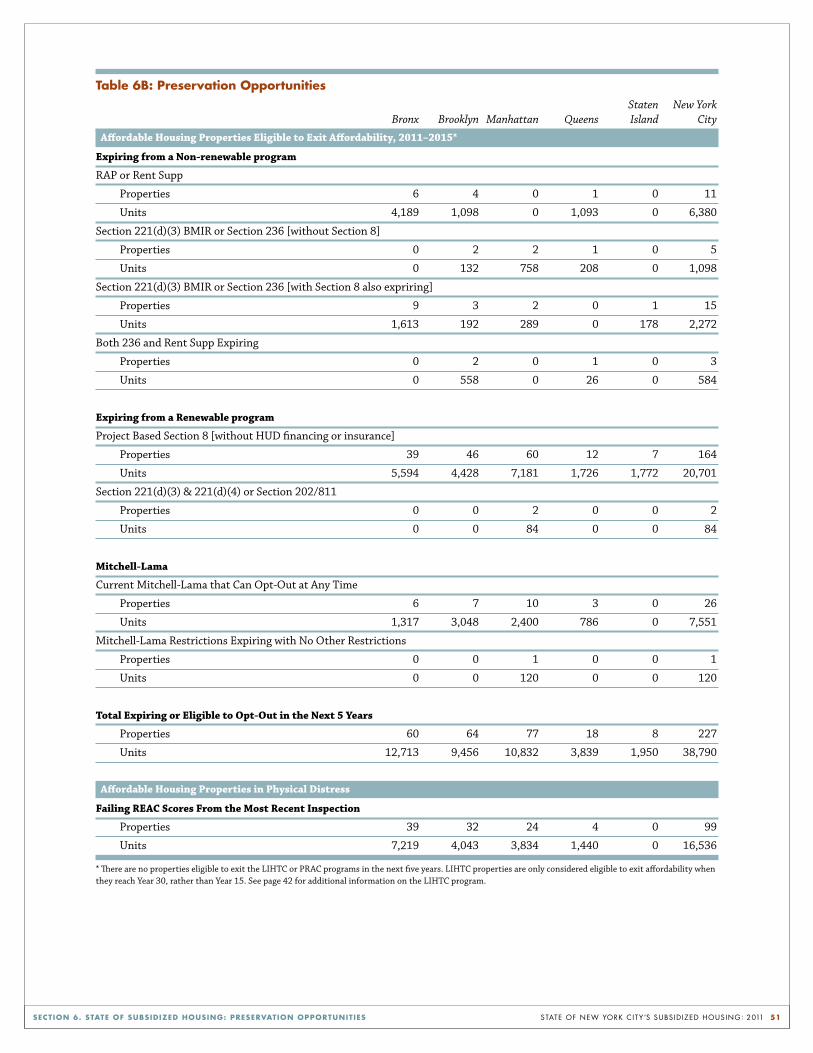
state of new York citY’s subsid ized housing: 2011 51SECTIon 6. STATE oF SuBSIdIzEd HouSIng: PRESERvATIon oPPoRTunITIES
Table 6B: Preservation opportunities Staten New York Bronx Brooklyn Manhattan Queens Island City
Affordable Housing Properties Eligible to Exit Affordability, 2011–2015*
Expiring from a Non-renewable program
RAP or Rent Supp
Properties 6 4 0 1 0 11
Units 4,189 1,098 0 1,093 0 6,380
Section 221(d)(3) BMIR or Section 236 [without Section 8]
Properties 0 2 2 1 0 5
Units 0 132 758 208 0 1,098
Section 221(d)(3) BMIR or Section 236 [with Section 8 also expriring]
Properties 9 3 2 0 1 15
Units 1,613 192 289 0 178 2,272
Both 236 and Rent Supp Expiring
Properties 0 2 0 1 0 3
Units 0 558 0 26 0 584
Expiring from a Renewable program
Project Based Section 8 [without HUD financing or insurance]
Properties 39 46 60 12 7 164
Units 5,594 4,428 7,181 1,726 1,772 20,701
Section 221(d)(3) & 221(d)(4) or Section 202/811
Properties 0 0 2 0 0 2
Units 0 0 84 0 0 84
Mitchell-Lama
Current Mitchell-Lama that Can Opt-Out at Any Time
Properties 6 7 10 3 0 26
Units 1,317 3,048 2,400 786 0 7,551
Mitchell-Lama Restrictions Expiring with No Other Restrictions
Properties 0 0 1 0 0 1
Units 0 0 120 0 0 120
Total Expiring or Eligible to Opt-Out in the Next 5 Years
Properties 60 64 77 18 8 227
Units 12,713 9,456 10,832 3,839 1,950 38,790
Affordable Housing Properties in Physical Distress
Failing REAC Scores From the Most Recent Inspection
Properties 39 32 24 4 0 99
Units 7,219 4,043 3,834 1,440 0 16,536
* There are no properties eligible to exit the LIHTC or PRAC programs in the next five years. LIHTC properties are only considered eligible to exit affordability when they reach Year 30, rather than Year 15. See page 42 for additional information on the LIHTC program.

state of new York citY’s subsid ized housing: 2011 52SECTIon 6. STATE oF SuBSIdIzEd HouSIng: PRESERvATIon oPPoRTunITIES
BMIR or Section 236 insurance on mortgages that will expire
in the next five years. These properties do not have project-
based rental assistance contracts that extend beyond the
length of their mortgages, but 15 of them do currently receive
project-based Section 8 subsidies which are renewable. The
Section 8 subsidy alone, however, is not always sufficient to
meet current operating and debt service needs, and these
properties may require new mortgage financing or insurance,
or other subsidies such as tax abatements. Three of the 23
properties will be expiring from both Section 236 and Rent
Supp programs and do not have any supplementary subsidies
to ensure affordability.
properties expiring from a renewable programWhile it is clear that properties expiring from non-renewable
programs would require new subsidy to remain affordable, it is
more difficult to determine whether new government subsidy
would be required to preserve affordability for any of the prop-
erties expiring from renewable programs. This category in-
cludes properties financed through Section 221(d)(3), Section
221(d)(4), Sections 202/811, project-based Section 8, and
PRAC. There are 166 properties that will expire from a renew-
able program; the vast majority of these properties are in
Brooklyn, the Bronx and Manhattan.
Of the 166 properties with subsidy expiration dates in the next
five years, 164 receive subsidized rental payments from proj-
ect-based Section 8 that will expire in the next two years. These
properties have the option to renew their contract at the end
of the contract term. However, until recently, contract exten-
sions have been offered only on a short-term basis, frequently
for just two years, with the option for further renewal depen-
dent upon whether the program continues to receive funding.
These short contract extensions created uncertainty for prop-
erty owners and investors, as well as for tenants (although ten-
ants would typically be eligible for enhanced vouchers, allow-
ing them to remain in the building affordably if the contract
was not extended). In 2011, though, HUD directed field offices
to offer 20-year contract renewals where possible, so this pat-
tern may change in coming years.
While we cannot necessarily use the past to predict future opt-
outs, 136 of the 172 project-based Section 8 contracts (80%)
that were due to expire between 2001 and 2009 renewed their
contracts. Although it is uncertain how many property owners
faced with the future option to opt out will chose continued
affordability, the experience of the last decade suggests that
many will.
Two of the 227 properties expiring in the next five years have
HUD Section 221(d)(3) & (4) or Section 202/811 mortgages
and no other subsidies covered by the SHIP beyond 2015. Al-
though these programs are still available to finance new mort-
gages, the subsidies offered through these programs are rarely
sufficient by themselves to keep a project affordable. In the
past, the city has used a combination of mortgage financing
programs and tax abatements to preserve similar properties,
and such subsidies are likely to be necessary to preserve these
two properties. For more information, see Programs Used to
Preserve Affordability (page 19).
mitchell-lama properties that Can opt-out at any timeCurrently, 26 Mitchell-Lama properties are already eligible to
leave the program, but their owners have not exercised that
option. Owners of these properties could leave the program
immediately, and have no other financing tracked in the SHIP
Database that would prevent them from converting the units
to market rate (or into rent stabilization, for the 18 properties
that were developed before 1974). Most of the Mitchell-Lama
properties already eligible to leave the program are in Manhat-
tan (10 properties); Brooklyn has seven properties, containing
a total of more than 3,000 units. Most of these properties have
been eligible to opt out for a considerable amount of time; the
median year that these properties were first eligible to opt out
is 1993. These properties continue to take advantage of the tax
benefits associated with the Mitchell-Lama program but main-
tain the option to leave the program, provided owners give one
year’s notice to tenants.
Additionally, one Mitchell-Lama property will become eligible
to leave the program in the next five years. In the past, the
housing agencies have been successful in preserving some of
the Mitchell-Lama properties that have fulfilled their obliga-
tions by inviting the owners to commit to extended affordabil-
ity through another financing program, such as an HDC bond
program or HUD financing and insurance.
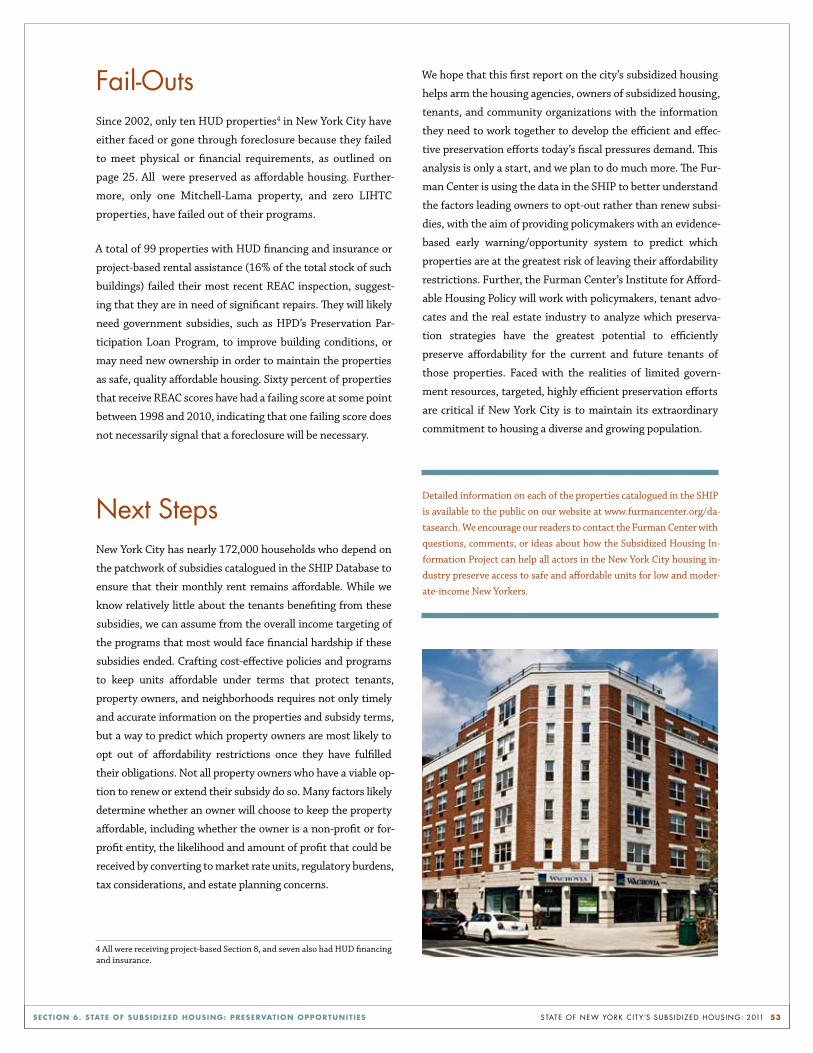
state of new York citY’s subsid ized housing: 2011 53SECTIon 6. STATE oF SuBSIdIzEd HouSIng: PRESERvATIon oPPoRTunITIES
Fail-outsSince 2002, only ten HUD properties4 in New York City have
either faced or gone through foreclosure because they failed
to meet physical or financial requirements, as outlined on
page 25. All were preserved as affordable housing. Further-
more, only one Mitchell-Lama property, and zero LIHTC
properties, have failed out of their programs.
A total of 99 properties with HUD financing and insurance or
project-based rental assistance (16% of the total stock of such
buildings) failed their most recent REAC inspection, suggest-
ing that they are in need of significant repairs. They will likely
need government subsidies, such as HPD’s Preservation Par-
ticipation Loan Program, to improve building conditions, or
may need new ownership in order to maintain the properties
as safe, quality affordable housing. Sixty percent of properties
that receive REAC scores have had a failing score at some point
between 1998 and 2010, indicating that one failing score does
not necessarily signal that a foreclosure will be necessary.
next stepsNew York City has nearly 172,000 households who depend on
the patchwork of subsidies catalogued in the SHIP Database to
ensure that their monthly rent remains affordable. While we
know relatively little about the tenants benefiting from these
subsidies, we can assume from the overall income targeting of
the programs that most would face financial hardship if these
subsidies ended. Crafting cost-effective policies and programs
to keep units affordable under terms that protect tenants,
property owners, and neighborhoods requires not only timely
and accurate information on the properties and subsidy terms,
but a way to predict which property owners are most likely to
opt out of affordability restrictions once they have fulfilled
their obligations. Not all property owners who have a viable op-
tion to renew or extend their subsidy do so. Many factors likely
determine whether an owner will choose to keep the property
affordable, including whether the owner is a non-profit or for-
profit entity, the likelihood and amount of profit that could be
received by converting to market rate units, regulatory burdens,
tax considerations, and estate planning concerns.
4 All were receiving project-based Section 8, and seven also had HUD financing and insurance.
We hope that this first report on the city’s subsidized housing
helps arm the housing agencies, owners of subsidized housing,
tenants, and community organizations with the information
they need to work together to develop the efficient and effec-
tive preservation efforts today’s fiscal pressures demand. This
analysis is only a start, and we plan to do much more. The Fur-
man Center is using the data in the SHIP to better understand
the factors leading owners to opt-out rather than renew subsi-
dies, with the aim of providing policymakers with an evidence-
based early warning/opportunity system to predict which
properties are at the greatest risk of leaving their affordability
restrictions. Further, the Furman Center’s Institute for Afford-
able Housing Policy will work with policymakers, tenant advo-
cates and the real estate industry to analyze which preserva-
tion strategies have the greatest potential to efficiently
preserve affordability for the current and future tenants of
those properties. Faced with the realities of limited govern-
ment resources, targeted, highly efficient preservation efforts
are critical if New York City is to maintain its extraordinary
commitment to housing a diverse and growing population.
Detailed information on each of the properties catalogued in the SHIP
is available to the public on our website at www.furmancenter.org/da-
tasearch. We encourage our readers to contact the Furman Center with
questions, comments, or ideas about how the Subsidized Housing In-
formation Project can help all actors in the New York City housing in-
dustry preserve access to safe and affordable units for low and moder-
ate-income New Yorkers.
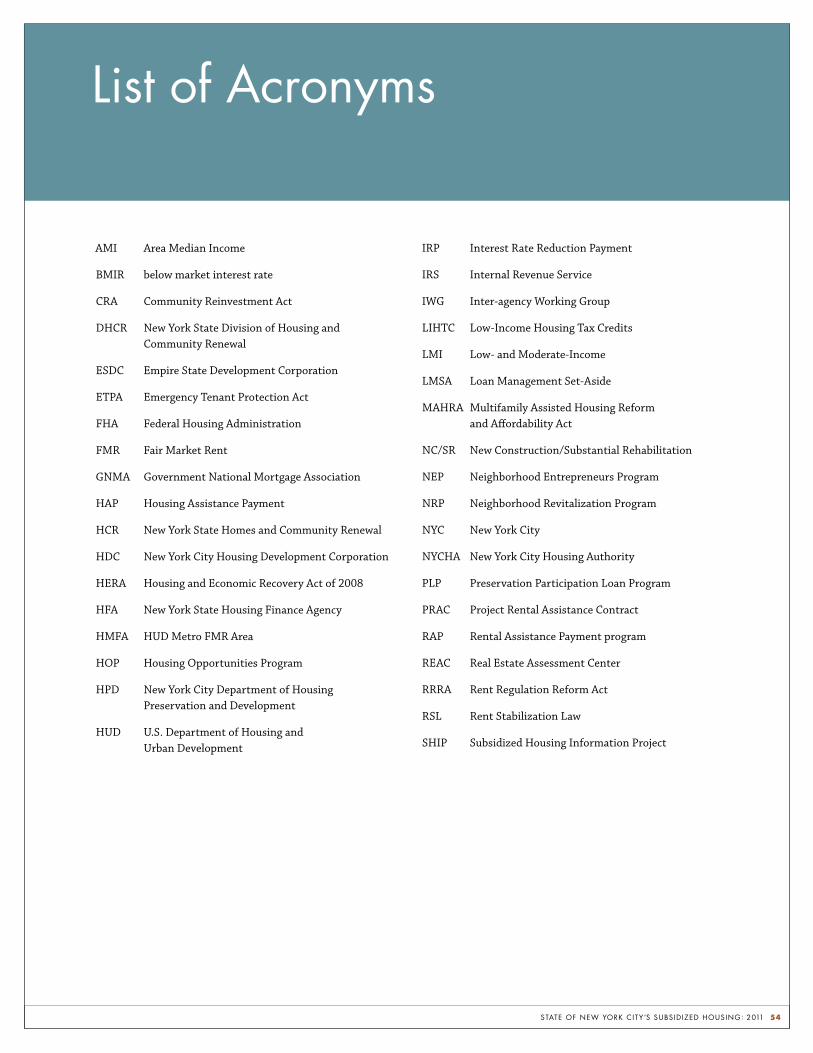
state of new York citY’s subsid ized housing: 2011 54
AMI Area Median Income
BMIR below market interest rate
CRA Community Reinvestment Act
DHCR New York State Division of Housing and Community Renewal
ESDC Empire State Development Corporation
ETPA Emergency Tenant Protection Act
FHA Federal Housing Administration
FMR Fair Market Rent
GNMA Government National Mortgage Association
HAP Housing Assistance Payment
HCR New York State Homes and Community Renewal
HDC New York City Housing Development Corporation
HERA Housing and Economic Recovery Act of 2008
HFA New York State Housing Finance Agency
HMFA HUD Metro FMR Area
HOP Housing Opportunities Program
HPD New York City Department of Housing Preservation and Development
HUD U.S. Department of Housing and Urban Development
IRP Interest Rate Reduction Payment
IRS Internal Revenue Service
IWG Inter-agency Working Group
LIHTC Low-Income Housing Tax Credits
LMI Low- and Moderate-Income
LMSA Loan Management Set-Aside
MAHRA Multifamily Assisted Housing Reform and Affordability Act
NC/SR New Construction/Substantial Rehabilitation
NEP Neighborhood Entrepreneurs Program
NRP Neighborhood Revitalization Program
NYC New York City
NYCHA New York City Housing Authority
PLP Preservation Participation Loan Program
PRAC Project Rental Assistance Contract
RAP Rental Assistance Payment program
REAC Real Estate Assessment Center
RRRA Rent Regulation Reform Act
RSL Rent Stabilization Law
SHIP Subsidized Housing Information Project
list of acronyms

state of new York citY’s subsid ized housing: 2011 55
John Sexton Richard L. Revesz Ellen SchallPresident Dean DeanNew York University New York University Robert F. Wagner Graduate School of Law School of Public Service New York University
Jeffrey BrodskyPresidentThe Related Companies
Sean Burton (’97)President & CEOCityView
Donald CapocciaPartnerBFC Partners
Rafael CesteroManaging DirectorL+M Development Partners
Martin DunnPresidentDunn Development Corp.
Alan Epstein (’84)PartnerHirschen Singer & Epstein LLP
Joseph GeraciManaging DirectorCitigroup
Alicia GlenManaging DirectorGoldman Sachs Urban Investment Group
Rosanne HaggertyPresidentCommon Ground
Jeffery HaywardSenior Vice PresidentFannie Mae
Edmundo HidalgoPresident & CEOChicanos Por La Causa
Richard HollidayPresidentHolliday Development
Terri LudwigExecutive Vice President and Chief Executive OfficerEnterprise Community Partners, Inc.
Patrick McEnerneyManaging DirectorDeutsche Bank
Ronald Moelis (’82)Chief Executive Officer and ChairmanL + M Development Partners, Inc.
Denise ScottManaging DirectorLISC New York City
Kenneth D. WadeSenior Vice President, Community Affairs ExecutiveBank of America
Adam WeinsteinPresident and Chief Executive OfficerPhipps Houses
Aviva Yakren Partner Jones Day
we would also like to thank the Institute for Affordable Housing Policy Advisory Board members:
we would like to thank the following people, whose leadership, advice, and support are invaluable: