school lunch participation: evaluating reimbursable meals
TRANSCRIPT

School Lunch Participation: Evaluating Reimbursable Meals and A la Carte Sales in the School Setting
by
Ashley Krudop Powell
A dissertation submitted to the Graduate Faculty of Auburn University
in partial fulfillment of the requirements for the Degree of
Doctor of Philosophy
Auburn, Alabama August 4, 2018
Keywords: school lunch, school breakfast, participation, eligibility
Approved by
Maria Witte, Chair, Professor of Educational Foundations, Leadership and Technology Leslie Cordie, Assistant Professor of Educational Foundations, Leadership, and Technology
Jane Teel, Assistant Clinical Professor of Educational Foundations, Leadership, and Technology James Witte, Professor of Educational Foundations, Leadership, and Technology

ii
Abstract
The purpose of this study was to investigate student participation levels in the school
nutrition program in a school district. Additionally, the study investigated reimbursable meal
purchases compared to a la carte purchases. By investigating the relationships of school
reimbursable meals, a la carte sales, and meal status, Child Nutrition Programs will be better able
to assist in planning and proposing procedures for school programs under the Healthy, Hunger-
Free Kids Act of 2010. The program design included the collection of historical data of school
lunch and a la carte purchases for all high school students at the selected school during the 2016-
2017 school year. Student purchases were evaluated by school meal status (free, reduced, paid)
over the 180-day school year. The student population included 676 tenth grade students, 627
eleventh grade students, and 620 twelfth grade students for a total population of 1,923 students.
The free and reduced rate for this school population was twenty percent. Based on the data
collection and analysis, there are significant differences in lunch meal purchases and a la carte
sales based on meal status. The more meal purchases made in the school meal program indicated
increased a la carte purchases. The data revealed students with a paid lunch status had a higher
rate of a la carte items. However, purchases made by students with a free or reduced lunch status
were not eliminated.

iii
Acknowledgements
It is with a grateful heart that I want to thank the individuals that have assisted me on this
personal and professional journey. First, thank you to my committee chair, Dr. Maria Witte, for
your personal commitment to my success in the program. You are the motivator and encourager
for so many in the Adult Education department. To my committee, Dr. Leslie Cordie, Dr. Jane
Teel, and Dr. James Witte, thank you for your commitment to enhancing the lives of those
around us through supporting and polishing the adult educators in our communities. To Dr.
James Linder, thank you for reviewing and assisting this dissertation to its place in the world of
school nutrition and education.
To my husband, Kyle, thank you for assisting me and supporting me in my personal and
professional dreams. Your love and encouragement during this process is priceless. To my
children, Francie, Foster, and Addie, thank you for your patience while I completed my
homework. I dream that one day you will complete this process too! To my parents, James and
Hollace Krudop, thank you for always encouraging me to review the options, and to take the
opportunities in each step of life. I am the luckiest daughter in the world. To my sister and her
husband, Hadyn and Bart Swecker, thank you for going first and showing me the way to a PhD.
Finally, thank you, Lord Jesus, for Your divine power and goodness in life (2 Peter 1:3).

iv
Table of Contents
Abstract ......................................................................................................................................... ii
Acknowledgements ...................................................................................................................... iii
List of Tables .............................................................................................................................. vii
List of Figures ............................................................................................................................ viii
Chapter I: Introduction .................................................................................................................. 1
Statement of the Problem .................................................................................................. 3
Purpose of the Research .................................................................................................... 4
Research Questions ........................................................................................................... 4
Significance of the Study .................................................................................................. 4
Assumptions ...................................................................................................................... 5
Limitations ........................................................................................................................ 5
Organization of the Study ................................................................................................. 6
Definitions......................................................................................................................... 6
Chapter II: Literature Review ....................................................................................................... 8
Purpose of the Study ......................................................................................................... 8
Research Questions ........................................................................................................... 8
Successful School Lunch Programs .................................................................................. 8
Nutrition Standards ......................................................................................................... 12
Student Perceptions ......................................................................................................... 15

v
School Meal Participation ............................................................................................... 24
Free and Reduced Meal Eligibility ................................................................................. 28
Health and Wellness ....................................................................................................... 31
Workforce Development and Training ........................................................................... 35
Summary ......................................................................................................................... 39
Chapter III: Methods ................................................................................................................... 40
Purpose of the Study ....................................................................................................... 40
Research Questions ......................................................................................................... 40
Population ....................................................................................................................... 40
Data Collection ............................................................................................................... 42
Procedures ....................................................................................................................... 45
Summary ........................................................................................................................ 48
Chapter IV: Results ..................................................................................................................... 50
Purpose of the Study ....................................................................................................... 50
Research Questions ......................................................................................................... 50
Demographic Profile ....................................................................................................... 50
Research Questions ......................................................................................................... 52
Research Question One ....................................................................................... 52
Research Question Two ...................................................................................... 54
Research Question Three .................................................................................... 57
Summary ......................................................................................................................... 58
Chapter V: Conclusion ................................................................................................................ 59
Purpose of the Study ....................................................................................................... 59

vi
Research Questions ........................................................................................................ 59
Discussion ....................................................................................................................... 59
Implications..................................................................................................................... 62
Limitations ...................................................................................................................... 65
Recommendations ........................................................................................................... 66
Summary ........................................................................................................................ 62
References ................................................................................................................................... 68
Appendix A: Institutional Review Board Approval ................................................................... 80
Appendix B: Health Hunger Free Summary ............................................................................... 87
Appendix C: Meal Requirements................................................................................................ 98
Appendix D: Reimbursement Chart.......................................................................................... 100
Appendix E: Smart Snacks Chart ............................................................................................. 103

vii
List of Tables
Table 1. Student Population by Gender ...................................................................................... 51
Table 2. Student Population per Grade Level ............................................................................. 51
Table 3. Student Population by Race .......................................................................................... 51
Table 4. Student Population by Meal Status ............................................................................... 51
Table 5. Student Purchases of Reimbursable Meals ................................................................... 53
Table 6. Reimbursable Meals Quantity Total ............................................................................. 53
Table 7. ANOVA by Reimbursable Meals Quantity Total......................................................... 53
Table 8. MANOVA by Meal Status ........................................................................................... 53
Table 9. Student a la carte Purchases by Quantity ...................................................................... 55
Table 10. Test of Homogeneity of Variances, a la carte Quantity Purchases ............................. 55
Table 11. ANOVA, a la carte Quantity Total Purchases between Groups ................................. 55
Table 12. MANOVA, a la carte Quantity Purchases .................................................................. 56
Table 13. Student a la carte Purchases by Dollar Amount ......................................................... 56
Table 14. Test of Homogeneity of Variances, Purchases by a la carte Dollar Amount ............. 56
Table 15. ANOVA, a la carte Dollar Amount between Groups ................................................. 56
Table 16. A la carte Purchases by Dollar Amount...................................................................... 57
Table 17. Multiple Comparisons................................................................................................. 58
Table 18. Comparison of a la carte and Meal Purchases ............................................................ 58

viii
List of Figures
Figure 1. Average participation rates for the School Lunch Program since 1969 ...................... 10
Figure 2. Federal Cost of the School Food Programs since 1969 ............................................... 10

1
Chapter I: Introduction
Providing meals for children in America has been a noble cause over multiple
generations. Currently in a world consisting of four generations, meals complete with nutritional
sustenance provide benefits for the future health and welfare of the country. Within the school
setting, there is a specific department dedicated to feeding the children of America. Officially,
school meal programs have been an ongoing and pertinent part of the educational system since
1946. Legislation creating this workforce fleet originated with the Richard B. Russell National
School Lunch Act of 1946. The original National School Lunch Act of 1946 listed its purpose in
section two by stating:
It is hereby declared to be the policy of Congress, as a measure of national security, to
safeguard the health and well-being of the Nation's children and to encourage the
domestic consumption of nutritious agricultural commodities and other food, by assisting
the States, through grants-in aid and other means, in providing an adequate supply of
food and other facilities for the establishment, maintenance, operation and expansion of
nonprofit school lunch programs. (U.S., 2017b, p. 1).
The original National School Lunch Program has been amended throughout time through
legislative changes to broaden the availability of the program, financial services, commodity
distributions, and general practices. The program functions under the United States Department
of Agriculture (USDA) Food and Nutrition Services (FNS) in whose purpose is “to increase food
security and reduce hunger by providing children and low-income people access to food, a
healthful diet and nutrition education in a way that supports American agriculture and inspires
public confidence” (USDA, 2017b, p. 1). Programs under the Food and Nutrition Services of
USDA include Child Nutrition Programs (CNP), Supplemental Nutrition Assistance Programs

2
(SNAP), and emergency food assistance needs. Child Nutrition Programs include the National
School Lunch Program (NSLP), School Breakfast Program (SBP), Child and Adult Food
Program (CAFP), Summer Food Service Program (SFSP) and the Fresh Fruit and Vegetable
Program (FFVP).
In 2010, the Healthy, Hunger-Free Kids Act (HHFKA) was introduced as new legislation
and created new guidance and regulations for school lunch and breakfast programs across the
United States. The program changes were multi-faceted, targeting core nutritional components
of the program as well as direct certification, school wellness policies, reimbursement rates,
school lunch pricing, professional standards, community eligibility, financial guidance,
procurement, food safety, and administrative guidance (U.S. FNS, 2017b). The HHFKA final
rule was issued in the federal register in January 2012.
As of the 2016 fiscal year, the number of students eating school lunches in the United
States as reported by USDA was an average 30.4 million students a month (USDA, 2017b). The
data were reported that 73% of these students were part of the free and reduced lunch program.
For breakfast meals, there were a monthly average of 14.57 million students participating in the
program thus reporting 85.1% of these students were on a free and reduced status (USDA,
2017a).
Under USDA, each state is given the authority to oversee the National School Lunch and
Breakfast, as well as other programs for their state. The Alabama State Department of
Education- Child Nutrition Program oversees the operations of the school sites and
administrative reviews, including corrective actions for the program. Reporting of the school site
participation, budgeting, capital planning, equipment purchases, commodity planning, and
program reimbursement is through the state program (ALSDE, 2017).

3
Participation in the NSLP and SBP program allows schools to be reimbursed for meals
served to their students through USDA funding. Student meal status is based on the federal
poverty level and may be approved through direct certification or an income-based family
application. Direct certification directly links a student lunch status to “free” through the school
site student information system based on the SNAP database system. Families that apply and are
within 130-185% of the poverty level receive a “reduced” lunch status. Family incomes that are
more than 185% of the national poverty level are eligible for free lunch. Students with a reduced
lunch status pay $.40 for lunch and $.30 for breakfast. All students in a school district will have
a “free”, “reduced”, or “paid” lunch status (ALSDE, 2017). Schools must follow all guidance to
meet administrative review standards to receive funding for the free and reduced meal program.
Participation rates for the Alabama School Lunch program for fiscal year 2016 was an
average of 515,621 meals a month. The Alabama School breakfast program has an average of
272,928 meals a month. Based on March 2017 data, the Alabama school lunch program has had
a 3.1% decrease in participation. In fiscal year 2012, the average monthly lunch participation
rate was 562,959 meals a month and the breakfast participation was an average of 224,490 meals
per month (ALSDE, 2017).
As with all federally funded programs, the school meal programs must comply with
regulatory guidance. This includes administrative and operational services provided to students
in the National School Lunch and National School Breakfast Program.
Statement of the Problem
There is a lack of research and investigation into the relationship of daily food sales and
school meal status, particularly student reimbursable meals and a la carte sales. Investigating

4
relationships yields information for evaluating the overall effectiveness of the National School
Lunch and National School Breakfast Programs.
Schools offer the school lunch programs to provide nutritionally integrated programs for
students. Without student participation, particularly those participating with a low
socioeconomic status, the National School Lunch Program would not be effective in its purpose
to provide healthy and nutritionally sound meals to students. Additionally, purchases outside a
reimbursable meal in a la carte sales determines a student’s priority of school meals as well as
their satisfaction of the quality of the program for the school and student population. School
purchases determine the overall participation and is part of the national initiative to fight child
hunger, childhood obesity, and the overall health and wellness of our nation.
Purpose of the Study
The purpose of this study was to investigate student participation levels in the school
nutrition program in a school district. This research will additionally investigate reimbursable
meal purchases compared to a la carte purchases. This research will identify participation levels
in the program under Healthy, Hunger-Free Kids Act of 2010.
Research Questions
The following questions were used in this study:
1. What is the relationship of reimbursable meals and school meal status?
2. What is the relationship of a la carte sales and school meal status?
3. What is the relationship of reimbursable meals and a la carte sales?
Significance of the Study
Overall participation of students in the National School Lunch Program and School
Breakfast Program determines the overall effectiveness of programs. School foodservice

5
programs are under critical review for use of federal funds to produce meals of nutritional
integrity, reduced food waste, and being financially prudent programs. The program cooperates
to provide socioeconomic data for other school-based programs and potential medical programs
and are therefore dependent on successful foodservice operations. The highly regulated menus
with stringent nutritional quotas have caused many foodservice programs to increase a la carte
sales while spending increased dollars to meet menu regulations. Participation levels from this
data will review trends based on strict and high-level nutritional regulations.
Assumptions
This study contained the following assumptions:
1. Data collection administrators performed in a manner that did not bias results.
2. Software used is accurate in processing and assessing data for results.
3. Statewide software, Chalkable, provided accurate student information.
4. Mosaic, a component of Heartland School Solutions, provided accurate tracking of
student status and student purchases for daily sales.
Limitations
This study was conducted in one school district.
1. This study was conducted in a district with a low free and reduced student population.
2. Student attendance was not tracked to daily sales.
3. Menus on participation days were not collected and compared to daily purchases.
4. The location of meal services was not considered with daily sales.
5. The study did not evaluate outside indicators such as serving line wait times, staffing
attitudes, or school day times.

6
Organization of the Study
The study is organized to provide a general background and reference point for the school
meal programs in the United States in Chapter I. The second chapter provides information and
studies related to school meal programs across America. Chapter III provides the method for the
study and Chapter IV provides the results of the study following the research questions identified
for the study. The final chapter, Chapter V, provides discussion on the findings and suggestions
for future research.
Definition of Terms
1. A al carte sales- food sales outside of the USDA credited reimbursable meal
2. Direct Certification (DC)- students identified in the school system with a free lunch
status based on the Alabama state SNAP program
3. Eligibility Status- relates to free ($0.00), reduced ($.40) or paid lunch ($2.50) status
of the student. The status is determined by federal income eligible guidance through
an application or by direct certification.
4. Food and Nutrition Services (FNS)- services related to nutrition and food under the
United States Department of Agriculture
5. Healthy Hunger Free Kids Act of 2010 (HHFKA)- legislation providing guidance and
regulations for school meal programs
6. National School Lunch Program (NSLP)- school lunch meal programs under the
United States Department of Agriculture
7. National School Breakfast Program (NSBP)- school breakfast meal programs under
the United States Department of Agriculture

7
8. Offer vs. Serve- determines if students choose all 5 meal components on the lunch
tray or if they are allowed to have less than 5 (usually 3) meal components to meet a
reimbursable meal
9. Participation- refers to students purchasing meals (particularly reimbursable meals) in
the school foodservice setting
10. Reimbursable Meal- refers to federal guidance on what determines a school meal.
The reimbursable meal must meet food components (grain, milk, protein, vegetable,
and fruit) and nutritional analysis standards. Only reimbursable meals receive federal
reimbursement rates.
11. Reimbursement Rates- refers to federal rates given to schools based on the number of
reimbursable meals served at a school site. Rates vary depending on eligibility status.
12. Socioeconomic Status- refers to the eligibility status of students in the school system
based on school lunch pricing
13. Smart Snacks- refers to foods sold to students outside of the reimbursable meal
including any a la carte or vending products. All foods sold in the school system
must meet specific nutritional components to be sold at school outside of the school
lunch meal.
14. Supplemental Nutrition Assistance Program (SNAP)- refers to the USDA program to
assist families with food. This was formerly known as the food stamp program.
15. Verification- refers to the federal process to validate student meal application status
has been filed correctly

8
Chapter II: Literature Review
In this chapter, research in the area of school meal programs including nutrition
standards, student perceptions, nutrition education, student preferences, student participation,
free and reduced meal eligibility, health and wellness, and the general program regulations will
be reviewed. This chapter will provide details supporting the operations as well as the struggles
of the school meals programs that affect purchases and overall participation of students in the
school lunch meal program.
Purpose of the Study
The purpose of this study was to investigate student participation levels in the school
nutrition program in a school district. This research will additionally investigate reimbursable
meal purchases compared to a la carte purchases. This research will identify participation levels
in the program under Healthy, Hunger-Free Kids Act of 2010.
Research Questions
The following questions were used in this study:
1. What is the relationship of reimbursable meals and school meal status?
2. What is the relationship of a la carte sales and school meal status?
3. What is the relationship of reimbursable meals and a la carte sales?
Successful School Lunch Programs
For the National School Lunch and Breakfast Program to be successful, students must be
participating and choosing to dine in cafeterias or in other dining areas supported by school food
programs. Roseman and Niblock (2007) approached participation through a review of a culinary
kitchen technique and presentation to prepare healthy menus. Through their findings they
attributed the five key factors for participation as: 1) food tastes good 2) food looks good 3) how

9
hungry the student is 4) food is healthy and 5) the amount of food. Sacheck (2012) completed a
case study reviewing three school districts and the districts’ overall strategies for improving
school nutrition. The authors documented the districts that have a “kids first commitment” and
listed five strategies to improvements for a program with fresh fruits and vegetables, wholes
grains, reduced processed food, and a farm to school program. The five strategies listed to
improve the school were:
1. Cooking more
2. Serving fresh fruits and vegetables
3. Making changes in competitive foods
4. Creatively sourcing healthful foods
5. Connecting food with the environment and good health
Key factors that influenced the changes in the district to make healthful nutritional
changes also influenced the financial status of the district. The changes for the districts were
either revenue neutral or had to be countered with reductions in other areas of the school
nutrition budget. The authors noted that the relationships with administration and all school
nutrition staff were important factors for the changes within the three districts (2012).
In the Figure 1 below, USDA provides data for the average participation rates for the
school lunch program beginning in 1969. The chart indicates the participation levels by the
school meal status of free, reduced, paid, and the total of all students for the year. In Figure 2,
the cost of the school meal programs since 1969 is documented for the school breakfast and the
school lunch program. The total costs for the program operations continues to increase each
year.

10
Figure 1. Average participation rates for the School Lunch Program since 1969, broken down by Free, Reduced, and Paid status.
Figure 2. Federal Cost of School Food Programs since 1969, broken down by School Breakfast, School Lunch, and Total.
Brown, Bednar, DiMarco, and Connors (2012) assessed School Nutrition Director’s
perspectives on the changes in the National School Lunch Program in a study to evaluate the
school environment of those receiving USDA Healthier US School Challenges awards. Through
0.0
10.0
20.0
30.0
40.0
50.0
60.0
70.0
1969
1972
1975
1978
1981
1984
1987
1990
1993
1996
1999
2002
2005
2008
2011
2014
2017
Aver
age
Part
icip
atio
n
Fiscal YearTotal Full Price Reduced Price Free
0.0
5,000.0
10,000.0
15,000.0
20,000.0
25,000.0
30,000.0
35,000.0
1969
1972
1975
1978
1981
1984
1987
1990
1993
1996
1999
2002
2005
2008
2011
2014
2017
Federal Cost of School Food ProgramsTotal School Breakfast 3 National School Lunch

11
a survey of 149 directors, 66 surveys were returned identifying the three most frequent
challenges. The challenges included whole-grain product availability, increased food costs, and
student acceptance. Other challenges listed per the directors surveyed were offering dark green
and orange vegetables, coordination/collaboration, including legumes on the menu, physical
education requirements, revising menus, time and paperwork. The results indicated the districts
had a slight increase in lunch participation with significant increased food and labor cost. The
study also displayed an increase in time for nutrition education. The top 3 indicators for success
with the changes when applying for the Healthier US Schools Challenge were support from
school staff/administrators, teamwork among foodservice and teaching staff, and changing
menus to meet requirements. Participation in the program indicated there was an increase of
sales of items that met the Dietary Guidelines for Americans 2010 (Brown et al., 2012).
With the addition of local school wellness policies, Litchfield and Wenz (2011) studied
the impact these legislative policies had on National School Lunch Program participation.
Through an evaluation of 24 schools from 16 school districts of middle and high schools, the
researchers conducted a survey, interviews, and observations. This research did not find any
significant changes in school lunch participation or competitive food sales. The research
indicated that the physical environment and free/reduced lunch meal status were the most
influential factors affecting sales in the school lunch program and competitive foods. Ishdorj,
Jensen, and Crepinsek (2012) acknowledged the characteristics of families participating in the
school programs and worked to identify the effects on participation through the legislative
policy. Determining factors of household size, geographic location, school enrollment affected
participation. Students that were more likely to participate in the NSLP were in smaller school
districts, lived in the southeast, families did not have college degrees, and were from black or

12
Hispanic families. Families with high school and middle school aged children had a lower
participation in the school meals program. Families with two parents employed participated in
the program and participation was higher for families that were eligible for free and reduced
lunches. In the parental survey, none of the food policies or variables were indicators for
participation in the school meal program (Ishdorj et al., 2012).
The school environment has a powerful influence over a child’s eating behavior. In a
study measuring eating behaviors of students at school including school vending and a la carte
sales, researchers measured the amounts of a la carte, vending, and total fats available compared
nutrient component intake (Kubik, Lytle, Hannan, Perry, & Story, 2003). Kubik et al. (2003),
stated:
A la carte availability was inversely associated with fruit and fruit/vegetable consumption
and positively associated with total and saturated fat intake. Snack vending machines
were negatively correlated with fruit consumption. Fried potatoes’ being served at school
lunch was positively associated with vegetable and fruit/vegetable intake. (p.1)
Nutrition Standards
In an article titled “New NSLP Guidelines: Challenges and Opportunities for Nutrition
Education Practitioners and Researchers” in the Journal of Nutrition Education and Behavior,
the authors stated “This is a critical time for nutrition education professionals, researchers, and
policy makers to assist with the implementation, measurement, and evaluation of such a broad-
reaching policy” (Byker, Pinard, Yaroch, & Serrano, 2013, p. 2). The authors noted that the task
of implementing the Healthy Hunger-Free Kids Act regulations for school food authorities is
challenging and is undergoing adaptations and interpretation. As indicated through the article,
the authors explained: “With these opportunities, challenges, and questions, it is vital that policy

13
makers, researchers, and practitioners work together to assess the implementation of the National
School Lunch Program, to promote policies and strategies that positively affect student health
and the future of our nation” (Byker et al., 2013, p. 9). The authors recommended nutrition
education will assist in overall policy support when parents, teachers, and foodservice personnel
have had interventions to create a better understanding on nutrition standards in the school
setting.
The American Dietetic Association supports nutritional integrity within the school
environment and uses the National School Lunch and Breakfast Programs foundations for
nutrition services and education in school districts across America. In the American Dietetic
Association position statement, it uses the Dietary Guidelines for Americans as the foundation
for nutritional guidance in schools. Briggs (2010) lists these components of nutrition integrity
for school meals below:
1. Only high quality, wholesome foods and beverages are available during school meals.
2. Only high quality, wholesome foods and beverages are available in competitive foods
including a la carte, vending machines, fundraising, school stores, parties, and
celebrations.
3. Students have quick and easy access to school meals and snacks
4. The school environment supports the consumption of healthy, nutrition foods.
5. Nutrition education is incorporated into the curricula
6. Physical activity has been integrated into the school day
In 2010, the American Dietetic Association, School Nutrition Association, and Society
for Nutrition Education worked together to form a position statement on the overall
comprehensive services of school food programs. The position states;

14
It is the position of the American Dietetic Association, School Nutrition, Association, and
Society for Nutrition Education that comprehensive, integrated nutrition services in
schools, kindergarten through grade 12, are an essential component of coordinated school
health programs that will improve the nutritional status, health, and academic
performance of our nation’s children. Local school wellness policies may strengthen
comprehensive nutrition services in schools by providing opportunities for
multidisciplinary teas to identify and address local school needs (Briggs, 2010, p. 1).
The Healthy Hunger Free Kids Act of 2010 implemented new changes and updates for
programs under USDA Food and Nutrition Services, particularly the school meal programs. The
HHFKA final rule was issued in the federal register in January 2012. Schools began to work to
address nutritional component changes for the program that addressed items such as sodium
levels, whole wheat and grain requirements, and caloric requirements. These nutritional
standards were alongside changes for free and reduced application processing, direct
certification, procurement standards, and wellness policies.
Echon (2014) studied the changes of the HHFKA and reviewed two years from menus in
39 districts with over 600,000 menus and productions records of sixty-one schools. Through this
review of menus, a school food image analysis system provided quantitative assessments of meal
patterns and nutrient compositions of the menus. The data from 2010-2011 and 2011-2012 was
compared to the HHFKA standards and guidelines to determine changes in school districts to
comply with the meal standards. The results from this review indicated that the menus did not
always meet standards for fruit, vegetable, whole grain, meal, milk, and caloric servings.
With the policies in place, Lyson’s (2017) research in “Food Fight! National Policy,
Local Dynamics, and the Consequences for School Food in the U.S.” evaluated systems in

15
operations for school programs. Lyson (2017) suggests six policy recommendations for the
program as listed below.
• Policy Recommendation 1- Significantly increase federal and state reimbursements
for school meals that meet federal nutrition requirements
• Policy Recommendation 2- Update federal school food procurement regulations so as
to require schools to source fresh foods from local farms.
• Policy Recommendation 3- Significantly increase federal funding to all school
districts for professional development training to teach school foodservice workers
the technical skills needed to cook fresh foods from scratch.
• Policy Recommendation 4- Enact a one-time federal investment to all school districts
to subsidize the cost of cafeteria and kitchen renovations.
• Policy Recommendation 5- Make nutrition education a mandatory component of K-
12 national science education standards
• Policy Recommendation 6- Enact and enforce stricter federal regulations for food
service management companies surrounding accountability and transparency.
Student Perceptions
With the nutritional changes and requirements to school menus, Alcaraz and Cullen
(2014) reviewed the perceptions of cafeteria staff in twelve schools in Houston, Texas. In this
large district of 37,000 students, the cafeteria staff were given a questionnaire to assess overall
quality, nutrition, variety, presentation and the taste of the food provided through the school
meals. The questionnaire provided additional questions related to food preferences, workload,
school staff/student feedback, and the worker’s statements for why students make meal choices.
Frequencies in responses were analyzed by school grade levels and then a chi square analysis
16
was completed to compare the grade levels. The overall applications per the study were that a
combination of interventions is the most effective way to assist students in choosing healthy
foods and influencing eating choices. The combination of interventions includes offering
healthy food options, nutrition education materials, marketing, verbal encouragement, and
creating opportunities for students to try new or healthy choices in the school (Alcaraz & Cullen,
2014).
Pucciarelli, McNeany, and Frieson (2013) conducted a study among adolescent teens to
identify nutrition knowledge. Through a 25-question survey, 287 students were surveyed on
nutrition knowledge. Additionally, student meal purchases for one week were followed using
the Meal Tracker programming. Results indicated low nutrition knowledge with no relationship
between nutrition knowledge and dietary choice.
As a major influencer for student perceptions may in fact be parental perceptions of the
school meals programs. Ohri-Vachaspati (2013) reviewed parental perceptions of school lunch
programs after the implementation of the Healthy Hunger-Free Kids Act of 2010. This analysis
specifically reviewed low-income families and the correlation between perception of healthier
meals and student participation in the program. The researchers concluded that parents can be
key stakeholders for student involvement and that partnering with parents will influence
participation in the program.
In 2010, Asperin and Castillo, reported in the Journal of Child Nutrition & Management,
the development of a best practice guide for school nutrition programs under the National School
Lunch Program. Through a best practice program model, the research panel created four practice
areas for school nutrition directors to evaluate and work with their programs. The four areas for
evaluation include food quality, staff, program reliability, and marketing & communications.

17
In a group of elementary students, grades 2nd-5th, researchers (Cashman, Tripurana,
Englund, & Bergman, 2010) studied the food preferences of students through a plate waste study
over a 40 day period of 5,400 student plates. The school was compiled of a culturally diverse
group with the majority of the students participating in the free and reduced lunch program.
Student plates were measured before and after the meal time and the difference indicated that the
majority of students failed to meet the nutrition standards of the food guide pyramid.
Recommendations suggested by the author improve plate waste included 1) Surveying student
families; 2) Gathering recipes from parents and modifying for home; 3) Standardizing recipes for
industrial quantities; 4) Allowing students to be involved in menu selection through taste testing;
5) Including students in the roll-out of new menu items; 6) Increasing meal flexibility during
service; 7) Scheduling lunch periods after recess; 8) Providing esthetically pleasing
environment; 9) Nutrition education in the classroom that is extended into the cafeteria; 10)
Cultural lessons in the classroom that extend to the cafeteria; 11) History lessons that celebrate
historical cuisine in cafeteria; 12) Geography lessons that include the types of food grown and
consumed in the different parts of the world.
Connors and Bednar (2015) also completed a food choice and plate waste study in the
2010-2011 academic year using digital photography to record student consumption and plate
waste. Their study indicated that entrees with meat or cheese provided little waste while students
rarely consumed vegetables categorized as dark green, red-orange, or legumes. The report
indicated half of the students discarded other vegetable items with moderate waste to bread/grain
items which were normally part of the school entrée. Students selected fruit one-third of the time
and chose canned fruit verses fresh fruit. Students selected chocolate milk over white milk.

18
In a study by Smith, Cunningham-Sabo, and Auld, (2015) of middle school students in
three schools in Northern Colorado, students reviewed 24 statements about the school lunch
program in the participation survey prepared by the National Foodservice Management Institute.
The study completed a Likert scale survey regarding food quality, menu choices, variety, service,
and the dining area of the students that make purchases in the school meal program and then of
the student that do not make purchases in the school meal program. The first survey, completed
by students that do not eat school lunch, provided a Likert scale to rate their level of agreement
on reasons they do not participate in the school lunch program. The survey completed by the
group of students that make school meal purchases, determined students highly agreed that food
preferences were healthy, food has variety, and food is properly cooked. This group also rated
high levels of staff service and staff friendliness. Students strongly indicated they wanted to
socialize during lunch, change food choices daily, and have the ability to purchase other items if
they do not choose lunch. The student survey of those students not making school meal
purchases indicated that the food did not look appealing, food did not look fresh, food did not
look healthy, and that the food did not look like it tasted good. This portion of the study also
indicated the cafeteria lines were long, students preferred food from home, parents bought food
for them to take to school, and that the food runs out on the cafeteria line.
In contrast to consumption and analysis of plate waste, a study to review the nutrients
selected and consumed during the school lunch at four elementary schools after the
implementation of the HHFKA was completed by Bergman et al. (2014). This study revealed
that there were significant improvements in nutrient selection and consumption when comparing
meals prior changes made to the school meal program in with the regulations of the HHFKA.

19
The nutrient changes included a reduction in sodium, calories, and fat with an increase in fiber.
The study also saw a reduction in calcium level.
Cohen et al. (2014) reviewed the impact of the Healthy Hunger-Free Kids Act of 2010
and determined that the meal selection and consumption of the meals had a positive impact for
the student. Positive impact included a higher consumption of fruits, vegetables and a total
decrease in plate waste for 1030 elementary and middle school students in an urban, low-income
school district. Students with less than twenty-five minutes for lunch verses students with
extended lunch periods had a significantly decreased consumption in nutrient-dense foods in a
student evaluated lunch study (Cohen, et al. 2014).
In a review of kindergarten and pre-kindergarten classes with a total of 304 students, food
waste was measured to evaluate meal components by waste (Byker, Farris, Marcenelle, Davis, &
Serrano, 2014). Of the total 4,988 ounces of food and beverages served, 2,261 ounces were
wasted in a one-week period. Food waste was indicated in all meal components with the
majority from vegetables, entrée, and milk. Cohen et (2016) completed another study
evaluating food waste with comparisons among varied lunch periods in 1001 students in grades
third though eighth grade. The schools in this study all implemented offer vs. serve systems for
lunch service times and had lunch periods varying from 20-30 minutes for a lunch period. This
school did not have other foods available during the lunch period. The study cited significantly
lower consumption of food components in those with shorter lunch periods.
Using a questionnaire to review customer service and preferences for middle school
students in Houston, Texas, Kjosoen, Moore, and Cullen (2015) completed a study documented
in the Journal of Child Nutrition & Management. The study listed the top five reasons students
participate in the school lunch program as: 1) I am hungry; 2) I didn’t bring anything to eat; 3)

20
It’s convenient; 4) I have no choice; 5) I can afford the price. Schools with higher free and
reduced students reported less satisfaction with meals. Sixth grade students reported the highest
satisfaction with NSLP meals compared to other grades. Sixth grade students and boys reported
selecting foods identified with higher nutrient content such as fruits, vegetables, and whole
grains.
Many food recalls and surveys list student self-reporting data of documented information.
A study of fourth grade students measuring accuracy of dietary recall using rate of omission and
intrusions was conducted in South Carolina. The study concluded that reducing the target period
for reporting diet recalls to a 24-hour period provided better accuracy than previous day recalls
(Baxter, et al. 2009). The Los Angeles Unified School District, one of the larger districts in the
United States, was the district evaluated for plate waste of fruits and vegetables in middle school
aged children (Gase, McCarthy, Robles, & Kuo, 2014). In this study, the food prepared for
service and the food left after service (production waste) along with the food taken by students
and the portions not eaten by the students (plate waste) were reported. One proposed strategy to
decrease food waste among the students was to provide complementary interventions to increase
selection and consumption of fruits and vegetables.
In contrast to increased plate waste, researchers working to collect data on plate waste of
middle school students in twelve schools in an urban, low-income school district, determined
that the changes in the Healthy Hunger-Free Kids Act of 2010 did not increase plate waste
(Schwartz, Henderson, Read, Danna, & Ickovics, 2015). The students participating in this study
increased fruit consumption, vegetables, and milk with an overall decrease in plate waste and a
positive response to school lunches.

21
Timing of the lunch period may affect the student food choices and consumption of
school lunch during the school day. A longer lunch period, greater than thirty-four minutes, was
documented as a potential benefit to better consumption of fruits and vegetables among middle
and high school students (Gosliner, 2014). Gosliner also discovered that including students in
food service decisions, providing a salad bar, and better food quality might be other factors to
improve fruit and vegetable consumption for students in these upper grade levels. Gosliner
concluded that changing student patterns for food consumption requires support from a variety of
avenues include school administrators, teachers, parents, and students. Gosliner further credited
necessary pattern changes must be supported by national, state, and local policy makers. He
argued that students with a sound nutrition practices and behaviors provide an improved
population of health.
Items sold outside of the school lunch reimbursable meal are termed a la carte foods or
competitive foods. All foods sold in the school must meet a la carte standards termed “smart
snack standards” (USDA, 2017 b, p. 3). These standards are set as part of the USDA guidance
for foods and details are listed in the smart snack standards chart. A calculator by the Alliance of
a Healthier Generation can be used to assist school sites in the evaluation of products for sales
and is available for use on their website.
In a unique study using a stoplight style tagging system, researchers coded meal and a la
carte foods in the cafeteria using nutritional value as the basis for the coding (Snelling, Korba, &
Burkey, 2007). The stoplight tagging system indicated foods with green as highly nutritional
value, yellow as average nutritional value, and red as minimal nutritional value. Through this
tagging system at three high schools, the student daily purchases were measured over a four-
week cycle. Results indicated that 77% of offerings in the school lunch program were green and

22
yellow coded items. Seventy-three percent of the purchases of the school meals were in the
green and yellow category. Of the a la carte foods, sometimes termed competitive foods, 61% of
the foods were coded with a red tag and were comprised of 83% of the a la carte food sales
(Snelling et al., 2007).
Templeton, Marlette, and Panemangalore, (2005) reviewed competitive foods and their
effect on student nutrition and energy and determined that students consumed lower amounts of
nutrients and energy than the recommended levels. Students that purchased competitive foods
had increased plate waste and a lower intake of school lunch servings meeting the school meal
standards. Students purchasing competitive foods had reduced calcium, and vitamin A intake.
School lunch energy intake decreased while the competitive foods provided 1/3 of the total
energy intake.
Briefel, Wilson, and Gleason (2009) completed a cross-sectional study on the 2004-2005
School Nutrition Dietary Assessment Study. Findings from the study indicated that students
consumed more energy-dense foods with a lower nutrient value at home than at school. They
suggested schools implementing wellness policies and reducing a la carte sales reduces the
consumption of energy-dense, low nutrient foods.
In response to data linked to low fruit and vegetable intake of children, a study
interviewed and recorded 103 fourth-sixth-grade students on their fruit and vegetable
consumption (Robinson-Obrien, Burgess-Champoux, Haines, Hannan, & Neumark-Sztainer,
2010). The study determined that student consumption of fruits and vegetables is lower than the
Dietary Guidelines for Americans 2005 and that students in the study consumed half of their
fruits and vegetables through school meal programs.

23
Providing nutrition education and information to students has been discussed as an
important way to assist in overall health and wellness for students and their meal selections.
Rainville, Choi, Ragg, King, and Carr (2010) completed a study to review the effects of posting
nutrition information in high schools at the place the student makes a purchase. In the school
setting, the place of purchase is referred to as the point of sale. In this study, 73 high-school
students participated in a focus group to determine if they thought nutrition labels at point of sale
systems would affect their meal purchases. Nutrition labels and information were posted at nine
school sites while eleven sites did not post nutritional information at the point of sale system.
The study used ANOVA and stepwise regression to contrast the schools with and without
nutritional information and determined the posting of the materials at purchasing did not
influence purchases. However, the authors did note a decrease in caloric and fat intake of one
control group and concluded that administrative control significantly influences healthy choices
available and therefore affects the amount of food purchased by the students. The authors
identified the influence of professionally trained staff such as registered dietitians to assist in the
development of menus to provide healthy meal options to students.
The National Coordinating Committee on School Health and Safety completed a project
linking school performance and overall health. Through a review of the literature, the project
divided the study into health- related sections categorized by 1) nutritional supplements and
micronutrients; 2) iron deficiency and supplementation; 3) food insufficiency; and 4) effect of
eating breakfast (Taras, 2005). The review concluded that vitamin and mineral supplementation
may not lead to academic benefits in the United States. However, it did determine that food
insufficiency does affect students’ academic performance and that the consumption of breakfast
for undernourished children improves academic performance standards.

24
Academic achievement was associated with breakfast consumption in a student test of
698 students in Texas (Ptomey et al. 2016). This study compared students based on gender,
ethnicity, race, meal status, parent education, household income during the standardized test of
based on their consumption of breakfast on the morning on the test.
Howard (2011) concluded that reducing food insecurity for children improves
interpersonal relations, self-control, and approaches to learning. These findings support the
school meals program and supports benefits of spending to support public assistance to reduce
food insecurity.
School Meal Participation
Lopez-Neyman and Warren (2016) completed a review of barriers and advantages based
on a literature review using the Social Ecological Model (SEM). The SEM model provided a
framework for identifying and understanding participation levels in the school breakfast program
based on human behaviors in the areas of intrapersonal, interpersonal, institutional, and public
policy. Twenty-four articles met the criteria and were used to identity advantages and barriers to
the school breakfast program. Results from the study indicated the barrier at the intrapersonal
level was the stigma of the school breakfast program. Food insecurity, age, race, and lack of
time to eat were also identified as intrapersonal barriers. Interpersonal barriers/advantages
included social network and social support system such as dislike for governmental interference,
regional values, school staff influence as well as parental influence. Institutional influences as
barriers/advantages included school grade level, school scheduling, geographic regions, school
staff (including cafeteria staff), cafeteria issues such as long lines, and time for meals scheduled.
Public policy level barriers/advantages were determined at the policy level of application
including income level and household size.

25
In a school lunch and breakfast participation study (Guinn, Baxter, Finney, & Hitchcock,
2013) fourth grade students’ meal habits were examined by weekday, month, socioeconomic
status, absenteeism, gender, and school breakfast location. This study demonstrated differences
in all listed categories except for gender. Authors indicated the need for administrative records
of children’s daily participation in meals provided while at school to assist in continued research
and analysis of school-based dietary reporting.
In assessing a la carte sales and participation, Probart, McDonnell, Hartman, Weirich,
and Bailey-Davis (2004) found the strongest predictor of a la carte sales was indicated by the
free and reduced percentage at the school site. In addition, the time of the lunch period indicated
more a la carte purchases. Enrollment and the number of vending machines were found to affect
a la carte sales as well as policy enforcement of prohibiting foods from local food establishments
to be brought in by parents or students. However, the study did not find any association in
school meal participation and a la carte sales. The study calculated the percentage of sales of a la
carte purchases and vending purchases by using enrollment and then the average of student
purchases. Actual purchases were not identified by the meal status of the individual student
(2004).
In two school settings, fourth and fifth grade student food consumption was assessed after
the introduction of a school snack bar over a two-year period (Cullen & Zakeri, 2011). Students
completed food records for five days, four times over a two-year period to reveal trends. In the
middle school, the study revealed 35-40% of student meals were exclusively purchased at the
snack bar. Fruits, vegetables, and milk decreased in the second year while high-fat vegetables
and sweetened beverages increased in the fourth to fifth grade level. In the fifth to sixth grade

26
level, vegetables and sweetened beverages decreased while high-fat vegetable and milk
increased. School meal food categories did not report a change in the food category sales.
Pricing of a la carte items is part of the evaluation of participation and sales. Twelve
schools in Minneapolis-St. Paul, Minnesota examined low-fat snack sales placed in vending by
analyzing pricing and promotional effects (French et al., 2001). Through the study, the
researchers discovered price reductions increased sales in low-fat items while not changing the
overall profit margins in vending sales. Promotions at the point of sale of the vending were
weakly associated with the low-fat sales. Therefore, the study indicated that pricing healthy food
choices at attractive and affordable prices while still covering costs for profitability margins.
In a California school district with school site data collection at seven middle and high
schools, a la carte offerings were reduced which in turn generated more school meal sales
(Bhatia, Jones, & Reicker, 2011). This particular study also indicated that the relationship of
these actions, including the removal of competitive a la carte offerings, may remove stigma and
potential discrimination for low-income students.
When comparing school lunches to home lunches, Hur, Burgess-Champous, and Reicks,
(2011) discovered that school lunches have a higher nutrient quality. School lunches included a
higher intake of protein, Vitamin A, Vitamin D, Vitamin K, and calcium while reducing caloric,
fat, Vitamin E, and sugar intake. Home lunches had a higher caloric value with less vegetables,
fruits, and whole grains.
In a review of 626 home lunch and snacks in schools in Minnesota, twenty seven percent
of the home lunches and four percent of the snacks met USDA’s National School lunch Program
or Child & Adult Care Food Program standards (Hubbard, Must, Eliasziw, Folta, & Goldberg,
2014). The study used digital photography with a food checklist to report categorized snacks and

27
foods in the packed lunch. The study also reviewed snacks the students planned to consume
during the school day. The author noted he was unaware of any other studies using this type of
analysis and also included the snacks for the school day. The study did not list the individuals
that packed the lunches, only the components of the lunches. The study included self-reported
items that students intended to purchase in the cafeteria such as milk or reusable packed items.
A study by Caruso and Cullen (2015) agreed with the Hubbard, et al. findings in the
2014 research as they completed a study of home lunches and evaluated nutritional content in 12
schools in Houston, Texas. In their study, they found that home lunches had increased sodium,
desserts, snacks, and chips with decreased fruit, vegetables, whole grains, and milk when
compared to school lunches following the National School Lunch regulations. Caruso and
Cullen (2015) also identified the cost of home lunches with an average price of $1.93 for
elementary students and $1.76 intermediate students. The authors indicated more research is
needed in demographic and regional areas to evaluate student home lunches. They suggested
studies to include comparisons of home and school lunch as well as parental attitudes toward
lunch components as compared for nutritional content. To conclude, the authors suggested home
lunches need nutrition interventions and guidance while including a cost analysis.
Discussion over the effects of the implementation of the Healthy Hunger-Free Kids Act
led researchers Johnson, Podrabsky, Rocha, and Otten (2016) to assess the nutritional changes
among the program. Their findings found that school meal participation rates were not
negatively impacted by the nutritional updates and changes in the program. The nutritional
implications were successful when measured by nutritional quality improving nutrient value and
energy assessments.

28
Free and Reduced Meal Eligibility
Fourteen states were represented in a study by Kwon, Lee, Park, Wang, and Rushing,
(2017) surveying 1,500 school nutrition personnel regarding the processing and verification of
free and reduced applications for the meal benefits in the School Lunch and Breakfast Programs.
Through this study, the authors concluded that using Supplemental Nutrition Assistance Program
(SNAP) assists in providing qualification for meals and reduces labor to verify applications. The
study also concluded that the process requires significant labor sources and that online
application processes reduced labor for school sites. Verification of free and reduced
applications using specific documents may be credited to over-certification and additional labor
for school sites. Free and reduced applications must complete a verification process to verify
family income levels and resources. The verification process is regulated by the standards set by
legislation under USDA. When systems allow free and reduced applications to include online
applications, the processing time is reduced and assists in accuracy in approval of free and
reduced applications (Kwon, et al. 2017).
While the free and reduced programs assist families with financial boundaries for their
families, school programs must continue to evaluate the success of a program using financial
analysis. Participation is a portion of this analysis but school districts must create a systematic
analysis of the program to determine continued participation in the National School Lunch
Program. Arbogast (2014) suggested that the analysis must be completed over a year and is a
difficult process for determining the process. The process must be a financial decision as well as
a customer satisfaction decision. To determine the best financial decision in regards to the
program, Arbogast (2014), suggested using the listed questions during the overall review:
1. What is the district’s percentage of students receiving free and reduced-price lunches?

29
2. What is the total overall participation rate in the National School Lunch Program?
3. What is the overall number of students consuming a la carte items?
4. What percentage do state and federal reimbursements contribute to the district’s
overall food service revenue?
5. Is the district willing to sell additional entrée only item at a reduced price to students?
6. What is the total percentage of revenue obtained from a la carte annually?
7. How much is the overall product cost going to increase or decrease with the
discontinuation of the National School Lunch Program?
8. What would the final student, adult, and visitor paid price be to assist in covering the
lost revenues, and will students pay the cost for a meal?
9. How much does daily participation need to increase to cover the lost federal and state
reimbursements? Is that required increase in participation achievable and sustainable?
10. Should outside consulting company be retained to assist the district in guiding the
evaluation and decision making process?
Arbogast (2014) indicated that nutritional regulations are affecting overall participation
rates. He suggested that the program evaluation must include participation rates, federal and
state reimbursements, customer satisfaction, and profits of the department. In his closing
remarks, he suggested that continued research efforts must be made to provide meals that
provide high quality but are cost effective (Arbogast, 2014). Huang and Barnidge (2015)
reviewed the National School Lunch Program and food insufficiency by accessing data from
longitudinal panels from the Survey of Income and Program participation. In their review, they
determined that children from low-income families that participated in the NSLP had a 14%
reduction in the risk of household food insufficiency thus protecting low income families from

30
food insufficiency. Data from this study also supports summer food assistance programs to
reduce food insecurity during times that school is out of session.
School lunch prices are determined through a formula designated from the Healthy
Hunger-Free Kids Meal Act of 2010 called Paid Lunch Equity. Girard (2013) questioned the
effectiveness of the formula calling for more local and district control for it to be beneficial for
school populations. Through her analysis, she evaluated the effectiveness of required pricing
formulas as they affect the program efficiency, effectiveness or best practice. With the
evaluation, it was expected that there would be unintended consequences for NSLP programs,
especially for the paid meal status participant. Peterson (2011) reviewed the school commodity
funding in review of school policies for districts. Funding fluctuations in commodities may
negatively affect the financial outcomes and potentially the nutrition outcomes district programs
and required more investigation for the effectiveness of commodity distribution for school
programs.
USDA (Hanson & Oliveira, 2012) reports that economic conditions affect the number of
students participating in the free and reduced meal programs. USDA reports that with the
implementation of direct certification, free and reduced meal applications increased under the
review, even during strong economic times. Along with economic changes, authors noted that
participation levels are affected by overall program policy changes or administrative practices.
Areas for nutrition assistance programs that are affected include eligibility rules, benefit levels,
application-certification processes, outreach, funding levels, program availability, demographics,
and the unemployment rate.

31
Health and Wellness
With the obesity epidemic at hand in the United States, school meal programs have been
criticized as contributing to childhood obesity. The Center for Disease Control (CDC, 2017)
reports the prevalence of obesity among children ages two to nineteen to be 18.5% or 13.7
million children in America. Of these children and adolescents, 13.9% are ages 2-5 years old,
18.4% are 6-11 years old, and 20.9% are 12-19 years old. Obesity in children and adolescents is
a body mass index, BMI, at or above the 95th percentile using sex and age specific growth charts.
The Center for Disease Control studied socioeconomic status as related to obesity rates. Data
revealed obesity decreases with an increased level of education in households. Obesity was
discovered in 18.9% of children and adolescents aged two to nineteen in low-income families,
19.9% in middle-income families, and 10.9% in high-income households. The lowest prevalence
of obesity was in the highest income level of non-Hispanic Asian and Hispanic boys. Lower
levels of obesity were also in high-income levels for non-Hispanic, Asian, and Hispanic girls.
In 2014, the CDC conducted study with USDA among children involved in the WIC food
assistance programs across the United States. This study revealed that 14.5% of children aged
two to four years participating in the food assistance program were obese. The levels of obesity
varied among the state for children ranging from 8.2% (Utah) to 20%(Virginia). Obesity levels
for the listed populations were 17.3% for Hispanic, 18.0% American Indian/Alaska Native,
12.2% non-Hispanic white, 11.9% non-Hispanic black, and 11.1% Asian/Pacific Island.
In Alabama, the overall levels of obesity and overweight are high for the state (CDC,
2017). Obesity is levels of BMI greater than thirty. Overweight levels are BMI ratings greater
than or equal to twenty-five but less than thirty. Thirty-six percent of Alabama ages 18 years or
older are obese. Thirty-four percent of the Alabama population is overweight. For children in

32
grades 9-12, sixteen percent were considered obese and 17% considered overweight. From 2014
data, sixteen percent of children ages two to four were considered obese and sixteen percent were
considered overweight. For children three to twenty-three months, thirteen percent had a high
weight for length ratio.
With an investigation into the topic of obesity compared to body mass index, data were
collected from 8 schools over a three-year period from fourth grade students to evaluate the
relationship of school meals and obesity. Student body mass index (BMI) was calculated as well
as school breakfast and lunch participation. Analysis of the data indicated a positive relationship
of BMI and observed energy intake as well as BMI and school breakfast in the classroom but
there was no significant relationship for BMI and participation in school meals. The study was
completed over three years and included an analysis of 1,780 students in fourth grade (Baxter et
al. 2010). Evidence from a cross sectional study completed by Gleason and Dodd (2009) found
no evidence concerning any connection between school lunch participation and student BMI
(Body Mass Index). Gleason and Dodd did find that those that participated in breakfast meals
had a significantly lower BMI, particularly non-Hispanic, white students. The study reviewed 24
hour dietary recalls along with parent and student surveys. BMI was determined by actual height
and weight measurements on site (2009).
School-wide practices have an influential place on the overall health of a child. In a
review of the relationship of BMI and school-wide food practices outside of the scheduled meal
times, it was determined that frequent snacking and consumption of nutrient-poor foods with
high caloric density adversely associated body mass index of students (Kubik, Lytle, & Story,
2005). Each food practice outside the allotted meal times associated with a 10% increase in
BMI. Outside food practices in the school setting adversely affecting BMI included food and

33
beverages in hallways or classrooms, high caloric foods/low nutrient dense foods in vending or
school stores, and food in school reward programs. Authors described that childhood measures
of obesity and instances of overweight children must include the promotion of healthy practices
in school sites with attention to nutrition integrity. School policies must follow the practices and
consistently support school related nutrition policies.
In a study that evaluated the consumption of fruits and vegetables of students receiving
free and reduced lunch, termed subsidies for this study, it was determined that fruit and vegetable
consumption is higher in those not participating in subsidized programs (Howard & Prakash,
2012). The study used data from a collection of models to determine the outcomes and
suggested more research in areas to review the barriers of the subsidized programs (particularly
the reduced meal price) as a barrier to low-income households. The study data included 5,140
students in fifth grade in public school. In the conclusion of the study, the authors recommended
more research in the barriers associated with access to meals even with the cost assistance for the
National School Lunch Program as well as other food assistance programs.
Because of the obesity crisis, researchers have continually tried to identify the
relationship of food insecurity and obesity. Larson and Story (2011) suggested more research in
six particular areas: 1) Longitudinal studies of food insecurity and weight status, particularly in
youth and adult men; 2) Qualitative and quantitative studies reviewing mechanisms that affect
food insecurity such as food shopping, feeding, and parenting practices; 3) Standard assessment
tool for determining food insecurity; 4) Longitudinal studies examining Supplemental Nutrition
Assistance Program and weight status; 5) Analytic methods to evaluate those that participate in
the assistance programs verses those that are eligible but do not participate; and, 6) Evaluate
changes to assistance programs that may assist in reducing obesity. In Crawford and Webb’s

34
review of food insecurity and obesity they stated, “The food programs are not likely to be the
problem, but rather an effective part of the solution” (2011, p. 274). They further suggested that
food intake is affected by economic and psychological factors that are rooted in the environment
or culture, particularly for those with long-term poverty. The National Health and Nutrition
Examination Survey evaluated data from 9,701 participants from 2001-2010. Kaur, Lamb, and
Ogden (2015) evaluated the relationship of food insecurity and obesity in children aging from 2-
11 years of age through the U.S. Department of Agriculture’s Food Security Survey Module. In
this assessment, obesity was associated with food insecurity in students aged 6-11 years of age.
The prevalence of obesity among children was reviewed by Ogden, Carroll, Kit and Flegal
(2014) evaluating the changes from 2003 to 2012. The review indicated that obesity continues to
be an issue and that there have been no significant changes from 2003 to 2012 when the review
was completed.
In a call for future studies, Sallis and Glanz (2006) indicated a need for evaluating the
overall environments that assist in the physical activity, eating, and obesity of the youth.
Changing the overall environment should assist in the improvement of physical activity,
healthful foods for youth and thus reflecting change in the overall obesity epidemic. In 2013, a
study examining whole grain consumption and overweight and obesity in children determined
whole grain may be beneficial to maintaining a healthy weight and therefore assisting in obesity
issues among children ranging from 2-17 years old (Choumekovitch, et al. 2013). The author
suggested that increasing nutrition education on whole grains as well as increasing whole grain
availability in low-income families should be implemented to improve healthy weights for
individuals.

35
School foodservice directors have indicated that they have an important part of the
school wellness and a responsibility for promoting healthy lifestyles in the school setting based
on a survey of 462 school nutrition professionals (Stinson & Lofton, 2009). Factors influencing
behaviors for wellness programs were cited as financial support, time, and support of other
individuals outside of the program. Stinson and Lofton suggested more research is needed to
determine best practices in gaining support among the school nutrition directors and managers in
a school district. Additionally, the authors suggested more research is needed in the
development of successful wellness programs among the school foodservice staff that can
identify the relationship of personal interests of behavior and health and how it related to the
school wellness environment and wellness programs.
In another study, implementation issues for wellness policies in districts were listed as
cost, stakeholder support, and overall enforcement (McDonnell & Probart, 2008). Health and
academic achievement related to the implementation of the wellness policies were cited as ways
to solicit support from the school district stakeholders. The researchers admitted that more state
and national data is needed to document the association of wellness policy implementation
strategies and the related results tin overall health and academic achievement.
Workforce Development and Training
Desirable skills for the school meal programs workforce are areas that continue to require
development and training but build environment for the administration of school meals and the
general school meal setting. The range of skills for individuals working in school foodservice
programs varies from food preparation, equipment operation, point of sale services, customer
service, bookkeeping, marketing, among other items depending on the school setting. Customer
service was identified as the most important qualification of individuals in programs, particularly

36
at the point of service for students (Lee, Kwon, Park, Wang, & Rushing, 2017). Nettles, Carr,
Carter, and Federico (2009) identified the six key areas for program operation including food
production; sanitation, safety, security; customer service; program regulations and
accountability; equipment use and care; and professional excellence. In a panel of school
nutrition directors from seven large school districts, operational issues were key areas for issues
for the school districts. Among the comments, the development of an effective team was a key
area for successful program operations and suggested educational training for employees for the
foundation of successful programs. At the time of the study, the survey indicated that meetings
and conferences were the preference for training or education. The study indicated the
knowledge and skill statements defined among the panels will assist in preparing job descriptions
as well as performance appraisals for the school nutrition industry (Nettles, Car, Johnson, &
Federico, 2008). Over 700 Californian child nutrition professionals responded to a survey
addressing training needs for staff. The respondents indicated the largest needs for training in
areas related to program management, Healthy Hunger-Free Kids Act of 2010,
Nutrition/Health/Wellness, and Communication/Marketing (Jones, Punia, Shannon-Young,
Hurgli, & Zidenberg-Cherr, 2013). Training has traditionally involved onsite interaction with
the instructor, however, school nutrition directors recognized the benefits of webinar training for
their school programs in a survey of 210 responses (Zoeller & Carr, 2009). The benefits of
webinars for school nutrition directors included flexibility in timing for the training, self-directed
learning, decreased expenses, and decreased travel. Barriers included technology issues or
computer related problems and the lack or interaction with an instructor (Zoeller & Carr, 2009).
Stinson, Carr, Nettles, and Johnson (2011) evaluated implementation methods of food
safety programs, including Hazard Analysis and Critical Control Points (HACCP). Of the 2,716

37
respondents to the survey addressing implementation of the HACCP program and training issues,
the areas that require additional training included sick policies, food role modeling, role
expectations, and providing training materials, employee buy in, and training with practical
application. Strohbehn, Jun, and Arendt (2014) listed barriers and motivators from a study of 879
responses of foodservice employees. Of the responses on the bilingual survey, employee age and
the number of hours worked affected the perceptions of motivators or barriers in the foodservice
industry. The authors suggested that part-time employees might be less engaged and accountable
to training habits and priorities in the foodservice industry.
With the increased identification of special diets for students, the Dietary Guidelines for
Americans support an overall healthy diet that is evident in the legislation of the Healthy
Hunger-Free Act of 2010 meal standards. Recommendations for providing support, particularly
diabetes support for students, was addressed in an article titled “Diabetes Preparedness in
Schools; What do Foodservice Personnel Need to Know to Respond?” (Grenci, 2016). This
article suggested schools follow three recommendations:
1. Ensure that school meals and snacks meet USDA requirements and Dietary
Guidelines for Americans.
2. Support and implement provisions of local school wellness policies to improve
nutrition education, food choices, and physical activity in schools.
3. Understand basic meal planning and other concepts of effective diabetes management
in children.
A food safety practices survey evaluating the importance of food safety perceptions and
trainings put emphasis on the training of food safety, providing resources for employees, and
building a culture to promote HACCP in food safety (Strohbehn, Jun, & Arendt, 2014). In a

38
nutrition literacy survey of school nutrition managers with 728 participants, it indicated 22.7%
had low nutrition knowledge, 45% with limited nutrition knowledge, and 32.3% with adequate
nutrition knowledge (Zoeller & Carr, 2010). The study did not link nutrition literacy or
knowledge of onsite cafeteria managers to barriers of child nutrition information, role in the
wellness policy, or confidence in school nutrition decision scenarios. For further
recommendations, the study indicated local school districts should increase professional
development opportunities for school nutrition managers and therefore influence production,
delivery, and education of nutrition related information. They study recommended that local
districts should review training opportunities outside of the regularly scheduled workday.
Evaluations of foodservice employees can be a critical part of maintaining the culture in
the cafeteria and creating a successful foodservice team. Cross, Asperin, and Nettles (2009)
interviewed an expert panel and discovered an evaluation or assessment of an employee should
have five criteria including:
1. Criteria clearly defining expected performance
2. Rating scale appropriately reflecting criteria
3. Clear instructions
4. User-friendly format
5. Space for comments
6. Plan for improvement
Additionally, performance should be rated based on the overall competencies
development for employees at the site. The study provided a revised web-based resource with a
template to supplement development for evaluations or performance appraisals. The template

39
prepared gives space for key actions, measurements, resources needed, time frame, and priority
listing for targets (2009).
Summary
Chapter II provides a review of literature including research related to school meal
programs across America. Specific articles provide information on the guidelines and
regulations of the Healthy, Hunger-Free Kids Act of 2010, nutritional standards in the school
meal program, student lunch participation, health and wellness polices, nutrition education, and
school meal status. The defines areas of research in the areas of successful school lunch
programs, nutrition standards, student perceptions, school meal participation, free and reduced
meal eligibility, as well as workforce development and training in the school setting.

40
Chapter III: Methods
In this chapter, the research methods will be identified through the purpose, a description
of the population, project design and data collection procedures.
Purpose of the Study
The purpose of this study was to investigate student participation levels in the school
nutrition program in a school district. This research will additionally investigate reimbursable
meal purchases compared to a la carte purchases. This research will identify participation levels
in the program under Healthy, Hunger-Free Kids Act of 2010.
Research Questions
The following questions were used in this study:
1. What is the relationship of reimbursable meals and school meal status?
2. What is the relationship of a la carte sales and school meal status?
3. What is the relationship of reimbursable meals and a la carte sales?
Population
All public education facilities in Alabama offer school meals to students on site. The
National School Lunch and Breakfast Program operating through the legislation of the Healthy
Hunger-Free Kids Act of 2010 is the mode of program and services for the majority of schools in
Alabama. Through the meal program, students may purchase breakfast and lunch at the school
site. Student families may apply for meal assistance through the program based on income and
family size or through direct certification of the family through data provided to the school
systems from the state agency SNAP and TANF programs. Upon completion of the application
process or direct certification, all students within the public school are given a lunch status. The
lunch status is a free meal, reduced meal, or a paid meal. All first meals are served and charged

41
to the student based on the lunch status. Any second meals or separate items purchased during a
meal period are considered a la carte purchases. Free and reduced meal status does not apply to
the second meals or any other a la carte purchases.
Direct certification for students is an automated process working with the USDA Food
Assistance Program, SNAP, to identify students in the school system that are receiving food
assistance outside of the school setting. The overall population of direct certification in the state
of Alabama is 39.8% of the population. This population is composed of 26.3% white, 62.2%
black, and 47.6% Hispanic students (Alabama Kids Count, 2017).
Students eligible for free and reduced meals based on income using the application
process must report household size and annual income. The eligibility guidance for income
varies based on household size. For a household family of two in the 2016-2017 school year, a
student is eligible for free meals with a household income of $20,826 and eligible for reduced
meals with a household income of $29,637 (USDA).
For the school district, there were eleven schools in the 2016-2017 school year hosting
grades kindergarten through twelfth grade. The total enrollment for the district included 8,283
students, 409 classified employees, and 616 certified employees. Of the teachers for the district,
there were 170 that held a bachelor’s degree, 376 that held a masters’ degree, 44 that held a
specialist degree, and 28 that held a doctorate degree. There are 42 languages spoken within the
school district. The district mission includes educating the whole child for college and career
readiness. The district spends an average of $8,983 per student each school year and has a
student teacher ration of 3.5:1 compared to the national average of 5:1. The average teacher
salary in the district is $53,794.

42
The high school offers a variety of academic classes including classes in the fine arts,
career and technical education, and academics. The graduating class for the 2016-2017 year had
a graduating class of 615 with an average ACT score of 23 compared to the national ACT rate of
20.8. The graduating class was awarded 16.7 million dollars in scholarships. Additionally, 115
students were credentialed in one of the 12 career and technical education programs.
Data Collection
For this study, one high school site was selected for data collection. The high school
houses students in tenth through the twelfth grade with a total population of 1,874 students. The
high school is the only one in the city and therefore was the only school with high-school aged
students. The city population consists of 63,118 members. The city has seen a twenty percent
growth in the overall city population since April 2010. It remains one of the fastest growing
cities in the state with high economic growth and development.
The free and reduced rate is twenty percent of the school population. The overall poverty
level for the city is thirty percent as well as the overall percentage for the school district. For the
state of Alabama, the free and reduced population would be considered low when compared to
other high school communities. High schools around the United States typically have a lower
free and reduced rate at the high school level compared to the overall district level. State
mandated calendars require schools to ensure there are 180 days in a school year thus providing
180 days of meals available for students.
Data is maintained with the school district through two software systems that work
together to compile student information and meal services. The first software system, Chalkable,
is the student information system and is integrated across the state of Alabama. This software
houses information such as demographic information, parental contacts, attendance, and grades

43
for the school district and is the required software for the state of Alabama. Chalkable is the
software system required by all Alabama schools for building the school database and general
school office related processing functions.
Student’s demographic information from Chalkable is submitted into the Heartland’s
Mosaic system. The Heartland Mosaic system completes lunch application meal status, compiles
point of sale information or cashiering, tracks lunch account activity, and monitors meal account
balances. Through this system, student account purchases are collected per student. The
Heartland school solutions software is one of the federally approved software applications for
school systems in the United States to use in school meal programs at the school district level.
Additionally, Mosaic is an approved software for free and reduced application processing for
school foodservice systems in coding meal status.
At the high school, the school houses one kitchen and one cafeteria. There are no school
stores or vending machines available to students during the school day. Therefore, all food
purchases are made within the school foodservice program at the point of sale computers. The
high school has three point of sale positions for cashiering. All cashier stations are operation by
a foodservice employee that is trained in the computer software and regulations for school
purchases. The facility houses four serving lines for hot meal service and a center area to collect
cold boxes such as sandwiches and salads. Additional items such as Gatorade, water, and
crackers are available at the cashier stations for purchase. Milk coolers are available on the
serving line with the meals. A la carte items are any items that are not part of the reimbursable
menu items prepared for the day using USDA guidance.
The menu planning approach for the high school includes hosting a different menu option
on each of the serving lines. The menu will meet specific nutrition standards evaluated using a

44
nutritional analysis program. The menu for each serving line evaluates overall calories, saturated
fat, trans fat, and sodium. The menu analysis evaluated specific menu components including
milk, whole grains, red/orange vegetables, dark green vegetables, beans/peas/legumes, starchy
vegetables, meats/meat alternates, and fruit.
Menu pricing for the reimbursable lunch meals for a paid student meal status was $2.50
and $.40 for a reduced price student. All meals were identified using the system so no
identification of the student meal status was available during the meal line.
The cafeteria staff is made of eight individuals functioning in all parts of the kitchen and
cafeteria. The staff members are trained for cashiering purchases and sales. Students enter a
specific ID number on a pin pad to make the student account available to the cashier. The
cashier identifies items for purchase on the school tray and enters it on the student account using
a touchscreen computer. The system automates total sales amounts based on the items identified
in the purchase including meals or a la carte items. The ID number is specific to the student and
their meal status. Therefore, the computer system identifies student discounts based on the meal
status while keeping the student meal status confidential. Students may purchase items using
money on their account or by paying with cash at the point of service. Students are able to add
money to their specific account with online methods or at the cashier stand in the cafeteria. The
school participates in a no charging policy, specifically to a la carte sales. However, a student
participating in the free and reduced meal program will not be denied a meal based on USDA
guidance and school policy.
The kitchen facility operates standardized and industrial equipment for foodservice
preparation. The kitchen holds four combination ovens, four convection ovens, two steam
jacketed kettles, one tilt skillet, one steamer, and a full commercial dish machine. The facility

45
supports temperature-holding equipment for all serving lines, a walk-in cooler, walk-in freezer,
and a storage room.
All food purchases are managed through the school district’s central office of child
nutrition. Food is purchased following strict USDA guidance and bidding procedures. The
school district purchases the majority of food items through the Alabama statewide procurement
program. They also participate in the Alabama commodity program funded through USDA.
Additional bid contracts are made each year for milk, ice cream, bread, and produce.
Procedures
A research request was submitted to the school district requesting student purchase
history, demographics, and meal status for all high school students during the 2016-1017 school
year. Paperwork request was completed using the Application for External Research Approval.
The most recent school year was selected as it had the most current information for student
purchases in the district. The high school aged student level was selected as they make meal
purchases and a la carte purchases with no restrictions in the serving line. All requested data was
to include removing any identifiable student information. Upon approval from the local school
district, a request to Auburn University Institutional Research Board was requested and approved
in the fall of 2017.
The school was selected due to the large volume of students in the three grade levels and
the number student school days (180) available to select lunch over an entire school year.
Additionally, the school represents the entire city population, as there is only one public high
school in the district in which students are eligible to attend. The district is one of the largest
school districts in the state of Alabama.

46
Data provided for the research study was collected using the Mosaic software program
hosted by Heartland Solutions. Mosaic software functioned as the point of sale system and the
overall data for the child nutrition program in the school district. The child nutrition software
received daily imports from the district student information system, Chalkable. Chalkable
provided student names, ethnicity, grade level, and gender into the Mosaic software. The Mosaic
software matched all of the student information with applications requested for all special meal
status. Free and reduced meal status applications were completed at the onsite of the school
year, processed in the system and matched for all students in the district. If a student did not
complete a meal application, the student remains with a paid lunch status. All applications are
processed through the software analysis and identified for meal status based on household size
and income level for the household. Students that had family participation in the state food
assistance program such as SNAP were automatically loaded into the Mosaic system with a free
meal status. This automation from related food assistance programs is a required import for all
child nutrition programs under USDA and is called direct certification.
The Mosaic software system also synchronizes with student accounts and monetary
balances. Students may add money at the school site cafeteria to update meal accounts. An
online system is also available in the software program be updated to provide updates to the
system. The system allows parents to participate in online monitoring of meal accounts and
student meal balances for school purchases. Systems are automated in real-time and therefore
allow accounts to be available quickly for meal services. Student account balances can be
reviewed online or at the point of service in the cafeteria line.
Students participating in school meals, complete checkout services at the point of sale
computer system with the Mosaic software. Students entered a confidential pin pad number to

47
pull up the student meal accounts. Cashiers reviewed meal trays and purchases and then select
student meal choices on the computer screen. Items selected were totaled and the student would
be eligible to pay for items at the point of service or use account balances made prior to
purchases. Student meal prices for a reimbursable meal were $2.50 for paid meal status students
and $.40 for reduced meal status. There were no charges for students with a free meal status. A
reimbursable meal includes 3-5 meal components as defined by USDA guidelines in the Healthy,
Hunger-Free Kids Act. Any purchases outside of a reimbursable meal are considered a la carte
purchases. A la carte purchases included any additional snack items or extra meal components
from the meal service line. A la carte items vary in pricing from $.25 to $2.00.
All purchases during the school day are updated to the Mosaic software. Purchases are
collected by student and kept in the system until a rollover for the upcoming school year is
completed. Student data archived for the school district and can be retrieved upon request.
After the collection of the historical data of all student purchases for lunch and a la carte
sales from the school district for this study, the information was exported into the SPSS
statistical software. The data set included de-identified student purchase information including
reimbursable meal counts and a la carte sales for the 180 day school year. Student purchase
totals were identified and calculated. Through the statistical software, descriptive data was
compiled and reported. Descriptive statistics analysis was completed to provide total
participants, mean, mode, standard, deviation, and variance. Frequencies for the gender
(meal/female), grade level (10th, 11th, 12th), ethnicity (White, Black-African-American, American
Indian-Alaskan Native, Asian, Native Hawaiian-Pacific Island), and meal status (free, reduced,
paid) were collected. Additionally, ANOVA and MANOVA tests were run comparing meal
status, reimbursable meals, and a la carte sales.

48
In the first portion of ANOVA tests, the quantity of purchases was analyzed. Through
the SPSS software, the average number of purchases per meal status was completed. The
quantity totals were run with a test of homogeneity of variances using the Levene statistic. Post
hoc tests, Bonferroni, were completed to review multiple comparisons using the quantity of
reimbursable meals as the dependent variable.
After the quantity of meal purchases was completed, the same tests for the a la carte
purchases were completed. First, the average number of meal purchases per student based on
meal status was completed. Next, a test of homogeneity of variances was completed using the
Levene statistic. And finally, a post hoc test, Bonferroni, was completed to make multiple
comparisons of the meal status groups and a la carte purchases.
After the quantity of meals was analyzed, the cost of the a la carte purchases per student
was analyzed. Reimbursable meals were not analyzed as there is no cost associated with free
meals and data was unable to be calculated with no values attached to the free meal status. A la
carte purchases were analyzed using a dollar amount. The average dollar amount of purchases
based on meal status was first analyzed. Next, the test of homogeneity of variances was tested
using the Levene statistic. Finally, post hoc tests were completed to compare the meal status of
purchases with the dependent variable being the a la carte cost or dollar amount spent per
student.
Finally, a bivariate correlation was made using the Pearson Correlation for a la carte total
quantity of items purchased and reimbursable meal totals.
Summary
Chapter III describes the method for the study to analyze school meal participation at the
high school level over a period of 180 school days. The study evaluates and compares school

49
lunch meal purchases and a la carte sales per individual student of the described high school.
This chapter defines the population, data collection, and procedures for the study.
By investigating the relationships of school reimbursable meals, a la carte sales, and meal
status, Child Nutrition programs will be better able to assist in planning and proposing
procedures for school programs under the Healthy, Hunger-Free Kids Act of 2010.

50
Chapter IV: Results
In the previous chapter, the methods for the research is described including the method of
study, population, research design, and data analysis. This chapter, Chapter IV, will provide the
compiled results from the research design and analysis. Demographics, frequencies, student
lunch status, meal counts, a la carte counts will be reported with descriptive analysis, test of
homogeneity of variances, ANOVA, and post Hoc Tests.
Purpose of the Study
The purpose of this study was to investigate student participation levels in the school
nutrition program in a school district. This research will additionally investigate reimbursable
meal purchases compared to a la carte purchases. This research will identify participation levels
in the program under Healthy, Hunger-Free Kids Act of 2010.
Research Questions
The following questions were used in this study:
1. What is the relationship of reimbursable meals and school meal status?
2. What is the relationship of a la carte sales and school meal status?
3. What is the relationship of reimbursable meals and a la carte sales?
Demographic Profile
For this study, the research sample size included 1,923 students in grades tenth through
twelfth, collected from the student information system, Chalkable. The sample included 676
tenth grade students, 627 eleventh grade students, and 620 twelfth grade students. The ethnicity
of the student group was defined as 1205 white, 473 African American, 22 American Indian, 221
Asian, 2 Native Hawaiian/Pacific Island. The sample included 948 male and 975 female
students. The sample population meal status for students included 1509 paid, 59 reduced, and

51
355 free meal statuses. All students have access to participate in the school meal program at the
school site including breakfast and lunch over the 180-day school year.
Table 1
Student Population by Gender Frequency Percent
Valid Male 948 49.3
Female 975 50.7 Total 1923 100.0
Table 2 Student Population per Grade Level
Frequency Percent
Valid
10 676 35.2 11 627 32.6 12 620 32.2
Total 1923 100.0 Table 3
Student Population by Race Frequency Percent
Valid
White 1205 62.7 African American 473 24.6
American Indian & Alaskan Native 22 1.1 Asian 221 11.5
Native Hawaiian or Other Pacific Islander 2 .1 Total 1923 100.0
Table 4
Student Population by Meal Status Frequency Percent
Valid
Paid 1509 78.5 Reduced 59 3.1
Free 355 18.5 Total 1923 100.0

52
Research Questions
The overall purpose of the study was to examine meal status and sales in the school meal
programs. This next section will review data analysis of three specific questions in regard to
meal status and participation in the school lunch program.
Research Question One: What is the relationship of reimbursable meals and school
meal status? In order to examine student meals related to student meal status, the number of
student lunches purchased by an individual student for the school year were reviewed.
Reimbursable meals are the first meal served to students during the lunch period. The three
categories of paid, reduced, and free meal status had varying averages of meal purchases from
40-138 meals/year (See Table 5). The average purchase of reimbursable meals per student was
60 meals. A test for homogeneity of variances using the Levene statistic identifies significant
differences in the groups as listed below in Table 6. The Levene test was selected to assess the
equality of variances among the free, reduced, and paid meal status groups. The data represents a
significant difference (p= .000) between the free, reduced, and paid meal status groups. This
indicates that the groups are not homogenous which could have been influenced by the small
reduced meal status group. The ANOVA test was selected to determine the differences in the
number of meals purchases per students based on their meal status. The differences in the
number of meals purchases were significant (p= .000) as indicated in Table 7.
Multiple comparisons among the groups using Bonferroni testing identified significant
differences of the quantity of meals purchased among paid to free (p= .000), paid to reduced (p=
.000), and free to reduced (p= .14) (See Table 8). The Bonferroni test was selected to adjust for
the potential for Type 1 errors in the statistical analysis.

53
Table 5
Student Purchases of Reimbursable Meals
N Mean Std. Deviation
Std. Error
95% Confidence Interval for Mean
Min. Max. Lower Bound
Upper Bound
Paid 1509 40.10 57.96 1.49 37.17 43.02 .00 338.00 Reduced 59 112.32 65.61 8.54 95.22 129.42 .00 271.00
Free 355 138.24 89.18 4.73 128.93 147.55 .00 346.00 Total 1923 60.43 75.87 1.73 57.04 63.04 .00 346.00
Table 6
Reimbursable Meals Quantity Total Levene Statistic df1 df2 Sig.
53.718 2 1920 .00 Table 7
ANOVA by Reimbursable Meals Quantity Total
Sum of Squares df Mean Square F Sig.
Between Groups 2931825.69 2 1465912.84 346.08 .000 Within Groups 8132665.12 1920 4235.76
Total 11064490.81 1922 Table 8
MANOVA by Meal Status
Status Status Mean Difference Std. Error Sig.
95% Confidence Interval Lower Bound Upper Bound
Paid Reduced -72.21* 8.63 .000 -92.91 -51.52 Free -98.139* 3.83 .000 -107.33 -88.94
Reduced Paid 72.219* 8.63 .000 51.52 92.91 Free -25.920* 9.15 .014 -47.84 -3.99
Free Paid 98.139* 3.83 .000 88.94 107.33 Reduced 25.920* 9.15 .014 3.99 47.84
*. The mean difference is significant at the 0.05 level. Dependent Variable: Reimbursable Meals Quantity Total Bonferroni Testing

54
Research Question Two: What is the relationship of a la carte sales and school meal
status? A la carte sales are identified as any item sold to a student beyond a reimbursable meal.
Meal status does not relate to these items as pricing and purchasing applies to all students in the
same manner. For this testing, the total number of a la carte purchases were reviewed as well as
the total dollar spent for purchases for the students. The average quantity of a la carte items
purchased among students was 53 items (See Table 9). For paid and reduced status students, the
average a la cart purchase was 57 per year while the average for free students was 32 purchases
per year (Table 9). The Levene statistic was selected to determine homogeneity of variances for
the groups in a la carte sales. The totals were significant (p= .000) and do not pass the
homogeneity of variance because of the varying groups (Table 10). The ANOVA testing (Table
11) indicates a significant different between the free, reduced, and paid groups (F (2,1920)=
11.585). The Bonferroni test was selected to identify the differences in the meal status
purchasing groups. The statistical analysis data determined significant differences in the free and
paid as well as the reduced and free meal status groups (p= .000 and p= .147) in Table 12.
However, there were no significant differences in the paid and reduced meal status groups (p=
1.0).
The average dollar amount spent on a la carte purchases average at the high school was
$58.88 per year (Table 13). Paid meal status students averaged $65.72 per year while reduced
meal status students averaged $52.45 per year. Free meal status students averaged $30.90 per
year. The Levene statistic was completed determining a statistical difference of (p=.000) in
Table 14. A one way ANOVA was completed and reported a statistical difference (F (2,1920) =
16.085) in Table 15. reported a The total quantity of a la carte sales per group and the total
dollar amount of the items spent was significantly different among groups as references in the

55
table 17 using the Bonferroni multiple comparisons. There is a significant difference in the dollar
amount spent between the paid meal status group and the free meal status group (p=.000) as well
as the reduced meal status and free meal status group (p=.427) (Table 17). However, there are
no statistical differences in the paid and reduced meal status (p= 1.0).
Table 9
Student a la carte Purchases by Quantity
N Mean Std. Deviation Std. Error
95% Confidence Interval for Mean Min. Max. Lower Bound
Upper Bound
Paid 1509 57.77 96.40 2.48 52.90 62.63 .00 729.00 Reduced 59 57.22 71.08 9.25 38.69 75.74 .00 277.00
Free 355 32.50 52.75 2.79 26.99 38.00 .00 422.00 Total 1923 53.08 89.73 2.046 49.07 57.10 .00 729.00
Table 10 Test of Homogeneity of Variances, a la carte Quantity Purchases
Levene Statistic df1 df2 Sig.
54.59 2 1920 .00 Table 11 ANOVA, a la carte Quantity Total Purchases between Groups
Sum of Squares df Mean Square F Sig.
Between Groups 184538.88 2 92269.44 11.585 .00 Within Groups 15292298.09 1920 7964.73
Total 15476836.97 1922

56
Table 12
MANOVA a la carte Quantity Purchases
Status Status Mean Difference Std. Error Sig.
95% Confidence Interval Lower Bound Upper Bound
Paid Reduced .54 11.84 1.00 -27.82 28.92 Free 25.26* 5.26 .00 12.65 37.88
Reduced Paid -.54 11.84 1.00 -28.92 27.82 Free 24.71 12.54 .14 -5.34 54.78
Free Paid -25.26* 5.26 .000 -37.88 -12.65 Reduced -24.71 12.54 .14 -54.78 5.34
*. The mean difference is significant at the 0.05 level. Dependent Variable: a la carte Quantity Purchases Bonferroni Table 13
Student a la carte Purchases by Dollar Amount
N Mean Std. Deviation
Std. Error
95% Confidence Interval for Mean Min. Max. Lower Bound
Upper Bound
Paid 1509 65.72 114.21 2.94 59.95 71.48 .00 727.50 Reduced 59 52.45 65.20 8.48 35.45 69.44 .00 241.75
Free 355 30.90 53.83 2.85 25.28 36.52 .00 413.25 Total 1923 58.88 105.25 2.40 54.17 63.59 .00 727.50
Table 14
Test of Homogeneity of Variances, Purchases by a la carte Dollar Amount Levene Statistic df1 df2 Sig.
65.83 2 1920 .00
Table 15
ANOVA, a la carte Dollar Amount between Groups
Sum of Squares df Mean Square F Sig.
Between Groups 350903.50 2 175451.75 16.08 .000 Within Groups 20943000.94 1920 10907.81
Total 21293904.44 1922

57
Table 16
A la carte purchases by Dollar Amount Statistica df1 df2 Sig. Welch 36.05 2 163.24 .000 Brown-Forsythe 37.76 2 275.15 .000 a. Asymptotically F distributed.
Table 17
Multiple Comparisons
Status Status Mean Difference Std. Error Sig.
95% Confidence Interval Lower Bound Upper Bound
Paid Reduced 13.26 13.86 1.00 -19.94 46.48 Free 34.81* 6.16 .00 20.05 49.57
Reduced Paid -13.26 13.86 1.00 -46.48 19.94 Free 21.54 14.68 .42 -13.63 56.73
Free Paid -34.81* 6.16 .00 -49.57 -20.05 Reduced -21.54 14.68 .42 -56.73 13.63
*. The mean difference is significant at the 0.05 level. Dependent Variable: A la carte Purchases by Dollar Amount Bonferroni
Research Question Three: What is the relationship of reimbursable meals and a la
carte sales? In the final research question, a bivariate correlation using the Pearson Correlation
was used to examine the quantity of reimbursable meals purchased by students to the quantity of
a la carte purchases. The relation testing would be significant at the p= .01 level for the 2-tailed
analysis. The data reported a significant level of p= .000 for both the quantity comparison (Table
18). The data suggests a positive relationship in that as more meals were purchased the more a
la carte purchases were made by the student. A cost comparison of the two groups in the dollar
amount category was not examined as the cost of meals were not comparable when analyzing
totals for free or reduced students with paid meal status.

58
Table 18
Comparison of a la carte and Meal Purchases
A la Carte Quantity
Meals Quantity
A la Carte Quantity Total
Pearson Correlation 1 .37**
Sig. (2-tailed) .00 N 1923 1923
Reimbursable Meals Quantity
Total
Pearson Correlation .37** 1
Sig. (2-tailed) .00 N 1923 1923
**. Correlation is significant at the 0.01 level (2-tailed).
Summary
The purpose of this study was to investigate student’s participation levels in the school
nutrition program in a school district. With participation levels identified in school meal lunch
purchases and a la carte purchases along with identifying student meal status, the overall trends
for student participation can be identified for useful planning and production of school nutrition
programs.
Collected data included student meal status, gender, ethnicity, and quantify of overall
purchases in the school meal program. A cost analysis of the dollar amount of purchases spent in
the school meal program was also collected.
Based on the data collection and analysis, there are significant differences in lunch meal
purchases and a la carte sales based on meal status. The more meal purchases made in the school
meal program indicated increased a la carte purchases. The data revealed students with a paid
lunch status had a higher purchase rate of a la carte items. However, purchases made by students
with a free or reduced lunch status were not eliminated.

59
Chapter V: Conclusion
Chapter I introduced the study while Chapter II provided a literature review of school
meal programs, school meal program regulations and guidelines, and other influencing factors on
the program dictated by the Healthy Hunger-Free Kids Act of 2010. Chapter III provided the
methods for the research while Chapter IV included the collection of data and results for the
project. The final chapter, Chapter V, will provide discussion, implications, limitations, and
future recommendations gathered from the study.
Purpose of the Study
The purpose of this study was to investigate student participation levels in the school
nutrition program in a school district. This research will additionally investigate reimbursable
meal purchases compared to a la carte purchases. This research will identify participation levels
in the program under Healthy, Hunger-Free Kids Act of 2010.
Research Questions
The following questions were used in this study:
1. What is the relationship of reimbursable meals and school meal status?
2. What is the relationship of a la carte sales and school meal status?
3. What is the relationship of reimbursable meals and a la carte sales?
Discussion
Under USDA, each state is given the authority to oversee the National School Lunch and
Breakfast Program now the Healthy, Hunger-Free Kids Act of 2010, as well as other programs
for their state. The Alabama State Department of Education- Child Nutrition Program oversees
the operations of the school sites and administrative reviews, including corrective actions for the
program. Reporting of the school site participation, budgeting, capital planning, equipment

60
purchases, commodity planning, and program reimbursement is through the state program
(ALSDE, 2017).
There is a lack of research and investigation into the relationship of daily food sales and
school meal status, particularly student reimbursable meals and a la carte sales. Investigating
relationships of student purchases yields information for evaluating the overall effectiveness of
the National School Lunch and National School Breakfast Programs. Though the data is critical
to research and improving the quality of programs as well as overall student participation,
purchasing records are highly confidential. The data may be difficult to release to researchers as
school districts have strict requirements for maintaining the identity of student information. All
data must be de-identified before information can be shared to groups outside of a district.
School districts across the nation may not have the labor hours to divide the attention to
preparing data to share outside of the district and others may not be aware of the need for this
data to make improvements to the daily workforce in school foodservice. Purchasing data
remains highly sensitive to groups as it may also be linked to personal banking information now
that online meal payments are acceptable. The current research of this study assists in providing
administrative documents for research factors affecting participation in the school nutrition
program. Baxter et al (2013) suggested that administrative records within a school district of the
participation levels of school provided meals would be beneficial in research, to provide insight
into school meal participation. The authors encouraged school districts to share the information
to assist the school nutrition and overall school community, as there are few documented studies
that provide data from the school districts.
Schools offer the school lunch programs to provide nutritionally integrated programs for
students. Without student participation, particularly those participating with a low

61
socioeconomic status, the National School Lunch Program would not be effective in its purpose
to provide healthy and nutritionally sound meals to students. Additionally, purchases outside a
reimbursable meal in a la carte sales determines a student’s priority of school meals as well as
their satisfaction of the quality of the program for the school and student population. School
purchases determine the overall participation and is part of the national initiative to fight child
hunger, childhood obesity, and the overall health and wellness of our nation.
This study was conducted in a school in which the student population includes a diverse
student population with the majority of students assigned a paid lunch status. With the student
populations and data, the study examined students’ highest meal purchases and determined if all
students purchase meals. It also identified which meal status students were making a la carte
purchases along with the dollar amount for average purchases by individual students. This data
is critical for future preparations of school meal programs. Throughout the nation, programs are
reevaluating how to better serve the student population. Purchasing data is vital to the
participation of the program as well as the overall success.
Data from the 2016-2017 school year provided information on 1923 high school student
accounts. These accounts were equally distributed by gender and grade level with the major
ethnicity (64%) as white. The free and reduced meal status for student accounts was 21.6
percent of the total student population. Meal account data provided purchase history for all
students for the 2016-2017 school year of 180 student days. The average number lunch
purchases for a paid student was 40 lunches with 57 a la carte purchases averaging $65.00 over
the school year. For a reduced meal status student, the number of reduced lunch purchases
averaged 112 lunch meals with 57 a la carte purchases averaging $52.00 for the year. The free
meal status average was 138 lunch meals and 32 a la carte purchases averaging $30.00 for the

62
year. With an opportunity for 180 school lunch purchases in a year, there was not a 100 percent
participation rate for any meal status group.
Implications
School nutrition programs and operations in a school district can review the data to
compare trends of purchases for their cafeterias. Probart et al. (2004) identified predictors of a la
carte sales for meal programs including free and reduced meal status, length of lunch periods,
and school food policies. As programs transform to meet nutritional standards under the Healthy
Hunger-Free Kids Act of 2010 it is important to maintain participation levels to make meal
programs available for all students. Roseman and Niblock (2012) suggested that there are five
key factors for participation including food taste, food looks, student hunger, healthy foods, and
the amount of foods. The study with these results included 947 middle school students in five
middle schools in Kentucky completing a questionnaire addressing questions and opinions
related to school lunch, healthy menu items, awareness of food benefits (health), items taste-
tested, and overall factors affecting their school lunch choice (2012).
For students receiving meal benefits under the free and reduced meal status, the data in
this study does not reflect that students with a free or reduced meal status are participating in the
program daily. The range for meal participation for free meal status students ranged from 128-
147 reimbursable meals per 180-day school year. While the meal account participation is higher
among those that have the free and reduced meal status, there are days that the average student is
not participating (mean= 60 meals/year). School meal operators may not find it surprising that
students with a paid meal status are not participating in a school meal program. However, the
question remains in why aren’t students engaged in daily meal participation on the school site,
particularly if they have a free and reduced meal status. It continues to be a question researchers

63
continue to address as child nutrition programs identify ongoing challenges facing participation
and overall school programs (Brown, Bednar, DiMarco, & Connors 2012).
The school lunch model with lunchtime periods is changing across programs in America.
The typical lunch period may now be in competition with other school activities, cost restraints,
employee production constraints, meal locations, availability of kitchen facilities or other
challenges. Kubik et al. (2003) reiterates the importance of the school environment and the
influence on children. Part of the influencing factors for students today are eating behaviors of
students including school vending or a la carte sales. The data in the study reiterates that there
are multiple a la carte sales in the school setting, no matter the meal status. These trends should
continue to be reviewed and discussed for overall program operations as well as student health.
Litchfield and Wenz (2011) concluded that the physical environment and the school meal status
were the most influential factors affecting school meal sales. The trends for this study agree with
Litchfield and Wenze confirming the more meal benefits a student received, the higher the
individual meal participation. The trends for this study also site average a la carte purchases for
all meal status accounts (mean= 53 purchases/year). This is significant information for program
operators as a la carte sales provide additional income to support overall program expenses.
Additionally, it suggests it is important to offer and make available items other than reimbursable
meals for students. A la carte sale purchases are made by all students including those with a
meal assistance through the program.
By forecasting and addressing trends of service for child nutrition operators, the local
employee can better provide choices for students, determine other potential sites for service,
adjust timing of meal service, and continue to track participation to follow in line with student
needs.

64
The study provided data that displayed that students do not track eating in the cafeteria
everyday of the school year, even students receiving meal benefits. The study tracked that
students make purchases in the cafeteria but there is a student group, particularly the paid meal
status group that do not make purchases. Customer service was identified as the most important
qualification of individuals in programs, particularly at the point of service for students (Lee,
Kwon, Park, Wang, & Rushing, 2017). The data creates the discussion that cafeterias are not
meeting the desires of the student population. Performance appraisals and assessments of the
kitchen environment must be analyzed to assess the desires of the student customer and where
there is a need to change the environment. Cross, Asperin, and Nettles (2009) provide a template
available to assist cafeterias and school programs when creating appraisals and assessments.
With the need for the improvements to overall participation levels, staff members must be
well equipped to meet the desired outcomes of the students and the management of the child
nutrition program. The data represented that the need for training may be essential in changing
the environment to meet the student wants and needs. The required areas of expertise cover
many topics and are critical to the job and the daily tasks involved. Nettles, Carr, Carter, and
Federico (2009) identified the six key areas for program operation including food production;
sanitation, safety, security; customer service; program regulations and accountability; equipment
use and care; and professional excellence.
Training for these key areas to improve the desired results for the environment to
improve participation can be completed in a variety of ways. The benefits of webinars for school
nutrition directors included flexibility in timing for the training, self-directed learning, decreased
expenses, and decreased travel. Barriers included technology issues or computer related
problems and the lack or interaction with an instructor (Zoeller & Carr, 2009).

65
With the low meal participation and yet high nutritional value of the reimbursable
meals provided, nutrition education may be an area for training for students as well as the
foodservice staff. The authors (Byker, et al 2013) recommended nutrition education would assist
in overall policy support when parents, teachers, and foodservice personnel have had
interventions to create a better understanding on nutrition standards in the school setting.
Limitations
Limitations for this particular study were identified and could involve a variety of factors
that affect the overall data. The first limitation involved the free and reduced population for the
study as a study with a higher free and reduced meal status population could affect purchasing
information. Additionally, this study was completed at a single high school in which
comparisons to multiple schools could add dimension to the purchasing data. Other limitations
that could enhance the data collection could be purchasing data for items verses menu choices.
Other factors affecting purchases could include lunch service wait times, meal locations, meal
selections, and school wide events. The study strength included that all high school students that
attend the selected high school had purchasing data that was reported and there were no excluded
student groups. Purchasing data is difficult to recover from school districts as it is confidential
student information to the school district and must be prepared before release to researchers
outside of the school district.
Technology of data and reporting is pertinent to the maintenance of purchasing and
tracking records for a school district. School districts have different technology abilities that
affect the tracking and sharing of data. Child nutrition programs should work closely with
technology departments for assistance of accurate record reporting, retention, and sharing of
data for future research.

66
While researchers should acknowledge that some factors cannot be controlled by the
program (Litchfield & Wenz, 2011), the data in this study suggests that purchasing patterns for
reimbursable meals and a la carte sales continues to need evaluation to make provisions,
changes, and recommendations to the school meal program. Furthermore, the evaluations
provide data to support legislation and funding for the child nutrition programs in America.
Recommendations
The purpose of this research was to investigate student’s participation levels in the school
nutrition program in a school district. This research additionally investigated reimbursable meal
purchases compared to a la carte purchases. Based on the findings from this study, future
research might:
1. Compare student purchases at a high school with a higher percentage of free and
reduced meal rate.
2. Evaluate student overall lunch participation with high schools of varying school sizes.
3. Explore potential ways to provide meals outside of the cafeteria for meal service to
improve student participation in the school meal program.
4. Survey student reasons for meal participation, including menu choices verses meal
purchases.
5. Evaluate student participation based on the nutritional standards interest of students
as related to the Healthy, Hunger-Free Kids Act of 2010.
6. Expand training programs and professional development to foodservice employees in
child nutrition programs.
As a program that affects over 30 million students each day in the United States, the
general operations of food service management are affected by participation of students in meal

67
programs. Menu choices affect menu selections by the students therefore influencing if the
student will purchase items outside of the reimbursable meal. Other influencing factors include
competitive foods, school environment, nutrition education, parental guidance, meal service
times, and class scheduling. Food service operators should closely evaluate participation trends
in the local school district to address the student needs and wants for the daily provisions of the
child in the school. Food service management teams in the school district should also evaluate
the training and professional development needs for the school employee. The training areas for
the employee include marketing, customer service, computer and technology skills, food safety,
kitchen equipment use and safety, nutrition education, and health and wellness training and are
among the array of topics necessary to building a strong child nutrition program with high
participation levels.
There is also a significant financial portion of the student participation in the school meal
program. With the budget for the school meal program over 13.6 billion in the 2016 school year,
the federal budget is affected and contributes to the efficiency of operations in individual school
districts across America. Student meal purchases and a la carte purchases strongly influence the
school nutrition financial statements. Effective bidding for food and services provides efficient
purchasing procedures for the district. The school district’s plate waste as well as kitchen food
waste influences menu costs for the district and maintenance of minimal school lunch prices
though affected by the required paid lunch equity standards. Maintaining labor costs by stringent
hiring and effective evaluations systems creates integrity with financial benefits. Consequently,
all child nutrition programs must maintain financial stability to operate but the fact remains that
participation of students will be the overall stabilizer for the continuation of the program.

68
Summary
The National School Lunch and National School Lunch Program have been affected by
ongoing updates to regulations and standards. The Healthy, Hunger-Free Kids Act of 2010
created significant changes for school lunch programs across the United States. For continued
success of these meal programs, schools must continue to evaluate program operations to be
successful. Schools must evaluate participation, school environments, school staff, professional
development, labor costs, food costs, nutritional significant, and student health needs as part of
the total evaluation of the program. Participation in the program by purchasing meals as well as
a la carte items continues to need updated research for the future and overall planning for
effective child nutrition programs in the schools of America.

69
References
Alabama State Department of Education (2017). National school lunch and breakfast program.
Retrieved from https://www.alsde.edu/sec/cnp/snp/Additional
%20Resources/Brochure%20-%20NSLP%20-%20SBP%20-%202014.pdf
Alabama Kids Count Data Book (2017). Voices for Alabama Children Education Supplemental
Report. Retrieved from https://alavoices.org/wp-content/uploads/2017/12/
Databook_Education_section_web.pdf
Alcaraz, B. & Cullen, K. (2014). Cafeteria staff perceptions of the new USDA school meal
standards. The Journal of Child Nutrition & Management, 38(2), 1-12.
Arbogast, R. (2014). Factors that impact a school's decision to continue participation in the
national school lunch program. ProQuest Dissertations & Theses Full Text. Retrieved
from http://spot.lib.auburn.edu/login?url=https:// search.proquest.com/docview/
1651611857?accountid=8421
Asperin, A. E. & Castillo, A. (2010). Developing a best practice guide for increasing high school
student participation and satisfaction in the national school lunch program. Journal of
Child Nutrition & Management, 34(2).
Bhatia, R., Jones, P., & Reicker, Z. (2011). Competitive foods, discrimination, and participation
in the National School Lunch Program. American journal of public health, 101(8), 1380-
1386.
Baxter, S. D., Hardin, J. W., Guinn, C. H., Royer, J. A., Mackelprang, A. J., & Devlin, C. M.
(2010). Children's body mass index, participation in school meals, and observed energy
intake at school meals. International Journal of Behavioral Nutrition and Physical
Activity, 7(1), 24.

70
Baxter, S. D., Hardin, J. W., Guinn, C. H., Royer, J. A., Mackelprang, A. J., & Smith, A. F.
(2009). Fourth-grade children's dietary recall accuracy is influenced by retention interval
(target period and interview time). Journal of the American Dietetic Association, 109(5),
846-856.
Bergman, E. A., Englund, T., Taylor, K. W., Watkins, T., Schepman, S., & Rushing, K. (2014).
School lunch before and after implementation of the Healthy Hunger-Free Kids Act.
Journal Child Nutrition & Management, 38(2), 1-12.
Briefel, R. R., Wilson, A., & Gleason, P. M. (2009). Consumption of low-nutrient, energy-dense
foods and beverages at school, home, and other locations among school lunch
participants and nonparticipants. Journal of the American Dietetic Association, 109(2),
S79-S90.
Briggs, M. (2010). Position of the American dietetic association, school nutrition association,
and society for nutrition education: comprehensive school nutrition services. Journal of
the American Dietetic Association, 110(11), 1738-1749.
Brown, J.S, Bednar, C., DiMarco, N.M, & Connors, P.L. (2012). Assessment of changes in
school nutrition programs and the school environment as a result of following the
healthier US school challenge program. The Journal of Child Nutrition and
Management, 36(1).
Byker, C. J., Pinard, C. A., Yaroch, A. L., & Serrano, E. L. (2013). New NSLP guidelines:
challenges and opportunities for nutrition education practitioners and researchers. Journal
of Nutrition Education and Behavior, 45(6), 683-689.
Byker, C. J., Farris, A. R., Marcenelle, M., Davis, G. C., & Serrano, E. L. (2014). Food waste in

71
a school nutrition program after implementation of new lunch program guidelines.
Journal of Nutrition Education and Behavior, 46(5), 406-411.
Caruso, M. L., & Cullen, K. W. (2015). Quality and cost of student lunches brought from home.
JAMAPediatrics, 169(1), 86-90.
Cashman, L., Tripurana, M., Englund, T., & Bergman, E. A. (2010). Food group preferences of
elementary school children participating in the National School Lunch Program. Journal
of Child Nutrition& Management, 34(1).
Centers for Disease Control and Prevention (2017). National Center for Chronic Disease Prevention and
Health Promotion, Division of Nutrition, Physical Activity, and Obesity.
Retrieved from: https://www.cdc.gov/nccdphp/dnpao/data-trends-maps/index.html
Choumenkovitch, S. F., McKeown, N. M., Tovar, A., Hyatt, R. R., Kraak, V. I., Hastings, A. V.,
& Economos, C. D. (2013). Whole grain consumption is inversely associated with BMI
Z-score in rural school-aged children. Public Health Nutrition, 16(2), 212-218.
Cohen, J. F., Richardson, S., Parker, E., Catalano, P. J., & Rimm, E. B. (2014). Impact of the
new US Department of Agriculture school meal standards on food selection,
consumption, and waste. American Journal of Preventive Medicine, 46(4), 388-394
Connors, P. & Bednar, C. (2015). Middle school cafeteria food choice and waste prior to
implementation of healthy, hunger-free kids act changes in the national school lunch
program. Journal of Child Nutrition & Management, 39(2).
Cohen, J. F., Jahn, J. L., Richardson, S., Cluggish, S. A., Parker, E., & Rimm, E. B. (2016).
Amount of time to eat lunch is associated with children’s selection and consumption of
school meal entrée, fruits, vegetables, and milk. Journal of the Academy of Nutrition and
Dietetics, 116(1), 123-128.

72
Crawford, P.B., & Webb, K.L. (2011). Unraveling the Paradox of Concurrent Food Insecurity
and Obesity. American Journal of Preventive Medicine, 40(2) 247-275.
Cross, B. W., Asperin, A. E., & Nettles, M. F. (2009). Competency-based performance
appraisals improving performance evaluation of school nutrition managers and
assistants/technical. Journal of Child Nutrition & Management, 33(2).
Cullen, K. W., & Zakeri, I. (2004). Fruits, vegetables, milk, and sweetened beverages
consumption and access to a la carte/snack bar meals at school. American Journal of
Public Health, 94(3), 463-467.
Echon, R. M. (2014). Quantitative evaluation of HHFKA nutrition standards for school lunch
servings and patterns of consumption. The Journal of Child Nutrition & Management 38
(1).
French, S. A., Jeffery, R. W., Story, M., Breitlow, K. K., Baxter, J. S., Hannan, P., & Snyder, M.
P. (2001). Pricing and promotion effects on low-fat vending snack purchases: the CHIPS
Study. American Journal of Public Health, 91(1), 112.
Gase, L. N., McCarthy, W. J., Robles, B., & Kuo, T. (2014). Student receptivity to new school
meal offerings: assessing fruit and vegetable waste among middle school students in the
Los Angeles Unified School District. Preventive Medicine, 67, S28-S33.
Girard, B. (2013). Paid lunch equity?. Journal of Child Nutrition Management, 37(1), 1-5.
Gleason, P. M., & Dodd, A. H. (2009). School breakfast program but not school lunch program
participation is associated with lower body mass index. Journal of the American Dietetic
Association, 109(2), S118-S128.

73
Gosliner, W. (2014). School‐level factors associated with increased fruit and vegetable
consumption among students in California middle and high schools. Journal of School
Health, 84(9), 559-568.
Grenci, A. (2009). Diabetes preparedness in schools: what do foodservice personnel need to
know to respond? Journal of Child Nutrition and Management, 33(1).
Guinn, C. H., Baxter, S. D., Finney, C. J., & Hitchcock, D. B. (2013). Examining variations in
fourth-grade children’s participation in school breakfast and lunch programs by student
and program demographics. Journal of Child Nutrition & Management, 37(1), n1.
Hanson, K., & Oliveira, V. (2012). How economic conditions affect participation in USDA
nutrition assistance programs. Retrieved from https://papers.ssrn.com
/sol3/papers.cfm?abstract_id=2176939.
Howard, L. L. (2011). Does food insecurity at home affect non-cognitive performance at school?
A longitudinal analysis of elementary student classroom behavior. Economics of
Education Review, 30(1), 157-176.
Howard, L. L., & Prakash, N. (2012). Do School Lunch Subsidies Change the Dietary Patterns of
Children from Low‐Income Households? Contemporary Economic Policy, 30(3), 362-
381.
Huang, J., & Barnidge, E. (2016). Low-income children's participation in the national school
lunch program and household food insufficiency. Social Science & Math, 150, 8-14.
Hubbard, K. L., Must, A., Eliasziw, M., Folta, S. C., & Goldberg, J. (2014). What's in children’s
backpacks: foods brought from home. Journal of the Academy of Nutrition and Dietetics,
114(9), 1424-1431.

74
Hur, I., Burgess-Champoux, T., & Reicks, M. (2011). Higher quality intake from school lunch
meals compared with bagged lunches. ICAN: Infant, Child, & Adolescent Nutrition, 3(2),
70-75.
Ishdorj, A., Crepinsek, M. K., & Jensen, H. H. (2013). Children's consumption of fruits and
vegetables: do school environment and policies affect choices at school and away from
school? Applied Economic Perspectives and Policy, 35(2), 341-359.
Johnson, D. B., Podrabsky, M., Rocha, A., & Otten, J. J. (2016). Effect of the healthy hunger-
free kids act on the nutritional quality of meals selected by students and school lunch
participation rates. JAMA Pediatrics, 170(1), e153918-e153918.
Jones, A. M., Punia, M., Shannan Young, R. D., Huegli, C. C., & Zidenberg-Cherr, S. (2013).
Training needs of personnel employed in programs participating in the national school
lunch program in California. The Journal of Child Nutrition & Management, 37(1).
Kaur, J., Lamb, M.M., & Ogden, C.L. (2015). The Association between Food Insecurity and
Obesity in Children- The National Health Nutrition Examination Survey. Journal of the
Academy of Nutrition and Dietetics, 115(5), 751-758.
Kjosen, M. M., Moore, C. E., Cullen, K.W. (2014). Middle school student perceptions of school
lunch following revised federal school meal guidelines. Journal of Child Nutrition &
Management, 39(2).
Kubik, M. Y., Lytle, L. A., Hannan, P. J., Perry, C. L., & Story, M. (2003). The association of
the school food environment with dietary behaviors of young adolescents. American
Journal of Public Health, 93(7), 1168-1173.

75
Kubik M.Y., Lytle, L.A., & Story M. (2005) Schoolwide food practices are associated with body
mass index in middle school students. Arch Pediatric Adolescent Medicine, 159(12),
1111-1114. doi:10.1001/archpedi.159.12.1111.
Kwon, J., Lee, Y. M., Park, E., Wang, Y., & Rushing, K. (2017). Free and Reduced-Price Meal
Application and Income Verification Practices in School Nutrition Programs in the
United States. Journal of Child Nutrition & Management, 41(1), n1.
Larson, N.I., & Story, M.T. (2011). Food Insecurity and Weight Status Among U.S. Children
and Families: A Review of the Literature. American Journal of Preventive Medicine,
40(2), 166-173. doi.org/1010.1016.j.amepre.2010.10.028.
Lee, Y. M., Kwon, J., Park, E., Wang, Y., & Rushing, K. (2017). Use of Point-of-Service
Systems in School Nutrition Programs: Types, Challenges, and Employee Training.
Journal of Child Nutrition & Management, 41(2), n2.
Litchfield, R. E., & Wenz, B. (2011). Influence of school environment on student lunch
participation and competitive food sales. Journal of Child Nutrition & Management,
35(1), n1.
Lopez-Neyman, S. M., & Warren, C., (2016). Barriers and advantages to student participation in
the school breakfast program based on the social ecological model: a review of literature.
Journal of Child Nutrition and Management, 40(2).
Lyson, H. C. (2017). Food fight! national policy, local dynamics, and the consequences for
school food in the U.S. ProQuest Dissertations & Theses Full Text. Retrieved from
http://spot.lib.auburn.edu/ login?url=https: //search.proquest.com /docview/
2013308103?accountid=8421

76
McDonnell, E., & Probart, C. (2008). School Wellness Policies: Employee Participation in the
Development Process and Perceptions of the Policies. Journal of Child Nutrition &
Management, 32(1), n1.
Nettles, M. F., Carr, D. H., Cater, J. B., & Federico, H. A. (2009). Identification of the
competencies, knowledge, and skills needed by school nutrition assistants in the current
environment. Journal of Child Nutrition & Management, 33(1), n1.
Ogden, C. L., Carroll, M. D., Kit, B. K., & Flegal, K. M. (2014). Prevalence of childhood and
adult obesity in the United States, 2011-2012. Jama, 311(8), 806-814.
Ohri-Vachaspati, P. (2014). Parental perception of the nutritional quality of school meals and its
association with students’ school lunch participation. Appetite, 74, 44-47.
Peterson, C. (2011). A rotten deal for schools? An assessment of states' success with the
National School Lunch Program's in-kind food benefit. Food Policy, 36(5), 588-596.
doi: 10.1016/j.foodpol.2011.07.006.
Probart, C., McDonnell, E., Hartman, T., Weirich, J. E., & Bailey-Davis, L. (2006). Factors
associated with the offering and sale of competitive foods and school lunch participation.
Journal of the American Dietetic Association, 106(2), 242-247.
Ptomey, L. T., Steger, F. L., Schubert, M. M., Lee, J., Willis, E. A., Sullivan, D. K., ... &
Donnelly, J. E. (2016). Breakfast intake and composition is associated with superior
academic achievement in elementary schoolchildren. Journal of the American College of
Nutrition, 35(4), 326-333.
Pucciarelli, D., McNeany, T., & Friesen, C. (2013). The relationship between nutrition
knowledge and school cafeteria purchases of seventh grade students in a rural Indiana
school district. School Nutrition Association. Retrieved June 11, 2013.

77
Rainville, A. J., Choi, K., Ragg, D. M., King, A., & Carr, D. H. (2010). Nutrition information at
the point of selection in high schools does not affect purchases. Journal of Child
Nutrition & Management, 34(2).
Robinson‐O'Brien, R., Burgess‐ Champoux, T., Haines, J., Hannan, P. J., & Neumark‐
Sztainer, D. (2010). Associations between school meals offered through the national
school lunch program and the school breakfast program and fruit and vegetable intake
among ethnically diverse, low‐income children. Journal of School Health, 80(10), 487-
492.
Roseman, M., & Niblock, J. R. (2007). A Culinary Approach to Healthy Menu Items. Journal of
Culinary Science & Technology, 5(1), 75-90.
Sacheck, J. M., Morgan, E. H., Wilde, P., Griffin, T., Nahar, E., & Economos, C. D. (2012). Key
strategies for improving school nutrition. Journal of Child Nutrition & Management, 36
(1).
Sallis, J. F., & Glanz, K. (2006). The role of built environments in physical activity, eating, and
obesity in childhood. The future of children, 89-108.
Schwartz, M. B., Henderson, K. E., Read, M., Danna, N., & Ickovics, J. R. (2015). New school
meal regulations increase fruit consumption and do not increase total plate waste.
Childhood Obesity, 11(3), 242-247.
Smith, S., Cunningham-Sabo, L., & Auld, G. (2015). Satisfaction of middle school lunch
program participants and non-participants with the school lunch experience. Journal of
Child Nutrition & Management, 39(2).

78
Snelling, A. M., Korba, C., & Burkey, A. (2007). The national school lunch and competitive
food offerings and purchasing behaviors of high school students. Journal of School
Health, 77(10), 701-705.
Stinson, W., & Lofton, K. (2009). Perceptions of school nutrition directors and managers
regarding their role in school wellness. Journal of Child Nutrition and Management,
33(2).
Stinson, W. B., Carr, D., Nettles, M. F., & Johnson, J. T. (2011). Food safety programs based on
HACCP principles in school nutrition programs: implementation status and factors
related to implementation. Journal of Child Nutrition & Management, 35(1), n1.
Strohbehn, C. H., Jun, J., & Arendt, S. W. (2014). School foodservice employees' perceptions of
practice: Differences by generational age and hours worked. Journal of Child Nutrition
and Management, 38(1).
Taras, H. (2005). Nutrition and student performance at school. Journal of School Health, 75(6),
199-213.
Templeton, S. B., Marlette, M. A., & Panemangalore, M. (2005). Competitive foods increase the
intake of energy and decrease the intake of certain nutrients by adolescents consuming
school lunch. Journal of the American Dietetic Association, 105(2), 215-220.
U.S. Department of Agriculture, Food and Nutrition Services. (2017a). Child Nutrition Tables.
Retrieved from https://www.fns.usda.gov/pd/child-nutrition-tables
U.S. Department of Agriculture, Food and Nutrition Services. (2017b). Food and Nutrition
Topics. Retrieved from https://www.usda.gov/topics/food-and-nutrition

79
Zoellner, J., & Carr, D. (2010). Exploring nutrition literacy and knowledge among a national
sample of school nutrition managers. Journal of child nutrition & management: a
publication of the American School Food Service Association.
Zoellner, J., & Carr, D. H. (2009). School Nutrition Directors are Receptive to Web-Based
Training Opportunities: A National Survey. Journal of Child Nutrition & Management,
33(1), n1.

80
Appendix A
Institutional Review Board Approval

81

82
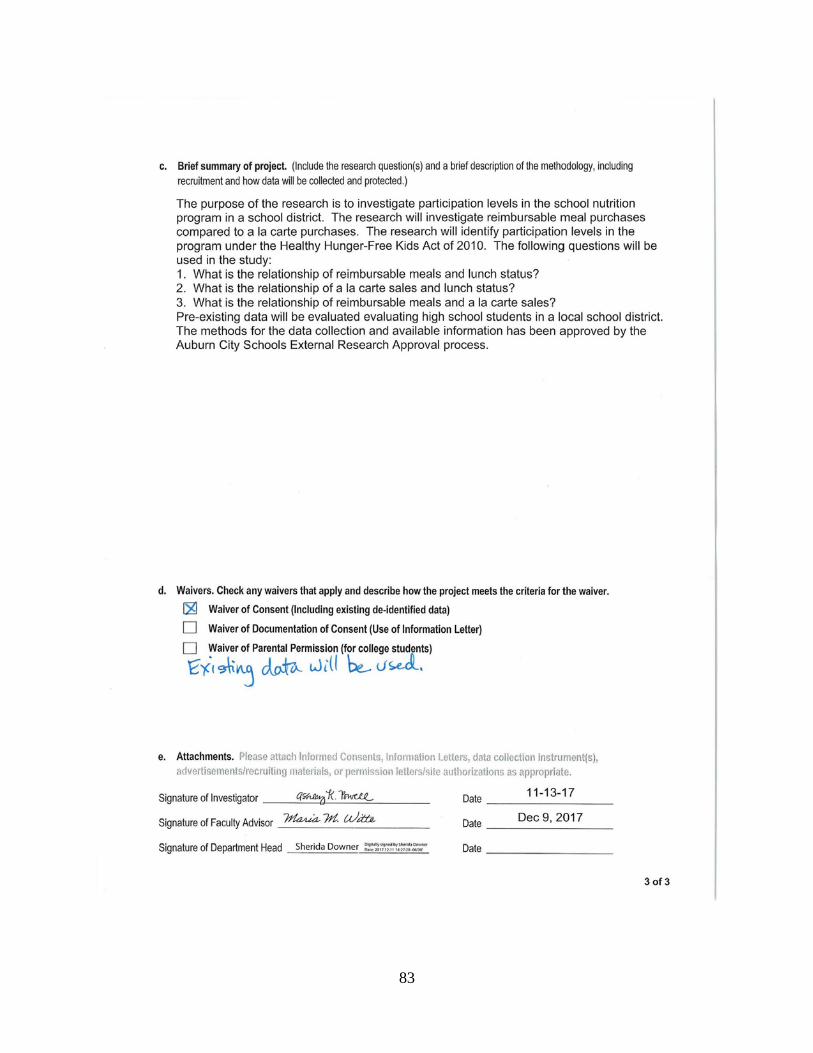
83

84

85

86

87
Appendix B
Health Hunger-Free Summary

88

89

90

91

92

93

94

95

96

97

98
Appendix C
Meal Requirements
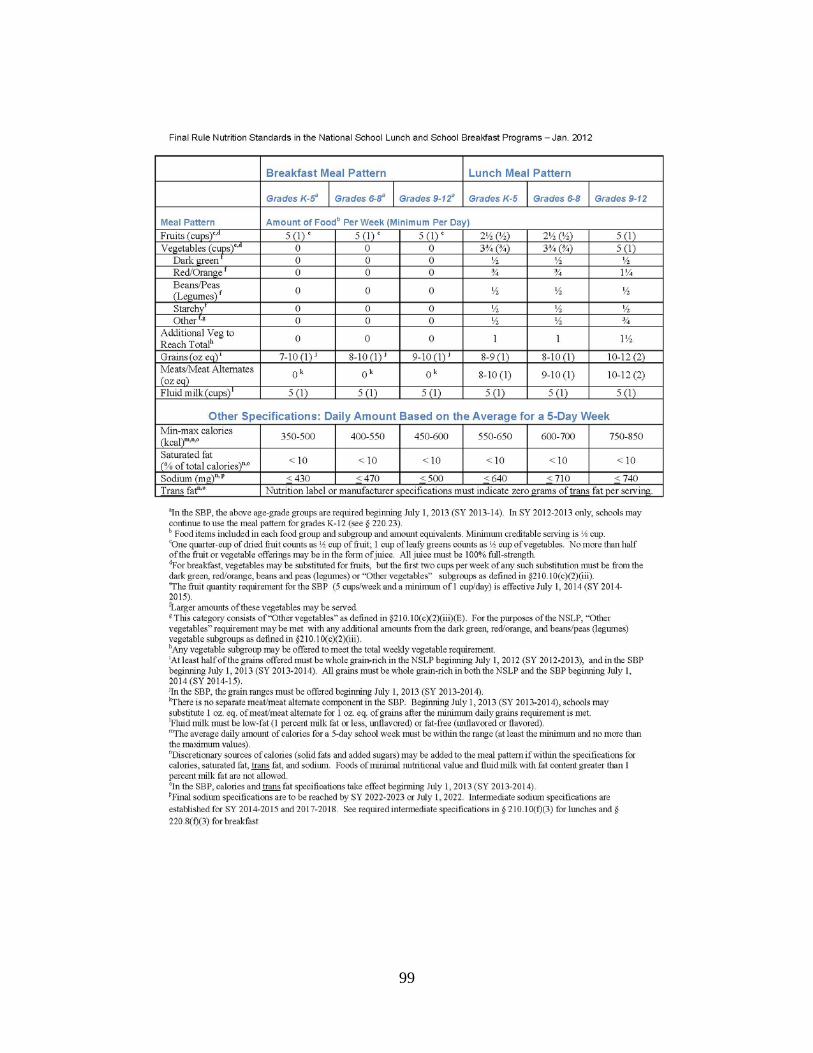
99

100
Appendix D
Reimbursement Chart

101

102

103
Appendix E
Smart Snacks Chart

104

105

106

107

108