sas group 3rd quarter presentation 2007 · newco bmi air greenland. 9 sas group q3 presentation ......
TRANSCRIPT

SAS Group 3rd Quarter Presentation 2007Analyst PresentationLondon, November 9

2SAS Group Q3 presentation
A challenging Quarter, but record passenger numbers
EBT bef. non rec. Q3: MSEK 632, Jan-Sep 2007: MSEK 982
– Record number of passengers
– Group airlines perform strongly
– Negative effect from Q400, ECA agreement
S11 implementation as planned
Despite setbacks SAS has full focus ahead
– Still favorable market conditions
– S11 will secure strong and profitable SAS

3SAS Group Q3 presentation
Quarter overshadowed by Q400 problems
Two accidents in September
– Aalborg, Vilnius
Three weeks grounding
Third accident in October
– Unique and strong decision to permanently stop operations
– Customers
– Employees
– SAS brand
Ongoing dialogue with Bombardier

4SAS Group Q3 presentation
Continued good growth in most SAS Group markets
Estonia:
Latvia:
Lithuania:
Sweden:
3.5%2%
Norway:
3.3%
7%
Denmark:
2.0% 3.7%
7.4%10%
10.1%
27%
8.2%
>25%
Expected GDP growth (2007)Passenger growth (Jan-Sep vs. last year)
Finland:
3.8%
6%
Spain (domestic):
3.6%11%
Eurozone:
2.5%4.9%
Continued favorable economic cycleGood growth on all marketsIncreased growth rate in Q3
SAS Group passenger growth (Jan-Sep vs. last year)
2.7%
4%
0.4%
6%
0.7%
15%
>27%
>5%
44%

5SAS Group Q3 presentation
Record number of passengers for the 31st
consecutive month
31 000 00032 000 00033 000 00034 000 00035 000 00036 000 00037 000 00038 000 00039 000 00040 000 00041 000 00042 000 000
jan-05
may-05
sep-0
5
jan-06
may-06
sep-0
6
jan-07
may 20
07
sep-0
7
62,0%63,0%64,0%65,0%66,0%67,0%68,0%69,0%70,0%71,0%72,0%73,0%
Number of passengers (12 months rolling) Passenger load factor (12 months rolling)
Record number of passengers since April 2005

6SAS Group Q3 presentation
Overall reflection: Complex company and thereby difficult to manage
S11 strategy will ensure SAS’s future
Cultural Turnaround
Focus and concentration
Harmonization and development of
customer offer
Competitiveness
Profitable growth

7SAS Group Q3 presentation
Cultural Turnaround
Customer orientation
Increased participation and
commitment
Improved management
Common target and new
cooperation model
Profit sharing system and part-
ownership program
Ongoing tight dialogue with the
unions
Employee incentive scheme to be
presented on AGM in April 2008
8SAS Group Q3 presentation
Focusing and concentration
Core Business
KeepScandinavian Airlines DanmarkScandinavian Airlines NorgeScandinavian Airlines SverigeScandinavian Airlines InternationalWiderøeBlue 1
Seek majority stakeairBalticEstonian Air
Review future role (decision in Dec.)SAS Ground ServicesSAS Technical ServicesSpirit (Cargo handling within SAS Cargo)
Non-core business divestments
Spanair
Newco
bmi
Air Greenland

9SAS Group Q3 presentation
Harmonization and development of customer offerPositive effects from New Commercial initiatives
Customer improvements:New fast track in StockholmBiometric solutionsSMS serviceMore distinct product conceptsLower prices in Economy ExtraSeamless flow at the airportIncreased award recognitionNew offers to corporate market
Positive Customer feedbackSAS takes market shares in premium segmentsEconomy Extra well receivedIncreased Business traffic– London f.ex.
World class electronic travel solutions
• “ h u m a n ” h o m e o r a
• In g a k ö e rFast track
• “ h u m a n ” h o m e o r a
• In g a k ö e rFast track
SMS check in service launched
WLAN service launched
New fast track at Stockholm-Arlanda
Fast track to be introduced at Oslo-
Gardermoen

10SAS Group Q3 presentation
Competitiveness:Status of the cost reductions of SEK 2.8 bn
0,0
0,5
1,0
1,5
2,0
2,5
3,0
Implemented To be implemented
2.8
Cost programSep 30 2007
Group administrative functions 300-400 MSEK– Administration, to be completed by year end
– Shared services, ongoing effects in 2008
Group coordination of procurement 400 MSEK– Centralized purchasing function with a clear mandate
– Many activities in process
SAS Group subsidiaries SEK 2.1bn
– Operational flight costs SEK 1000m
– Administrative and sales cost SEK 600m
– Ground/Technical SEK 500m
18% implemented

11SAS Group Q3 presentation
Profitable growthNew routes and commercial initiatives – Fall 2007
Decision to add one new long haul aircraft– Copenhagen – San Francisco (2008)
– Copenhagen – New Delhi (2008)
Long haul routes– Copenhagen-Dubai (October)
– Stockholm-Bangkok (October)
18 new routes in Europe introduced
New aircraft– 2 B737-800 and 2 A319 (2007)
– 3 B737-800 (2008)
– 2 B737-800 (2009)
SAS Norway focus on leisure segment– Reallocation of aircraft
– 12 new destinations
S11 Target to grow 20% until 2011
15-20 new aircraft

Gunilla BergCFO

13SAS Group Q3 presentation
Underlying 3rd Quarter Result improved
+423147570+17782259Joint Venture Lufthansa/ECA
+2000200+2000200Q400 effects
300
982
2007
January-September
350
239
2006
+1 316
-50
+743
Change
+158
0
-219
Change
July-SeptemberUnderlying result development
0
851
20062007MSEK
0
632
Underlying result improvement
Strike effects
Income before nonrecurring items in
continuing operations
3rd Quarter

14SAS Group Q3 presentation
Full year Q400 direct result effect estimated to MSEK 600-700
0
100
200
300
400
500
sep oct nov-dec
Q400 first groundingEstimated result impact = appr. 300MSEK
Q400 second groundingEstimated result impact = appr. 300-400MSEK
500 MSEK first grounding estimate:• 300 MSEK direct effect
• 200 MSEK indirect goodwill effect
Q3 effect Q4 effectSAS Group Q400 incidents direct result effect 2007

15SAS Group Q3 presentation
Actions taken to mitigate negative passenger consequences from the grounding of Q400
Q400 permanently grounded on Oct 28– 27 of the Group’s 303 aircraft accounting for 5% of the
capacity
Measures to mitigate negative passenger consequences
– Review of network and reallocation of aircraft capacity within the SAS group
– External wet lease capacity– External dry lease capacity
Long term replacement is expected to start implementation in the 2nd Half 2008
As of early November, 8 wet leases secured – Estimated to be 11-14 by end of November
– Almost 80% of capacity covered
0%10%20%30%40%50%60%70%80%90%
100%
29 Oct 12-nov 26-nov 10-dec 24-dec
Q400 replacement in production
Due to wet lease, internal group changes, usage of reserves and minor timetable changes. SAS is able to recover quickly.

16SAS Group Q3 presentation
SAS Norge and SAS Sverige close or above profitability targets
ChangeQ3 2007ChangeQ3 2007ChangeQ3 2007ChangeQ3 2007Results
-0.4 p.u.10.5%+3.5 p.u.5.3%+6.1 p.u.8.6%+1.4 p.u.6.0%EBIT margin
228
SAS International
+78207
SAS Norge
283
SAS Danmark SAS SverigeScandinavian Airlines
+213 108 -22+60EBT before nonrec. (MSEK)
SAS International
SAS Sverige
SAS Danmark
SAS Norge
EBIT-margins, 12 months rolling
1.4%
9.7%
6.3%
8.3%
17SAS Group Q3 presentation
Strong improvement in Widerøe and Blue1Weak Quarter in Spanair and STS
-0.7%2)-48SGS
1.4% 2)
-7.4% 2)
3.8%
4.8%
6.2%
-1.1%
EBIT Margin,
12 months rolling
Change vs.
last year
EBT before non-
recurring itemsSubsidiaryBusiness Area
20
-137
58
24
37
1601)
SAS Cargo
STSSAS Aviation Services
Individually Branded Airlines
airBaltic
Blue1
Widerøe
Spanair
3rd Quarter
1) Denotes EBIT2) Denotes EBIT before nonrecurring items.
18SAS Group Q3 presentation
Financial position improved
Financial net debt, MSEK
0
5000
10000
15000
20000
02-dec 03-dec 04-dec 05-dec 06-dec 31-mar 30-jun 30-sep
15%
2.87
24%
Q3/06
23%
1.45
24%
Q3/07
Adjusted equity ratio
Adjusted net debt/ equity
Financial preparedness
Financial targets
>30%
<1,00
>20%
Target

19SAS Group Q3 presentation
Fuel cost expected to be SEK 10.5 billion in 2007- Ambition to offset even 2008 cost increase
Fuel prices at all time high in October 2007
Strategy to offset jet fuel priceHedging 40-60% of expected consumption (12 months rolling)Yield management Cost initiatives
Current hedges44% Oct 07 – Sep 08 CAP at 722 USD/MT
– Of which appr. 10 p.u. with swaps at 700 USD/MT
49% hedged during 4th Quarter 2007 at 708 USD/MT
0
100
200
300
400
500
600
700
800
900
jan-99
maj-9
9se
p-99
jan-00
maj-0
0se
p-00
jan-01
maj-0
1se
p-01
jan-02
maj-0
2se
p-02
jan-03
maj-0
3se
p-03
jan-04
maj-0
4se
p-04
jan-05
maj-0
5se
p-05
jan-06
maj-0
6se
p-06
jan-07
maj-0
7se
p-07

20SAS Group Q3 presentation
Sum up 3rd Quarter
Ongoing activitiesOngoing activities Strategy 2011 under implementationCost measures of SEK 2.8bn in process
Strategy 2011 under implementationCost measures of SEK 2.8bn in process
Key DriversKey Drivers
Strong market growthStable loadPositive yieldCost & capacity control
Strong market growthStable loadPositive yieldCost & capacity control
20072007Currently no clear signs of weaker marketQ400 to affect full year negative by 600-700 MSEK
Currently no clear signs of weaker marketQ400 to affect full year negative by 600-700 MSEK


22SAS Group Q3 presentation
Appendices
23SAS Group Q3 presentation
Underlying results improved by SEK 1.3 billion Jan-Sep
-50-250+2000Strike effects (vs. 2006)
42391155177ECA and Joint Venture effects
2.1%-3,4%5,1%3.8%EBT margin
1316655504158Underlying result improvement
20000200Q400 effects
632
16 809
Q3
-476
13 879
Q1
982
46 995
9 months
826
16 307
Q2
EBT before non-recurring items
Revenues
SAS Group (MSEK)
24SAS Group Q3 presentation
Our customers shall see distinct and attractive offerings regardless of subsidiary – that’s why we are increasing harmonization
Scandinavian Airlines
Danmark
Scandinavian AirlinesNorge
Scandinavian AirlinesSverige
Scandinavian Airlines
InternationalBlue1 Widerøe airBaltic*
Estonian Air*
Increased harmonization between the Scandinavian airlines
Local adjustment
Group comprehensive, harmonization – ”minimum requirements”
* Given majority ownership

25SAS Group Q3 presentation
More streamlined group structure after sale of Flight Academy and Newco
Scandinavian Airlines Norge
Scandinavian Airlines Danmark
Scandinavian Airlines Sverige
Scandinavian Airlines International
Spanair
Widerøe
Blue1
airBaltic
SAS Ground Services
SAS Technical Services
SAS Cargo
Strategic affiliated company: Estonian Air

26SAS Group Q3 presentation
SAS Aviation Services
SAS Scandinavian Airlines
SAS Individually Branded Airlines
Revenues (SEK bn)
28,8 29,8
05
101520253035
Jan-Sep 06 Jan-Sep 07
Revenues (SEK bn)
13,4 14
0
5
10
15
Jan-Sep 06 Jan-Sep 07
Revenues (SEK bn)
10,6 10,5
0
5
10
15
Jan-Sep 06 Jan-Sep 07
Group Revenue distribution
Revenues growing the airline business areasRevenues growing in the airline business areas

27SAS Group Q3 presentation
SAS Group’s seasonal pattern
SAS Group Revenues (per month)
jan feb mar apr maj jun jul aug sep okt nov dec
2004
2005
2006
2007
28SAS Group Q3 presentation
CFROI and EBITDAR improved
13%
9.8%
4 478
45 468
Jan-Sep 2006
+4 p.u.17%CFROI (12 months)
+0.8 p.u.10.7%EBITDAR-margin
+5425 020EBITDAR
+1 52746 995Revenue
ChangeJan-Sep 2007SAS Group (MSEK)

29SAS Group Q3 presentation
After two strong quarters the third quarter is slightly weaker than previous years – due to Q400 incidents and ECA agreement
-1909
-13
11638
184
579 543
-1
677
852
558
826
632
-415
-1603
-320
-1312
-1290
-476
-2 500
-2 000
-1 500
-1 000
-500
0
500
1 000
Q1 Q2 Q3 Q4
2003 2004 2005 2006 2007
MSEK, EBT before gains and nonrecurring items

30SAS Group Q3 presentation
Positive trend in EBIT-margin and revenues
10 000
11 000
12 000
13 000
14 000
15 000
16 000
17 000
18 000
19 000
1Q 20
032Q
2003
3Q 20
034Q
2003
1Q 20
042Q
2004
3Q 20
044Q
2004
Q1 200
5Q2 2
005
Q3 200
5Q4 2
005
Q1 200
6Q2 2
006
Q3 200
6Q4 2
006
Q1 200
7Q2 2
007
Q3 200
7
-15,00%
-10,00%
-5,00%
0,00%
5,00%
10,00%
Revenues EBIT-margin

31SAS Group Q3 presentation
Growth in most group airlines
-10
0
10
20
30
40
50
airBalt
ic
Spana
irSAS Swed
en
SAS Grou
p
Widerøe
SAS Norw
ay
Blue1SAS D
enmark
SAS Inter
nationa
l
Passenger growth in Jan-Sep 2007 vs Jan-Sep 2006
31,2 million passengers in Jan-Sep
2007- new record
(%)
32SAS Group Q3 presentation
Jet fuel prices
433593Q1 2007
503510
674718
Q2 2007Q3 2007
651
568
399
282
233
245
297
USD/MT
1 988
1 980
Consumption (mMT)Year
2002
2003
2005
2004
2006
2001
2000
Average market prices on high jet fuel (2000-2007)

33SAS Group Q3 presentation
Overview of the SAS Group’s fuel hedging and expected cost 2008
0%0%0%7%3-Way
825Price, USD/MT
10%8%7%13%Swaps
718
20%
708
663
20%
Q1 2008
Price, USD/MT
0 Cost
Price, USD/MT
Strike price, USD/MT
Options
781
17%
705
713
15%
Q2 2008
702684
Q3 2008Q4 2007
800700
8%7%
751685
22%21%
SEK 13.5 bnSEK 13.0 bnSEK 12.5 bn1000 USD/MT
SEK 11.1 bn
SEK 8.9 bn
6.75 SEK/USD
800 USD/MT
600 USD/MT
Market price
SEK 11.5 bn
SEK 9.3 bn
7.00 SEK/USD6.50 SEK/USD
SEK 10.7 bn
SEK 8.6 bn
SAS Group’s jet fuel costs in 2008 (annual average values)
SAS Group’s jet fuel hedging portfolio

34SAS Group Q3 presentation
Business areas

SAS Scandinavian Airlines

36SAS Group Q3 presentation
Underlying improvement in Scandinavian Airlines despite Q400 incidents and ECA agreement
658
638
663
0
- 249
912
- 546
1 459
- 8 863
10 322
Jul-Sep2007
(MSEK)
564
579
719
1
- 295
982
- 522
1 504
- 8 551
10 055
Jul-Sep2006
(MSEK)
+94
+59
-56
-1
+46
-70
-24
-45
-312
+267
Change
+902
+917
+660
-24
+158
+582
-67
+650
-377
+1 027
Change
509
463
971
16
-902
1 801
- 1 566
3 367
- 25 433
28 799
Jan-Sep 2006
(MSEK)
1 411
1 380
1 631
-8
- 744
2 383
- 1 633
4 017
- 25 810
29 826
Jan-Sep 2007
(MSEK)
EBITDA
EBITDAR
SAS Scandinavian Airlines
EBT before nonrecurring items
EBIT
Income from sales/affiliated
Depreciation
EBT
Lease
Operating expenses
Revenues

37SAS Group Q3 presentation
EBITDAR in 3rd Quarter 1 459 MSEK
EBITDAR, SAS Scandinavian Airlines (MSEK)
-500
0
500
1 000
1 500
2 000
Q1 Q2 Q3 Q4
2002 2003 2004 2005 2006 2007

38SAS Group Q3 presentation
Positive result development in SAS Scandinavian Airlines
-600-400-200
0200400600800
Q42005
Q12006
Q22006
Q32006
Q42006
Q12007
Q22007
Q32007
SAS Danmark
0
200
400
600
800
1 000
1 200
Q42005
Q12006
Q22006
Q32006
Q42006
Q12007
Q22007
Q32007
SAS Norge
-200-100
0100200300400
Q42005
Q12006
Q22006
Q32006
Q42006
Q12007
Q22007
Q32007
SAS International
-400-200
0200400600800
1 000
Q42005
Q12006
Q22006
Q32006
Q42006
Q12007
Q22007
Q32007
SAS Sverige
EBT before nonrecurring items (12 months rolling)

39SAS Group Q3 presentation
Sweden above and Norway close to return targets
561
1 055
8 826
Jan-Sep
SAS Danmark
+572
+472
+732
Change
+336
+209
+455
Change
512
920
6 414
Jan-Sep
SAS Sweden
-55
-113
-223
Change
50
550
5 711
Jan-Sep
SAS International
857
1 616
9 966
Jan-Sep
SAS Norge
+694
+709
+600
Change
SK Results
EBT before nonrecurring items
(MSEK)
EBITDAR
Total Revenues
SAS Norge Jan-Sep 2007Strong yield and stable traffic development
– No of pass up 1.8%– Cabin factor up 0.5 p.u. to 70.4%– Yield up 9.6%– Unit cost up 1.8%
SAS Norge Jan-Sep 2007Strong yield and stable traffic development
– No of pass up 1.8%– Cabin factor up 0.5 p.u. to 70.4%– Yield up 9.6%– Unit cost up 1.8%
SAS Danmark Jan-Sep 2007Strong yield and unit cost perform.
– No of pass down 0.9%– Cabin factor down 1.2 p.u. to 71.7%– Yield up 5.8%– Unit cost down 6.2%
SAS Danmark Jan-Sep 2007Strong yield and unit cost perform.
– No of pass down 0.9%– Cabin factor down 1.2 p.u. to 71.7%– Yield up 5.8%– Unit cost down 6.2%
SAS Sverige Jan-Sep 2007Continued improved load
– No of pass up 6.7%– Cabin factor up 2.5 p.u. to 72.6%– Yield down 0.7%– Unit cost up 3.6%
SAS Sverige Jan-Sep 2007Continued improved load
– No of pass up 6.7%– Cabin factor up 2.5 p.u. to 72.6%– Yield down 0.7%– Unit cost up 3.6%
SAS International Jan-Sep 2007Challenging development
– Cabin factor at 82.9%– Yield up 5.0%– Unit cost up 2.1%
SAS Business Sleeper installed
SAS International Jan-Sep 2007Challenging development
– Cabin factor at 82.9%– Yield up 5.0%– Unit cost up 2.1%
SAS Business Sleeper installed

40SAS Group Q3 presentation
Most key airline profitability drivers improving
Traffic (RPK)Traffic (RPK)
Cabin FactorCabin Factor
Yields (RPK)Yields (RPK)
RASKRASK
2007 vs 2006 Jul-Sep
+1.0 p.u.
+7.5%
+2.7%
+3.5%
+1.5%
SAS Group
Scandinavian Airlines
Fuel adj. unit costFuel adj. unit cost

41SAS Group Q3 presentation
Yield up 8.5% in Jan-Sep 2007 in Scandinavian Airlines
1
1,1
1,2
1,3
1,4
dec-0
3mar-
04jun
-04se
p-04
dec-0
4mar-
05jun
-05se
p-05
dec-0
5mar-
06jun
-06se
p-06
dec-0
6mar-
07jun
-07se
p-07

42SAS Group Q3 presentation
North Atlantic cabin factor above AEA
Daily departures from Copenhagen
to New York, Washington DC,
Chicago, Seattle
Daily departures from Stockholm to
New York and Chicago
SK traffic up 6% in Q3 vs last year
-40
-30
-20
-10
0
10
20
30
1 5 9 13 17 21 25 29 33 37 41 45 49 1 5 9 13 17 21 25 29 33 37 41
%, RPK vs. Last year
%, Cabin factor
Week
65707580859095
Janu
aryMarc
hMay Ju
lySep
tembe
rNov
embe
rJa
nuary
March
May July
Septem
ber
Novem
ber
Janu
aryMarc
hMay Ju
lySep
tembe
r
SAS AEA

43SAS Group Q3 presentation
Solid performance on European routes
New Business Models a success– Cabin factor above AEA average since
September 2005
Strong performance on UK, Finland and
Switzerland
New non stop routes from Stockholm,
Copenhagen and Gothenburg during
2007– 12 new routes from Oslo in 2008
Traffic Jan-Sep 2007:– AEA traffic up 7.0%
– SAS traffic up 1.1%
-40-30-20-10
010203040
1 6
11
16
21
26
31
36
41
46
51 4 9
14
19
24
29
34
39
%, RPK vs. Last year
%, Cabin factor
45
55
65
75
Janu
aryMarc
hMay Ju
lySep
tembe
rNov
embe
rJa
nuary
March
May July
Septem
ber
Novem
ber
Janu
aryMarc
hMay Ju
lySep
tembe
r
SAS AEA

44SAS Group Q3 presentation
60
65
70
75
80
85
90
95
Januar
yM
arch May
July
Septem
berNove
mber
JanuaryM
arch
May
July
Septem
berNovem
berJa
nuaryM
arch
May
July
Septem
ber
SAS AEA
Copenhagen-Dubai and Stockholm-Bangkok introduced in October 2007
Scandinavian Airlines serving Bangkok, Beijing, Tokyo and Dubai
Stockholm-Beijing as from March 2007
Stockholm-Bangkok and Copenhagen-Dubai as from October 2007
New strategy on China successful – traffic up 49% vs last year on Beijing in Q3 with increased load factor
SK passenger load factor above AEA
Traffic in Jan-Sep 2007:– AEA traffic up 2,8%
– SAS traffic down 15% due to reduced capacity during
the summer program
-50
-40
-30
-20
-10
0
10
20
30
40
1 5 9
13
17
21
25
29
33
37
41
45
49 1 5 9
13
17
21
25
29
33
37
%, RPK vs. Last year
%, Cabin factor
Week

SAS Individually Branded Airlines

46SAS Group Q3 presentation
Weak quarter in SAS Individually Branded Airlines –mainly due to Spanair result
269
312
357
68
-76
365
-388
752
-4 623
5 375
Jul-Sep2007
(MSEK)
349
349
392
29
-71
434
-375
809
- 4 396
5 204
Jul-Sep2006
(MSEK)
-80
-37
-35
+39
-5
-69
-13
-57
-227
+171
Change
-46
-4
17
59
-3
-39
19
-59
-658
599
Change
212
212
326
54
-218
490
-1 128
1 619
- 11 776
13 395
Jan-Sep 2006 (MSEK)
166
208
343
113
-221
451
-1 109
1 560
- 12 434
13 994
Jan-Sep 2007
(MSEK)
EBITDA
EBITDAR
SAS Individually Branded AirlinesResult
EBT before nonrecurring items
EBIT
Income from sales/affiliated
Depreciation
EBT
Lease
Operating expenses
Revenues

47SAS Group Q3 presentation
Spanair result weaker due to phasing out aircraft, strong improvement for Widerøe and Blue1
150
349
2 252
Jan-Sep
Widerøe
+146
+140
+49
Change
+116
+97
+19
Change
80
190
1 492
Jan-Sep
Blue1
+24
+85
+439
Change
68
250
1591
Jan-Sep
airBaltic
-91 (EBIT)
762
8 645
Jan-Sep
Spanair
-363
-416
+82
Change
SAS Individually Branded Airlines
EBT before nonrecurring items
Results (MSEK)
EBITDAR
Total Revenues
Spanair Jan-Sep 2007Strong growth, but tough market
– No of pass up 16.1%– Cabin factor up 0.5 p.u. to 69.0%– Yield down 8% due to labor conflicts and increased
competition
Spanair Jan-Sep 2007Strong growth, but tough market
– No of pass up 16.1%– Cabin factor up 0.5 p.u. to 69.0%– Yield down 8% due to labor conflicts and increased
competition
Widerøe Jan-Sep 2007Best Jan-Sep ever
No of pass up 2.7%– Cabin factor up 3.0 p.u. to 59.9%– Yield up 2.0%
Widerøe Jan-Sep 2007Best Jan-Sep ever
No of pass up 2.7%– Cabin factor up 3.0 p.u. to 59.9%– Yield up 2.0%
Blue1 Jan-Sep 2007Strongly improved result
– No of pass on same level as last year– Cabin factor up 1.3 p.u. to 68.3%– Yield down 5.2%– Unit cost down
Blue1 Jan-Sep 2007Strongly improved result
– No of pass on same level as last year– Cabin factor up 1.3 p.u. to 68.3%– Yield down 5.2%– Unit cost down
airBaltic Jan-Sep 2007Strong growth
– No of pass up 39%– Cabin factor up 1.5 p.u. to 64.5%– Yield down 11% mainly due to longer routes
airBaltic Jan-Sep 2007Strong growth
– No of pass up 39%– Cabin factor up 1.5 p.u. to 64.5%– Yield down 11% mainly due to longer routes

48SAS Group Q3 presentation
Estonian Air’s growth increasing
The SAS Group holds 49% in Estonian Air
Estonian Air number of passengers up 4% in 2007 and 11% in Q3 – Growth has increased due to increased fleet
Competitive cost position
Increased charter operation
Number of passengers Estonian Air
010 00020 00030 00040 00050 00060 00070 00080 00090 000
Dec Mar Jun
Sep Dec Mar Jun
Sep Dec Mar Jun
Sep Dec Mar Jun
Sep Dec Mar Jun
12 month rolling Monthly figures
SAS Aviation Services
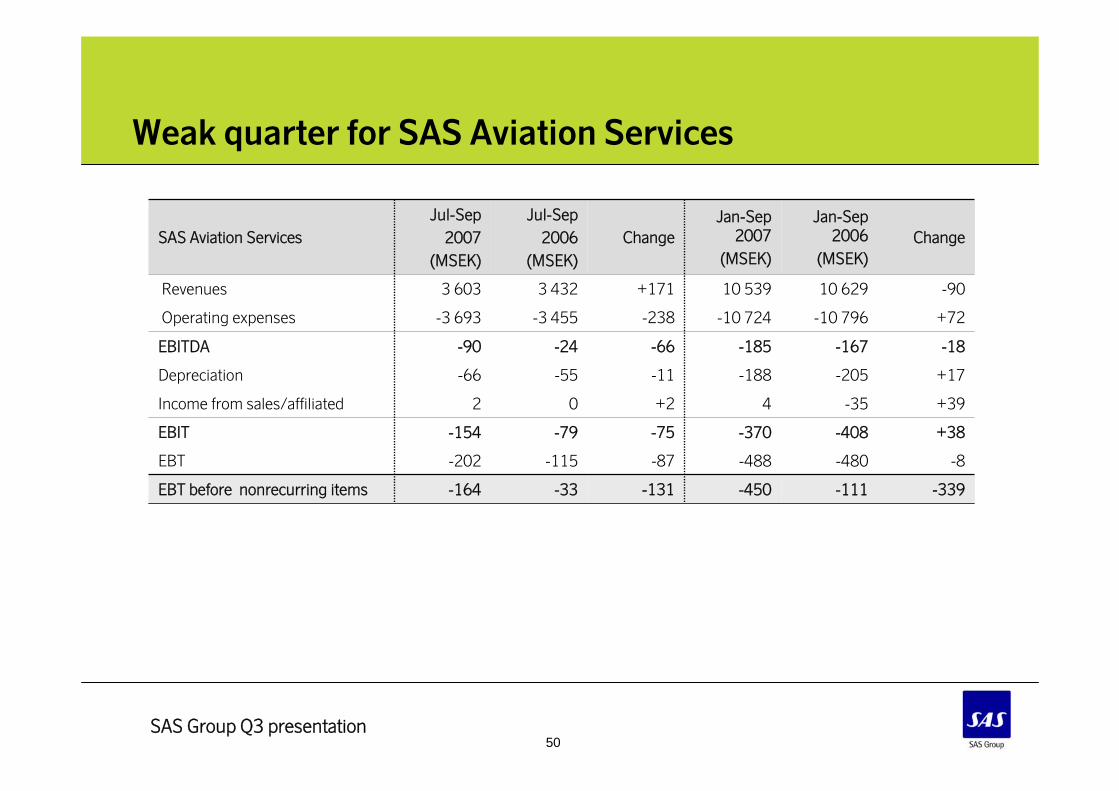
50SAS Group Q3 presentation
Weak quarter for SAS Aviation Services
-164
-202
-154
2
-66
-90
-3 693
3 603
Jul-Sep2007
(MSEK)
-33
-115
-79
0
-55
-24
-3 455
3 432
Jul-Sep2006
(MSEK)
-131
-87
-75
+2
-11
-66
-238
+171
Change
-339
-8
+38
+39
+17
-18
+72
-90
Change
-111
-480
-408
-35
-205
-167
-10 796
10 629
Jan-Sep 2006
(MSEK)
-450
-488
-370
4
-188
-185
-10 724
10 539
Jan-Sep 2007
(MSEK)
EBITDA
SAS Aviation Services
EBT before nonrecurring items
EBIT
Income from sales/affiliated
Depreciation
EBT
Operating expenses
Revenues

51SAS Group Q3 presentation
Breakdown SAS Aviation Services
-82-69664 464SAS Ground Services
-177
4
Change
-12
-369
Jan-Sep 2007
EBT before nonrec. itemsRevenues
ChangeJan-Sep 2007SAS Aviation Services
-58
-234
2 483
3 649
SAS Cargo
SAS Technical Services

Financial update

53SAS Group Q3 presentation
SAS Group Balance Sheet
4 134
51 164
16 338
3 473
16 528
14 825
51 164
27 648
12 713
10 803
Dec 31, 2006
17 211Equity
3 789Deferred tax
29 403Other assets
1 618
50 737
12 301
17 436
50 737
12 420
8 914
Sep 30, 2007
Total assets
SAS Group Balance Sheet
Financial net debt
Total liabilities and equity
Interest-bearing liabilities
Operating liabilities
Aircraft, spare parts
Liquid funds

54SAS Group Q3 presentation
CAPEX
Other investments approximately MSEK 1 500 /year
Above orders, planned to be financed through sale and leaseback
26
2008
66
2
2
2009
24
1
1
2007
( remaining part)
116CAPEX
3
2
1
Total
Boeing 737-800 (NG)
Number of aircraft
Firm Aircraft Orders
Airbus A319

55SAS Group Q3 presentation
The Revolving Credit Facility of MEUR 366 with maturity in June 2010 – Improved terms and conditions
New Revolving Credit Facility of MUSD 156 agreed in Q1 2007
SAS Group has more than SEK 15 bn in available funds
+5878 3278 914Liquid Funds
+1 01301 013Revolving Credit Facility (MUSD 156)
Available Credit Facilites:
Others
Bi-lateral Facilities
Revolving Credit Facility (MEUR 366)
14 208
5 881
674
1 500
3 707
Sep 06
+1476 028Total Available Facilities
+73414 942Total Available Funds
644
1 000
3 371
Sep 07
-500
- 30
-336
ChangeAvailable Funds MSEK
6 946
1 065
5 881
- 836229Utilized facilities
-6896 257Total facilities
6 028 +147Available facilities:

56SAS Group Q3 presentation
SAS Group CAPEX holiday continues
SAS Group total CAPEX
0
2000
4000
6000
8000
10000
12000
14000
1997
1998
1999
2000
2001
2002
2003
2004
2005
2006
2007
F20
08F
2009
FMSEK

57SAS Group Q3 presentation
Strong improvement in all key ratios in 2007
>30%15%23%Adjusted equity/assets ratio*
<100%168%145%Adjusted gearing**
Financial net debt/ equity
Equity/assets ratio (solidity)
Key figures
9%
34%
Sep 07
<50%
Target
25%
19%
Dec 06
Consolidation coming years
Low investments
Improved cash flow from operations
*Defined as:
**Defined as:
lease operating7assets totalequity∗+
equity
lease operating *7debtnet financial +

58SAS Group Q3 presentation
Amortization profile of interest bearing liabilities- Reduced level in 2008
2 881
104
1 086
115130403
953856
4 625
528
-
500
1 000
1 500
2 000
2 500
3 000
3 500
4 000
4 500
5 000
2007 2008 2009 2010 2011 2012 2013 2014 2015 >2015
Oct-Dec

59SAS Group Q3 presentation
Development of Financial Net Debt January – September 2007
-77Deconsolidation, currency & other
-1 618Financial Net Debt Sep 07
+475Sale of subsidiaries, net
+2 618Cash flow from operating activities
-4 134Financial net debt Dec 06
Investments
Sale of aircraft and properties
Financial Net Debt
-1 879
+1 379
Sep 2007

60SAS Group Q3 presentation
SAS Group Financial Net
-859
+12
-871
Oct 2005-Sep 2006
+284
-19
+303
Difference
-575
-7
-568
Oct 2006-Sep 2007
Financial net
Exchange rate differences
Interest net and others
MSEK
Oct 2006-Sep 2007 vs. Oct 2005-Sep 2006
-704
+13
-717
Jan-Sep 30, 2006
+348
-7
+355
Difference
-356
+6
-362
Jan-Sep, 2007
Financial net
Exchange rate differences
Interest net and others
MSEK
Jan-Sep 2007 vs. Jan-Sep 2006
-256
+14
-270
Q3, 2006
+179
-20
+199
Difference
-77
-6
-71
Q3, 2007
Financial net
Exchange rate differences
Interest net and others
MSEK
Q3 2007 vs. Q3 2006
61SAS Group Q3 presentation
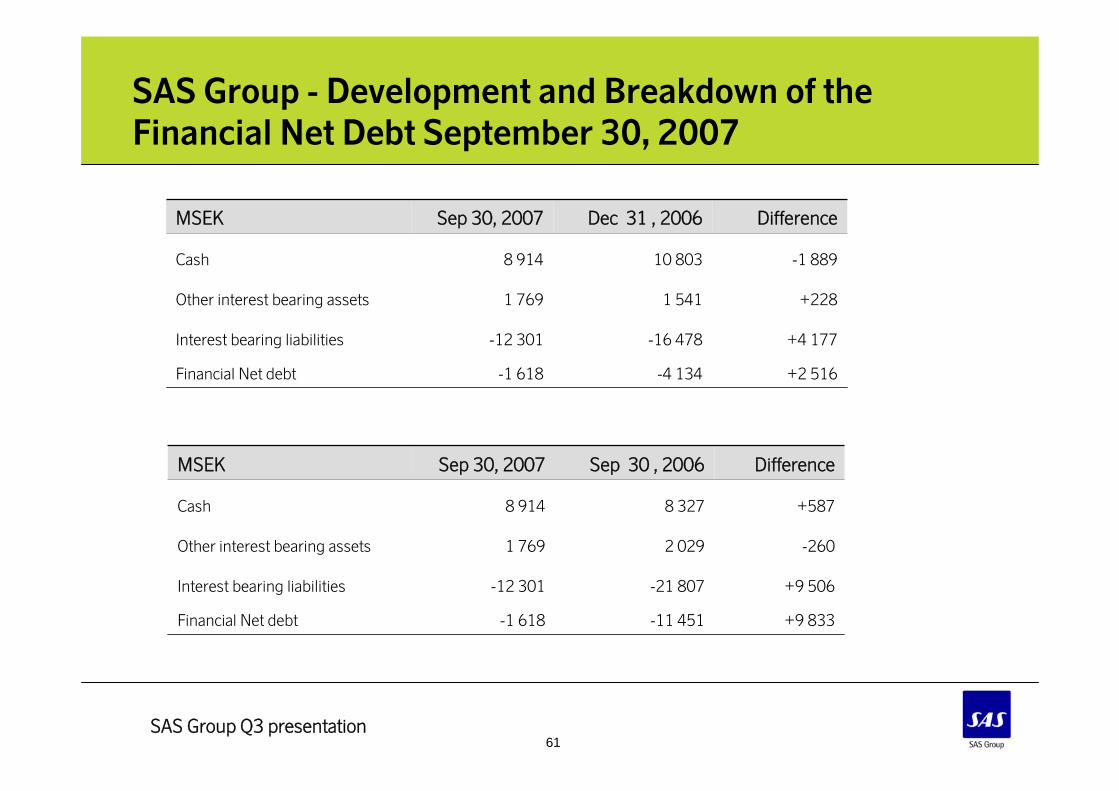
SAS Group - Development and Breakdown of the Financial Net Debt September 30, 2007
+4 177-16 478-12 301Interest bearing liabilities
+2281 5411 769Other interest bearing assets
-4 134
10 803
Dec 31 , 2006
-1 618
8 914
Sep 30, 2007
+2 516Financial Net debt
-1 889Cash
MSEK Difference
+9 506-21 807-12 301Interest bearing liabilities
-2602 0291 769Other interest bearing assets
-11 451
8 327
Sep 30 , 2006
-1 618
8 914
Sep 30, 2007
+9 833Financial Net debt
+587Cash
MSEK Difference

62SAS Group Q3 presentation
Development of the Financial Net Debt, reduced by more than SEK 15bn since peak levels
0
5 000
10 000
15 000
20 000
25 000
92-12 93-12 94-12 95-12 96-12 97-12 98-12 99-12 00-12 01-12 02-12 03-12 04-12 05-12 06-12
MS
EK
Average 93 15.900
Average 94 9.700
Average 95 4.950
Average 96 2.350
Average 97 2.150
Average 98 2.900
Average 99 6.750
Average 00 5.450
Average 01 9.150
Average 02 17.950
Average 03 19.100
Average 0418.600
Average 05 16.100
Average 0611.600

63SAS Group Q3 presentation
Development of the Equity/Asset ratio
0%
5%
10%
15%
20%
25%
30%
35%
40%
45%
50%
199219931994199519961997199819992000200120022003200420052006

64SAS Group Q3 presentation
Financial Net Debt/Equity ratio development
0,0
0,3
0,5
0,8
1,0
1,3
1,5
1,8
2,0
2,3
2,5
199219931994199519961997199819992000200120022003200420052006
65SAS Group Q3 presentation
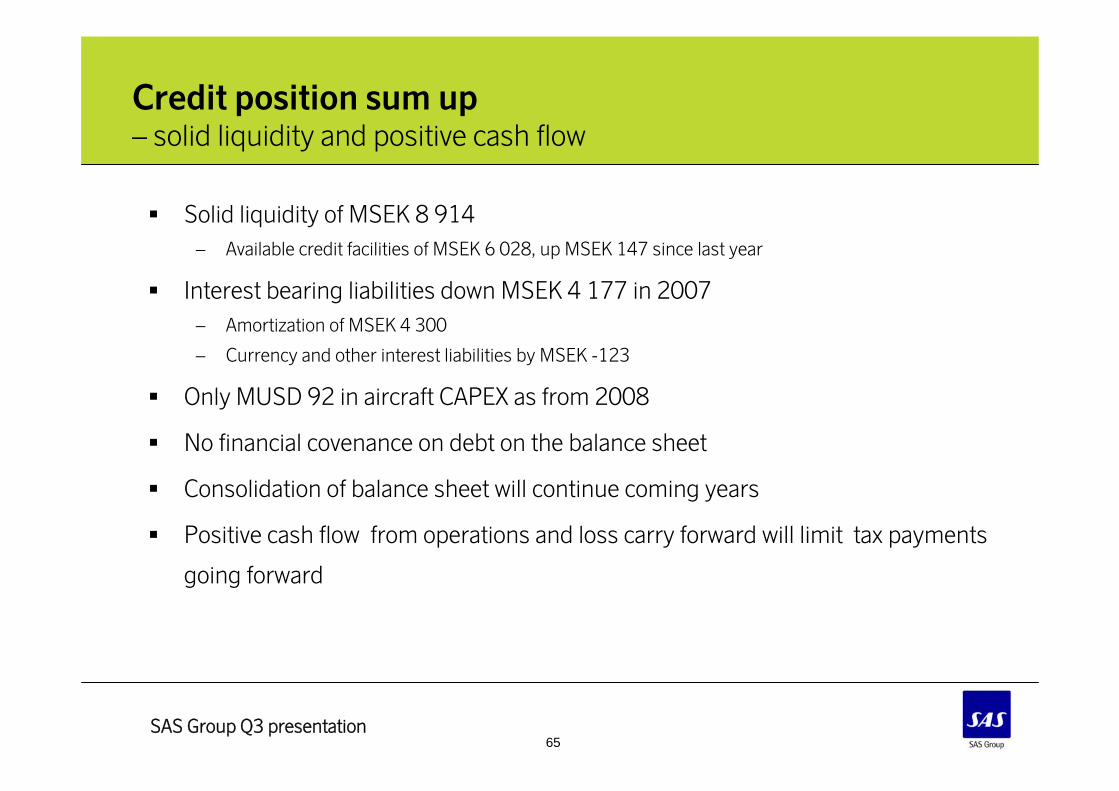
Credit position sum up – solid liquidity and positive cash flow
Solid liquidity of MSEK 8 914– Available credit facilities of MSEK 6 028, up MSEK 147 since last year
Interest bearing liabilities down MSEK 4 177 in 2007– Amortization of MSEK 4 300
– Currency and other interest liabilities by MSEK -123
Only MUSD 92 in aircraft CAPEX as from 2008
No financial covenance on debt on the balance sheet
Consolidation of balance sheet will continue coming years
Positive cash flow from operations and loss carry forward will limit tax payments
going forward

66SAS Group Q3 presentation
APPENDICES
Capacity, fuel, and yield 2007
Traffic Data
Yield
Unit cost
Fleet
Financial key figures

67SAS Group Q3 presentation
2007 vs. 2006SAS Group
2007 vs. 2006SAS Scandinavian Airlines
2007 estimatesSAS Group
+2%Blue 1
+15%Spanair
- (4-5)%Widerøe
+40%airBaltic
+7 – 8%Scandinavian Airlines Sverige
-1%Scandinavian Airlines Norge
+1%Scandinavian Airlines Danmark
-6%Scandinavian Airlines International
Flat/slightly positiveLoad factor
-1%ASK
Positive 1st Half, Stable 2nd Half Yield
Flat/slightly positiveLoad factor
up 4-6%ASK
Capacity, fuel, yield and load factor
The grounding of Q400 is expected to be offset by leased in capacity

68SAS Group Q3 presentation
Yield development
2.7%105.1108.0Currency adj. yield
105.4
Jul-Sep 2006
108.0
Jul-Sep 2007
2.5%Yield (öre/RPK)
MSEK Change
Yield, SAS Scandinavian Airlines
-0.9%
-12.0%
-11.3%
-3.1%
Jul-Sep 2007Yield, local currency
Yield, SAS Individually Branded Airlines
8.5%109.4118.7Currency adj. yield
111.6
Jan-Sep 2006
118.7
Jan-Sep 2007
6.4%Yield (öre/RPK)
MSEK Change
+2.0%
-8.2%
-11.2%
-5.2%
Jan-Sep 2007Yield, local currency

69SAS Group Q3 presentation
Improved yield and load factor
40%
50%
60%
70%
80%
03-no
v04
-feb
04-m
aj04
-aug
04-no
v05
-feb
05-m
ay05
-aug
05-no
v06
-feb
may-06
06-au
go6
-nov
07-fe
b07
-maj
07-au
g
1,00
1,05
1,10
1,15
1,20
1,25
1,30
Load factor Yield (12 months rolling)
SAS Scandinavian Airlines

70SAS Group Q3 presentation
Yield development – SAS Scandinavian Airlines
-20
-15
-10
-5
0
5
10
15
20
Q1vs
2003
Q2 Q3 Q4 Q1vs
2004
Q2 Q3 Q4 Q1vs
2005
Q2 Q3 Q4 Q1vs
2006
Q2 Q3
Yields down 9.1% in 2004
Yields down 0.3 in 2005
Yield up 1.2% in Q1 2006
Yield up 1.9% in Q2 2006
Yield up 9.2% in Q3 2006
Yield up 15.4% in Q4 2006
Yield up 16.0% in Q1 2007
Yield up 8.3% in Q2 2007
Yield up 2.7 in Q3 2007

71SAS Group Q3 presentation
Break down of SAS Scandinavian Airlines Unit Cost Jul-Sep 2007
-8 392
-467
-7 925
-703
-990
-1 232
-134
-959
-1 871
-2 036
Jul-Sep 07
-0,4%-6,4%-499Aircraft costs
1,5%14,5%-864Technical
-0,1%-0,4%-1 237Ground Services
2,0%
2,6%
-16,1%
-1,9%
3,7%
2,4%
7,3%
Var %
2,0%
2,4%
-1,6%
0,0%
0,4%
0,5%
1,7%
Share of total var%
-7 725TOTAL OPERATING EXPENSES
-1 828Fuel
-1 897Personnel
-137Selling cost
-924Gov. Charges
-8 225ADJUSTED EBIT
-837
Jul-Sep 06
Other operating costs
Cost break down
Cost break down, volume, currency and method adjusted SAS Scandinavian Airlines

72SAS Group Q3 presentation
Break down of SAS Scandinavian Airlines Unit Cost Jan-Sep 2007
-24 924
-1 397
-23 527
-2 516
-2 930
-3 706
-390
-2 716
-5 092
-6 177
Jan-Sep 07
-0,3%-5,7%-1 481Aircraft costs
0,4%3,3%-2 837Technical
0,0%0,0%-3 705Ground Services
2,3%
2,9%
-9,5%
-2,1%
3,0%
7,2%
7,1%
Var %
2,3%
2,7%
-1,1%
0,0%
0,3%
1,4%
1,7%
Share of total var%
-22 874TOTAL OPERATING EXPENSES
-4 752Fuel
-5 766Personnel
-398Selling cost
-2 636Gov. Charges
-24 356ADJUSTED EBIT
-2 779
Jan-Sep 06
Other operating costs
Cost break down
Cost break down, volume, currency and method adjusted SAS Scandinavian Airlines

73SAS Group Q3 presentation
Unit cost slightly up in Q3 2007
-22%
-17%
-12%
-7%
-2%
3%
8%
1st
Q 2
00
3
2n
d Q
20
03
3rd
Q 2
00
3
4th
Q 2
00
3
1st
Q 2
00
4
2n
d Q
20
04
3rd
Q 2
00
4
4th
Q 2
00
4
1st
Q 2
00
5
2n
d Q
20
05
3rd
Q 2
00
5
4th
Q 2
00
5
1st
Q 2
00
6
2n
d Q
20
06
3rd
Q 2
00
6
4th
Q 2
00
6
1st
Q 2
00
7
2n
d Q
20
07
3rd
Q 2
00
7
SAS Scandinavian Airlines unit cost change
Unit cost down 10.9% in 2004Unit cost down 1.7% in 2005Unit cost up 5.2% in 2006Unit cost up 2.1% in Q1 2007
– Adjusted for fuel, unit cost was down 0.2%
Unit cost up 2.9% in Q2 2007– Adjusted for fuel, unit cost was up 1.5%
Unit cost up 2.0% in Q3 2007– Adjusted for fuel, unit cost was up 1.5%

74SAS Group Q3 presentation
Productivity
7828098,25airBaltic
699
417
615
Cabin
hours/year
5748,07SAS Scandinavian Airlines
6618,58Blue1
4326,62Widerøe
Pilots
hours/year
Aircraft
hours/day
12 months rolling
Block hours, 12 months rolling, Oct 06 - Sep 07

75SAS Group Q3 presentation
Key productivity ratios – SAS Scandinavian Airlines
Aircraft utilization (12 months roling)
5
5,5
6
6,5
7
7,5
8
8,5
DecApr Aug DecApr Aug DecApr Aug DecApr Aug
Cabin, pilot utilization (12 month roling)
420
470
520
570
620
670
Dec Mar Jun
Sep Dec Mar Jun
Sep Dec Mar Jun
Sep Dec Mar Jun
Sep
Pilots Cabin crew

76SAS Group Q3 presentation
Self Service check in above 50% Internet check in over 5%
20%
25%
30%
35%
40%
45%
50%
55%
200211200303200307200311200403200407200411200503200507200511200603200607200611200703200707
Automat Automat+internet

77SAS Group Q3 presentation
Long term passenger cabin factor trend positive
50%
55%
60%
65%
70%
75%
80%
DEC94 DEC95 DEC96 DEC97 DEC98 DEC99 DEC00 DEC01 DEC02 DEC03 DEC04 DEC05 DEC06 DEC07

78SAS Group Q3 presentation
Continued weak USD in 2007
6
7
8
9
10
11
12
20032002200120002004200520062007

79SAS Group Q3 presentation
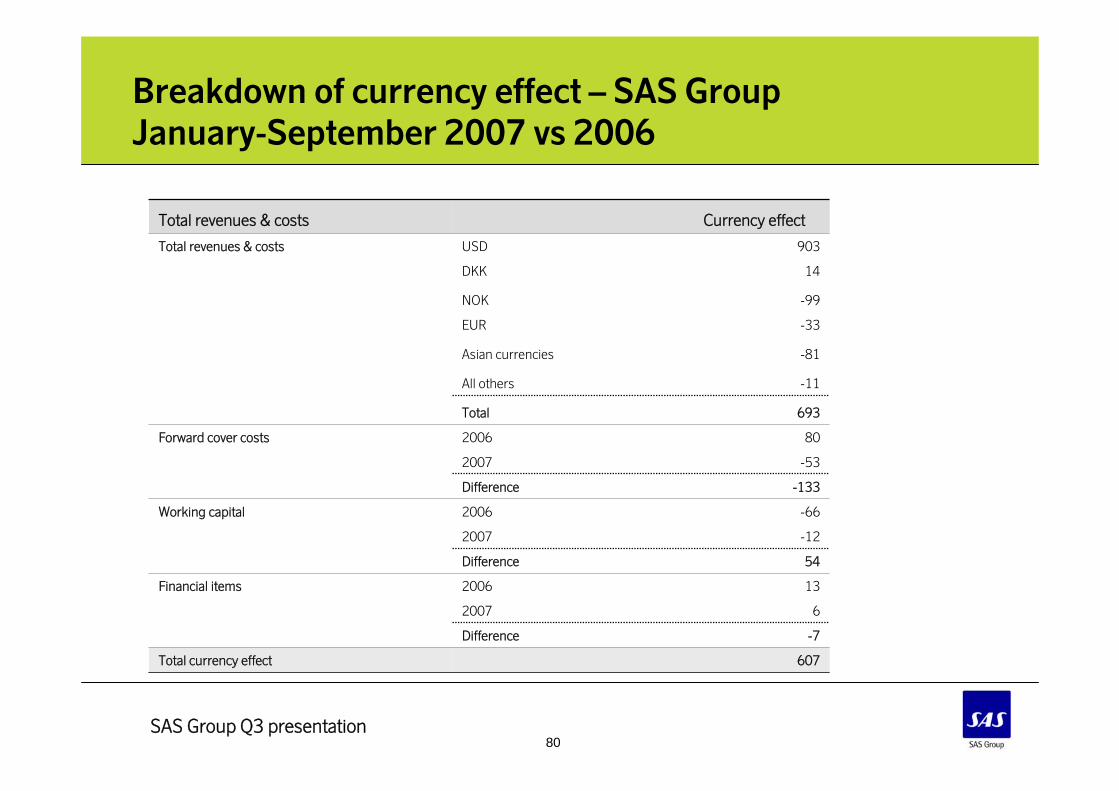
Currency effect – SAS GroupJanuary-September 2007 vs 2006
607Income before tax
-7Financial items
614
-79
1 500
-807
Jan-Sep 2007
Total costs
Total revenues
Income before depreciation
Forward cover costs & working cap
MSEK
80SAS Group Q3 presentation
Breakdown of currency effect – SAS GroupJanuary-September 2007 vs 2006
-7Difference
132006Financial items
-662006Working capital
-122007
802006Forward cover costs
-532007
-11All others
-81Asian currencies
693Total
Total currency effect
Total revenues & costs
Total revenues & costs
-99NOK
-33EUR
607
62007
54
-133
14
903
Currency effect
DKK
USD
Difference
Difference

81SAS Group Q3 presentation
Breakdown of currency effect – SAS GroupJuly-September 2007 vs 2006
-20Difference
142006Financial items
-632006Working capital
172007
342006Forward cover costs
-852007
2All others
-16Asian currencies
243Total
Total currency effect
Total revenues & costs
Total revenues & costs
13NOK
6EUR
184
-62007
80
-119
0
238
Currency effect
DKK
USD
Difference
Difference

82SAS Group Q3 presentation
Currency distribution in the SAS Group 2006
Expenses
DKK13%
EUR18%
GBP3%
NOK19%
SEK15%
USD30%
Others2%
Revenues
DKK11%
EUR26%
GBP5%
NOK29%
SEK18%
USD6%
Others5%

83SAS Group Q3 presentation
SAS Group fleet – September 2007
2812.7Wideroe
995.9Blue1
212115.2airBaltic
3930311.5Total
9
9
0
0
0
3
2
0
4
0
0
Leased out
47
198
303
52
14
9
8
79
7
90
33
11
Total
68
18
0
0
8
13
0
20
4
5
Owned
47
235
34
14
9
0
66
7
70
29
6
Leased
010.7Douglas MD-90-series
05.9Avro RJ-85/100
09.7deHavilland Q-series
017.9Fokker F50
018.2Douglas MD-80-series
311.2SAS Scandinavian Airlines
11.3Spanair
311.5Totalt
Boeing 717 (MD-95)
Boeing 737-series
Airbus A321/A320/A319
Airbus A330/A340
SAS Group fleet
29.7
07.1
1
0
On order
4.7
5.3
Average age

84SAS Group Q3 presentation
SAS share

85SAS Group Q3 presentation
Development of the SAS Group’s Market Capitalization
0
5 000
10 000
15 000
20 000
25 000
30 000
jan-05
maj-05
sep-05
jan-06
maj-06
sep-06
jan-07
maj-07
sep-07

86SAS Group Q3 presentation
SAS Share vs Peers Index
80,0
120,0
160,0
200,0
240,0
280,0
320,0
dec-04
mar-05
jun-05se
p-05
dec-05
mar-06
jun-06se
p-06dec
-06mar-
07
jun-07
Peers SAS
SAS Market Capitalization vs. European Peers measured in SEK(December 31, 2004 - September 30, 2007)
192.5
167.3

87SAS Group Q3 presentation
Volume of traded shares in balance after very active summer
Number of traded shares, SAS Group Jan 2005 – Sep 2007
0
5 000 000
10 000 000
15 000 000
20 000 000
25 000 000
30 000 000
Jan
Feb Mar Apr
May Jun Jul
Aug
Sep Oct
Nov
Dec
2005 2006 2007