sas credit scoring in-house scorecard … formação sas oferta para 2003 author jos van der velden...
TRANSCRIPT

Copyright © 2003, SAS Institute Inc. All rights reserved.
SAS Credit ScoringIn-House Scorecard Development Project
Helena Junqueiro PM CRM Solutions & Data Mining, SAS PortugalHendrik Wagner, PM Data Mining Solutions, SAS EMEA

Copyright © 2003, SAS Institute Inc. All rights reserved.
SAS Credit ScoringHendrik Wagner, PM Data Mining Solutions, SAS EMEA

Copyright © 2003, SAS Institute Inc. All rights reserved. 3
SAS Credit Scoring
! Credit Risk Data Mart
! In-house Scorecard Development Environment
! Scorecard Monitoring Reports
! Interfaces to Operational Systems
! Efficient Knowledge Transfer

Copyright © 2003, SAS Institute Inc. All rights reserved. 4
Benefits of in-housescorecard development! Faster
! Cheaper
! More flexible
! More accurate
! More secure
! Basel compliant
! Reusable skills
! Better monitoring

Copyright © 2003, SAS Institute Inc. All rights reserved. 5
Capabilities for Basel
! Development of rating models
! Individual PD from statistical models
! Definition of rating grades and pools
! LGD and EAD estimation
! Proof of risk differentiation
! Recognition of all factors
! Representative samples

Copyright © 2003, SAS Institute Inc. All rights reserved. 6
Capabilities for Basel
! Documentation through process flow diagrams
! Transparent / Robust
! Data management processes� Data Access and Collection� Reporting Data Mart � Scorecard Development Data Mart
! Scorecard development processes

Copyright © 2003, SAS Institute Inc. All rights reserved. 7
SAS Risk Management Solutions
Copyright © 2003, SAS Institute Inc. All rights reserved.
In-House Scorecard Development Project
Helena JunqueiroCRM Solutions & Data Mining Product ManagerSAS Portugal

Copyright © 2003, SAS Institute Inc. All rights reserved. 9
Company Details
� It�s a finance company established in 1991
� Specialized in credit card management
� SAS customer since 1998 with Statistical Package
� Belongs to one of largest Portuguese financial group
� Average Market Share 17%
� SAS customer since April 1996
� Is established since XIX century (1880)
� Major activities: Banking, Leasing, Consumer Credit, Insurance, Brokerage, Asset Management, e-business, Factoring, Venture Capital

Copyright © 2003, SAS Institute Inc. All rights reserved. 10
Business Pain� Keep growing the market penetration rates� Internal costs� Lack of knowledge on their data� Unable to have behaviour scoring framework� Dependence of a credit scoring company�s outsource
(implementation / developing)

Copyright © 2003, SAS Institute Inc. All rights reserved. 11
Project Methodology:
! Phase 1: Defining the scope
! Phase 2: Making data available (data mart)
! Phase 3: Evaluating the environment for modeling
! Phase 4: Model development
! Phase 5: Model deployment
! Phase 6: Performance monitoring

Copyright © 2003, SAS Institute Inc. All rights reserved. 12
Project Methodology:
! Phase 1: Defining the scope! Phase 2: Making data available (data mart)
! Phase 3: Evaluating the environment for modeling
! Phase 4: Model development
! Phase 5: Model deployment
! Phase 6: Performance monitoring

Copyright © 2003, SAS Institute Inc. All rights reserved. 13
Phase 1: Defining the Scope
� Build a behaviour credit card model to assign a credit card limit
� Automating the decision process on accepting or rejecting credit cards on giving credit card limits

Copyright © 2003, SAS Institute Inc. All rights reserved. 14
Project Methodology:
! Phase 1: Defining the scope
! Phase 2: Making data available (data mart)! Phase 3: Evaluating the environment for modeling
! Phase 4: Model development
! Phase 5: Model deployment
! Phase 6: Performance monitoring

Copyright © 2003, SAS Institute Inc. All rights reserved. 15
Phase 2: Data Mart! Developing the Data Mart using
SAS/Warehouse Administrator
! Duration 4 months : November 2002 - February 2003
! Advantages of using SAS/WA tool:� Process integration &
documentation � Process Automation� Flexible and adaptable for
incorporating business rules� � Cornerstone for every
successful Credit Scoring projects.

Copyright © 2003, SAS Institute Inc. All rights reserved. 16
Phase 2: Variables� Account Information (id, opening/cancellation date,�)
� Credit card Information ( type/brand, credit limit, number of credit cards, number of active/inactive,�)
� Payment behaviour information (number of times with 1,2,3,4 delays, total number of delays,�)
� Behaviour information:last purchase or cash advance date,
number/amount of transactions (national and foreign),number/amount of purchases (national and foreign),number/amount of cash advances (national and foreign)% of credit limit usage (Transactions amount/Credit limit)% of purchase usage ( Purchase Amount /Transactions amount)% of cash advance usage (Cash Advance Amount /Transactions amount)Monthly average Debt amount Average amount of Revolving ,�

Copyright © 2003, SAS Institute Inc. All rights reserved. 17
Phase 2: Variables
Customer Demographic information
� District code � Nationality � Customer type (emigrant, resident,�)� Marital status� Sex� Number of dependents� Residence status� Job situation� Age��
Relationship with the bank information
� Tenure at the bank� Default indicator on any other credit � Number of other products on bank � Average Balance � Net Indicator� Call Center Indicator
� Assets Amount� Liabilities Amount� Portfolio of equities (stocks) Amount��

Copyright © 2003, SAS Institute Inc. All rights reserved. 18
Project Methodology:
! Phase 1: Defining the scope
! Phase 2: Making data available (data mart)
! Phase 3: Evaluating the environment for modeling! Phase 4: Model development
! Phase 5: Model deployment
! Phase 6: Performance monitoring

Copyright © 2003, SAS Institute Inc. All rights reserved. 19
Phase 3: Evaluating the Environment for Modeling
Definitions:− Good/Bad Account definition
− Time Window
− Exclusions
− Countings
Copyright © 2003, SAS Institute Inc. All rights reserved. 20
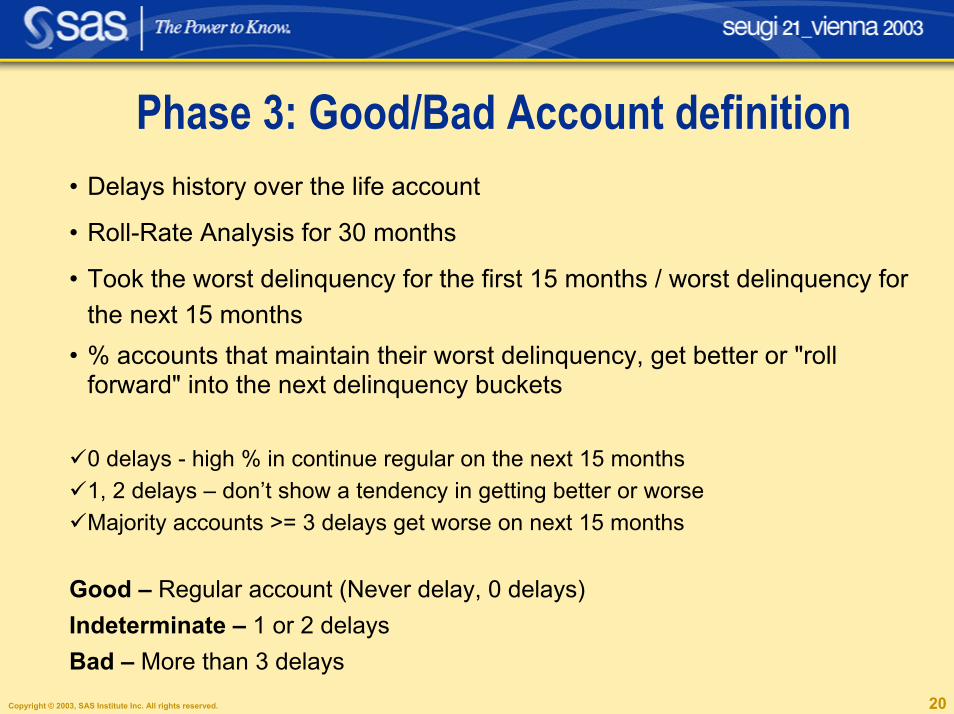
Phase 3: Good/Bad Account definition� Delays history over the life account
� Roll-Rate Analysis for 30 months
� Took the worst delinquency for the first 15 months / worst delinquency for the next 15 months
� % accounts that maintain their worst delinquency, get better or "roll forward" into the next delinquency buckets
"0 delays - high % in continue regular on the next 15 months"1, 2 delays � don�t show a tendency in getting better or worse"Majority accounts >= 3 delays get worse on next 15 months
Good � Regular account (Never delay, 0 delays)Indeterminate � 1 or 2 delays Bad � More than 3 delays

Copyright © 2003, SAS Institute Inc. All rights reserved. 21
Phase 3: Time Window
Observation Point
12 months
Behaviour Period
Jan 2001 � Dec 2001
Result Point
12 months
Results Period
Jan 2002 � Dec 2002

Copyright © 2003, SAS Institute Inc. All rights reserved. 22
Phase 3: ExclusionsSecure that� Only have individual credit cards
−not include corporate credit cards, non customers credit cards, internet credit cards, student university credit cards
� Life accounts on the considered time window
� Account cancellations on the behaviour period not included
� Write-offs not included
Result PointObservation Point
12 months
12 months
Behaviour Period
Jan 2001 � Dec 2001
Results Period
Jan 2002 � Dec 2002

Copyright © 2003, SAS Institute Inc. All rights reserved. 23
Phase 3: Countings
Good73%
Bad4%
Indeterminate13%
Inactive (1)10%
Candidates40%
TOTALACCOUNTS
100%
60%Exclusions
Bad Rate 5 %(1) Inactive � Accounts without transactions on the behaviour period (12 months)

Copyright © 2003, SAS Institute Inc. All rights reserved. 24
Project Methodology:
! Phase 1: Defining the scope
! Phase 2: Making data available (data mart)
! Phase 3: Evaluating the environment for modeling
! Phase 4: Model development! Phase 5: Model deployment
! Phase 6: Performance monitoring
Copyright © 2003, SAS Institute Inc. All rights reserved. 25
Phase 4: Modeling
� Finally using SAS/Enterprise Miner� Have a proportion of 5% bad and 95% good credit
accounts� Stratified (on target) Sampling of 30 000 accounts− Classing using Interactive Grouping Node (IGN) on this 30 000 accounts

Copyright © 2003, SAS Institute Inc. All rights reserved. 26
Phase 4: Classing using IGNThe process of automatically and/or interactively binning and grouping interval, nominal or ordinal input variables in order to
� manage the number of attributes per characteristic (variable)� improve the predictive power of the characteristic� select predictive characteristics� make the Weights Of Evidence vary smoothly or even linearly across the
attributes
WeightOfEvidence attribute= log(p_good attribute / p_bad attribute),where p_good attribute= #good attribute/ # good
p_bad attribute= # bad attribute/ # bad
The Information Value is a measure of the predictive power of a characteristic. It is used to
� judge the appropriateness of the classing � select predictive characteristics
The IV is similar to an entropy:IV= Σ ( (p_good attribute - p_bad attribute )*woe attribute )

Copyright © 2003, SAS Institute Inc. All rights reserved. 27
Phase 4: Example: Age
High RiskLow Risk

Copyright © 2003, SAS Institute Inc. All rights reserved. 28
Phase 4: Modeling � Used some variable selection:
� Variable selection node� Tree node� PROC VARCLUS
� Running some Logistic Regressions with the WoEvariables− Used Stepwise / Backward− Used only the greater IV variables− Used variables chosen by the results of the Variable Selection Node− Used variables chosen by the results of the Tree Node− Used variables chosen by the results of Proc Varclus− Used variables chosen between business considerations and statistical issues
log(p_bad/ p_good) =-log(p_good/p_bad) =-log(odds) = age_woe * b age +status_woe * b car +�+a

Copyright © 2003, SAS Institute Inc. All rights reserved. 29
Phase 4: Modeling � Have to choose the model
− Compare them on Assessment node, ROC curve
20% Worst
ponctuation, 70%
bad accounts
ROC Curve
0%
20%
40%
60%
80%
100%
0% 20% 40% 60% 80% 100%1-specificity
sens
itivi
ty
Modelo 2 - ROC=0.790 Modelo 1 - ROC=0.788
Copyright © 2003, SAS Institute Inc. All rights reserved. 30
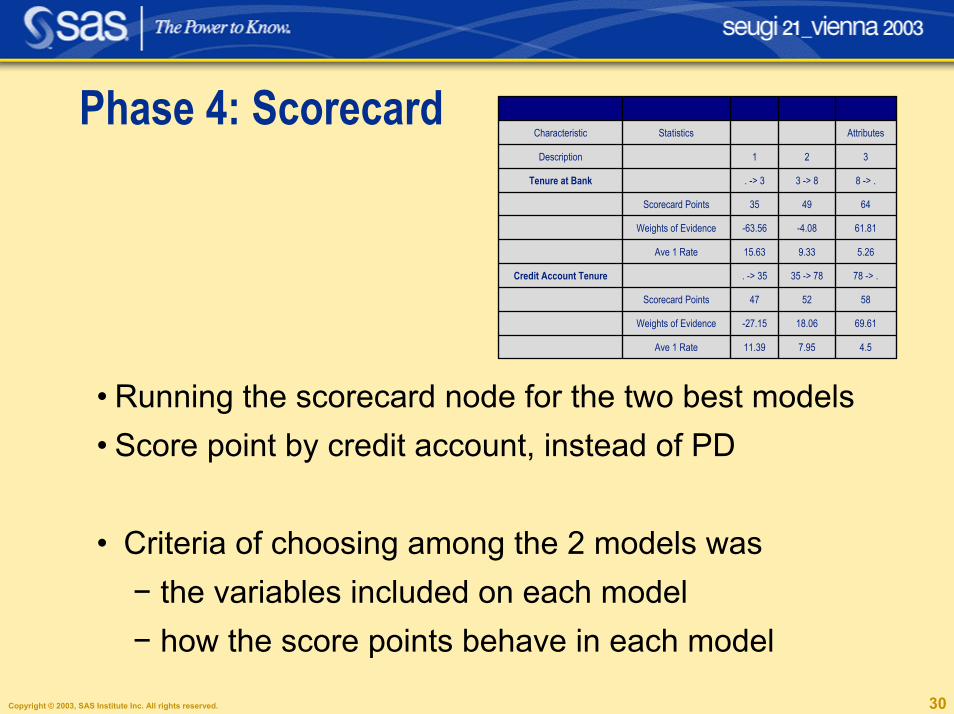
Phase 4: Scorecard
4.57.9511.39Ave 1 Rate
69.6118.06-27.15Weights of Evidence
585247Scorecard Points
78 -> .35 -> 78. -> 35Credit Account Tenure
5.269.3315.63Ave 1 Rate
61.81-4.08-63.56Weights of Evidence
644935Scorecard Points
8 -> .3 -> 8. -> 3Tenure at Bank
321Description
AttributesStatisticsCharacteristic
var3var2var1CB
� Running the scorecard node for the two best models� Score point by credit account, instead of PD
� Criteria of choosing among the 2 models was− the variables included on each model− how the score points behave in each model

Copyright © 2003, SAS Institute Inc. All rights reserved. 31
Phase 4: Results Tenure at the bank Average Balance<= 2 years .............................................. 35 <= 250 � .......................................... 353 - 7 years .............................................. 49 251 � - 500 � ................................... 538 - 10 years ............................................ 55 501 � - 1100 � ................................. 64>= 11 years ............................................ 64 1001 � - 2000 � ............................... 71
>= 2001 � ........................................ 75
Tenure Credit Account % of Cashadvance<= 24 months ......................................... 44 <= 10 .............................................. 6325 - 36 months ....................................... 49 11 - 20 ............................................ 5437 - 75 months ....................................... 53 21 - 66 ............................................ 49>= 76 months ......................................... 65 >= 67 .............................................. 38
........................ .............................

Copyright © 2003, SAS Institute Inc. All rights reserved. 32
Phase 4: Score points
An attribute�s points reflect� the risk of an attribute relative to the other attributes of the
same characteristic� the relative contribution of each characteristic to the
overall score
The relative risk of an attribute is determined by its �Weight of Evidence�.
The contribution of a characteristic is determined by its co-efficient in a logistic regression.

Copyright © 2003, SAS Institute Inc. All rights reserved. 33
Phase 4: Segmentation
Bad Poor Medium Good Excellent
Tenure at the bank < 2 years 2 - 5 years 5 - 7 years 7 - 10 years > 10 years
Tenure Credit Account < 24 months 24 - 40 months 40 - 43 months 43 - 50 months > 50 months
Delays Have Have Don't Have Don't Have Don't Have
Average Balance < 100 � 100 � - 200 � 200 � - 500 � 500 � - 1000 � > 1000 �
Nº Products on bank 1 2 - 3 4 - 5 6 - 7 > 7
% Credit limit usage > 83% 83% - 75% 74% - 40% 39% - 10% < 10%
Default Indicator on any other credit Have Have Have Don't Have Don't HaveAge < 20 years 20 - 25 years 25 - 30 years 30 - 38 years >38 years
Copyright © 2003, SAS Institute Inc. All rights reserved. 34
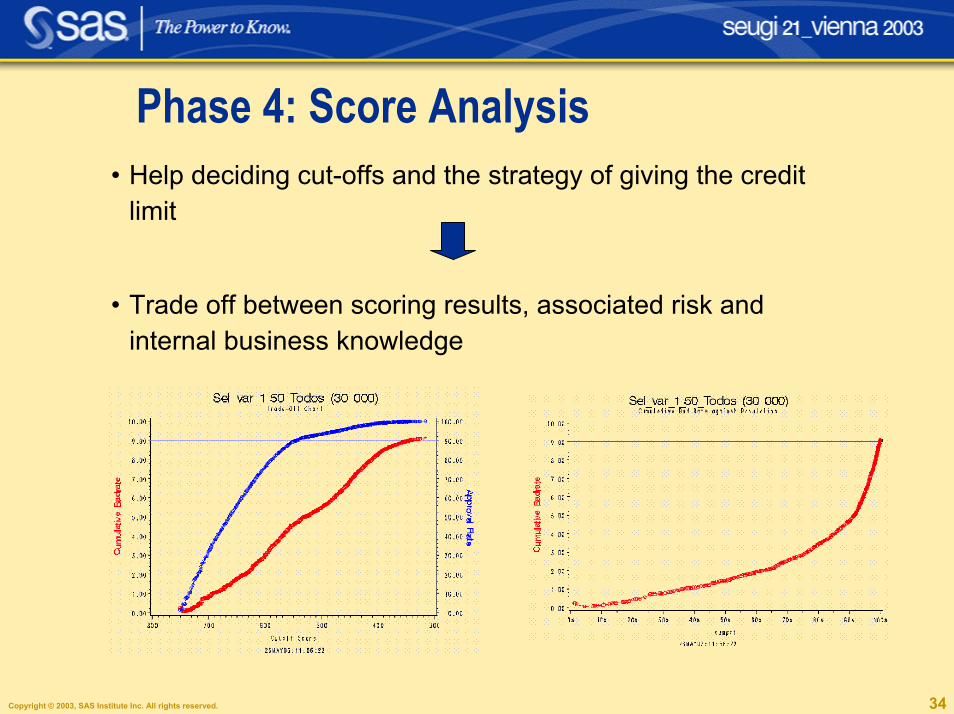
Phase 4: Score Analysis� Help deciding cut-offs and the strategy of giving the credit
limit
� Trade off between scoring results, associated risk and internal business knowledge

Copyright © 2003, SAS Institute Inc. All rights reserved. 35
Phase 4: ResultsScore Points < 100 100 - 200 200 - 400 400 - 500 >500
% Accounts 5% 10% 20% 20% 45%
Bad Rate 78% 45% 15% 4% 1%
� If accepted the credit accounts with a score points >= 400 we have an automatic decision of around 65% credit card accounts
� If we rejected the credit accounts with a score points <= 100 we have an automatic decision of around 5%
This leads to a 70% of automatic decision making coming out from the model on assigning a credit limit!

Copyright © 2003, SAS Institute Inc. All rights reserved. 36
Project Methodology:
! Phase 1: Defining the scope
! Phase 2: Making data available (data mart)
! Phase 3: Evaluating the environment for modeling
! Phase 4: Model development
! Phase 5: Model deployment! Phase 6: Performance monitoring

Copyright © 2003, SAS Institute Inc. All rights reserved. 37
Project Duration & Next Steps
! Project Duration:� Started November 2002
� Ended May 2003
! Next Steps � To develop an Web (AppDev) application for:� Phase 5: Model deployment − Scoring credit card accounts, give the appropriate
strategy/actions (Back Office)� Phase 6: Performance monitoring− Reporting for monitoring the model (Risk Department)

Copyright © 2003, SAS Institute Inc. All rights reserved. 38
Benefits� Be able to build scorecards faster, more accurately and for a
greater variety of purposes and segments
� Independence of outsourcing
� Full control of core activities
− Documented processes
− Ability to monitor scorecard performance
− Decision execution through a variety of web enable reports
� Full internal control (required condition for Basel II)� Improve credit decisions� Reduce credit loss� Increase company profits
�It�s an innovative project with excellent quality, the project time was fulfilled, we�ve got a great
model!�

Copyright © 2003, SAS Institute Inc. All rights reserved. 39
Contacts
� Project Manager � M. Helena Antunes ([email protected])
� CRM Analytics Specialist (Scorecard Implementation) �Helena Junqueiro ([email protected])
� Warehouse Consultant � Rui Martins ([email protected])
� Account Manager � Raquel Quaresma ([email protected])

Copyright © 2003, SAS Institute Inc. All rights reserved. 40Copyright © 2003, SAS Institute Inc. All rights reserved. 40