sas group year-end report january-december 2003 · sas group: year-end report january-december 2003...
TRANSCRIPT
SAS Group: Year-end report January-December 2003
SAS Group
Year-end reportJanuary-December 2003
The year in brief
• Operating revenue for the full year amounted to MSEK 57,754 (64,944), a decrease of 11.1%. Operating revenue for the fourth quarter amounted to MSEK 13,824 (16,709). For comparable units and adjusted for currency effects, operating revenue for the period decreased by 8.7% or MSEK 5,639 and by 11.7% in the fourth quarter.
• Income before depreciation and leasing costs for aircraft (EBITDAR) amounted to MSEK 3,761 (7,294) for the year. EBITDAR in the fourth quarter was MSEK 814 (1,332). Adjusted for restructuring costs and nonrecurring costs, EBITDAR was MSEK 4,269 (7,261) for the full year and MSEK 1,167 (1,243) for the fourth quarter.
• Income before capital gains and nonrecurring items amounted to MSEK–2,221 (-736) for the period. This negative result is mainly attributable to the first quarter. Income for the fourth quarter was MSEK -415 (-647).
• Income before tax amounted to MSEK –1,470 (-450) and MSEK -245 (-683) for the fourth quarter.
• Income after tax amounted to MSEK –1,415 (-132) and MSEK -581 (-284) for the fourth quarter.
• CFROI for 2003 was 7% (13%).
• Earnings per share for the SAS Group amounted to SEK –8.60 (-0.81) for the full year and SEK –3.53 (-1.73) for the fourth quarter. Equity per share was SEK 79.84 (92.33).
• Currency-adjusted unit cost for Scandinavian Airlines decreased by 19% in the fourth quarter.
• The SAS Group’s restructuring costs for 2003 amounted to MSEK 496 and mainly relate to a provision for payroll expenses for 2004 for employees with non-working notice. Write-downs of MSEK 82 were made during the year.
• The Board of Directors proposes to the Annual General Meeting that no dividend be paid to SAS AB’s shareholders for the 2003 fiscal year.
• The SAS Group's board and management's primary aim is to ensure that the SAS Group attains positive earnings before tax , capital gains and nonrecurring items for the full-year 2004.
SAS Group January-March April-June July-September October-December January-December (MSEK) 2003 2002 2003 2002 2003 2002 2003 2002 2003 2002Operating revenue 13,710 13,775 15,300 17,868 14,920 16,592 13,824 16,709 57,754 64,944EBITDAR -398 584 1,608 3,248 1,737 2,130 814 1,332 3,761 7,294EBITDAR margin -2.9% 4.2% 10.5% 18.2% 11.6% 12.8% 5.9% 8.0% 6.5% 11.2%EBIT -1,908 -1,406 272 1,354 798 1,041 -43 -307 -881 682EBIT margin -13.9% -10.2% 1.8% 7.6% 5.3% 6.3% -0.3% -1.8% -1.5% 1.1%Income before capital gains and nonrecurring items -1,909 -1,310 -13 1,171 116 50 -415 -647 -2,221 -736EBT -1,876 -1,446 87 1,039 564 640 -245 -683 -1,470 -450Income after tax -1,599 -1,322 66 968 699 506 -5811 -284 -1,415 -132Earnings per share (SEK) -9.72 -8.17 0.40 5.90 4.25 3.08 -3.53 -1.73 -8.60 -0.81
Cash flow before financing activities -2,360 -1,202 1,123 -878 175 44 917 310 -145 -1,726 Number of passengers 6,987 7,612 8,204 8,941 8,301 8,784 7,512 7,922 31,004 33,254RPK 6,551 6,838 7,840 8,147 8,668 8,590 7,344 7,308 30,402 30 882ASK 11,169 11,217 12,258 12,023 12,524 12,240 11,931 11,689 47,881 47,169Cabin factor 58.7% 61.0% 64.0% 67.8% 69.2% 70.2% 61.6% 62.5% 63.5% 65.5%
1 The SAS Group's increased tax expense for the fourth quarter is mainly due to property transactions during the quarter.
SAS AB is the Nordic region’s largest listed airline and travel group and the fourth-largest airline group in Europe, in terms of number of passengers andoperating revenue. The SAS Group offers air transport and related services from its base in northern Europe. Scandinavian Airlines provides serviceswithin Scandinavia, and to/from Europe, North America and Asia. Scandinavian Airlines is a founder member of the world’s largest global airline alliance– Star AllianceTM. The Group also includes the airlines Spanair, Braathens, Widerøe’s Flyveselskap and Blue1 and the partly-owned airlines airBaltic andEstonian Air. The Group’s business areas Airline Support Businesses and Airline Related Businesses include companies that support the airlineoperations. The Group also includes hotel operations with Rezidor SAS Hospitality.
The SAS Group’s Annual Report will be published on March 10, 2004 www.sasgroup.net
SAS Group: Year-end report January-December 2003
2
Important events
First quarter 2003 • Sören Belin took over as Chief Operating Officer, COO, of Scandinavian Airlines. • New restructuring measures introduced to ensure long-term profitability and competitiveness. • Spanair launched a new fare concept for Spanish domestic flights in March. • Scandinavian Airlines’ new low-fare concept snowflake was launched.
Second quarter 2003 • Spanair became a member of Star Alliance on April 1. • The Board gave the SAS Group’s management a mandate to carry out additional cost reductions of
approximately SEK 9 billion. Measures amount to a total of SEK 14 billion. • Scandinavian Airlines announced a major reorganization as part of the implementation of the new cost-
cutting measures. • SAS Technical Services locates its main facility for base maintenance in Stockholm, while heavy
maintenance remains in Oslo. • The SAS Group was downgraded by credit rating agency Moody's to Ba3.
Third quarter 2003 • Agreements reached allowing for a 40% increase in productivity for pilots and cabin crew as well as
productivity improvements in operations. • The SAS Group became affiliated with the guidelines of the UN Global Compact which covers issues
relating to the environment, workforce and human rights in society and at the workplace. • The SAS Group announced that parts of Revenue Accounting will be relocated to India. • The SAS Group acquired 49% of the shares in Estonian Air for MSEK 176. • The SAS Group’s airlines Scandinavian Airlines, Braathens and Widerøe announced fare reductions of 20-
30% within Scandinavia and the introduction of more flexible ticket rules. • In a judgment passed by the High Court of Eastern Denmark, SAS was not regarded as breaching any
agreements with travel agencies with the introduction of the new net price model. The plaintiff has appealed against this decision.
• Air Botnia changed its name to Blue1, and is the fastest-growing airline in Finland. • The SAS Group announced that five office properties in Copenhagen had been sold for MSEK 997and
leased back. The capital gain amounted to MSEK 553.
Fourth quarter 2003 • Asker and Bærum District Court, Norway, ruled that SAS had not contravened operation transfer rules in
connection with the outsourcing of Braathens Ground Handling to Scandinavian Ground Services. The plaintiff has decided to lodge an appeal against parts of this ruling.
• Scandinavian Airlines introduced a new reservations dialog for leisure travel on its website with greater price transparency and simpler reservation procedures.
• The SAS Group’s 2002 Annual Report was ranked best environmental report by Deloitte & Touche. • Scandinavian Airlines chosen as best European airline by Danish Travel Award. • The properties at the head office in Frösundavik were sold to Nordisk Renting and leased back, providing
a capital gain of MSEK 688. The transaction releases capital of just over MSEK 1,100. • The SAS Group raised its holding in Spanair to 94.9%. This transaction was effected in January 2004. • Braathens increased its measures within Turnaround 2005 to MSEK 1,000 in order to achieve a unit cost
of NOK 0.60 per ASK in 2006. • A new loan facility of MEUR 400 was raised. • Scandinavian IT Group was sold to Computer Sciences Corporation (CSC). The legal transaction was
carried out as planned in January 2004. • As of December 29, intra-group transfers were made of a number of subsidiaries from the SAS
Consortium to SAS AB.
Events after January 1, 2004 • A strategic decision was made to investigate incorporation of SAS Ground Services and SAS Technical
Services. • As part of Turnaround 2005, the SAS Group initiated negotiations with the trade unions on salaries,
benefits and pensions for 2004. • The Swedish Transport Workers Union called its members out on strike which led to canceled flights for
the SAS Group in Sweden. The strike was called off on February 4, 2004. • The SAS Group's board made a strategic decision to integrate the Norwegian flight operations of
Braathens and Scandinavian Airlines to form a single unit in Norway. The decision is pending new collective agreements.
SAS Group: Year-end report January-December 2003
3
Dear shareholder,
So far, every year of the 21st century has been characterized by major changes in the airline industry, with a stream of new players, changed travel patterns and greater cost awareness among customers. This has occurred at a time of a generally weak global economy and external events such as SARS and the war in Iraq. Uncertainty in the business environment and the global economy have reduced demand for air travel. Despite some stabilization towards the end of 2003, no upturn was noted in Scandinavian or European traffic. On the other hand, intercontinental traffic rose sharply in the second half of 2003. For the SAS Group, however, intercontinental traffic accounts for a smaller proportion of revenues than for the other network operators. The SAS Group’s income before capital gains and nonrecurring items for the full year of SEK 2.2 billion reflect to a great extent the figures from the disastrous first quarter. The third quarter, like the fourth, saw some stabilization but could not compensate for the losses from the spring. It is worth noting, however, that while revenues for the SAS Group were more than SEK 7 billion lower than in 2002, the decline in earnings compared with the previous year could be limited to SEK 1.5 billion. The main reason for the lower revenues is that yield was considerably lower than in 2002 for all our airlines. This was mainly due to reduced fares, a shift from Business Class to Economy Class and increased competition. At the same time, the Turnaround 2005 restructuring program and general restraint within the company had an impact in the form of lower unit costs in our airlines, with the currency adjusted unit cost for Scandinavian Airlines falling by a full 19% in the final quarter. The year was marked by efforts to ensure long-term competitiveness and profitability for the Group. These measures, Turnaround 2005, amount to SEK 14 billion and a final decision is still to be made on approximately SEK 2 billion. This will be done in the first quarter of this year and mainly concerns changes in compensation, including remuneration and pensions, as well as choice of service level and concept for our traffic flows. In the present climate of extremely tough competition in the airline industry, new challengers are appearing increasingly often, in particular in the SAS Group’s traditional home markets in Scandinavia. The high availability of employees and aircraft in the market, means that the threshold for new players to become established is low. We are meeting this challenge through Turnaround 2005. This restructuring will radically simplify the way the various airlines work and create cost-effective production platforms. In order to further enhance efficiency, work has
started to create a more appropriate legal group structure through intra-group transfers of subsidiaries to SAS AB and incorporation of some businesses in the SAS Consortium. In Norway, the best business solution is to integrate Braathens and Scandinavian Airlines into a single unit and this process is now being expedited. The SAS Group is one of the major players within aviation in Europe. During 2003 a total of 31 million passengers traveled with the Group’s various companies, making the SAS Group the fourth-largest airline group in Europe. In line with the SAS Group’s overriding business concept, to provide northern Europe with air transport, we continue to have a strong position in the region despite intensified competition. The Group has strengthened its position in the Baltic region through acquisition of a minority holding in Estonian Air, ownership of airBaltic and the reprofiling of the Finnish company to Blue1. In order to focus on the core business, we carried out a number of divestments. In December, the transfer of Scandinavian IT Group (SIG) to the U.S. company CSC was confirmed, with major opportunities for a dynamic development of this unit. The properties in Stockholm and Copenhagen were sold during the autumn. All employees are affected by the SAS Group’s Turnaround 2005, the most extensive restructuring in the company’s history. In dialog with the employee groups we are informing all employees about how essential these measures are, and we assume that the trade unions will support the course chosen by the company’s management and board. No conflicts will change this fact. We expect continued challenges in 2004, despite an improved economic outlook and increased travel. Customers are demanding more travel alternatives, lower fares and also more effective travel. Our task is to meet their demands and we will do this with vigorous market efforts. We are therefore also launching a commercial Turnaround. For the full-year 2004, management's and the board's primary ambition is to attain positive earnings, and to take the necessary decisions for this to be achieved. We will reach our goal through strong measures designed to cut costs rather than through more favorable business conditions. Continued falling yields must be offset by reduced unit costs. Cost efficiency at all levels will be the guiding principle for the SAS Group even beyond Turnaround 2005.
SAS Group: Year-end report January-December 2003
4
SAS Group’s traffic development
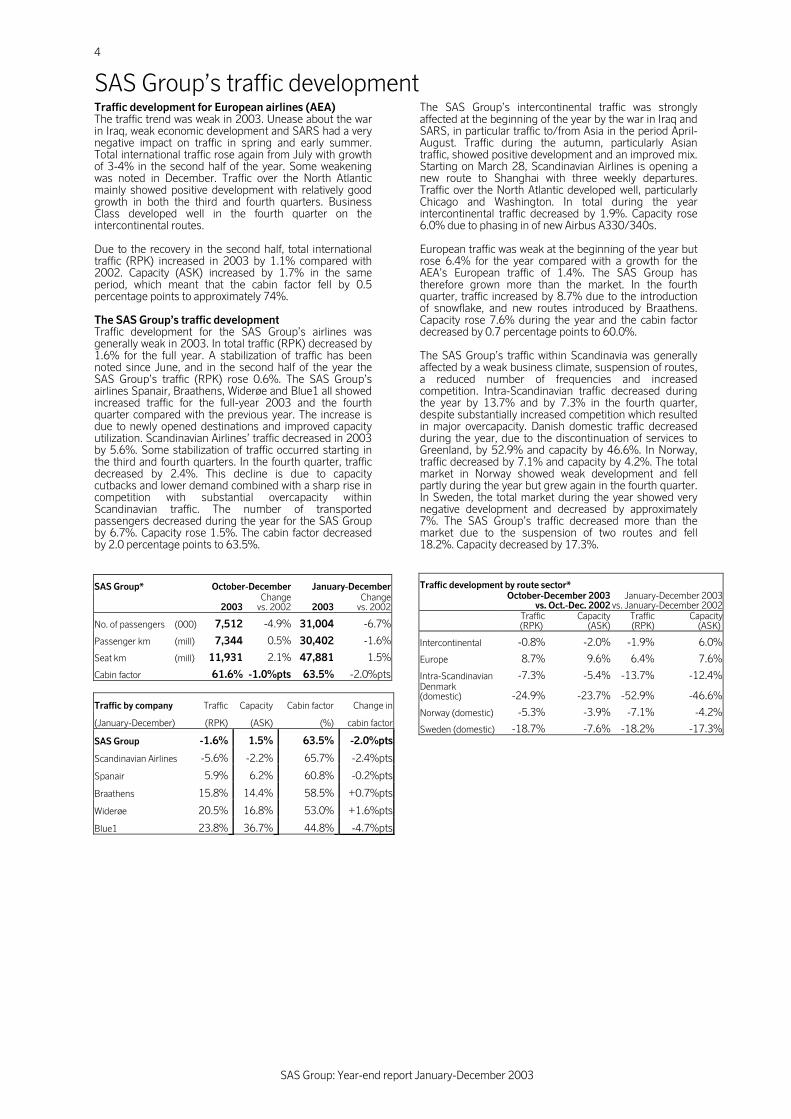
Traffic development for European airlines (AEA) The traffic trend was weak in 2003. Unease about the war in Iraq, weak economic development and SARS had a very negative impact on traffic in spring and early summer. Total international traffic rose again from July with growth of 3-4% in the second half of the year. Some weakening was noted in December. Traffic over the North Atlantic mainly showed positive development with relatively good growth in both the third and fourth quarters. Business Class developed well in the fourth quarter on the intercontinental routes. Due to the recovery in the second half, total international traffic (RPK) increased in 2003 by 1.1% compared with 2002. Capacity (ASK) increased by 1.7% in the same period, which meant that the cabin factor fell by 0.5 percentage points to approximately 74%. The SAS Group’s traffic development Traffic development for the SAS Group’s airlines was generally weak in 2003. In total traffic (RPK) decreased by 1.6% for the full year. A stabilization of traffic has been noted since June, and in the second half of the year the SAS Group’s traffic (RPK) rose 0.6%. The SAS Group’s airlines Spanair, Braathens, Widerøe and Blue1 all showed increased traffic for the full-year 2003 and the fourth quarter compared with the previous year. The increase is due to newly opened destinations and improved capacity utilization. Scandinavian Airlines’ traffic decreased in 2003 by 5.6%. Some stabilization of traffic occurred starting in the third and fourth quarters. In the fourth quarter, traffic decreased by 2.4%. This decline is due to capacity cutbacks and lower demand combined with a sharp rise in competition with substantial overcapacity within Scandinavian traffic. The number of transported passengers decreased during the year for the SAS Group by 6.7%. Capacity rose 1.5%. The cabin factor decreased by 2.0 percentage points to 63.5%.
SAS Group* October-December January-December
2003Change
vs. 2002 2003Change
vs. 2002
No. of passengers (000) 7,512 -4.9% 31,004 -6.7%
Passenger km (mill) 7,344 0.5% 30,402 -1.6%
Seat km (mill) 11,931 2.1% 47,881 1.5%
Cabin factor 61.6% -1.0%pts 63.5% -2.0%pts
Traffic by company Traffic Capacity Cabin factor Change in
(January-December) (RPK) (ASK) (%) cabin factor
SAS Group -1.6% 1.5% 63.5% -2.0%pts
Scandinavian Airlines -5.6% -2.2% 65.7% -2.4%pts
Spanair 5.9% 6.2% 60.8% -0.2%pts
Braathens 15.8% 14.4% 58.5% +0.7%pts
Widerøe 20.5% 16.8% 53.0% +1.6%pts
Blue1 23.8% 36.7% 44.8% -4.7%pts
The SAS Group’s intercontinental traffic was strongly affected at the beginning of the year by the war in Iraq and SARS, in particular traffic to/from Asia in the period April-August. Traffic during the autumn, particularly Asian traffic, showed positive development and an improved mix. Starting on March 28, Scandinavian Airlines is opening a new route to Shanghai with three weekly departures. Traffic over the North Atlantic developed well, particularly Chicago and Washington. In total during the year intercontinental traffic decreased by 1.9%. Capacity rose 6.0% due to phasing in of new Airbus A330/340s. European traffic was weak at the beginning of the year but rose 6.4% for the year compared with a growth for the AEA’s European traffic of 1.4%. The SAS Group has therefore grown more than the market. In the fourth quarter, traffic increased by 8.7% due to the introduction of snowflake, and new routes introduced by Braathens. Capacity rose 7.6% during the year and the cabin factor decreased by 0.7 percentage points to 60.0%. The SAS Group’s traffic within Scandinavia was generally affected by a weak business climate, suspension of routes, a reduced number of frequencies and increased competition. Intra-Scandinavian traffic decreased during the year by 13.7% and by 7.3% in the fourth quarter, despite substantially increased competition which resulted in major overcapacity. Danish domestic traffic decreased during the year, due to the discontinuation of services to Greenland, by 52.9% and capacity by 46.6%. In Norway, traffic decreased by 7.1% and capacity by 4.2%. The total market in Norway showed weak development and fell partly during the year but grew again in the fourth quarter. In Sweden, the total market during the year showed very negative development and decreased by approximately 7%. The SAS Group’s traffic decreased more than the market due to the suspension of two routes and fell 18.2%. Capacity decreased by 17.3%.
Traffic development by route sector*
October-December 2003
vs. Oct.-Dec. 2002 January-December 2003
vs. January-December 2002
Traffic (RPK)
Capacity (ASK)
Traffic(RPK)
Capacity(ASK)
Intercontinental -0.8% -2.0% -1.9% 6.0%
Europe 8.7% 9.6% 6.4% 7.6%
Intra-Scandinavian -7.3% -5.4% -13.7% -12.4%Denmark (domestic) -24.9% -23.7% -52.9% -46.6%
Norway (domestic) -5.3% -3.9% -7.1% -4.2%
Sweden (domestic) -18.7% -7.6% -18.2% -17.3%
SAS Group: Year-end report January-December 2003
5
Financial development The beginning of 2003 was very weak due to the war in Iraq and the SARS epidemic. Weak economic development and reduced traffic volumes, combined with lower yields, led to very negative earnings in the first four months. The SAS Group’s total operating revenue decreased in 2003 by MSEK 7,190. Effects from cost-cutting measures within Turnaround 2005 and a stabilization of traffic from June, led to earnings close to breakeven from May to December. Income before capital gains and nonrecurring items for 2003 was MSEK –2,221 (-736). Acquisitions and sales 36.1% of the shares in Aerolineas de Baleares, a production company to Spanair S.A., were acquired at the beginning of 2003. The Group’s holding then amounted to 74% and the company was consolidated as a subsidiary with effect from January 1, 2003. The purchase price was MEUR 4. Goodwill at acquisition was estimated at MEUR 1.8 or MSEK 16. 49% of AS Estonian Air and 100% of Maersk Air Maintenance Estonia AS were acquired in September. The total purchase price was MSEK 204 and goodwill amounted to MSEK 155 at acquisition. In order to release capital and create greater flexibility for office premises, the office properties in Copenhagen were sold in September for MSEK 997. The capital gain was MSEK 553. In addition, the office property at Frösundavik, Stockholm, was sold in December for MSEK 1,125 with a capital gain of MSEK 688 MSEK. Both in Copenhagen and in Stockholm, the properties were leased back for 10-20 years. An agreement on the sale of Scandinavian IT Group was signed on December 18. At the same time an outsourcing agreement was concluded with a five-year term which can be extended. The sales price for the shares was MSEK 480, of which MSEK 245 was paid on February 4, 2004, and the remaining MSEK 235 will be paid in one year. The capital loss was MSEK 33. Operating assets in Rampsnake A/S were sold in December. The purchase price was MUSD 5 and no capital gain has been reported. In December, Rezidor SAS Hospitality signed an agreement for the sale of a hotel property at Stansted Airport outside London. The sales proceeds equal the book value. January-December 2003 The SAS Group’s statement of income for January-December 2002 included Spanair from March 1 and SMART until August 31 when the company was sold. The 2003 figures include the Spanair-related companies Aerolineas de Baleares, which was consolidated as a subsidiary from January 1, 2003, and the handling company Newco, consolidated as a subsidiary from December 2002. In addition, AS Estonian Air and Maersk Air Maintenance Estonia AS were consolidated as an affiliated company and subsidiary, respectively from October 1, 2003. To allow comparisons with 2002, adjustments are made under non-comparable units. The net effect of exchange rate fluctuations between January-December 2002 and 2003 was MSEK 1,108. The effect was MSEK -2,700 on operating revenue, MSEK 3,526 on operating expenses, of which MSEK 1,624 reflects a weaker USD, and MSEK 282 on net financial items. The positive currency effect of SEK of MSEK 1,108 was mainly offset by price increases for jet fuel and higher security costs. The SAS Group’s operating revenue amounted to MSEK 57,754 (64,944), a decrease of MSEK 7,190 or 11.1%.
Adjusted for non-comparable units, MSEK 1,149, currency effects, MSEK -2,700, and revenue from the Swedish Civil Aviation Administration (Terminal 2) of MSEK 570 in the previous year, the Group’s operating revenue fell by 7.8%. Scandinavian Airlines’ passenger traffic measured in RPK, revenue passenger kilometers, decreased by 6% compared with 2002. Yield decreased, adjusted for currency effects, by 13%. Restructuring costs attributable to Turnaround 2005, charged to income for the year but mainly relating to 2004, amounted to MSEK 496 for the entire Group. Of this, MSEK 485 relates to non-working notice periods covering about 1,100 people. The remaining MSEK 11 comprises costs for unutilized rented premises and other costs in connection with redundancies. Payroll expenses decreased by MSEK 425, or 1.9% and amounted to MSEK 21,927 (22,352). Adjusted for non-comparable units, restructuring costs and currency effects, payroll expenses were MSEK 21,799 or 0.1% lower than in the previous year. The lower payroll expenses due to the reduced number of employees were largely offset by payroll expense increases between the years (a salary freeze agreement from April 1, 2003) and higher pension costs. In 2002, MSEK 241 was reported for training and depreciation costs related to phasing in and phasing out of the aircraft fleet as a capital loss. The number of employees in the SAS Group decreased by 2.7%. In comparable units, the number of employees decreased by 4.2%. The Group’s pension costs increased by MSEK 360 compared with the previous year. The reason is a lower return on funded assets due to a reduction in funded assets in 2002 as a result of negative performance on the capital market. At the end of 2002, the negative estimate deviations had therefore also risen, which led to larger amortization in 2003. Due to the decline in interest rates in recent years, in 2003 all the Group’s long-term parameters for pension increases were revalued together with a change in amortization periods for deviations from estimates. Compared with parameters used in 2002, however, the effect on 2003 earnings is neutral. The Group’s other operating expenses decreased by MSEK 3,232 or 9.2% to MSEK 32,066. Adjusted for non-comparable units and currency effects, expenses decreased by 5%. Other operating expenses include the Group’s jet fuel costs which amounted to MSEK 4,743 (4,938), of which Scandinavian Airlines accounts for MSEK 2,894 (3,184) and other airlines for MSEK 1,849 (1,754). The price effect on jet fuel, including the result of hedging, was approximately MSEK 700 higher than in the previous year. Due to a lower U.S. dollar rate and a lower consumed volume, however, the total fuel cost was lower than in 2002. Operating income before depreciation and leasing costs, EBITDAR, was MSEK 3,761 (7,294). Adjusted for nonrecurring costs and restructuring costs, EBITDAR for the full year was MSEK 4,269 (7,261). The effects from Turnaround 2005 during 2003 amounted to MSEK 3,600. Leasing costs, adjusted for currency effects, were MSEK 247 lower than in the previous year. Depreciation increased by MSEK 93, mainly due to new investments. Share of income in affiliated companies totaled MSEK 39 (-409). Spanair was reported as an affiliated company through February 2002. Share of income amounted to MSEK -300 and comprised the period November 1, 2001 – February 28, 2002. Excluding Spanair, share of income amounted to MSEK -109 for the full-year 2002. The main reason for the change is British Midland where share of income amounted to MSEK -52 (-95), Skyways MSEK 4 (-21), Polygon MSEK 0 (-21), and a write-down of Cimber Air was charged against 2002 earnings of MSEK 91.
SAS Group: Year-end report January-December 2003
6
Income before capital gains amounted to MSEK –2,799 (-951). Taking nonrecurring items into account, MSEK -578 (-215) comprising restructuring costs MSEK -496, a write-down of shares in Expo Investments Partnership MSEK –30, as well as a write-down of shares, receivables and an intangible asset related to Travellink MSEK –52, income before capital gains was MSEK –2,221 (-736). Income from the sale of shares in subsidiaries and affiliated companies, MSEK 651 (817), includes the sale of Fastighets AB Solna Haga, the Frösundavik head office, MSEK 688, and Scandinavian IT Group MSEK –33. In 2002, SMART was sold with a capital gain of MSEK 811. The Group’s income from the sale of aircraft and buildings amounted to MSEK 649 (-320) during the year. This includes the sale of three Douglas MD-80s and four Fokker F28s as well as the sale and leaseback of two Boeing 737s, eight deHavilland Q400s and four Airbus A320s with a total of MSEK 212. Income from the sale of aircraft in the previous year included phasing in and phasing out costs in connection with replacement of the aircraft fleet of MSEK 574. Income from the sale of buildings amounted to MSEK 437 (-10). In September, office premises in Copenhagen were sold with a capital gain of MSEK 553. Other property transactions generated MSEK -116. Income from other shares and participations, MSEK -1 (–180) comprises a write-down to zero of the Group’s participation in Expo Investments Partnership which holds 10% of the shares in Air Canada with MSEK 30. In addition, the sale of the Group’s participations in Copenhagen International Hotels K/S provided a gain of MSEK 15 and other shares and participations MSEK 14. The Group’s net financial items amounted to MSEK -588 (-952). Net interest was MSEK -822 (-882). The currency effect was MSEK 318 (36). Other net financial expenses amounted to MSEK -84 (-106). Income before tax amounted to MSEK –1,470 (–450). The change in income before tax is due to: Currency effect 1,108 Income before depreciation and leasing costs, EBITDAR -3,782 Leasing costs and depreciation 154 Share of income in affiliated companies 438 Net interest 82 Capital gains and write-downs 980 Total changes -1,020 Fourth quarter 2003 A continued negative yield trend had a negative impact on revenues for the fourth quarter. Positive effects from the Turnaround program partly compensated for the loss of revenue. The Group’s operating revenue amounted to MSEK 13,824 (16,709), a decline of MSEK 2,885 or 17.3%. Adjusted for currency effects, MSEK -1,055, and operating revenue in comparable units, operating revenue fell 11.7%. The Group’s passenger traffic increased by 0.5%. In Scandinavian Airlines, traffic decreased by 2.4%. A recovery in traffic on international routes was noted in the fourth quarter as well, while lower demand, intensified competition, overcapacity on the intra-Scandinavian routes and weak Swedish domestic traffic contributed to the decline in Scandinavian Airlines.
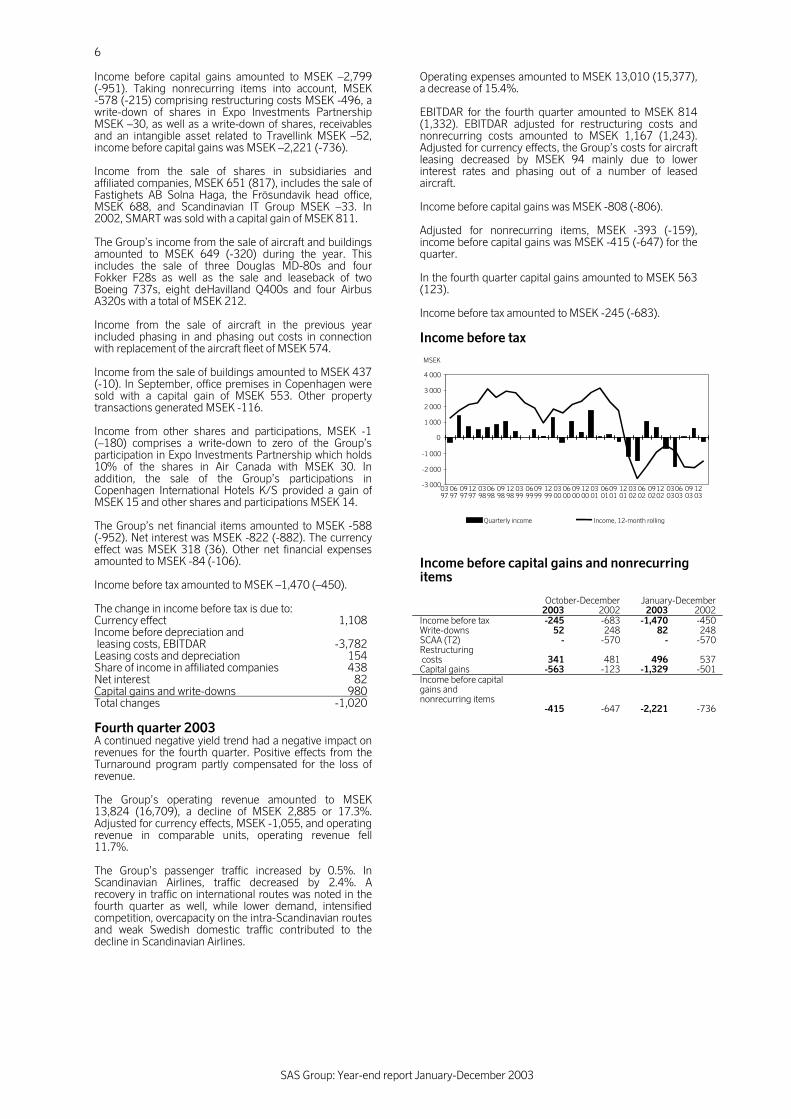
Operating expenses amounted to MSEK 13,010 (15,377), a decrease of 15.4%. EBITDAR for the fourth quarter amounted to MSEK 814 (1,332). EBITDAR adjusted for restructuring costs and nonrecurring costs amounted to MSEK 1,167 (1,243). Adjusted for currency effects, the Group’s costs for aircraft leasing decreased by MSEK 94 mainly due to lower interest rates and phasing out of a number of leased aircraft. Income before capital gains was MSEK -808 (-806). Adjusted for nonrecurring items, MSEK -393 (-159), income before capital gains was MSEK -415 (-647) for the quarter. In the fourth quarter capital gains amounted to MSEK 563 (123). Income before tax amounted to MSEK -245 (-683). Income before tax Income before capital gains and nonrecurring items October-December January-December 2003 2002 2003 2002 Income before tax -245 -683 -1,470 -450 Write-downs 52 248 82 248 SCAA (T2) - -570 - -570 Restructuring costs
341
481
496
537
Capital gains -563 -123 -1,329 -501 Income before capital gains and nonrecurring items
-415
-647
-2,221
-736
-3 000
-2 000
-1 000
0
1 000
2 000
3 000
4 000
0397
0697
0997
1297
0398
0698
0998
1298
0399
0699
0999
1299
0300 06
00 0900 12
00 0301 06
01 0901 12
01 0302 06
02 0902
1202
0303
0603
0903
1203
MSEK
Quarterly income Income, 12-month rolling
SAS Group: Year-end report January-December 2003
7
SAS Group’s Turnaround 2005 The SAS Group is carrying out restructuring measures with total cost savings of SEK 14 billion. The goal of the structural earnings improvement measures is to achieve long-term profitability and competitive overhead and productivity levels within all the Group’s airlines in 2005. The SAS Group’s has analyzed the Group’s markets, traffic flows and competitive situation and set requirements for effective flight operations. The purpose of Turnaround 2005 is to ensure the SAS Group’s long-term competitiveness and profitability. These measures will simplify and enhance the efficiency of the airlines’ working methods. SAS Group’s cost reductions in Turnaround 2005 (SEK billion) Total Overhead functions (Group & Scandinavian Airlines) 2.1 Scandinavian Airlines Production concept 2.8 Inflight 0.7 Distribution and sales 1.5 Airline Support Businesses Scandinavian Ground Handling 1.0 SAS Technical Services 1.6 Subsidiary Airlines & Hotels 2.8 Total 12.5 The target for Turnaround 2005 is SEK 14 billion. As of December 2003, measures for SEK 12.5 billion had been decided and verified. The remaining approximately SEK 2 billion required to reach the target is mainly within salaries, benefits and pensions, etc., as well as choice of business model (e.g. service level) including the form of distribution the SAS Group uses for different traffic flows. Effects from decided cost-cutting measures are expected as follows (SEK billion): Earnings impact (Dec.)Earnings impact (Sep.)* 2004 5.5 3.5 2005 3.1 5.0 2006 0.3 1.0 *Communicated in the previous interim report.
Follow- up of Turnaround 2005 Follow-up of Turnaround 2005 is based on four criteria: integration in internal budgets and business plans, operational key figures, full-time equivalents (FTEs), and completed activities. At year-end 2003, activities corresponding to 54% of the financial effect of measures decided had been completed compared with a planned 50%. The total earnings impact of the measures within Turnaround 2005 during 2003 amounted to approximately SEK 3.6 billion. Overhead functions (Group & Scandinavian Airlines) Measures comprise extensive efficiency enhancement and rationalization within the overhead functions of the Group and Scandinavian Airlines in Stockholm, Copenhagen and Oslo. A large part of these reductions have been achieved due to Scandinavian Airlines’ changed base distribution, and general efficiency enhancements. In 2003 a decision was made to relocate parts of Revenue Information (ticket settlement) to India which will provide annual savings of approximately MSEK 85 from May 2004. A total of 800 FTEs were phased out in 2003. In 2004, it is planned to phase out a further 400 FTEs as a result among other things of full implementation of the new base organization. Approximately 500 ground services will be phased out in 2005. In total, measures within overhead functions amount to SEK 2.1 billion, of which approximately MSEK 800 relates to non-employee costs for consultants, IT, etc.
Scandinavian Airlines A new traffic program, the base distribution and changed collective agreements provide opportunities for significant efficiency gains within Scandinavian Airlines. Aircraft utilization is expected to increased from 7.4 block hours/day in 2003 to approximately 8.0 block hours/day for jet and turboprop production (2004). The changed collective agreements with pilots and cabin crew allow an increase in productivity of approximately 40% to 700-750 hours from 470 and 530 block hours respectively in 2003. Within distribution and sales the call center structure is being simplified and the number of call centers reduced. In Sweden and Denmark new agreements were concluded in January 2004 which provide a salary reduction for sales staff against retention of call center operations in Scandinavia. Internet sales and the proportion of electronic tickets will increase considerably. The goal is to increase the proportion of tickets sold via the Internet to 40%. The sale of Scandinavian IT Group allows additional IT savings to be realized. Airline Support Businesses At SAS Ground Services some of the savings will come from less traffic peaks over the traffic day following the introduction of Scandinavian Airlines’ traffic system, greater automation at check-in, and generally improved efficiency within passenger service. The aim includes increasing the total proportion of self-service check-in to 60% by 2005 among Scandinavian Airlines’ customers. Cost flexibility will be increased by purchasing services to meet volume changes, renegotiating agreements with external handling suppliers, simplifying all operations at the three base stations, reorganizing staff functions, exposing operation and administration of computer systems to competition, and renegotiating collective agreements. IT savings can be achieved due to the sale of Scandinavian IT Group. The measures within SAS Ground Services amount to SEK 1 billion. Since August 2003, Scandinavian Airlines’ pilots have performed the PFI (Pre Flight Inspection) and in 2003 a new operational schedule for technical maintenance was introduced. The full effect of this reorganization is expected to be achieved in spring 2004. SAS Technical Services (STS) established a new organizational structure in 2003. The main base has been located at Stockholm-Arlanda which will centralize Base Maintenance (medium-heavy aircraft maintenance) and overhead/support functions which will be fully implemented by the end of 2004. A central store for materials and spare parts was introduced in the first quarter of 2004, which will gradually release capital. Efficiency was further improved through new collective agreements on unpaid meal breaks, changes in shift planning, etc. As a result of rationalization within STS, heavy maintenance of Scandinavian Airlines’ MD fleet can be made more efficient which means that from the second quarter of 2004 maintenance of the MD fleet will be carried out at Oslo Gardermoen instead of at Shannon, Ireland. STS is achieving total cost savings of SEK 1.6 billion. Subsidiary Airlines & Hotels Savings of over SEK 2.8 billion have been identified within Subsidiary Airlines and the Hotels business area which will have their full effect in 2005, including SEK 2.1 billion in 2004. Braathens will implement savings and productivity improvements amounting to approximately SEK 1.0 billion which means that Braathens will achieve a unit cost of approximately NOK 0.60 per ASK in 2006. Widerøe and Spanair will implement measures worth SEK 0.3 billion and SEK 1.1 billion respectively. Rezidor SAS Hospitality and Blue1 are both implementing efficiency enhancements of MSEK 150 each.
SAS Group: Year-end report January-December 2003
8
Reduction of full-time positions Within Turnaround 2005 redundancies totaling 6,000 full-time positions have been identified. Of these, 2,450 full-time positions have been phased out (employees have left the SAS Group) through December 2003 (250 within groupwide functions, 1,450 within Scandinavian Airlines, 550 within Airline Support Businesses and 200 within Subsidiary Airlines). The remaining redundancies are: groupwide functions 250, Scandinavian Airlines 1,850, Airline Support Businesses 1,300 and approximately 150 within Subsidiary Airlines. Competitive salaries, benefits and pensions The SAS Group has started collective agreement negotiations with all employee groups for 2004 with the aim of ensuring salaries, benefits and pensions at market levels in relation to competitors. A large portion of the remaining approximately SEK 2 billion in Turnaround 2005 would thus be achieved. Negotiations will be finalized during the first quarter of 2004. Restructuring costs The SAS Group has chosen to maintain a fast pace in the Turnaround 2005 work and restructuring costs have arisen. The restructuring costs related to Turnaround 2005 during the full-year 2003 were MSEK 496, of which MSEK 400 relates to costs for 2004. The costs primarily relate to employees who have been given notice under non-working notice periods. The cash effect is very limited. Investments The SAS Group’s investments, including prepayments, amounted to MSEK 4,495 (10,054) for the period. Scandinavian Airlines accounted for MSEK 1,033 (6,169) of investments, Subsidiary & Affiliated Airlines for MSEK 1,970 (1,618), Airline Support Businesses for MSEK 494 (1,165), Airline Related Businesses for MSEK 177 (408) and Rezidor SAS Hospitality for MSEK 576 (265). Investments in aircraft and other flight equipment totaled MSEK 2,817 (8,014). The SAS Group has had large surplus values in its aircraft fleet for a number of years. The size of surplus values mainly depends on the market value of aircraft, the depreciation rate applied, and the SEK/USD exchange rate. The estimated book value of the aircraft fleet owned by the SAS Group at December 31, 2003, exceeded the market value by approximately MSEK 400. Firm orders for aircraft 2004-2007: At the end of December 2003, the sum of future investments, CAPEX, in the SAS Group amounted to MUSD 347. SAS Group Total 2004 2005 2006 2007CAPEX (MUSD) 347 123 44 55 125Number of aircraft 9 3 1 1 4
In 2003, the SAS Group postponed deliveries of four Airbus A321s and two Boeing 737s.
SAS Group’s total aircraft fleet December 31, 2003:
Aircraft type Own-
ed Leased
in Total Leased
out OrderAirbus A330/340-300 7 3 10 1Airbus A321-200 8 16 24 5Boeing 767 3 2 5 2Boeing 737 33 50 83 8 3Boeing 717 4 4 Douglas MD-81/82/83/87 31 61 92 1Douglas MD-90 8 8 Avro RJ-85/100 9 9 Fokker F28 2 2 1Fokker F50 7 7 2deHavilland Q100-Q400 21 32 53 SAAB 2000 5 5 Total 120 182 302 14 9
Breakdown of Group’s fleet by airline:
Scandinavian Airlines 100 81 181 13 8Spanair 51 51 1Braathens 4 23 27 1Widerøe 16 13 29 Blue1 14 14 Currency and fuel hedging During 2003, the SAS Group hedged its fuel purchases to an average of 80%. Of estimated consumption in 2004, the SAS Group has so far only hedged fuel purchases for the first quarter. Regarding currency, the policy is to hedge a USD deficit between 60-90%. Since year-end 2003, the U.S. dollar has been hedged in the lower part of the 60-90% range. Financial position The SAS Group’s liquid assets at December 31, 2003, amounted to MSEK 9,066 (10,721). In addition to this, the Group has unutilized loan commitments totaling MSEK 6,500. A MEUR 400 loan facility was raised in the fourth quarter of 2003. The facility matures in 2007. Net debt amounted to MSEK 11,466, a decrease of MSEK 108 since December 2002. The financial net debt amounted to MSEK 18,122 (17,872). Cash flow from operations for the period January-December was negative at MSEK -278 (1,818). The less favorable cash flow is mainly due to a very weak first quarter, MSEK -1,095 (-428). In 1998-2002 the SAS Group carried out an extensive investment program for replacement of the aircraft fleet. This program is now mainly completed and the SAS Group will have limited investments over the next 3-4 years. In the third quarter, properties in Copenhagen were sold. The properties at Frösundavik, Stockholm, were sold in November. These properties were leased back. Together these transactions released capital of almost MSEK 2,100. The SAS Group’s program for the release of capital will continue in 2004. The SAS Group’s financial position and preparedness are assessed as sufficient to carry out the measures within Turnaround 2005. Moody’s monitors the development of SAS’s creditworthiness and at December 31 the credit rating was Ba3 with a “stable” outlook. In January 2004 the SAS Group was assigned a “negative” outlook primarily due to the negative yield trend and increased competition.
SAS Group: Year-end report January-December 2003
9
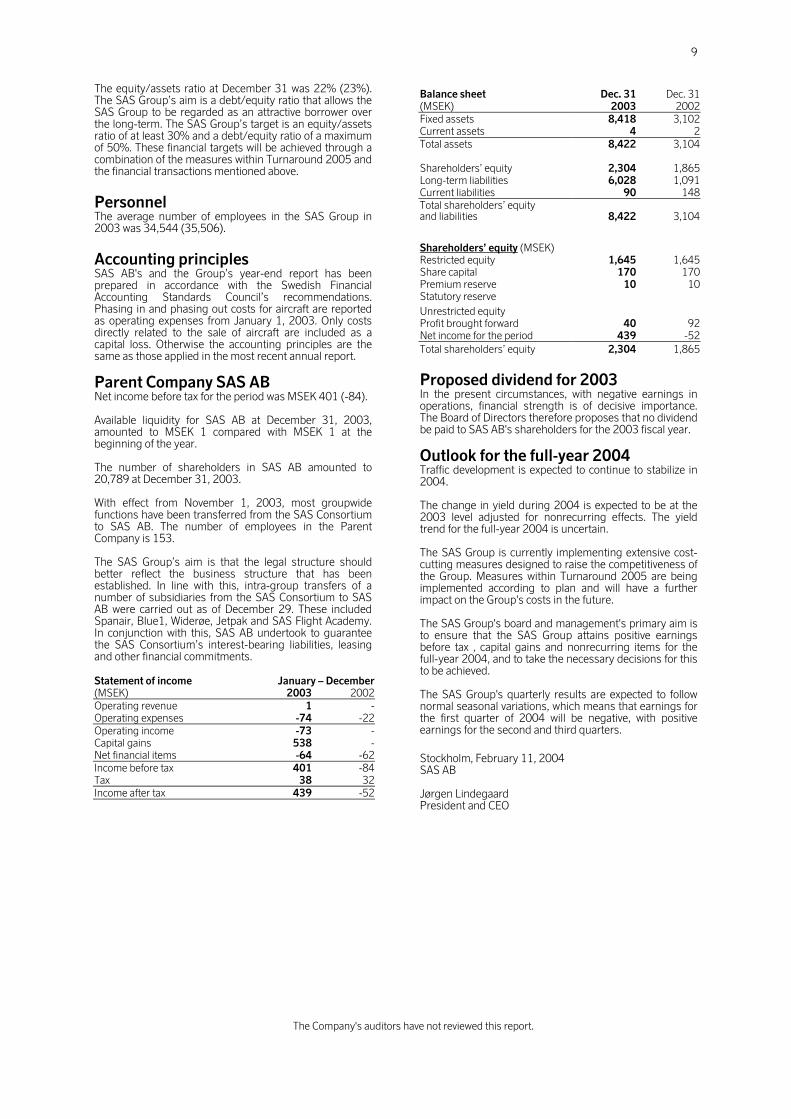
The equity/assets ratio at December 31 was 22% (23%). The SAS Group’s aim is a debt/equity ratio that allows the SAS Group to be regarded as an attractive borrower over the long-term. The SAS Group’s target is an equity/assets ratio of at least 30% and a debt/equity ratio of a maximum of 50%. These financial targets will be achieved through a combination of the measures within Turnaround 2005 and the financial transactions mentioned above. Personnel The average number of employees in the SAS Group in 2003 was 34,544 (35,506). Accounting principles SAS AB's and the Group’s year-end report has been prepared in accordance with the Swedish Financial Accounting Standards Council’s recommendations. Phasing in and phasing out costs for aircraft are reported as operating expenses from January 1, 2003. Only costs directly related to the sale of aircraft are included as a capital loss. Otherwise the accounting principles are the same as those applied in the most recent annual report. Parent Company SAS AB Net income before tax for the period was MSEK 401 (-84). Available liquidity for SAS AB at December 31, 2003, amounted to MSEK 1 compared with MSEK 1 at the beginning of the year. The number of shareholders in SAS AB amounted to 20,789 at December 31, 2003. With effect from November 1, 2003, most groupwide functions have been transferred from the SAS Consortium to SAS AB. The number of employees in the Parent Company is 153. The SAS Group’s aim is that the legal structure should better reflect the business structure that has been established. In line with this, intra-group transfers of a number of subsidiaries from the SAS Consortium to SAS AB were carried out as of December 29. These included Spanair, Blue1, Widerøe, Jetpak and SAS Flight Academy. In conjunction with this, SAS AB undertook to guarantee the SAS Consortium’s interest-bearing liabilities, leasing and other financial commitments. Statement of income January – December(MSEK) 2003 2002Operating revenue 1 -Operating expenses -74 -22Operating income -73 -Capital gains 538 -Net financial items -64 -62Income before tax 401 -84Tax 38 32Income after tax 439 -52
Balance sheet Dec. 31 Dec. 31(MSEK) 2003 2002Fixed assets 8,418 3,102Current assets 4 2Total assets 8,422 3,104 Shareholders’ equity 2,304 1,865Long-term liabilities 6,028 1,091Current liabilities 90 148Total shareholders’ equity and liabilities 8,422 3,104
Shareholders’ equity (MSEK) Restricted equity 1,645 1,645Share capital 170 170Premium reserve 10 10Statutory reserve Unrestricted equity Profit brought forward 40 92Net income for the period 439 -52Total shareholders’ equity 2,304 1,865
Proposed dividend for 2003 In the present circumstances, with negative earnings in operations, financial strength is of decisive importance. The Board of Directors therefore proposes that no dividend be paid to SAS AB's shareholders for the 2003 fiscal year. Outlook for the full-year 2004 Traffic development is expected to continue to stabilize in 2004. The change in yield during 2004 is expected to be at the 2003 level adjusted for nonrecurring effects. The yield trend for the full-year 2004 is uncertain. The SAS Group is currently implementing extensive cost-cutting measures designed to raise the competitiveness of the Group. Measures within Turnaround 2005 are being implemented according to plan and will have a further impact on the Group's costs in the future. The SAS Group's board and management's primary aim is to ensure that the SAS Group attains positive earnings before tax , capital gains and nonrecurring items for the full-year 2004, and to take the necessary decisions for this to be achieved. The SAS Group's quarterly results are expected to follow normal seasonal variations, which means that earnings for the first quarter of 2004 will be negative, with positive earnings for the second and third quarters. Stockholm, February 11, 2004 SAS AB Jørgen Lindegaard President and CEO
The Company's auditors have not reviewed this report.
SAS Group: Year-end report January-December 2003
10
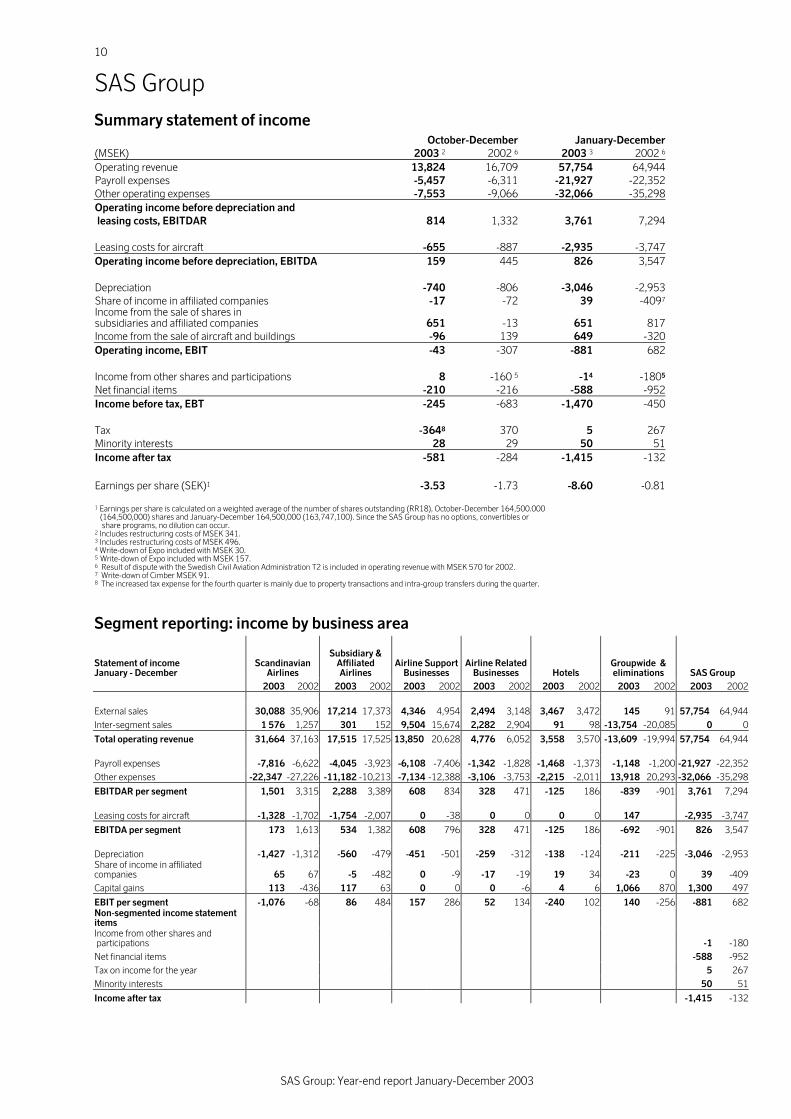
SAS Group Summary statement of income October-December January-December(MSEK) 2003 2 2002 6 2003 3 2002 6
Operating revenue 13,824 16,709 57,754 64,944Payroll expenses -5,457 -6,311 -21,927 -22,352Other operating expenses -7,553 -9,066 -32,066 -35,298Operating income before depreciation and leasing costs, EBITDAR 814 1,332 3,761 7,294 Leasing costs for aircraft -655 -887 -2,935 -3,747Operating income before depreciation, EBITDA 159 445 826 3,547 Depreciation -740 -806 -3,046 -2,953Share of income in affiliated companies -17 -72 39 -4097
Income from the sale of shares in subsidiaries and affiliated companies 651 -13 651 817Income from the sale of aircraft and buildings -96 139 649 -320Operating income, EBIT -43 -307 -881 682 Income from other shares and participations 8 -160 5 -14 -1805
Net financial items -210 -216 -588 -952Income before tax, EBT -245 -683 -1,470 -450 Tax -3648 370 5 267Minority interests 28 29 50 51Income after tax -581 -284 -1,415 -132 Earnings per share (SEK)1 -3.53 -1.73 -8.60 -0.81 1 Earnings per share is calculated on a weighted average of the number of shares outstanding (RR18), October-December 164,500.000 (164,500,000) shares and January-December 164,500,000 (163,747,100). Since the SAS Group has no options, convertibles or share programs, no dilution can occur. 2 Includes restructuring costs of MSEK 341. 3 Includes restructuring costs of MSEK 496. 4 Write-down of Expo included with MSEK 30. 5 Write-down of Expo included with MSEK 157. 6 Result of dispute with the Swedish Civil Aviation Administration T2 is included in operating revenue with MSEK 570 for 2002. 7 Write-down of Cimber MSEK 91. 8 The increased tax expense for the fourth quarter is mainly due to property transactions and intra-group transfers during the quarter.
Segment reporting: income by business area
Statement of income January - December
Scandinavian Airlines
Subsidiary & Affiliated Airlines
Airline Support Businesses
Airline Related Businesses Hotels
Groupwide & eliminations SAS Group
2003 2002 2003 2002 2003 2002 2003 2002 2003 2002 2003 2002 2003 2002 External sales 30,088 35,906 17,214 17,373 4,346 4,954 2,494 3,148 3,467 3,472 145 91 57,754 64,944Inter-segment sales 1 576 1,257 301 152 9,504 15,674 2,282 2,904 91 98 -13,754 -20,085 0 0
Total operating revenue 31,664 37,163 17,515 17,525 13,850 20,628 4,776 6,052 3,558 3,570 -13,609 -19,994 57,754 64,944 Payroll expenses -7,816 -6,622 -4,045 -3,923 -6,108 -7,406 -1,342 -1,828 -1,468 -1,373 -1,148 -1,200 -21,927 -22,352Other expenses -22,347 -27,226 -11,182 -10,213 -7,134 -12,388 -3,106 -3,753 -2,215 -2,011 13,918 20,293 -32,066 -35,298
EBITDAR per segment 1,501 3,315 2,288 3,389 608 834 328 471 -125 186 -839 -901 3,761 7,294 Leasing costs for aircraft -1,328 -1,702 -1,754 -2,007 0 -38 0 0 0 0 147 -2,935 -3,747
EBITDA per segment 173 1,613 534 1,382 608 796 328 471 -125 186 -692 -901 826 3,547 Depreciation -1,427 -1,312 -560 -479 -451 -501 -259 -312 -138 -124 -211 -225 -3,046 -2,953Share of income in affiliated companies 65 67 -5 -482 0 -9 -17 -19 19 34 -23 0 39 -409Capital gains 113 -436 117 63 0 0 0 -6 4 6 1,066 870 1,300 497
EBIT per segment -1,076 -68 86 484 157 286 52 134 -240 102 140 -256 -881 682Non-segmented income statement items Income from other shares and participations -1 -180Net financial items -588 -952Tax on income for the year 5 267Minority interests 50 51
Income after tax -1,415 -132
SAS Group: Year-end report January-December 2003
11
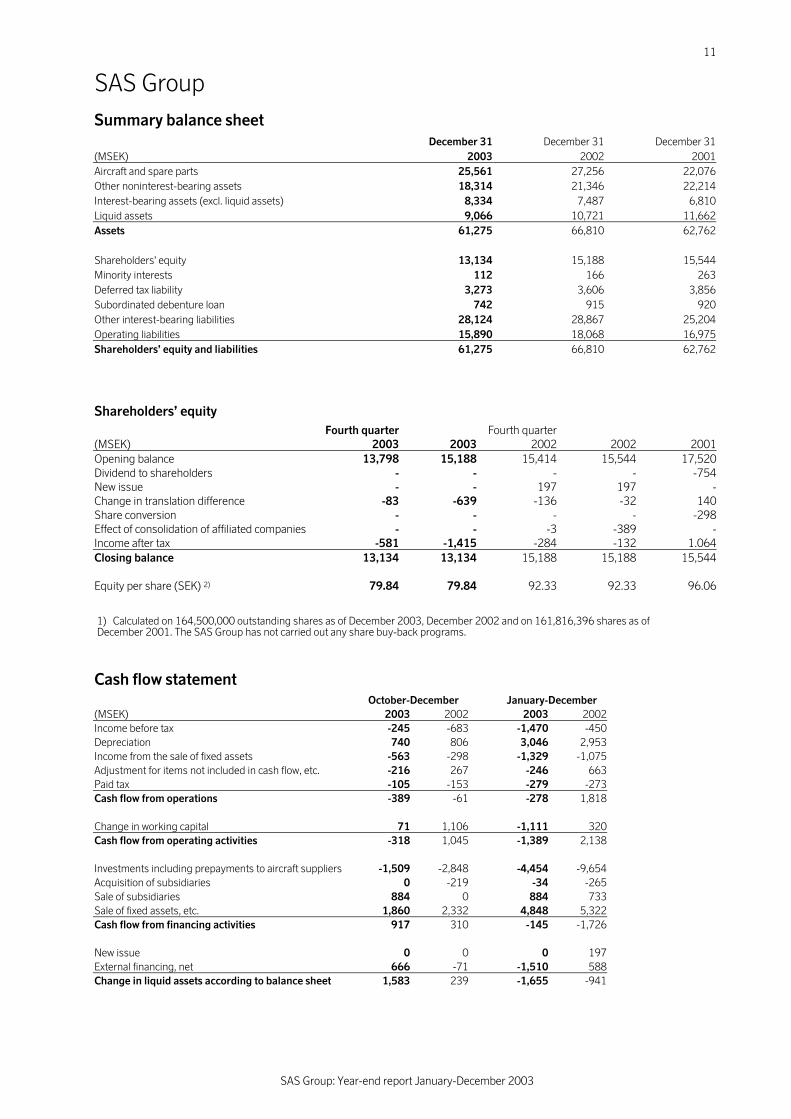
SAS Group Summary balance sheet
December 31 December 31 December 31(MSEK) 2003 2002 2001Aircraft and spare parts 25,561 27,256 22,076Other noninterest-bearing assets 18,314 21,346 22,214Interest-bearing assets (excl. liquid assets) 8,334 7,487 6,810Liquid assets 9,066 10,721 11,662Assets 61,275 66,810 62,762 Shareholders' equity 13,134 15,188 15,544Minority interests 112 166 263Deferred tax liability 3,273 3,606 3,856Subordinated debenture loan 742 915 920Other interest-bearing liabilities 28,124 28,867 25,204Operating liabilities 15,890 18,068 16,975Shareholders’ equity and liabilities 61,275 66,810 62,762
Shareholders’ equity Fourth quarter Fourth quarter (MSEK) 2003 2003 2002 2002 2001Opening balance 13,798 15,188 15,414 15,544 17,520Dividend to shareholders - - - - -754New issue - - 197 197 -Change in translation difference -83 -639 -136 -32 140Share conversion - - - - -298Effect of consolidation of affiliated companies - - -3 -389 -Income after tax -581 -1,415 -284 -132 1.064Closing balance 13,134 13,134 15,188 15,188 15,544 Equity per share (SEK) 2) 79.84 79.84 92.33 92.33 96.06
Cash flow statement October-December January-December (MSEK) 2003 2002 2003 2002 Income before tax -245 -683 -1,470 -450 Depreciation 740 806 3,046 2,953 Income from the sale of fixed assets -563 -298 -1,329 -1,075 Adjustment for items not included in cash flow, etc. -216 267 -246 663 Paid tax -105 -153 -279 -273 Cash flow from operations -389 -61 -278 1,818 Change in working capital 71 1,106 -1,111 320 Cash flow from operating activities -318 1,045 -1,389 2,138 Investments including prepayments to aircraft suppliers -1,509 -2,848 -4,454 -9,654 Acquisition of subsidiaries 0 -219 -34 -265 Sale of subsidiaries 884 0 884 733 Sale of fixed assets, etc. 1,860 2,332 4,848 5,322 Cash flow from financing activities 917 310 -145 -1,726 New issue 0 0 0 197 External financing, net 666 -71 -1,510 588 Change in liquid assets according to balance sheet 1,583 239 -1,655 -941
1) Calculated on 164,500,000 outstanding shares as of December 2003, December 2002 and on 161,816,396 shares as of December 2001. The SAS Group has not carried out any share buy-back programs.
SAS Group: Year-end report January-December 2003
12
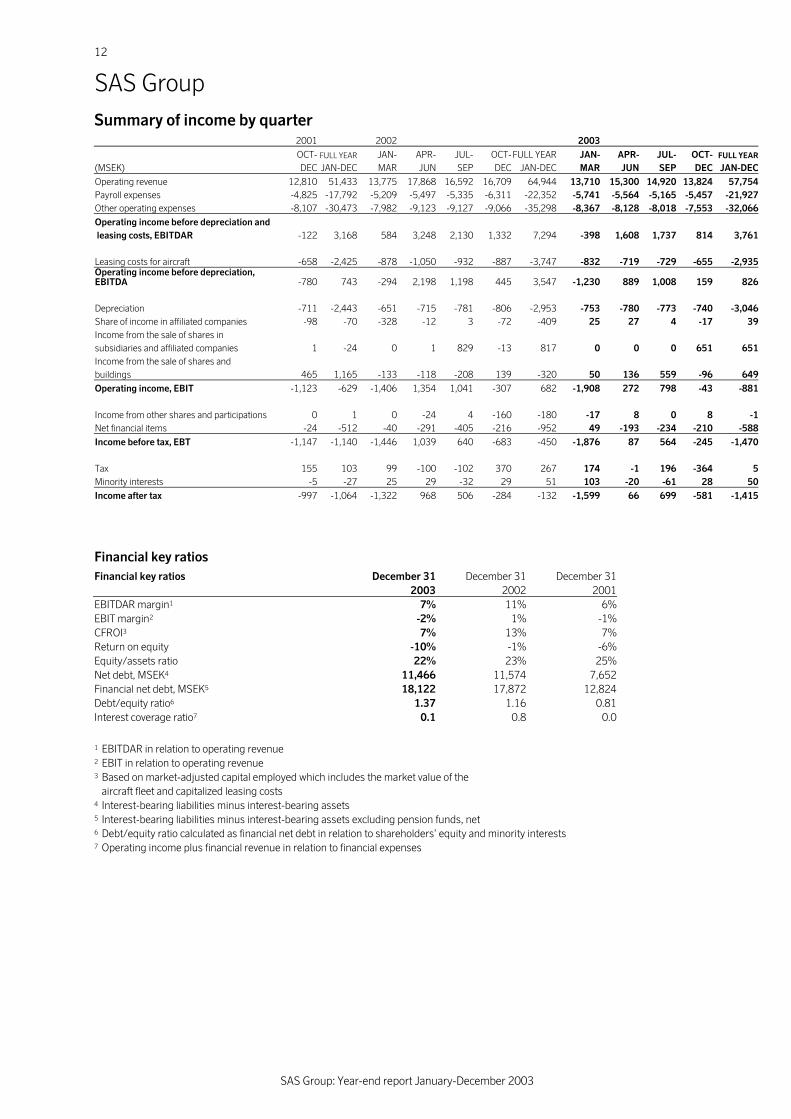
SAS Group Summary of income by quarter 2001 2002 2003 OCT- FULL YEAR JAN- APR- JUL- OCT- FULL YEAR JAN- APR- JUL- OCT- FULL YEAR
(MSEK) DEC JAN-DEC MAR JUN SEP DEC JAN-DEC MAR JUN SEP DEC JAN-DECOperating revenue 12,810 51,433 13,775 17,868 16,592 16,709 64,944 13,710 15,300 14,920 13,824 57,754Payroll expenses -4,825 -17,792 -5,209 -5,497 -5,335 -6,311 -22,352 -5,741 -5,564 -5,165 -5,457 -21,927Other operating expenses -8,107 -30,473 -7,982 -9,123 -9,127 -9,066 -35,298 -8,367 -8,128 -8,018 -7,553 -32,066Operating income before depreciation and leasing costs, EBITDAR -122 3,168 584 3,248 2,130 1,332 7,294 -398 1,608 1,737 814 3,761
Leasing costs for aircraft -658 -2,425 -878 -1,050 -932 -887 -3,747 -832 -719 -729 -655 -2,935Operating income before depreciation, EBITDA -780 743 -294 2,198 1,198 445 3,547 -1,230 889 1,008 159 826 Depreciation -711 -2,443 -651 -715 -781 -806 -2,953 -753 -780 -773 -740 -3,046Share of income in affiliated companies -98 -70 -328 -12 3 -72 -409 25 27 4 -17 39Income from the sale of shares in subsidiaries and affiliated companies 1 -24 0 1 829 -13 817 0 0 0 651 651Income from the sale of shares and buildings 465 1,165 -133 -118 -208 139 -320 50 136 559 -96 649Operating income, EBIT -1,123 -629 -1,406 1,354 1,041 -307 682 -1,908 272 798 -43 -881
Income from other shares and participations 0 1 0 -24 4 -160 -180 -17 8 0 8 -1Net financial items -24 -512 -40 -291 -405 -216 -952 49 -193 -234 -210 -588Income before tax, EBT -1,147 -1,140 -1,446 1,039 640 -683 -450 -1,876 87 564 -245 -1,470 Tax 155 103 99 -100 -102 370 267 174 -1 196 -364 5Minority interests -5 -27 25 29 -32 29 51 103 -20 -61 28 50Income after tax -997 -1,064 -1,322 968 506 -284 -132 -1,599 66 699 -581 -1,415
Financial key ratios Financial key ratios December 31 December 31 December 31 2003 2002 2001 EBITDAR margin1 7% 11% 6% EBIT margin2 -2% 1% -1% CFROI3 7% 13% 7% Return on equity -10% -1% -6% Equity/assets ratio 22% 23% 25% Net debt, MSEK4 11,466 11,574 7,652 Financial net debt, MSEK5 18,122 17,872 12,824 Debt/equity ratio6 1.37 1.16 0.81 Interest coverage ratio7 0.1 0.8 0.0
1 EBITDAR in relation to operating revenue 2 EBIT in relation to operating revenue 3 Based on market-adjusted capital employed which includes the market value of the aircraft fleet and capitalized leasing costs 4 Interest-bearing liabilities minus interest-bearing assets 5 Interest-bearing liabilities minus interest-bearing assets excluding pension funds, net 6 Debt/equity ratio calculated as financial net debt in relation to shareholders’ equity and minority interests 7 Operating income plus financial revenue in relation to financial expenses
SAS Group: Year-end report January-December 2003
13
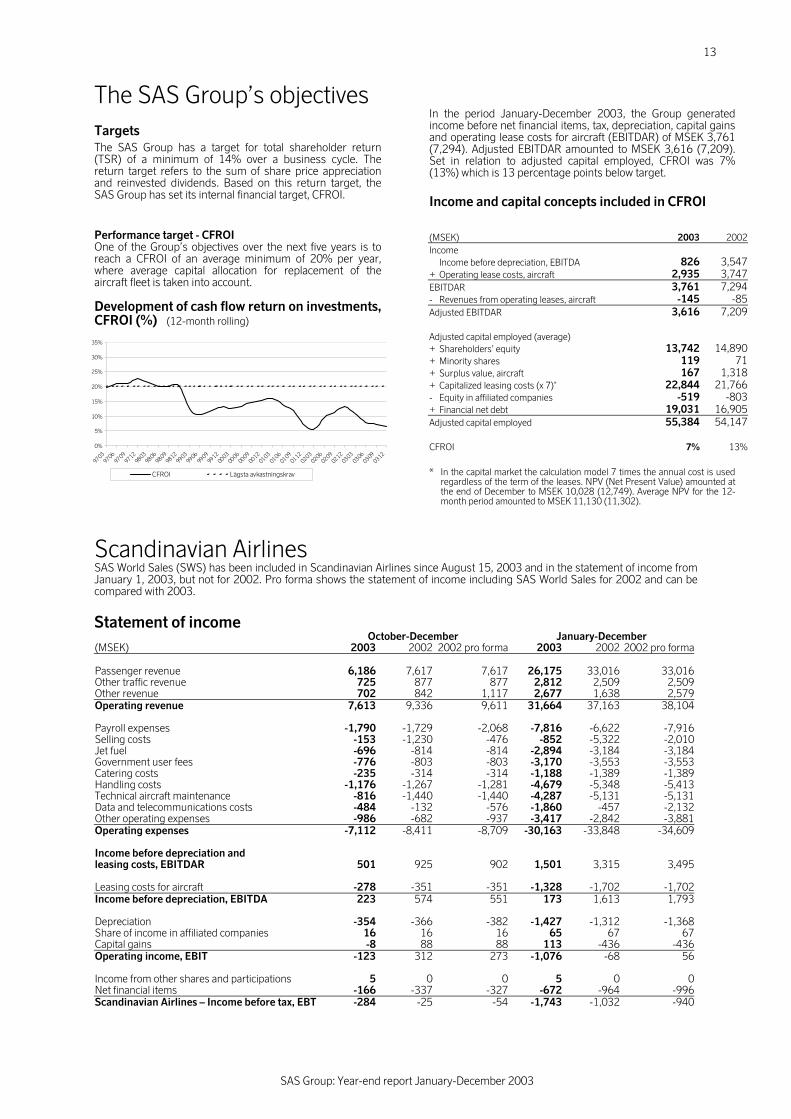
The SAS Group’s objectives Targets The SAS Group has a target for total shareholder return (TSR) of a minimum of 14% over a business cycle. The return target refers to the sum of share price appreciation and reinvested dividends. Based on this return target, the SAS Group has set its internal financial target, CFROI. Performance target - CFROI One of the Group’s objectives over the next five years is to reach a CFROI of an average minimum of 20% per year, where average capital allocation for replacement of the aircraft fleet is taken into account. Development of cash flow return on investments, CFROI (%) (12-month rolling)
In the period January-December 2003, the Group generated income before net financial items, tax, depreciation, capital gains and operating lease costs for aircraft (EBITDAR) of MSEK 3,761 (7,294). Adjusted EBITDAR amounted to MSEK 3,616 (7,209). Set in relation to adjusted capital employed, CFROI was 7% (13%) which is 13 percentage points below target.
Income and capital concepts included in CFROI
(MSEK) 2003 2002Income Income before depreciation, EBITDA 826 3,547+ Operating lease costs, aircraft 2,935 3,747EBITDAR 3,761 7,294- Revenues from operating leases, aircraft -145 -85Adjusted EBITDAR 3,616 7,209 Adjusted capital employed (average) + Shareholders’ equity 13,742 14,890+ Minority shares 119 71+ Surplus value, aircraft 167 1,318+ Capitalized leasing costs (x 7)* 22,844 21,766- Equity in affiliated companies -519 -803+ Financial net debt 19,031 16,905Adjusted capital employed 55,384 54,147 CFROI 7% 13%
* In the capital market the calculation model 7 times the annual cost is used regardless of the term of the leases. NPV (Net Present Value) amounted at the end of December to MSEK 10,028 (12,749). Average NPV for the 12-month period amounted to MSEK 11,130 (11,302).
Scandinavian Airlines SAS World Sales (SWS) has been included in Scandinavian Airlines since August 15, 2003 and in the statement of income from January 1, 2003, but not for 2002. Pro forma shows the statement of income including SAS World Sales for 2002 and can be compared with 2003. Statement of income October-December January-December (MSEK) 2003 2002 2002 pro forma 2003 2002 2002 pro forma Passenger revenue 6,186 7,617 7,617 26,175 33,016 33,016Other traffic revenue 725 877 877 2,812 2,509 2,509Other revenue 702 842 1,117 2,677 1,638 2,579Operating revenue 7,613 9,336 9,611 31,664 37,163 38,104 Payroll expenses -1,790 -1,729 -2,068 -7,816 -6,622 -7,916Selling costs -153 -1,230 -476 -852 -5,322 -2,010Jet fuel -696 -814 -814 -2,894 -3,184 -3,184Government user fees -776 -803 -803 -3,170 -3,553 -3,553Catering costs -235 -314 -314 -1,188 -1,389 -1,389Handling costs -1,176 -1,267 -1,281 -4,679 -5,348 -5,413Technical aircraft maintenance -816 -1,440 -1,440 -4,287 -5,131 -5,131Data and telecommunications costs -484 -132 -576 -1,860 -457 -2,132Other operating expenses -986 -682 -937 -3,417 -2,842 -3,881Operating expenses -7,112 -8,411 -8,709 -30,163 -33,848 -34,609 Income before depreciation and leasing costs, EBITDAR 501 925 902 1,501 3,315 3,495 Leasing costs for aircraft -278 -351 -351 -1,328 -1,702 -1,702Income before depreciation, EBITDA 223 574 551 173 1,613 1,793 Depreciation -354 -366 -382 -1,427 -1,312 -1,368Share of income in affiliated companies 16 16 16 65 67 67Capital gains -8 88 88 113 -436 -436Operating income, EBIT -123 312 273 -1,076 -68 56 Income from other shares and participations 5 0 0 5 0 0Net financial items -166 -337 -327 -672 -964 -996Scandinavian Airlines – Income before tax, EBT -284 -25 -54 -1,743 -1,032 -940
0%
5%
10%
15%
20%
25%
30%
35%
97039706
97099712
98039806
98099812
99039906
99099912
00030006
00090012
01030106
01090112
02030206
02090212
03030306
03090312
CFROI Lägsta avkastningskrav
SAS Group: Year-end report January-December 2003
14
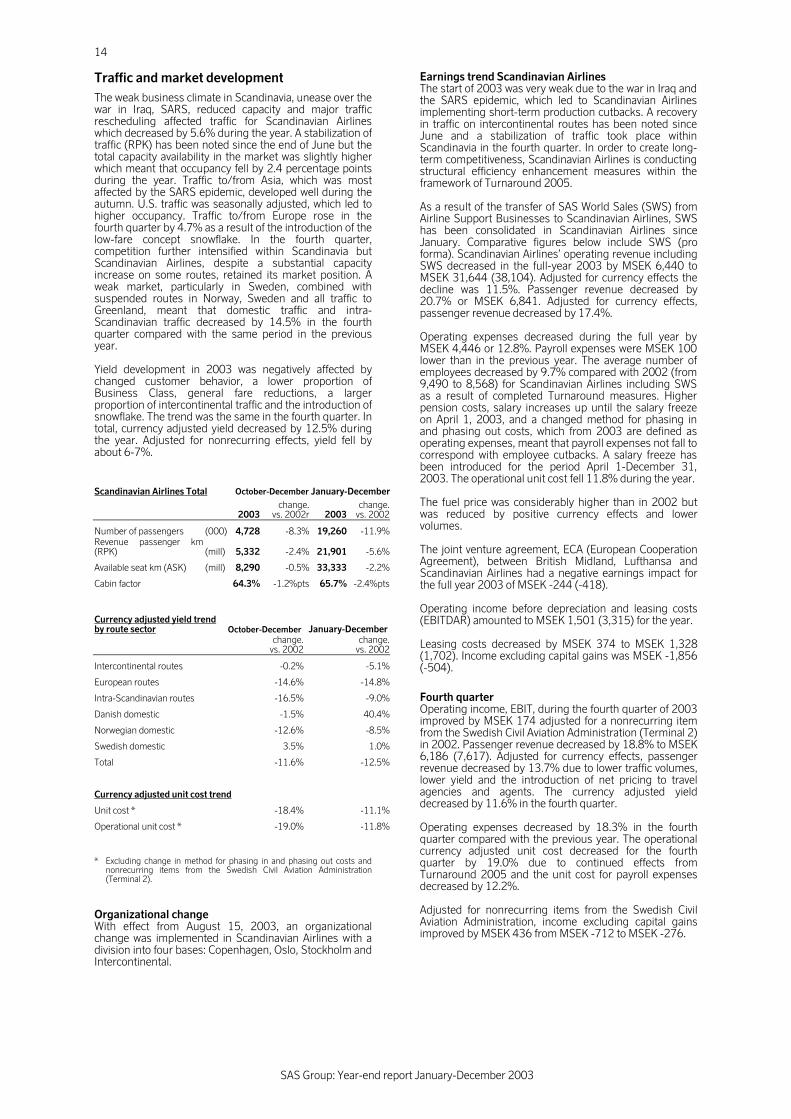
Traffic and market development The weak business climate in Scandinavia, unease over the war in Iraq, SARS, reduced capacity and major traffic rescheduling affected traffic for Scandinavian Airlines which decreased by 5.6% during the year. A stabilization of traffic (RPK) has been noted since the end of June but the total capacity availability in the market was slightly higher which meant that occupancy fell by 2.4 percentage points during the year. Traffic to/from Asia, which was most affected by the SARS epidemic, developed well during the autumn. U.S. traffic was seasonally adjusted, which led to higher occupancy. Traffic to/from Europe rose in the fourth quarter by 4.7% as a result of the introduction of the low-fare concept snowflake. In the fourth quarter, competition further intensified within Scandinavia but Scandinavian Airlines, despite a substantial capacity increase on some routes, retained its market position. A weak market, particularly in Sweden, combined with suspended routes in Norway, Sweden and all traffic to Greenland, meant that domestic traffic and intra-Scandinavian traffic decreased by 14.5% in the fourth quarter compared with the same period in the previous year. Yield development in 2003 was negatively affected by changed customer behavior, a lower proportion of Business Class, general fare reductions, a larger proportion of intercontinental traffic and the introduction of snowflake. The trend was the same in the fourth quarter. In total, currency adjusted yield decreased by 12.5% during the year. Adjusted for nonrecurring effects, yield fell by about 6-7%. Scandinavian Airlines Total October-December January-December
2003change.
vs. 2002r 2003change.
vs. 2002
Number of passengers (000) 4,728 -8.3% 19,260 -11.9%Revenue passenger km (RPK) (mill) 5,332 -2.4% 21,901 -5.6%
Available seat km (ASK) (mill) 8,290 -0.5% 33,333 -2.2%
Cabin factor 64.3% -1.2%pts 65.7% -2.4%pts
Currency adjusted yield trend by route sector October-December January-December
change.
vs. 2002change.
vs. 2002
Intercontinental routes -0.2% -5.1%
European routes -14.6% -14.8%
Intra-Scandinavian routes -16.5% -9.0%
Danish domestic -1.5% 40.4%
Norwegian domestic -12.6% -8.5%
Swedish domestic 3.5% 1.0%
Total -11.6% -12.5%
Currency adjusted unit cost trend
Unit cost * -18.4% -11.1%
Operational unit cost * -19.0% -11.8%
* Excluding change in method for phasing in and phasing out costs and
nonrecurring items from the Swedish Civil Aviation Administration (Terminal 2).
Organizational change With effect from August 15, 2003, an organizational change was implemented in Scandinavian Airlines with a division into four bases: Copenhagen, Oslo, Stockholm and Intercontinental.
Earnings trend Scandinavian Airlines The start of 2003 was very weak due to the war in Iraq and the SARS epidemic, which led to Scandinavian Airlines implementing short-term production cutbacks. A recovery in traffic on intercontinental routes has been noted since June and a stabilization of traffic took place within Scandinavia in the fourth quarter. In order to create long-term competitiveness, Scandinavian Airlines is conducting structural efficiency enhancement measures within the framework of Turnaround 2005. As a result of the transfer of SAS World Sales (SWS) from Airline Support Businesses to Scandinavian Airlines, SWS has been consolidated in Scandinavian Airlines since January. Comparative figures below include SWS (pro forma). Scandinavian Airlines’ operating revenue including SWS decreased in the full-year 2003 by MSEK 6,440 to MSEK 31,644 (38,104). Adjusted for currency effects the decline was 11.5%. Passenger revenue decreased by 20.7% or MSEK 6,841. Adjusted for currency effects, passenger revenue decreased by 17.4%. Operating expenses decreased during the full year by MSEK 4,446 or 12.8%. Payroll expenses were MSEK 100 lower than in the previous year. The average number of employees decreased by 9.7% compared with 2002 (from 9,490 to 8,568) for Scandinavian Airlines including SWS as a result of completed Turnaround measures. Higher pension costs, salary increases up until the salary freeze on April 1, 2003, and a changed method for phasing in and phasing out costs, which from 2003 are defined as operating expenses, meant that payroll expenses not fall to correspond with employee cutbacks. A salary freeze has been introduced for the period April 1-December 31, 2003. The operational unit cost fell 11.8% during the year. The fuel price was considerably higher than in 2002 but was reduced by positive currency effects and lower volumes. The joint venture agreement, ECA (European Cooperation Agreement), between British Midland, Lufthansa and Scandinavian Airlines had a negative earnings impact for the full year 2003 of MSEK -244 (-418). Operating income before depreciation and leasing costs (EBITDAR) amounted to MSEK 1,501 (3,315) for the year. Leasing costs decreased by MSEK 374 to MSEK 1,328 (1,702). Income excluding capital gains was MSEK -1,856 (-504).
Fourth quarter Operating income, EBIT, during the fourth quarter of 2003 improved by MSEK 174 adjusted for a nonrecurring item from the Swedish Civil Aviation Administration (Terminal 2) in 2002. Passenger revenue decreased by 18.8% to MSEK 6,186 (7,617). Adjusted for currency effects, passenger revenue decreased by 13.7% due to lower traffic volumes, lower yield and the introduction of net pricing to travel agencies and agents. The currency adjusted yield decreased by 11.6% in the fourth quarter. Operating expenses decreased by 18.3% in the fourth quarter compared with the previous year. The operational currency adjusted unit cost decreased for the fourth quarter by 19.0% due to continued effects from Turnaround 2005 and the unit cost for payroll expenses decreased by 12.2%. Adjusted for nonrecurring items from the Swedish Civil Aviation Administration, income excluding capital gains improved by MSEK 436 from MSEK -712 to MSEK -276.
SAS Group: Year-end report January-December 2003
15
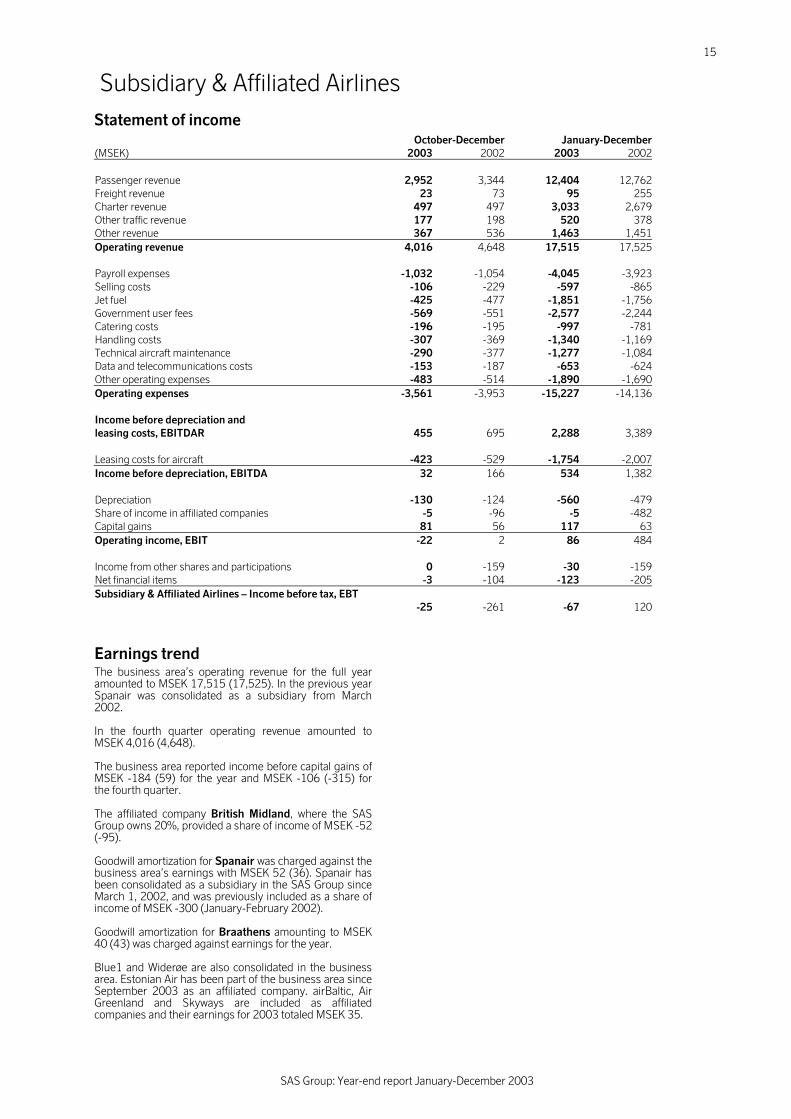
Subsidiary & Affiliated Airlines Statement of income October-December January-December(MSEK) 2003 2002 2003 2002 Passenger revenue 2,952 3,344 12,404 12,762Freight revenue 23 73 95 255Charter revenue 497 497 3,033 2,679Other traffic revenue 177 198 520 378Other revenue 367 536 1,463 1,451Operating revenue 4,016 4,648 17,515 17,525 Payroll expenses -1,032 -1,054 -4,045 -3,923Selling costs -106 -229 -597 -865Jet fuel -425 -477 -1,851 -1,756Government user fees -569 -551 -2,577 -2,244Catering costs -196 -195 -997 -781Handling costs -307 -369 -1,340 -1,169Technical aircraft maintenance -290 -377 -1,277 -1,084Data and telecommunications costs -153 -187 -653 -624Other operating expenses -483 -514 -1,890 -1,690Operating expenses -3,561 -3,953 -15,227 -14,136 Income before depreciation and leasing costs, EBITDAR 455 695 2,288 3,389 Leasing costs for aircraft -423 -529 -1,754 -2,007Income before depreciation, EBITDA 32 166 534 1,382 Depreciation -130 -124 -560 -479Share of income in affiliated companies -5 -96 -5 -482Capital gains 81 56 117 63Operating income, EBIT -22 2 86 484 Income from other shares and participations 0 -159 -30 -159Net financial items -3 -104 -123 -205Subsidiary & Affiliated Airlines – Income before tax, EBT -25 -261 -67 120
Earnings trend The business area’s operating revenue for the full year amounted to MSEK 17,515 (17,525). In the previous year Spanair was consolidated as a subsidiary from March 2002. In the fourth quarter operating revenue amounted to MSEK 4,016 (4,648). The business area reported income before capital gains of MSEK -184 (59) for the year and MSEK -106 (-315) for the fourth quarter. The affiliated company British Midland, where the SAS Group owns 20%, provided a share of income of MSEK -52 (-95). Goodwill amortization for Spanair was charged against the business area’s earnings with MSEK 52 (36). Spanair has been consolidated as a subsidiary in the SAS Group since March 1, 2002, and was previously included as a share of income of MSEK -300 (January-February 2002). Goodwill amortization for Braathens amounting to MSEK 40 (43) was charged against earnings for the year. Blue1 and Widerøe are also consolidated in the business area. Estonian Air has been part of the business area since September 2003 as an affiliated company. airBaltic, Air Greenland and Skyways are included as affiliated companies and their earnings for 2003 totaled MSEK 35.
SAS Group: Year-end report January-December 2003
16
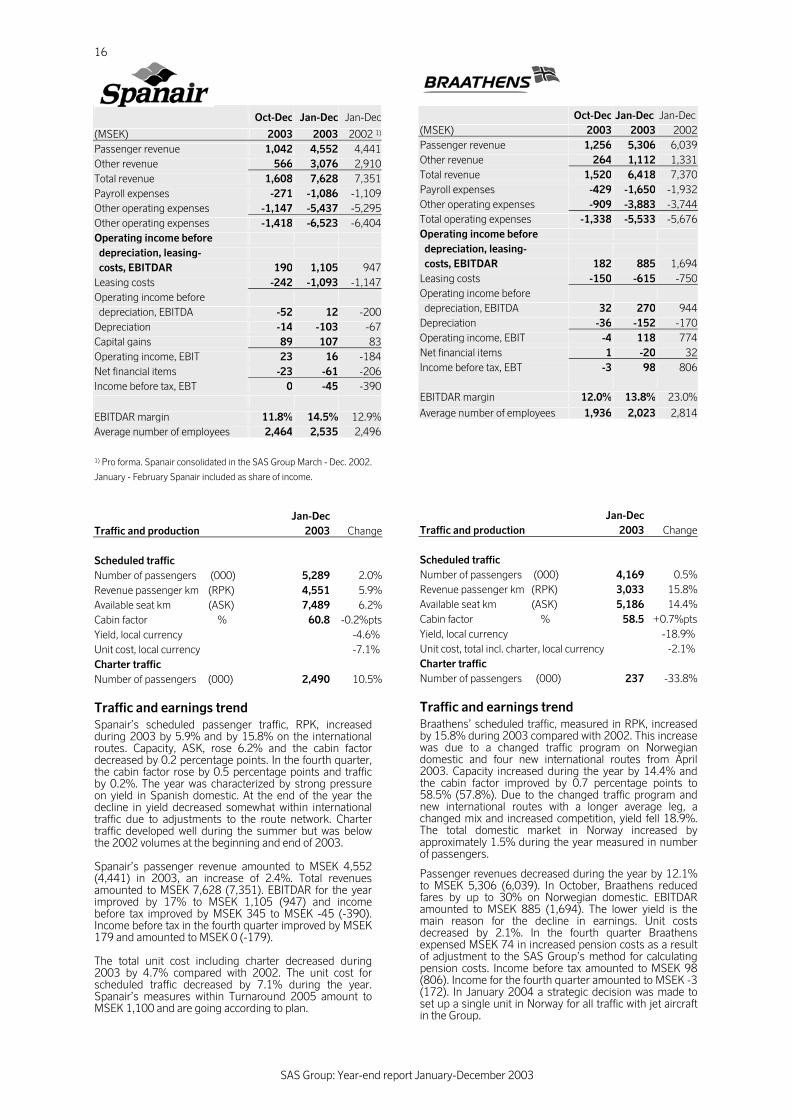
Jan-DecTraffic and production 2003 Change Scheduled traffic Number of passengers (000) 5,289 2.0%Revenue passenger km (RPK) 4,551 5.9%Available seat km (ASK) 7,489 6.2%Cabin factor % 60.8 -0.2%ptsYield, local currency -4.6% Unit cost, local currency -7.1% Charter traffic Number of passengers (000) 2,490 10.5%
Traffic and earnings trend Spanair’s scheduled passenger traffic, RPK, increased during 2003 by 5.9% and by 15.8% on the international routes. Capacity, ASK, rose 6.2% and the cabin factor decreased by 0.2 percentage points. In the fourth quarter, the cabin factor rose by 0.5 percentage points and traffic by 0.2%. The year was characterized by strong pressure on yield in Spanish domestic. At the end of the year the decline in yield decreased somewhat within international traffic due to adjustments to the route network. Charter traffic developed well during the summer but was below the 2002 volumes at the beginning and end of 2003. Spanair’s passenger revenue amounted to MSEK 4,552 (4,441) in 2003, an increase of 2.4%. Total revenues amounted to MSEK 7,628 (7,351). EBITDAR for the year improved by 17% to MSEK 1,105 (947) and income before tax improved by MSEK 345 to MSEK -45 (-390). Income before tax in the fourth quarter improved by MSEK 179 and amounted to MSEK 0 (-179). The total unit cost including charter decreased during 2003 by 4.7% compared with 2002. The unit cost for scheduled traffic decreased by 7.1% during the year. Spanair’s measures within Turnaround 2005 amount to MSEK 1,100 and are going according to plan.
Oct-Dec Jan-Dec Jan-Dec(MSEK) 2003 2003 2002Passenger revenue 1,256 5,306 6,039Other revenue 264 1,112 1,331Total revenue 1,520 6,418 7,370Payroll expenses -429 -1,650 -1,932Other operating expenses -909 -3,883 -3,744Total operating expenses -1,338 -5,533 -5,676Operating income before depreciation, leasing- costs, EBITDAR 182 885 1,694Leasing costs -150 -615 -750Operating income before depreciation, EBITDA 32 270 944Depreciation -36 -152 -170Operating income, EBIT -4 118 774Net financial items 1 -20 32Income before tax, EBT -3 98 806 EBITDAR margin 12.0% 13.8% 23.0%
Average number of employees 1,936 2,023 2,814
Jan-Dec Traffic and production 2003 Change Scheduled traffic Number of passengers (000) 4,169 0.5%Revenue passenger km (RPK) 3,033 15.8%Available seat km (ASK) 5,186 14.4%Cabin factor % 58.5 +0.7%ptsYield, local currency -18.9% Unit cost, total incl. charter, local currency -2.1% Charter traffic Number of passengers (000) 237 -33.8%
Traffic and earnings trend Braathens’ scheduled traffic, measured in RPK, increased by 15.8% during 2003 compared with 2002. This increase was due to a changed traffic program on Norwegian domestic and four new international routes from April 2003. Capacity increased during the year by 14.4% and the cabin factor improved by 0.7 percentage points to 58.5% (57.8%). Due to the changed traffic program and new international routes with a longer average leg, a changed mix and increased competition, yield fell 18.9%. The total domestic market in Norway increased by approximately 1.5% during the year measured in number of passengers.
Passenger revenues decreased during the year by 12.1% to MSEK 5,306 (6,039). In October, Braathens reduced fares by up to 30% on Norwegian domestic. EBITDAR amounted to MSEK 885 (1,694). The lower yield is the main reason for the decline in earnings. Unit costs decreased by 2.1%. In the fourth quarter Braathens expensed MSEK 74 in increased pension costs as a result of adjustment to the SAS Group’s method for calculating pension costs. Income before tax amounted to MSEK 98 (806). Income for the fourth quarter amounted to MSEK -3 (172). In January 2004 a strategic decision was made to set up a single unit in Norway for all traffic with jet aircraft in the Group.
Oct-Dec Jan-Dec Jan-Dec
(MSEK) 2003 2003 2002 1)
Passenger revenue 1,042 4,552 4,441Other revenue 566 3,076 2,910Total revenue 1,608 7,628 7,351Payroll expenses -271 -1,086 -1,109Other operating expenses -1,147 -5,437 -5,295Other operating expenses -1,418 -6,523 -6,404Operating income before depreciation, leasing- costs, EBITDAR 190 1,105 947Leasing costs -242 -1,093 -1,147Operating income before depreciation, EBITDA -52 12 -200Depreciation -14 -103 -67Capital gains 89 107 83Operating income, EBIT 23 16 -184Net financial items -23 -61 -206Income before tax, EBT 0 -45 -390
EBITDAR margin 11.8% 14.5% 12.9%Average number of employees 2,464 2,535 2,496 1) Pro forma. Spanair consolidated in the SAS Group March - Dec. 2002.
January - February Spanair included as share of income.
SAS Group: Year-end report January-December 2003
17
Oct-Dec Jan-Dec Jan-Dec(MSEK) 2003 2003 2002Passenger revenue 398 1,633 1,807Other revenue 217 844 796Total revenue 615 2,477 2,603Operating income before depreciation, leasing- costs, EBITDAR 87 343 453Operating income before depreciation, EBITDA 70 254 306Operating income, EBIT 23 96 164Income before tax, EBT 47 77 82 EBITDAR margin 14.1% 13.8% 17.4%
Number of employees 1,260 1,291 1,207 Traffic and production Jan-Dec 2003 Change Number of passengers (000) 1,658 10.5%Revenue passenger km (RPK) 506 20.5%Available seat km (ASK) 956 16.8%Cabin factor % 53.0 +1.6%ptsYield, local currency -18.8% Unit cost, local currency -9.9%
Traffic and earnings trend Widerøe’s scheduled traffic, RPK, increased in 2003 by 20.5% compared with 2002. This substantial increase is due to a number of new and longer routes. Capacity, ASK, increased as a result of this by 16.8%, while the number of flights only rose 1%. The cabin factor rose during the year by 1.6 percentage points to 53.0%. Yield fell during the year by 18.8% mainly due to fewer full-fare paying passengers. With effect from October 26, Widerøe changed its pricing model and reduced its full-fare tickets by 25%. The number of passengers transported rose 10.5% during the year. In 2003, Widerøe rescheduled its traffic program in order to increase utilization of the aircraft fleet. This resulted in two aircraft being taken out of production, but the number of hours flown increased despite this by 7%. In 2004 these two aircraft are expected to go back into production on newly signed contract traffic in north Norway from January 1 as well as new Norwegian domestic routes. Additional new routes are also planned. Unit cost fell by 9.9% during the year. Widerøe’s production is divided into two parts. The first part is the short runway network contracted by the Norwegian State which is contracted for a three-year period and accounted for approximately 40% of passenger revenue in 2003. The other part of operations comprises scheduled commercial flights within and to/from Norway and accounted for approximately 60% of passenger revenue during the year. Passenger revenue decreased in 2003 by 9.6% to MSEK 1,633 (1,807). EBITDAR amounted to MSEK 343 (453). Income before tax decreased by MSEK 5 to MSEK 77 (82). During 2003 Widerøe started implementation of efficiency enhancement measures amounting to approximately MSEK 300. These measures will largely be completed during 2004 but have their full impact at the beginning of 2006. Due to an unexpectedly weak market development on the short runway network, in July 2003 Widerøe terminated its contracted traffic in Finnmark and Nord-Troms with effect from July 2004. Widerøe submitted a new tender for these two areas. The winning tender is expected to be decided in March 2004.
Oct-Dec Jan-Dec Jan-Dec(MSEK) 2003 2003 2002Passenger revenue 256 913 1,022Other revenue 6 35 3Total revenue 262 948 1,025Operating income before depreciation, leasing- costs, EBITDAR 4 79 245Operating income before depreciation, EBITDA -32 -59 94Operating income, EBIT -35 -70 83Income before tax, EBT -42 -80 83 EBITDAR margin 1.5% 8.3% 23.9%
Number of employees 313 290 291 Traffic and production Jan-Dec 2003 Change Number of passengers (000) 628 17.2%Revenue passenger km (RPK) 411 23.8%Available seat km (ASK) 918 36.7%Cabin factor % 44.8 -4.7%ptsYield, local currency -25.0% Unit cost, local currency -19.7%
Traffic and earnings trend Despite weaker demand in the market, Blue1 increased its traffic, RPK, by 23.8% in 2003. The number of passengers rose 17.2%. Capacity, ASK, increased by 36.7% which was due to an increase in the number of daily frequencies on existing routes and the introduction of new direct routes to Europe. During the fourth quarter Blue1 expanded its fleet with four new jet aircraft which were put into scheduled traffic starting with the winter traffic program at the end of October 2003. This new capacity was used to strengthen production and optimize the timetable on Helsinki-Stockholm/Copenhagen. In addition a new route Helsinki-Geneva started on October 6 with one daily departure. Passenger revenue for the full-year 2003 amounted to MSEK 913, which is 10.7% lower than in the previous year. This decline is mainly due to a lower yield due to lower average fares. The reduction of average fares is due to a changed commission model to retailers, falling demand in the market and changed customer behavior. Despite capacity increases of 36.7%, operating expenses only rose 8%. Unit costs decreased by 19.7% compared with the previous year. Improved efficiency is mainly due to increased utilization of aircraft. Income before tax amounted to MSEK -80 (83). Income was charged with nonrecurring costs related to phasing in of new aircraft and the launch of a new corporate identity. Blue1 has measures within Turnaround 2005 which amount to approximately MSEK 150 and are going according to plan.
SAS Group: Year-end report January-December 2003
18
Airline Support Businesses SAS World Sales has been included in Scandinavian Airlines since August 15, 2003, and is consolidated in the statement of income during 2002 in Airline Support Businesses but not during 2003. SAS World Sales is excluded from the pro forma 2002 figures.
Statement of income October-December January-December (MSEK) 2003 2002 2002 pro forma 2003 2002 2002 pro forma
Operating revenue 3,433 5,493 3,994 13,850 20,628 14,409 Payroll expenses -1,474 -1,981 -1,642 -6,108 -7,406 -6,112Selling costs -1 -475 -1 -3 -2,006 -3Handling costs -261 -298 -298 -1,057 -1,194 -1,194Technical aircraft maintenance -356 -628 -628 -1,752 -1,944 -1,944Data and telecommunications costs -185 -666 -222 -724 -2,450 -775Other operating expenses -942 -1,297 -1,032 -3,598 -4,832 -3,765Operating expenses -3,219 -5,345 -3,823 -13,242 -19,832 -13,793 Income before depreciation, EBITDA 214 148 171 608 796 616 Depreciation -113 -132 -116 -451 -501 -445Share of income in affiliated companies 0 0 0 0 -9 -9Operating income, EBIT 101 16 55 157 286 162 Net financial items -20 7 -3 -90 -27 5Airline Support Businesses - Income before tax, EBT 81 23 52 67 259 167
Earnings trend Airline Support Businesses’ operations comprise ground services, technical aircraft maintenance and freight services. On August 15, 2003, the sales operations, SAS World Sales (SWS) were transferred from Airline Support Businesses to Scandinavian Airlines. SWS is therefore not included in the statement of income for 2003 but in comparative figures for 2002. Pro forma figures do not include SWS. During 2003 the units within the business area adapted to demand in the markets. Extensive structural changes are under implementation designed to reduce costs with full effect in 2005. Operating revenue decreased during the year by 32.9% to MSEK 13,850 (20,628). This decrease was mainly due to the transfer of SWS to the Scandinavian Airlines business area. Adjusted for SWS, operating revenue decreased by 3.9%. Income before tax amounted to MSEK 67 (259). Airline Support Businesses’ operating revenue for the fourth quarter amounted to MSEK 3,433 (5,493), a decrease of 37.5%. Adjusted for SWS, the decrease in operating revenue during the fourth quarter was 14.0%. Income before tax amounted to MSEK 81 (23).
(MSEK) Jan-Dec Jan-Dec 2003 2002Operating revenue 5,588 6,083 of which external operating revenue 14.6% 13.1%Operating income before depreciation, EBITDA -17 48Operating income, EBIT -162 -87 EBITDA margin -0.3% 0.8%Number of employees 6,820 6,891
SAS Ground Services’ (SGS) operating revenue decreased for the full year by 8.1% and amounted to MSEK 5,588 (6,083). Sales to Scandinavian Airlines decreased, but this decline was partly compensated by new contracts. During the year, SGS concluded agreements with MyTravel, Air Canada, LOT, and newly opened operations at Bromma airport in Stockholm. Throughout the year earnings were negatively affected by weak economic development and lower volumes in the airline industry. In addition, price pressure and increased competition intensified this negative trend. Turnaround 2005 within SGS is proceeding according to plan. Major savings have been achieved in 2003 and additional savings potential will be effected in 2004. EBIT for the period amounted to MSEK -162 (-87).
SAS Group: Year-end report January-December 2003
19
(MSEK) Jan-Dec Jan-Dec 2003 2002Operating revenue 5,445 5,874 of which external operating revenue 12.6% 13.0%Operating income before depreciation, EBITDA 416 365Operating income, EBIT 153 91 EBITDA margin 7.6% 6.2%Number of employees 3,586 3,808
SAS Technical Services’ (STS) sales for the full-year 2003 amounted to MSEK 5,445 (5,874). The decline was mainly due to the effect of lower revenues from Scandinavian Airlines relating to engine maintenance (fewer engine replacements), a lower dollar rate and lower traffic-related revenues. Several customers outside the SAS Group have reduced their traffic in the weak market, which led to lower demand for STS’s products. At the same time, STS signed agreements with several new customers, which meant that external revenues remained at roughly the same level as in the previous year. Implementation of Turnaround 2005 has been conducted as planned and most of the measures had been implemented by year-end 2003 and will have their full impact in 2004. The most important measures are establishment of a main base at Stockholm-Arlanda, including centralization of Base Maintenance, the introduction of PFI and new manning of route stations, as well as establishment of a new product-oriented organization with independent profit units to support transparency and a businesslike approach. Operating income (EBIT) during the year amounted to MSEK 153 (91). This improved result is due to volume-adjustment to the lower revenue level and implementation of efficiency enhancements within Turnaround 2005.
Jan-Dec Jan-Dec(MSEK) 2003 2002Operating revenue 2,954 2,844 of which traffic revenue 2,187 2,269Proportion of external operating revenue 95.6% 95.5%Operating income before depreciation, EBITDA 119 47Operating income, EBIT 77 1Income before tax, EBT 51 -4 EBITDA margin 4.0% 1.7%Average number of employees 1,255 1,146 Flown tonnes 288,860 271,103
Tonne km (000) 1,011,70
2 928,307Cargo yield, SEK/tonne km 2.15 2.27 SAS Cargo’s operating revenue for the full year amounted to MSEK 2,954 (2,844), an increase of almost 4%. Operating revenue was favorably affected by the integration of Braathens Cargo from July 1, 2002. Competition intensified towards the end of the year due to increased freight capacity to/from Scandinavia and increased pressure from Central Europe. Combined with changed exchange rates, this led to pressure on yield. Yield (SEK/tonne km) fell by just over 5% from SEK 2.27 to SEK 2.15. Two campaigns "Ask4More" and "Double Up" have been started to reduce pressure on yield. SAS Cargo’s income before tax and financial items (EBIT) for the full year improved by MSEK 76 compared with 2002 and amounted to MSEK 77 (1). Income before tax improved by MSEK 55 to MSEK 51 (-4). In order to ensure and offer capacity in the long term, in September 2003 SAS Cargo signed an agreement for increased capacity with Korean Airlines on the New York-Copenhagen route.
SAS Group: Year-end report January-December 2003
20
Airline Related Businesses Statement of income October-December January-December(MSEK) 2003 2002 2003 2002Operating revenue 1,205 1,595 4,776 6,052 Payroll expenses -326 -574 -1,342 -1,828Handling costs -59 -103 -230 -257Costs of goods sold incl. concession charges -331 -334 -1,327 -1,562Data and telecommunications costs -175 -185 -647 -828Other operating expenses -223 -326 -902 -1,106Operating expenses -1,114 -1,522 -4,448 -5,581 Income before depreciation, EBITDA 91 73 328 471 Depreciation -65 -89 -259 -312Share of income in affiliated companies -17 3 -17 -19Capital gains 0 -1 0 -6Operating income, EBIT 9 -14 52 134 Income from other shares and participations 0 0 0 -27Net financial items -6 -13 -19 -23Airline Related Businesses - Income before tax, EBT 3 -27 33 84
Earnings trend Airline Related Businesses consists of business units with operations related to airline operations within and outside the SAS Group. The business area comprises stores at airports, IT support for the airline industry, and training of pilots and cabin crew. A large part of the business area’s sales are to external customers. Since SMART was sold to Amadeus in August 2002, SMART is included in comparative figures up until August 2002. In December 2003, Scandinavian IT Group was sold to Computer Sciences Corporation (CSC) for a value of MSEK 2,000, comprising sales proceeds and cost savings. Scandinavian IT Group is included in the statement of income for the full-year 2003. The sales rights for Rampsnake were sold in December 2003.
Operating revenue decreased for the full year by 21.1% to MSEK 4,776 (6,052). This decline is due to generally low levels of activity within the airline industry and low economic activity within Scandinavia. Income before tax decreased by MSEK 51 to MSEK 33 (84). Development for the fourth quarter of 2003 was in line with the full year and operating revenue fell 24.4% to MSEK 1,205 (1,595). Income before tax improved to MSEK 3 (-27).
Scandinavian IT Group Scandinavian IT Group’s operating revenue for the full-year 2003 was MSEK 2,057 (2,255), a decline of 8.8%. The lower operating revenue was due to lower volumes and a lower price level. The lower revenue was compensated by lower costs. Income before tax was MSEK 125 (70), which is the best result in SIG’s history. In order to ensure a satisfactory value development for Scandinavian IT Group, in December the Group was sold to Computer Sciences Corporation (CSC) while an outsourcing agreement was signed.
Jan-Dec Jan-Dec(MSEK) 2003 2002Operating revenue 2,057 2,255 of which external operating revenue 10.4% 6.7%Operating income before depreciation, EBITDA 219 192Operating income, EBIT 124 72Income before tax, EBT 125 70 EBITDA margin 10.6% 8.5%Number of employees 1,203 1,289
SAS Group: Year-end report January-December 2003
21
SAS Trading SAS Trading’s operating revenue for the full-year 2003 was MSEK 1,543, MSEK 421 lower than in 2002. The lower operating revenue is due to a lost concession for sales at Arlanda, lower passenger volumes and a negative currency effect through the weakening of mainly the NOK and PZL.
Lower operating revenue together with nonrecurring costs in connection with change of distributor had a negative impact on income before tax which amounted to MSEK -87 (-34).
SAS Flight Academy SAS Flight Academy’s (SFA) operating revenue for the full-year 2003 was MSEK 496 which is 12.7% lower than in the previous year. The weak trend within the airline industry means that there is still a low demand for training, which is leading to price pressure on training on most simulator types. As part of efforts to coordinate pilot and cabin crew training in the SAS Group, SFA has concluded agreements with Scandinavian Airlines, Braathens and Widerøe on training at SFA’s new training center at Gardermoen. Income before tax amounted to MSEK 16 (38), which is MSEK 22 lower than in the previous year. Jetpak Jetpak’s operating revenue increased for the full year by 16.4% to MSEK 448 (385). During the year Jetpak focused on increasing the proportion of distribution logistics solutions in Northern Europe. Jetpak received a first order from Sandvik during the year for distribution of more than 100,000 consignments on a yearly basis. Jetpak’s income before tax for 2003 improved by MSEK 25 and amounted to MSEK 22 (-3).
Jan-Dec Jan-Dec(MSEK) 2003 2002Operating revenue 1,543 1,964 of which external operating revenue 95.5% 97.0%Operating income before depreciation, EBITDA -61 13Operating income, EBIT -79 -24Income before tax, EBT -87 -34 EBITDA margin -4.0% 0.7%Number of employees 341 471
Jan-Dec Jan-Dec(MSEK) 2003 2002 1)
Operating revenue 496 568 of which external operating revenue 35.9% 30.6%Operating income before depreciation, EBITDA 114 141Operating income, EBIT 21 44Income before tax, EBT 16 38 EBITDA margin 23.0% 24.8%Number of employees 166 174
Jan-Dec Jan-Dec(MSEK) 2003 2002Operating revenue 448 385 of which external operating revenue 99.6% 99.5%Operating income before depreciation, EBITDA 33 4Operating income, EBIT 24 -2Income before tax, EBT 22 -3 EBITDA margin 7.4% 1.0%Number of employees 180 153
1) Pro forma, excluding Norwegian Aviation College.
SAS Group: Year-end report January-December 2003
22
Hotels
Statement of income October-December January-December(MSEK) 2003 2002 2003 2002Rooms revenue 430 437 1,768 1,695Food and beverage revenue 357 371 1,169 1,160Other revenue 165 163 621 715Operating revenue 952 971 3,558 3,570 Operating expenses -369 -330 -1,271 -1,151Payroll expenses -382 -383 -1,468 -1,373Rental expenses, property insurance and property tax -242 -237 -944 -860Operating income before depreciation -41 21 -125 186 Depreciation -37 -38 -138 -124Share of income in affiliated companies 10 4 19 34Capital gains 0 1 4 6Operating income, EBIT -68 -12 -240 102 Income from other shares and participations 2 0 15 0Net financial items 4 -6 -28 -17Hotels - Income before tax, EBT -62 -18 -253 85
Key figures Jan.-Dec. Jan.-Dec. 2003 2002 EBITDA, MSEK 1) -106 220 Revenue per available room, SEK (REVPAR) 2) 538 632 Gross profit margin 23.0 % 29.3%
1) Operating income before depreciation and including share of income in affiliated companies.
2) Including hotels operated on a management basis.
Earnings trend Revenues for the full year amounted to MSEK 3,558 (3,570). The in principle unchanged revenues are a net effect of revenue from new hotels opened since the previous year, and of the strike in Norway in spring 2002, while currency adjusted revenues from comparable units fell 3.2%. The hotel market in Europe continued to show negative development and revenue per available room (REVPAR), adjusted for currency effects, is 6.7% lower than in the previous year. This is the third consecutive year with a reduction in REVPAR. The main reasons for this negative trend are the weak economy after the Iraq war and SARS. The hotel markets in Northern Europe declined more than hotels in Southern Europe. Rezidor SAS retained its market shares during the year. In 2003 more agreements were signed and more hotels opened than ever before. Rezidor SAS signed 38 new agreements, including twelve Radisson SAS hotels, 24 Park Inn hotels, one Regent and one Cerutti hotel. During the year, 13 new Radisson SAS hotels opened, in countries including Sweden, Germany and Saudi Arabia. In addition, 20 Park Inn hotels were opened, including 16 in Sweden.
The property that is under construction at Stansted Airport, London, was sold in December at its book value. EBITDA, income before depreciation and including share of income in affiliated companies, amounted to MSEK-106 (220) for the full year. EBITDA for the fourth quarter amounted to MSEK -31 (25). Income before capital gains and restructuring costs amounted to MSEK –226 for the year. A cost saving program was started at the beginning of 2003. For the full year, total operating expenses were reduced by 50% of the reduction in revenues for comparable units. The target is to reduce fixed operating expenses by 15% by next year. The negative trend compared with 2002 can mainly be attributed to lower revenue for comparable units due to the decline in the market and negative results for newly opened hotels. Furthermore, a nonrecurring payment of MSEK 103 was made for termination of the Malmaison contract in 2002. Income before tax, EBT, amounted to MSEK -253 (85) for 2003.
SAS Group: Year-end report January-December 2003
23
Definitions AEA - Association of European Airlines. ASK, Available seat kilometers - The total number of seats available for passengers multiplied by the number of kilometers which they are flown. AV, Asset value (adjusted capital employed) - Book shareholders’ equity, plus minority interests, plus surplus value in the aircraft fleet, plus 7 times the net annual cost for operating leases for aircraft, plus financial net debt, minus share of equity in affiliated companies. Can also be expressed as book value of total assets, plus surplus value in the aircraft fleet, plus 7 times the net annual cost for operating leases for aircraft, minus share of equity in affiliated companies, minus noninterest-bearing liabilities and interest-bearing assets, excluding net pension funds. Cabin factor, passengers - Relation between RPK and ASK expressed as a percentage. Describes the capacity utilization of available seats. Also called occupancy rate. CAPEX (Capital Expenditure) - Future payments for aircraft on firm order. Cash flow from operations - Cash flow from operating activities before change in working capital. CFROI – Adjusted EBITDAR in relation to AV. Debt/equity ratio - Financial net debt in relation to shareholders’ equity and minority interests. Earnings per share (EPS) - Income after tax divided by the total number of shares. EBIT (including capital gains) - Operating income. EBIT margin - EBIT divided by operating revenue. EBITDA, Operating income before depreciation - Operating income before net financial items, tax, depreciation, share of income in affiliated companies, and income from the sale of fixed assets. EBITDAR, Operating income before depreciation and leasing costs - Operating income before net financial items, tax, depreciation, share of income in affiliated companies, income from the sale of fixed assets and leasing costs for aircraft. EBITDAR margin - EBITDAR divided by operating revenue. EBT - Income before tax.
Equity method - Shares in affiliated companies are taken up at the SAS Group’s share of shareholders’ equity, taking acquired surplus and deficit values into account. Equity/assets ratio - Shareholders’ equity plus minority interests in relation to total assets. EV (Enterprise Value) - Average market capitalization plus average net debt during the year and 7 times the net annual cost for operating leases for aircraft. Financial net debt - Interest-bearing liabilities minus interest-bearing assets, excluding net pension funds. Gross profit margin - Operating income before depreciation in relation to operating revenue. Interest coverage ratio - Operating income plus financial income in relation to financial expenses. Net debt - Interest-bearing liabilities minus interest-bearing assets. Return on capital employed (ROCE) - Operating income plus financial income in relation to average capital employed. Capital employed refers to total assets as specified in the balance sheet minus noninterest-bearing liabilities. Return on equity - Income after tax in relation to average shareholders’ equity. Revenue passenger kilometers (RPK) - See RPK. REVPAR, Revenue per available room - Revenue per available hotel room. RPK, Revenue passenger kilometers - Number of paying passengers multiplied by the distance they are flown in kilometers. Sale and leaseback - Sale of an asset (aircraft, building, etc.) which is then leased back. TSR, Total shareholder return - Average total return Unit cost, operational - Airline operations’ total operating expenses minus non-traffic related revenue per ASK. Unit cost, total - Airline operations’ total operating expenses including capacity costs for aircraft minus non-traffic related revenue per ASK. Unit revenue (yield) - Average traffic revenue per RPK. Yield - See Unit revenue.
SAS Group: Year-end report January-December 2003
24
Financial calendar Annual Report and Sustainability Report 2003 …………………………………………………………………………………..March 10, 2004 Annual General Meeting …..…………………………………………………………………………………………………………April 22, 2004 Interim Report 1, January-March 2004 .…………………………………………..…………………………………………………..May 4, 2004 Interim Report 2, January-June 2004 …….……………………………………………………………………………………...August 11, 2004 Interim Report 3, January-September 2004 …….…………………………………………………………………………….November 2, 2004 Year-end report 2004……………………………………………………………………………………………………….………February, 2005 Annual Report and Sustainability Report 2004………………………………………………………………………….…………….March, 2005
All reports are available in English and Swedish and can be ordered from SAS, SE-195 87 Stockholm, telephone +46 8 797 00 00, fax +46 8 797 51 10. The reports can also be accessed and ordered via the Internet: www.sasgroup.net The SAS Group’s monthly traffic and capacity statistics are normally published on the fifth working day of each month. The most recent updated financial calendar can be accessed at: www.sasgroup.net Investor Relations SAS Group: Sture Stølen +46 8 797 1451, e-mail: [email protected] Management: Jørgen Lindegaard, President and CEO Gunnar Reitan, Deputy CEO Gunilla Berg, Executive Vice President and CFO John Dueholm, Executive Vice President Sören Belin, Executive Vice President and COO Scandinavian Airlines Bernhard Rikardsen, Executive Vice President SAS AB (publ) Company reg. no. 556606-8499 Head Office: Frösundaviks Allé 1 SE-195 87 Stockholm Telephone +46 8 797 00 00 Board of Directors: Egil Myklebust, Chairman
Jacob Wallenberg, Vice Chairman Berit Kjøll, board member Fritz H. Schur, board member Anitra Steen, board member Lars Rebien Sørensen, board member Nicolas E. Fischer, board member Ulla Gröntvedt, board member John Lyng, board member
Production: SAS Group Printing: Redners Paper: G-Print