saponin removal from quinoa by abrasion processing …
TRANSCRIPT
SAPONIN REMOVAL FROM QUINOA BY ABRASION PROCESSING
A Thesis
presented to
the Faculty of California Polytechnic State University,
San Luis Obispo
In Partial Fulfillment
of the Requirements for the Degree
Master of Science in Agriculture with a Specialization in Food Science
by
Luke Lundberg
June 2019

ii
© 2019
Luke Lundberg
ALL RIGHTS RESERVED
iii
COMMITTEE MEMBERSHIP
TITLE: Saponin Removal from Quinoa by Abrasion Processing
AUTHOR: Luke Lundberg
DATE SUBMITTED: June 2019
COMMITTEE CHAIR: Gour Choudhury, Ph.D.
Professor of Food Science
COMMITTEE MEMBER: Luis Castro, Ph.D.
Assistant Professor of Food Science
COMMITTEE MEMBER: Michael Heying, Ph.D.
Assistant Professor of Chemical Engineering
iv
ABSTRACT
Saponin Removal from Quinoa by Abrasion Processing
Luke Lundberg
Quinoa is coated with a thin layer of saponins, glycosylated triterpenoids, that
produce a bitter flavor when consumed. The average saponin content in commercial
varietals from Bolivia average around 2.7% saponins and organoleptic testing shows the
threshold for noticing a bitter flavor is below 0.12% (Medina-Meza et al., 2016). Current
industrial processing methods use a combination of abrasion and turbulent water flow to
remove saponin. This study will address the following research question: How will grain-
to-grain and grain-to-surface abrasion affect the processing time to remove saponin from
quinoa? In particular, can effective saponin removal be achieved in less than 10 minutes
without washing with water?
Three different laboratory scale systems for generating grain-to-grain abrasion
alone and in combination with grain-to-surface abrasion were constructed. Preliminary
studies using mass balance and visual observation found the tubular system removed
4.45% of the quinoa mass in saponin containing fractions compared to the conical system
(1.33%) and fluidized bed (0.62%).
After preliminary studies, a saponin estimation method was adapted and the
conditions of the tubular system were determined. A randomized experiment was carried
out in triplicate at three levels of time (5, 10, and 15 minutes) and mass (200, 300, and
400 grams). The effect of surface roughness in the tubular system was also evaluated.
The samples were collected and saponin content in each sample was quantified using the
adapted method. The saponin levels were compared to commercially processed quinoa in
the market.
The processing conditions of 15 minutes at an input mass of 300 grams yielded
the lowest saponin level of 0.19%. The four processing conditions of (10 minutes/200
grams, 10 minutes/400 grams, 15 minutes/200 grams and 15 minutes/300 grams) were
statistically different (p<0.05) from the control (unprocessed quinoa). The effects of
process time, input mass, and the interaction between process time and input mass were
not statistically significant. The impact of surface friction on the removal of saponin
found no statistical difference (p < 0.05) between the samples. The quinoa processed by
the tubular system (15 minutes and 300 grams) had the lowest saponin level (0.19%)
compared to four commercially processed quinoa (0.21-0.31%).
The tubular system showed promise for reducing process time and saponin
content in commercially processed quinoa without washing. However, further
experimentation is needed for industrial implementation. The system would provide the
industry with a sustainable process with better saponin removal capacity.
Keywords: quinoa, saponins, abrasion, grain-to-grain, Saponin Quantification by UV−
Vis Spectrophotometry, tubular system, conical system, fluidized bed system
v
ACKNOWLEDGMENTS
I am very thankful for the privilege of working with my major advisor Dr. Gour
S. Choudhury. His support, patience, honest feedback and guidance could not go
unnoticed in the completion of this project. I am truly grateful for all he has done.
I would like to thank Lundberg Family Farms for their generous donations and
access to production and research staff. This project would have been challenging
without their support.
I would like to thank the members of my committee and graduate coordinator for
their dedication in seeing the project through to the end and providing meaningful
support and direction, Dr. Luis Castro, Dr. Michael Heying, and Dr. Stephanie Jung.
I would like to thank the Department of Food Science and Nutrition and
California Polytechnic State University, San Luis Obispo for allowing me to complete
this study in their facilities. I would like to acknowledge the financial support received
from the department.
Special thanks are due to the following individuals for assisting in the completion
of this project, Molly Lear, Dr. Michael La Frano, Erin Foote, Dr. Samir Amin, Fionna
Fahey, Heather Smith, and Rob Fanter.

vi
TABLE OF CONTENTS
Page
LIST OF TABLES ........................................................................................................... viii
LIST OF FIGURES ............................................................................................................ x
CHAPTERS
1. INTRODUCTION .......................................................................................................... 1
1.1. Statement of Problem ........................................................................................... 1
1.2. Research Question ................................................................................................ 2
1.3. List of Terms ......................................................................................................... 2
2. LITERATURE REVIEW ............................................................................................... 3
2.1. Origin and History of Quinoa ............................................................................... 3
2.2. Morphology of Quinoa ......................................................................................... 3
2.3. Climate Conditions for Growing Quinoa ............................................................. 5
2.4. Composition and Nutrition Value of Quinoa ........................................................ 5
2.5. Processing of Quinoa ............................................................................................ 8
2.5.1. Primary Processing .......................................................................................... 8
2.5.2. Removal of Saponins ...................................................................................... 9
2.5.3. Research in Saponin Removal ....................................................................... 15
2.5.4. Quantifying Saponin Content ........................................................................ 15
2.6. Consumption of Quinoa ...................................................................................... 17
3. MATERIALS AND METHODS .................................................................................. 18
3.1. Materials ............................................................................................................. 18

vii
3.2. Methods .............................................................................................................. 18
3.2.1. Design and Fabrication of Abrasion Equipment ........................................... 18
3.2.1.1. Conical System ........................................................................................ 18
3.2.1.2. Fluidized Bed System .............................................................................. 24
3.2.1.3. Tubular System ........................................................................................ 28
3.2.2. Experimentation ............................................................................................ 30
3.2.2.1. Preliminary Experiments with Conical, Fluidized Bed, and Tubular
Systems .................................................................................................... 30
3.2.2.1.1. Conical System. .................................................................................. 32
3.2.2.1.2. Fluidized Bed System. ........................................................................ 33
3.2.2.1.3. Tubular System ................................................................................... 34
3.2.2.1.4. Evaluation of System Performance .................................................... 35
3.2.2.1.4.1. Visual Observation ........................................................................ 35
3.2.2.1.4.2. Mass Balance ................................................................................ 36
3.2.2.2. Final Experiment with Tubular System ................................................... 36
3.2.3. Saponin Quantification Method .................................................................... 39
3.2.3.1. Adaptations to the Saponin Quantification Method................................. 39
3.2.3.2. Saponin Quantification using the Adapted Method ................................. 40
3.2.4. Data Analysis ................................................................................................ 42
4. RESULTS AND DISCUSSION ................................................................................... 44
4.1. Preliminary Experiments .................................................................................... 44
4.1.1 Conical System ............................................................................................... 44
4.1.2. Fluidized Bed ................................................................................................ 48
4.2.1. Final Adapted Method for Saponin Quantification ....................................... 53
viii
4.3. Final Experiment with Tubular System .............................................................. 54
4.3.1. Effectiveness of the System .......................................................................... 59
5. SUMMARY AND CONCLUSIONS ........................................................................... 62
REFERENCES ................................................................................................................. 63

ix
LIST OF TABLES
Table Page
2.1 Amino Acid Composition (mg/g Protein) of the Proteins in Quinoa and Other
Cereal Grains in Comparison to the WHO/FAO/UNU Scoring Pattern for Young
Children (6 Months to 3 Years) and Older Children, Adolescent, and Adult (3-10
Years). ........................................................................................................................... 7
3.1. Quinoa Varieties Used in this Study .......................................................................... 19
3.2. Summary of Building Materials................................................................................. 20
3.3. Summary of Chemical Reagents and Lab Supplies ................................................... 21
3.4. Equipment Used in this Study.................................................................................... 22
3.5. Experimental Design for Tubular System.................................................................. 37
3.6. Adaptations to the Method of Saponin Quantification .............................................. 41
4.1. Conical System Mass Balance Results ...................................................................... 45
4.2. Mass Balance Results from Fluidized Bed ................................................................ 49
4.3. Tubular System Mass Balance Results ...................................................................... 52
4.4 Saponin Content of Unscarified Quinoa Confirming the Validity of the Adapted
Method ........................................................................................................................ 53
4.5.ANOVA Results from DOE of Processing Conditions .............................................. 57

x
LIST OF FIGURES
Figure Page
2.1. Pictorial Representation of the Seed Structure of Quinoa (adapted from
(Scanlin and Lewis, 2017 )) ......................................................................................... 4
2.2. The Breakdown of the Nutritional Profile of Quinoa from Argentina into the
Major Macronutrients, Including Saponins and Tannins. (Adapted from
Gonzalez et al., 1989) ................................................................................................... 4
2.3. The Change in Levels of Total Saponins, Trypsin and Lipoxygenase in the
Different Grain Fractions and Their Proportion to the Whole Grain (Adapted
from Ando et al., 2002). ............................................................................................. 10
2.4. Values on a Dry Basis of Protein, Lipids, Sugar, Dietary Fiber, and Ash in the
Different Grain Fraction Components of Quinoa (Adapted from Ando et al.,
2002). ......................................................................................................................... 10
2.5. Effect of Washing and Abrasion on the Total Saponin Content of Quinoa. .............. 12
2.6. Process Flow Diagram of Quinoa Processing ............................................................ 14
2.7. System Design of Saponin Removal System Developed by Universidad
Privada Boliviana (UPB). ........................................................................................... 16
3.1. Design Concept of Conical System (not to scale) to Promote Grain-to-Grain
Abrasion. .................................................................................................................... 23
3.2. Tubular System Constructed for Saponin Removal................................................... 25
3.3. Design Concept of Fluidized Bed System (not to scale) to Promote Grain-to-
Surface and Grain-to-Grain Abrasion. ....................................................................... 26
xi
3.4. Fluidized Bed System Constructed for Saponin Removal.. ....................................... 27
3.5. Design Concept of Tubular System (not to scale) to Promote Grain-to-Surface
and Grain-to-Grain Abrasion. .................................................................................... 29
3.6. Tubular Abrasion System Constructed for Saponin Removal. .................................. 31
3.7. Methods Used for the Quantification of Saponin in Quinoa. .................................... 43
4.1. Processing Quinoa in a Conical Tank System. .......................................................... 46
4.2. Processing Quinoa in a Fluidized Bed System.. ........................................................ 50
4.3. Processing Quinoa in Tubular System. ...................................................................... 51
4.4. Linear Regression of the Standard Curve of Oleanolic Acid at 527 nm. .................. 55
4.5. Percent Saponin in Samples After Processing at Different Time and Mass
Combinations. ............................................................................................................ 56
4.6. Percent Saponin in Samples After Processing With Different Surface
Roughness and Different Input Mass. ........................................................................ 58
4.7. Percent Saponin in Samples White Quinoa (A) and Tricolor Quinoa (D) at
Different Points in Processing (unscarified, scarified, and scarified-washed). .......... 60
4.8. Difference in Saponin Levels Between Washed and Scarified White Quinoa
(A), White Quinoa (B), Washed Tri-Color Quinoa (C), and Washed Tri-Color
Quinoa (D). ................................................................................................................ 61
1
1. INTRODUCTION
Ancient grains are rapidly being rediscovered and commercialized to offer
wholesome foods to consumers (Scanlin and Lewis, 2017). Most grains contain an outer
hull, bran layer, or undesirable outer coating that must be removed to produce a safe and
high-quality consumer product. Energy intensive abrasive techniques and/or a significant
amount of washing with water are used to remove the various layers (Arendt and Zannini,
2013). Development of sustainable processing techniques for raw ancient grains is
important to provide consumer markets with safe and quality products.
One of the more popular ancient grains in the United States is quinoa. Quinoa is
coated with a thin layer of saponins, glycosylated triterpenoids, that produce a bitter
flavor when consumed. The average saponin content in commercial varietals from
Bolivia average around 2.7% (Medina-Meza et al., 2016). Quinoa that contains more than
0.11% by weight is classified as bitter and must be removed from the grain in order to be
edible (Nickel et al., 2016). Organoleptic acceptability testing showed that the maximum
saponin range for consumer liking is between 0.06% and 0.12% (Balize, D;Bertero, D;
Nieto, 2015). Current industrial methods for removal of saponins in quinoa utilize a
combination of abrasion and extraction with water (Medina-Meza et al., 2016).
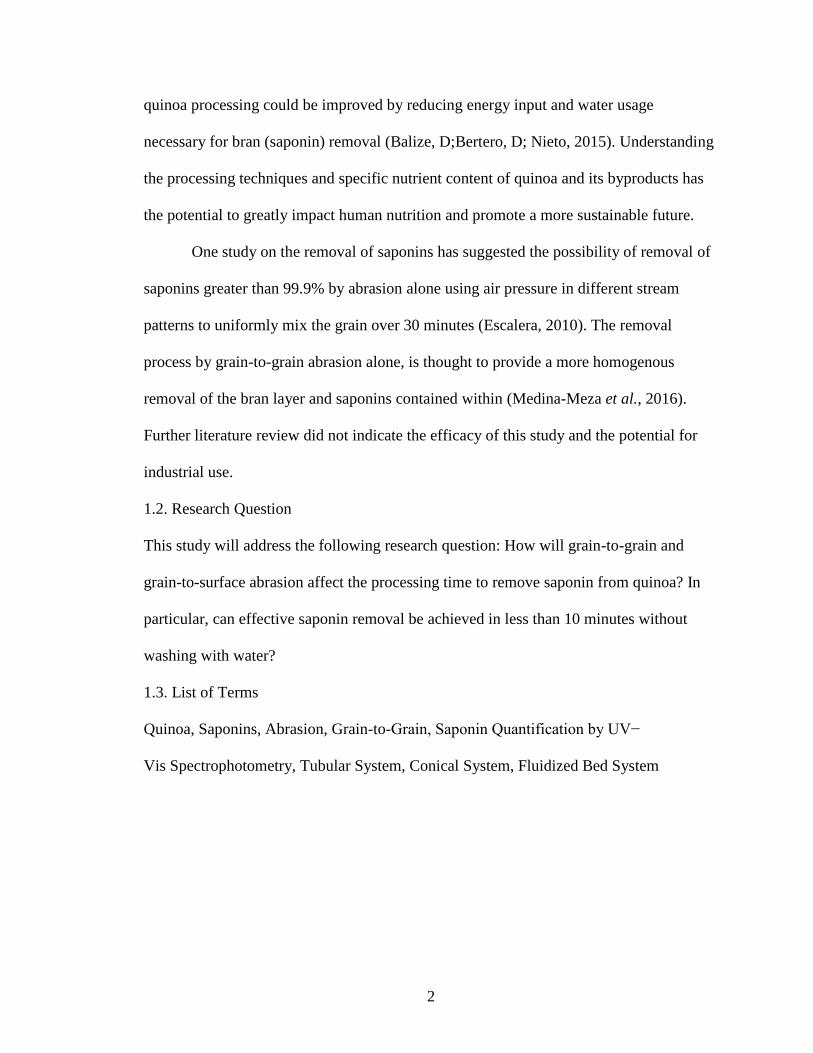
1.1. Statement of Problem
Industrial methods combine the use of mechanical energy and washing with water
to remove the saponins found within the bran. Mechanical processing utilizes abrasion
stones and grain to grain friction to remove an outer coating of saponins surrounding the
quinoa grain. Washing uses cold water with turbulent flow to extract the hydrophilic
saponins located on the surface of the grain (Ridout et al., 1991). The sustainability of
2
quinoa processing could be improved by reducing energy input and water usage
necessary for bran (saponin) removal (Balize, D;Bertero, D; Nieto, 2015). Understanding
the processing techniques and specific nutrient content of quinoa and its byproducts has
the potential to greatly impact human nutrition and promote a more sustainable future.
One study on the removal of saponins has suggested the possibility of removal of
saponins greater than 99.9% by abrasion alone using air pressure in different stream
patterns to uniformly mix the grain over 30 minutes (Escalera, 2010). The removal
process by grain-to-grain abrasion alone, is thought to provide a more homogenous
removal of the bran layer and saponins contained within (Medina-Meza et al., 2016).
Further literature review did not indicate the efficacy of this study and the potential for
industrial use.
1.2. Research Question
This study will address the following research question: How will grain-to-grain and
grain-to-surface abrasion affect the processing time to remove saponin from quinoa? In
particular, can effective saponin removal be achieved in less than 10 minutes without
washing with water?
1.3. List of Terms
Quinoa, Saponins, Abrasion, Grain-to-Grain, Saponin Quantification by UV−
Vis Spectrophotometry, Tubular System, Conical System, Fluidized Bed System

3
2. LITERATURE REVIEW
2.1. Origin and History of Quinoa
Quinoa originated around 5000 B.C in the Andean region of South America. The
native people of this region, the Incas, consumed quinoa as their main source of food.
When the Spanish settled in South America, they introduced new grains to the area, such
as wheat, rye and oats. Quinoa was pushed out to the undesirable farming land high in the
Andes. Around 1975, commercialization of quinoa began in Bolivia and Peru. Today,
Bolivia and Peru account for 90% of the production worldwide (Scanlin and Lewis,
2017). The price of quinoa rose more than 50% between 2000 and 2010 as health trends
drove its popularity in the EU and US (Arendt and Zannini, 2013). From 2010 to 2013,
new quinoa products in the US grew by almost 100% (Scanlin and Lewis, 2017). The
Smithsonian in Washington D.C. named quinoa, “the most nutritious grain in the world”
and it is continuing to rise in popularity.
2.2. Morphology of Quinoa
Quinoa is genus; Chenopodium and family; Chenopodiaceae (Arendt and Zannini,
2013). It is characterized as a pseudocereal grain, since it is defined as a seed,
distinguishing it from most other cereal grains like rice and wheat. The quinoa plant
grows between 1 and 3 meters high and is colored in whites, yellows and brownish reds.
The fruit, quinoa seed, is flattened and ranges in diameter of 1-3 mm. One seed is
produced from each flower. The three main anatomical parts of the fruit are the bran,
embryo and perisperm (Figure 2.1). The bran and perisperm are approximately 48% of
the seed weight and contains 22.9% protein and 7.4% saponin on a dry basis (Scanlin and
Lewis, 2017).

4
Carbohydrates76.25%
Protein12.90%
Lipids4.04%
Ash3.01%
Tannins1.70% Saponins
2.10%
Figure 2.1. Pictorial Representation of the Seed Structure of Quinoa
(adapted from (Scanlin and Lewis, 2017 )).
Figure 2.2. The Breakdown of the Nutritional Profile of Quinoa from
Argentina into the Major Macronutrients, Including Saponins
and Tannins. (Adapted from Gonzalez et al., 1989)

5
2.3. Climate Conditions for Growing Quinoa
Quinoa grows best in semi-arid regions and is well known as a hardy crop. There
is a large genetic variety of quinoa plants and it can be tailored to fit most growing
conditions. It can tolerate a temperature range of -4 C to 35 C, is salt and sand tolerant,
drought tolerant and tolerant of atmospheric conditions up to 3800 m (Scanlin and Lewis,
2017). After commercialization, current yields of quinoa in Peru and Bolivia are around
1.93 t/ha.
2.4. Composition and Nutrition Value of Quinoa
The nutritional benefits of quinoa make it a very desirable addition to any diet.
Quinoa is most well recognized as a plant-based protein source. The protein content
ranges from 12.5-16% and is higher than any other cereal grain (Figure 2.2). Quinoa is
well-balanced in all essential amino acids (EAA) except for leucine but is still adequate
enough to meet the nutritional standards of the WHO, FAO, and UNU and is the only
plant source that provides all EAAs comparable to casein according to the FAO nutrition
standards (Table 2.1). Of the essential amino acids present, quinoa is especially high in
lysine and histidine. The protein digestibility of quinoa is around 50.7% milled compared
to a milk casein control of 45.8%. The lipid content of quinoa ranges from 5-7% with the
majority being polyunsaturated (56%) and monounsaturated (25%). The fat is well
protected from oxidation due to high levels of Vitamin E (Scanlin and Lewis, 2017). The
carbohydrate content is mainly starch ranging from 32-69% depending on varietal and the
remainder is comprised of fiber. Quinoa starch gelatinizes between 55 C and 73 C.
Amylopectin comprises a large amount of the starch and provides a hindrance to
retrogradation with superior freeze thaw stability. Maltose, D-ribose and D-galactose are

6
the main sugars with low levels of glucose and fructose. The fiber content ranges from 8-
13%, of that, 78% is insoluble and 22% is soluble (Ando et al., 2002). The soluble fiber
range is similar to that of fruits and vegetables opposed to that of cereal grains. Quinoa is
rich in vitamins of which include; vitamin A precursor β-carotene, thiamin/vitamin B1,
riboflavin/ vitamin B2, niacin/vitamin B-3, ascorbic acid/vitamin C, folic acid/vitamin B9
and vitamin E B6, and pantothenic acid (Kozioł, 1992). Quinoa does not contain any
fractions of gluten, it does contain some very small amount of prolamins, and is
considered to be allergen free (Scanlin and Lewis, 2017). However, quinoa contains
various anti-nutritional components which are phytate phosphate, saponins, trypsin and
lipoxygenase. Saponins are the largest group by mass and contribute the most to the bitter
taste of quinoa.
Saponins function in quinoa is very important in preserving the seed of the quinoa
plant from insect and fungal attack (Simmonds, 1965). The saponins are located in the
pericarp (bran) of the grain and can be removed by abrasion polishing or washing with
water. Typical removal reduces the saponins to around 0.11% with a yield loss of 5%
(Scanlin and Lewis, 2017). It is difficult to remove all of the saponin without removing
all of the pericarp (bran). Saponins are composed of various structural arrangements of
triterpenoids or steroid glycosides. The variation results from the number and position of
sugar units attached to the hydrophobic aglycon. Quinoa saponins are glycosylated
triterpenoids. The most common saponin by mass is phytolaccagenic acid (Medina-Meza
et al., 2016). Other saponins commonly found in lower quantities are oleanolic acid and
hederagenin saponins (Ridout et al., 1991).The typical concentration of saponins in
quinoa ranges from 0.01%-5% (Medina-Meza et al., 2016). Quinoa that contains more

(EAA- Essential Amino Acid) a Corn grain, yellow, No. 20014. b Quinoa, uncooked, No. 20035. c Rice, white, long-grain,
regular, raw, unenriched, No. 20444. d Wheat, hard red winter, No. 20072. a,b,c,d Source: USDA National Nutrient Database
for Standard Reference Release 28. Retrieved Oct. 16, 2015 (adapted from (Scalin and Lewis, 2017)) . Bold lettering
signifies essential amino acids.
Table 2.1. Amino Acid Composition (mg/g Protein) of the Proteins in Quinoa and Other Cereal Grains in Comparison
to the WHO/FAO/UNU Scoring Pattern for Young Children (6 Months to 3 Years) and Older Children,
Adolescent, and Adult (3-10 Years).
Amino Acid mg/kg protein
WHO/FAO/UNU Scoring pattern
(mg/kg protein)
Corn a Quinoa b Rice c Wheat d Young Children Adult
Alanine 75 42 58 36 NA NA
Arginine 50 77 83 47 NA NA
Aromatic amino acids
(EAA) 90 61 86 78 52 41
Aspartic acid 70 80 94 51 NA NA
Glutamic acid 188 132 195 317 NA NA
Glycine 41 49 46 42 NA NA
Histidine (EAA) 30 29 24 23 20 16
Isoleucine (EAA) 36 36 43 36 32 30
Leucine (EAA) 123 59 83 68 66 61
Lysine (EAA) 28 54 36 27 57 48
Proline 87 55 47 102 NA NA
Serine 47 40 53 46 NA NA
Sulfur amino acids (EAA) 39 36 44 42 27 23
Threonine (EAA) 38 30 36 29 31 25
Tryptophan (EAA) 7 12 12 13 8.5 6.6
Valine (EAA) 51 42 61 44 43 40

8
than 0.11% by weight is classified as bitter and must be removed from the grain in order
to be pleasing to the taste (Nickel et al., 2016).Organoleptic acceptability testing showed
that the maximum saponin range for consumer liking is between 0.06% and 0.12%
(Balize, D;Bertero, D; Nieto, 2015). Breeding has become a new focus in saponin
reduction within quinoa. New varietal strains of “sweet’ quinoa are being developed. The
average saponin content in commercial varietals from Bolivia average around 2.7%
saponins. New varietals are being produced with an average of less than 1% saponins to
reduce the amount of processing required (Medina-Meza et al., 2016).
2.5. Processing of Quinoa
2.5.1. Primary Processing
Industrial processing of quinoa is essential to provide a consumer or supplier with
clean quinoa that is free of impurities as well as saponins. The grain being processed
includes both hand harvested grain as well as combine harvested. The processing process
is set up to handle conditions from both harvesting methods, although some steps may
not be as necessary as others. Preliminary sorting is completed with different sized
sieves. A plate perforated with 3 mm diameter openings topped with a woven mesh of 1.2
mm between threads separates out the 5 products streams. The five streams include: 1.
particulate matter, 2. light course impurities, 3. first grade grain, 4. second grade grain
and 5. heavy impurities. Particulate matter includes dust from transport and harvest as
well as saponins that have been removed from grain to grain contact during harvesting
and transportation. Light course impurities are pieces of the quinoa plant or twigs and
leaves collected during harvest or transport.

9
First grade grain is quinoa that has a diameter greater than 2.2 mm and accounts
for 90-95% of the grain processed. Second grade grain has a dimeter less than 2.2 mm.
This grain is returned to the farmer or sold for a lower price. Heavy impurities are stones
and are most prevalent in quinoa that is hand harvested. The grain is then stored in silos
or totes until ready to be processed.
2.5.2. Removal of Saponins
An understanding of the nutritional composition of quinoa and the high
percentage of saponins present, reveal why processing is required to remove saponins and
create an edible grain. Whole quinoa grain is broken down into three main structural
components: bran, embryo, and perisperm. The bran is the outermost layer surrounding
the embryo. The embryo covers the perisperm, the innermost layer, like a headband. The
bran is removed during processing as it contains 86% of saponins compared to the other
grain fractions (Figure 2.3). The embryo and perisperm contain 11% and 3% saponins,
respectively (Figure 2.3).
The two main forms of saponin removal are abrasion and washing. Abrasion is
most common as it removes the outer bran layer by mechanically rubbing the grain
together against itself or a stone (Balize, D;Bertero, D; Nieto, 2015). Often processing
techniques involve a wash step following abrasion to further reduce the level of saponins
(Ridout et al., 1991). However, for some grains that have higher amounts of saponins, if a
wash step is not employed, the embryo is the next outer layer after the bran that is
partially reduced (Balize, D;Bertero, D; Nieto, 2015). The embryo is the largest source of
nutritional elements as it contains 57% protein, 49% lipids, 20% sugar, 45% dietary fiber
and 51% ash of the whole grain (Figure 2.4). Removal techniques that leave the embryo

10
96%
4%
39%
57%
95%
5%
46%
49%
93%
7%
73%
20
%
84%
16
%
39% 4
5%
76%
24
%
25
%
51%
MILLED GRAIN
(BRAN
REMOVED)
BRAN PERISPERM EMBRYO
PE
RC
EN
T C
OM
PO
SIT
ION
GRAIN FRACTION
Protein Lipid Sugar Dietary Fiber Ash
10
0%
95
%
5%
35
%
60
%
10
0%
14
%
86
%
3% 1
1%
10
0%
99
%
1% 1
0%
89
%10
0%
10
0%
0%
38
%
62
%
WHOLE
GRAIN
MILLED
GRAIN
(BRAN
REMOVED)
BRAN PERISPERM EMBRYO
PE
RC
EN
T C
OM
PO
SIT
ION
GRAIN FRACTION
Phytate phosphate (mg/mg%)Total saponin (mg/mg%)Trypsin inhibitor activity (units/g)
Figure 2.3. The Change in Levels of Total Saponins, Trypsin and Lipoxygenase in
the Different Grain Fractions and Their Proportion to the Whole
Grain (Adapted from Ando et al., 2002).
Figure 2.4. Values on a Dry Basis of Protein, Lipids, Sugar, Dietary Fiber, and Ash in
the Different Grain Fraction Components of Quinoa (Adapted from Ando
et al., 2002).

11
intact, preserve the complete nutritional profile of quinoa. Washing for saponin removal
takes significantly more time to process than abrasion. Washing alone ranges from 5 to
30 minutes a cycle, while abrasion alone ranges from 30-150 seconds (Nickel et al.,
2016; Balize, D;Bertero, D; Nieto, 2015) ). Thirty minutes of washing with agitation
reduced the saponin content of 1% to .23% (Figure 2.5). Additional washing continues to
remove saponins, but not at the same rate. After an additional 60 minutes of washing total
saponin content was reduced to 0.18% (Figure 2.5). Abrasion alone after 30 s reduced
saponin levels from 1.19% to .45%. After an additional 2 min the saponin level was
reduced to 0.21% (Figure 2.5). Washing alone increased the saponin percentage of
oleanolic acid, while decreasing phytolaccagenic acid. On the other hand, abrasion
decreased the percentage of oleanolic acid, while increasing phytolaccagenic acid. These
differences are correlated to the chemical structure of the specific saponin and the
location within the bran layer. Another study washed quinoa under running water with
manual rubbing for 15 min and found a reduction of 3.33% to 2.75%. Hydrating the
quinoa without manual rubbing increased the saponin levels from 3.33% to 3.63%.
Washing combined with cooking reduced the original saponin level to 2.5% (Nickel et
al., 2016).
The use of cold water as being the most important factor alongside agitation or
rubbing was noted in both studies and warm water was attributed to the lower reduction
of saponins in the second study. The use of both water and abrasion is useful in further
reducing saponins to an acceptable level and reducing the different types of saponins
present. Quinoa’s only need for processing is to remove the outer coating of saponins
present on all varieties of quinoa. Hulling or scarification removes the outer layer of

12
Figure 2.5. Effect of Washing and Abrasion on the Total Saponin Content of Quinoa.
Washing was carried out on material from the 1987 harvest (original saponin
content 1.03 %). Abrasion was conducted on the 1988 material (original
saponin content 1.19 %). (Adapted from Ridout et al., 1991)
13
saponins and some of the bran by mechanical abrasion. A cylindrical drum with metal
protruding ribs (8-12 mm wide) mounted to a revolving rotor (1200-1600 rpm) presses
the grains against each other to produce abrasion. The intense friction against the grains
provides uniform wearing down of the bran, and reduces the damage done to the embryo.
The bottom of the cylindrical drum is perforated with a metal plate to allow saponins, in
powder form, to fall through. The abrasion process removes 90-95% of saponins.
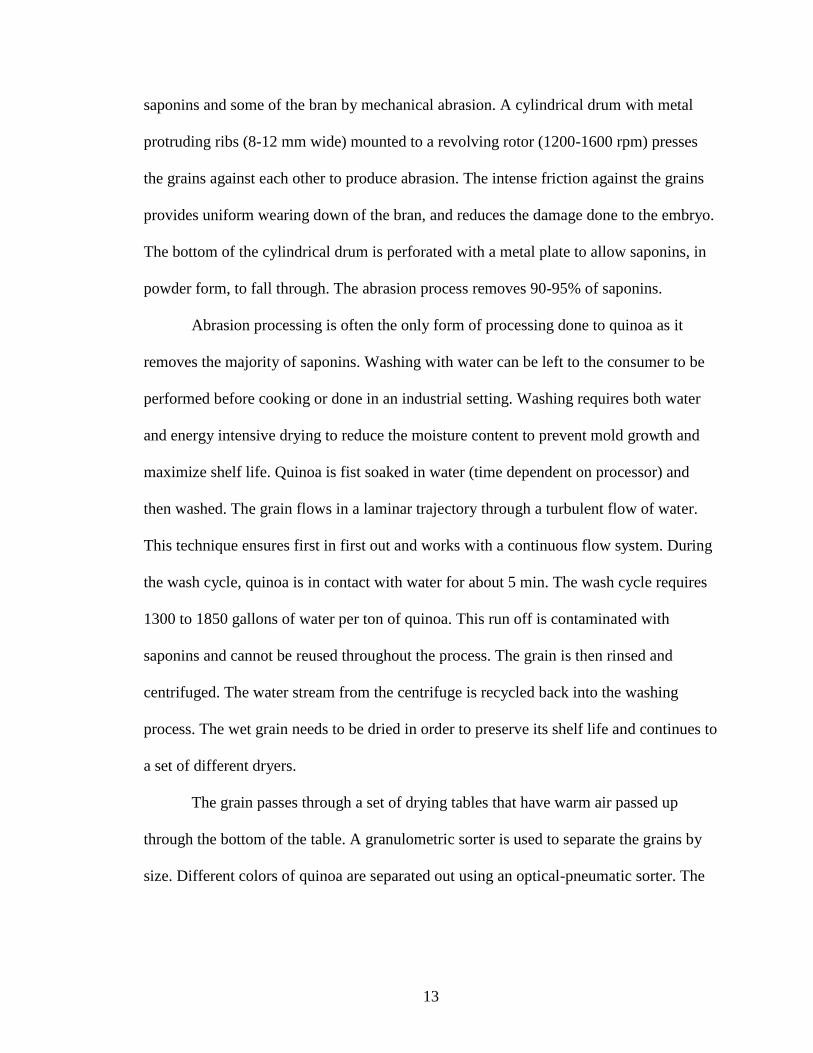
Abrasion processing is often the only form of processing done to quinoa as it
removes the majority of saponins. Washing with water can be left to the consumer to be
performed before cooking or done in an industrial setting. Washing requires both water
and energy intensive drying to reduce the moisture content to prevent mold growth and
maximize shelf life. Quinoa is fist soaked in water (time dependent on processor) and
then washed. The grain flows in a laminar trajectory through a turbulent flow of water.
This technique ensures first in first out and works with a continuous flow system. During
the wash cycle, quinoa is in contact with water for about 5 min. The wash cycle requires
1300 to 1850 gallons of water per ton of quinoa. This run off is contaminated with
saponins and cannot be reused throughout the process. The grain is then rinsed and
centrifuged. The water stream from the centrifuge is recycled back into the washing
process. The wet grain needs to be dried in order to preserve its shelf life and continues to
a set of different dryers.
The grain passes through a set of drying tables that have warm air passed up
through the bottom of the table. A granulometric sorter is used to separate the grains by
size. Different colors of quinoa are separated out using an optical-pneumatic sorter. The
14
Figure 2.6. Process Flow Diagram of Quinoa Processing

15
sorting process takes two to three runs to achieve adequate color sorting. Typical yield
loss during processing is acceptable at 5% (Figure 2.6).
2.5.3. Research in Saponin Removal
Industrial saponin removal systems utilize both abrasion and contact with water to
remove saponins from quinoa. Small scale abrasion and wash systems have been
constructed that are able to process 12 kg of quinoa in 7 minutes. However, small scale
system times have not been achieved in large scale industrial use.
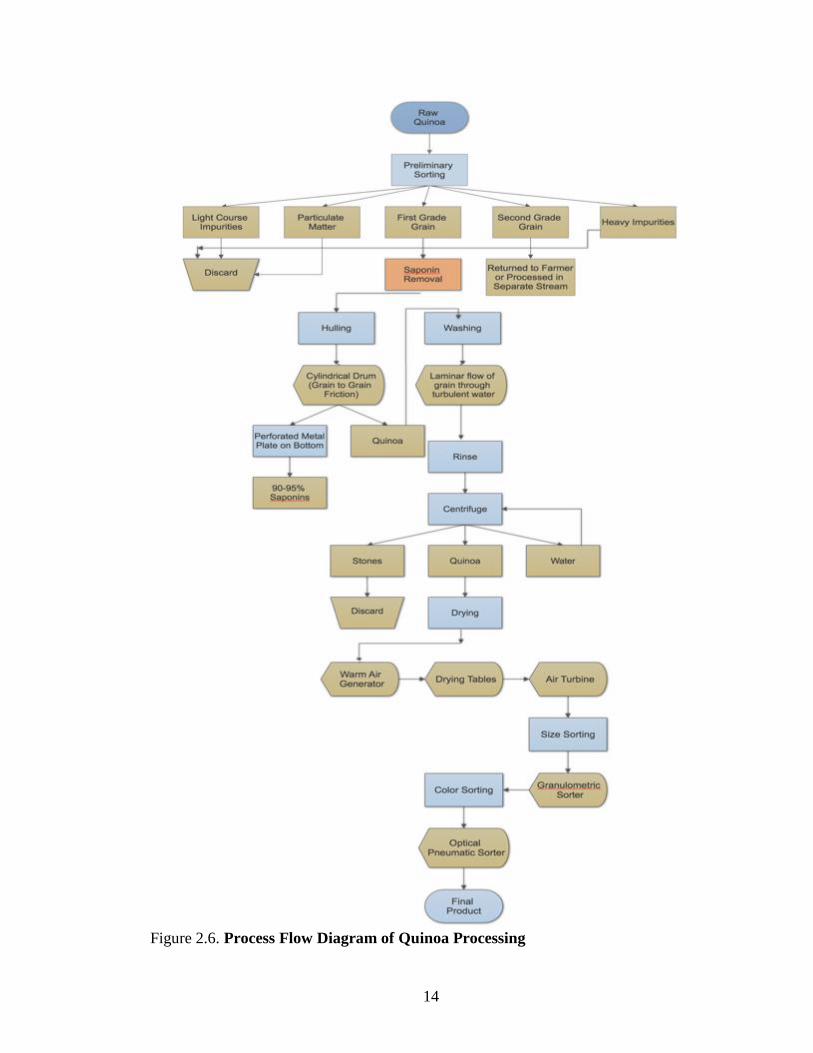
Researchers have been working to develop methods of removal that do not use
water. “In 2010, a group of researchers at the Universidad Privada Boliviana (UPB)
developed a laboratory model of a novel application of the spouted bed that is commonly
used to dry cereal grain (Figure 2.7). In less than 30 minutes, the dry process reduced the
saponin concentration in the grains to < 0.01% (Escalera Vásquez et al., 2010).” The
method for saponin quantification after processing was not stated. This method forces air
through the center of the quinoa, creating a central channel. The grain continues to shoot
up the center channel, fall down onto the top of the bed of quinoa at the top of the container
and then make its way back down until it is forced back up the central channel. This design
utilizes grain to grain friction as the primary driver of removal.
2.5.4. Quantifying Saponin Content
Few instant methods exist for the quantification of saponins in quinoa. The
afrosimetric method is one of the quantifiable rapid methods of extraction that exists for
measuring saponin content in a substance. Raw quinoa is agitated with water which
produces a layer of foam on the surface of the quinoa water mixture. The height of the
foam that remains after 15 minutes is used to quantify the amount of saponins present
16
Figure 2.7. System Design of Saponin Removal System Developed by
Universidad Privada Boliviana (UPB). A- Operation of saponin
removal system. B- System design of saponin removal system.
(Pictures sourced from Escalera Vásquez et al., 2010)
A B

17
(Medina-Meza et al., 2016). This provides a subjective estimate for measuring the final
product during processing but is not as precise as other laboratory methods. The most
current lab methods of extraction and quantifying saponin are by UV−Vis
Spectrophotometry and GC Mass Spectrophotometry reported by Ilce G. Medina-Meza,
Nicole A. Aluwi, Steven R. Saunders, and Girish M. Ganjyal (2016).
2.6. Consumption of Quinoa
Quinoa is consumed in many different ways, typically dependent on the
geographic location. The most common consumption of quinoa is cooked in the whole
grain form. Quinoa grains in the whole form are also consumed pasteurized, sprouted,
toasted, and boiled. The grain is also milled as flour, extruded, puffed, processed into
flakes or fermented as a beverage. In South America, a quinoa drink, similar to rice milk,
is a popular way to consume quinoa.

18
3. MATERIALS AND METHODS
3.1. Materials
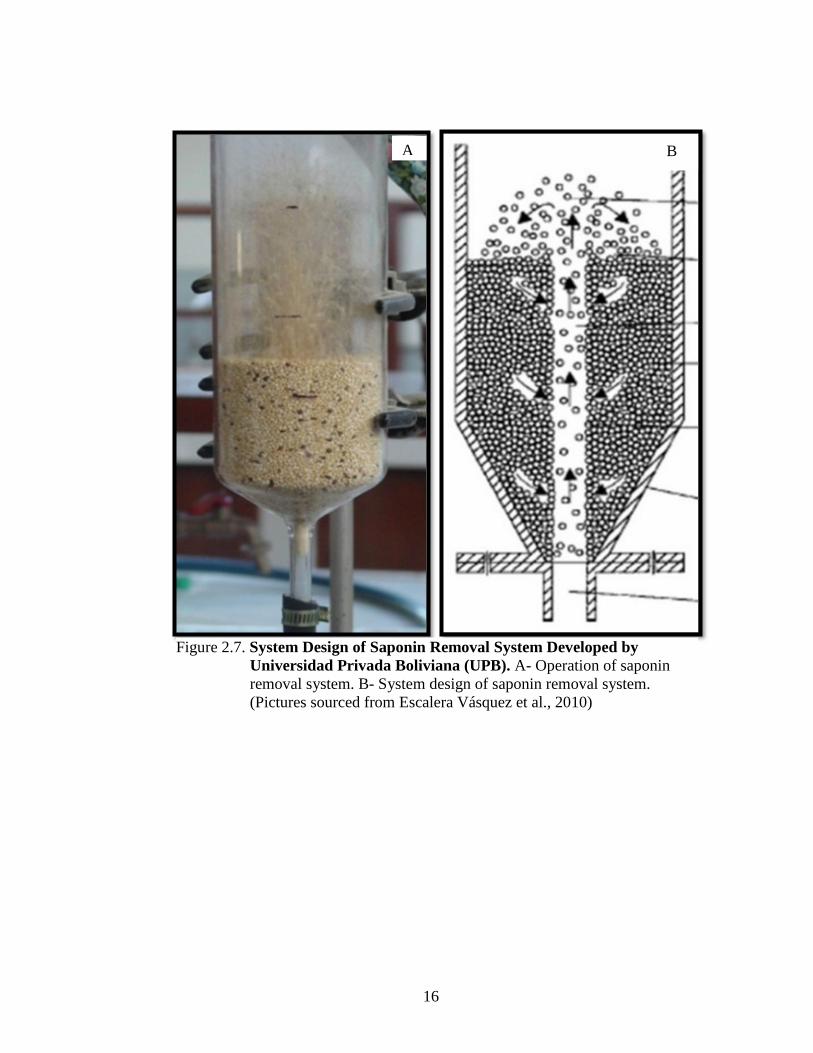
The quinoa used during experimentation was a blend of three different quinoa
varieties and are listed in Table 3.1. The three varieties are structurally different and have
different levels of saponin. Current industry practice is to grow and process the grain as a
blend. Sampling procedures were developed in order to ensure that samples were
representative of the population and current industry practice. The quinoa was harvested
and combined into 1 large storage bin. Three 25-pound bags were filled from the bin and
stored at California Polytechnic State University San Luis Obispo under refrigeration at
50°F.
The materials listed in Table 3.2. were used to fabricate the different saponin
removal systems. Chemical reagents were sourced from both Fisher Scientific and Sigma
Aldrich. The equipment listed in Table 3.3. was used to carry out fabrication and
experimentation of the saponin removal systems and the quantification of saponin.
3.2. Methods
3.2.1. Design and Fabrication of Abrasion Equipment
3.2.1.1. Conical System
Past research in saponin removal provided the basic concept of design (Figure
3.1.). The design is based on grain-to-grain friction principals at work and was adapted
from the work of Escalera Vásquez et.al, (2010). A conical tank was inverted to replicate
the design of this system. The system design focuses on grain to grain abrasion. A
detailed design is shown in Figure 3.1.
A 3-gal carboy was inverted to make a conical shaped container. A 3-in diameter
Table 3.1. Quinoa Varieties Used in This Study.
Quinoa Variety Procured from Supplier’s Address Purpose
Unscarified Tri Color Quinoa Lundberg Family Farms 5311 Midway, Richvale, CA 95974 Saponin Removal
Experimentation
Washed White Quinoa
Scarified White Quinoa
Unscarified White Quinoa
Company A N/A
Eval
uat
ion o
f S
yst
ems
Washed White Quinoa Company B N/A
Washed and Rinsed Tri Color
Quinoa Company C N/A
Washed Tri Color Quinoa
Scarified Tri Color Quinoa
Unscarified Tri Color Quinoa
Company D N/A

Table 3.2. Summary of Building Materials.
Fabrication Materials and Tools Procured from Supplier’s Address Purpose
Polycarbonate Tubing, 1 7/8" ID x 2" OD x 1/16" Wall, 48" L
5-gallon bucket with lid
8-gallon plastic bags
2” crimped wire wheel with 24” extension
2”x 1.5” PVC bushing
1.5”x1.25” PVC bushing
3-gallon polycarbonate carboy
Angle aluminum, 0.75”x0.0625”
12”x12” household HEPA filter
25 ft 0.5” air hose
Duct tape
Spring Clamps
Great Stuff foam sealant
Quad OSI sealant
3” plastic mesh tubing
3” PVC T joint to 2”
3” PVC T joint
3” PVC pipe
2” PVC cap
3” square gutter drain adapter
2” Ball valve
2” 90 angle
1/8 in. x 3 ft. x 100 ft. 27-Gauge Hardware Cloth
20-gauge galvanized wire
Dyna Flex 230 Sealant3
Home Depot
1551 Froom Ranch Way,
San Luis Obispo, CA
93405
Fab
rica
tion o
f sa
ponin
rem
oval
sy
stem
s an
d e
xper
imen
tati
on
wit
h t
he
syst
ems
0.25” female & male quick release air hose fitting
Digital air pressure gauge and filter
Harbor Freight
277 Higuera St, San Luis
Obispo, CA 93401
Icona Bay PET sheets 24”x36”x0.03”
Rubber stopper, size 10
Amazon N/A

Table 3.3. Summary of Chemical Reagents and Lab Supplies.
Chemical Reagents or Lab Materials Procured from Supplier’s Address Purpose
Ammonium Hydroxide, 4M, A.C.S Reagent
Sodium sulfate, A.C.S Reagent, Anhydrous
Oleanolic acid ≥97%
Sigma -Aldrich 2033 Westport Center Dr, St.
Louis, MO 63146
Chem
ical
rea
gen
ts f
or
saponin
est
imat
ion a
nd
quan
tifi
cati
on
Hydrochloric acid 6M
Ethyl acetate
Petroleum Ether, certified ACS
Methanol, certified ACS
Sulfuric acid, 17.8 M
Glacial acetic acid, Certified ACS, 17.4 M
Fisher Scientific
6722 Bickmore Ave, Chino, CA
91710
Lab
suppli
es f
or
saponin
est
imat
ion
and q
uan
tifi
cati
on
Standard Cuvette Mat.: PMMA
20 mL Scintillation Vials with Caps
50 mL Centrifuge Tubes with Caps and Bases
Fisher Scientific
6722 Bickmore Ave, Chino, CA
91710
Cellulose thimble 26x60mm Mat.:15220018
Cotton, defatted Mat.: 15290009 Foss
6 Louyang Rd, SIP, Suzhou P.R
China 215121
Pyrex 60 Filter
Chemglass boiling flasks 125 mL & 250 mL
Other Assorted Glassware
California
Polytechnic State
University
San Luis Obispo, CA 93407
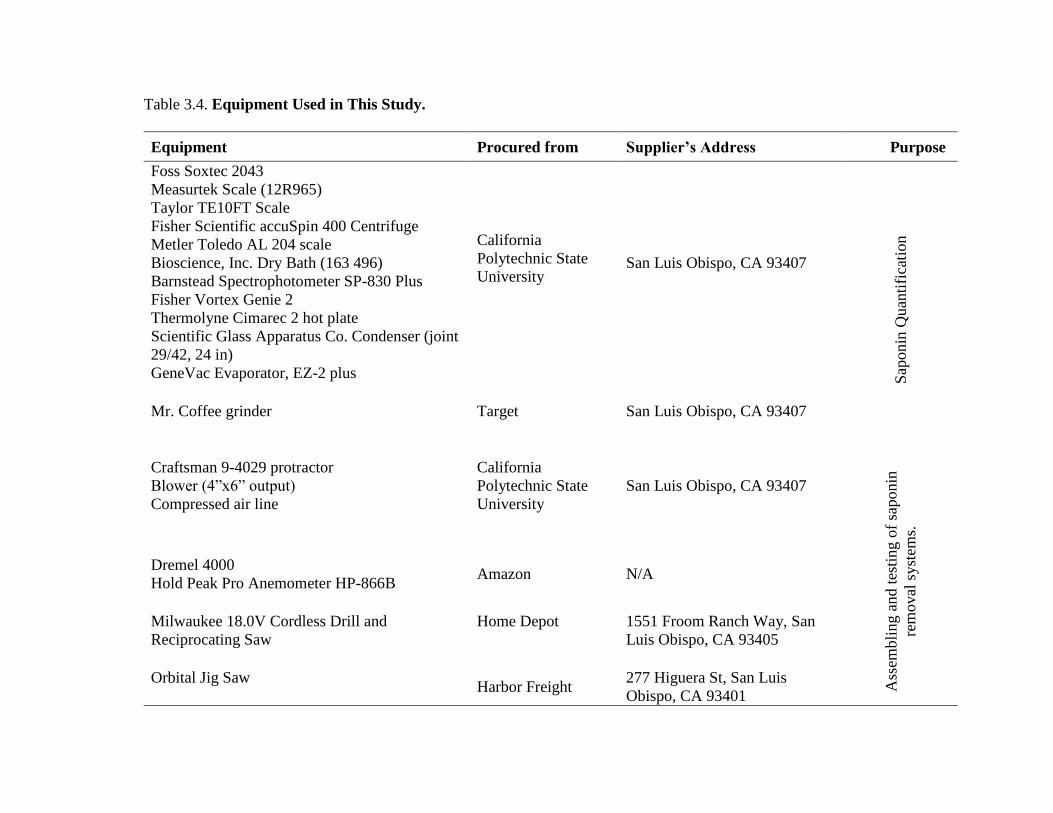
Table 3.4. Equipment Used in This Study.
Equipment Procured from Supplier’s Address Purpose
Foss Soxtec 2043
Measurtek Scale (12R965)
Taylor TE10FT Scale
Fisher Scientific accuSpin 400 Centrifuge
Metler Toledo AL 204 scale
Bioscience, Inc. Dry Bath (163 496)
Barnstead Spectrophotometer SP-830 Plus
Fisher Vortex Genie 2
Thermolyne Cimarec 2 hot plate
Scientific Glass Apparatus Co. Condenser (joint
29/42, 24 in)
GeneVac Evaporator, EZ-2 plus
California
Polytechnic State
University
San Luis Obispo, CA 93407
Sap
onin
Quan
tifi
cati
on
Mr. Coffee grinder Target San Luis Obispo, CA 93407
Craftsman 9-4029 protractor
Blower (4”x6” output)
Compressed air line
California
Polytechnic State
University
San Luis Obispo, CA 93407
Ass
emb
ling a
nd t
esti
ng o
f sa
ponin
rem
oval
syst
ems.
Dremel 4000
Hold Peak Pro Anemometer HP-866B Amazon N/A
Milwaukee 18.0V Cordless Drill and
Reciprocating Saw
Home Depot 1551 Froom Ranch Way, San
Luis Obispo, CA 93405
Orbital Jig Saw Harbor Freight
277 Higuera St, San Luis
Obispo, CA 93401

23
Figure 3.1. Design Concept of Conical System (not to scale) to
Promote Grain-to-Grain Abrasion.

24
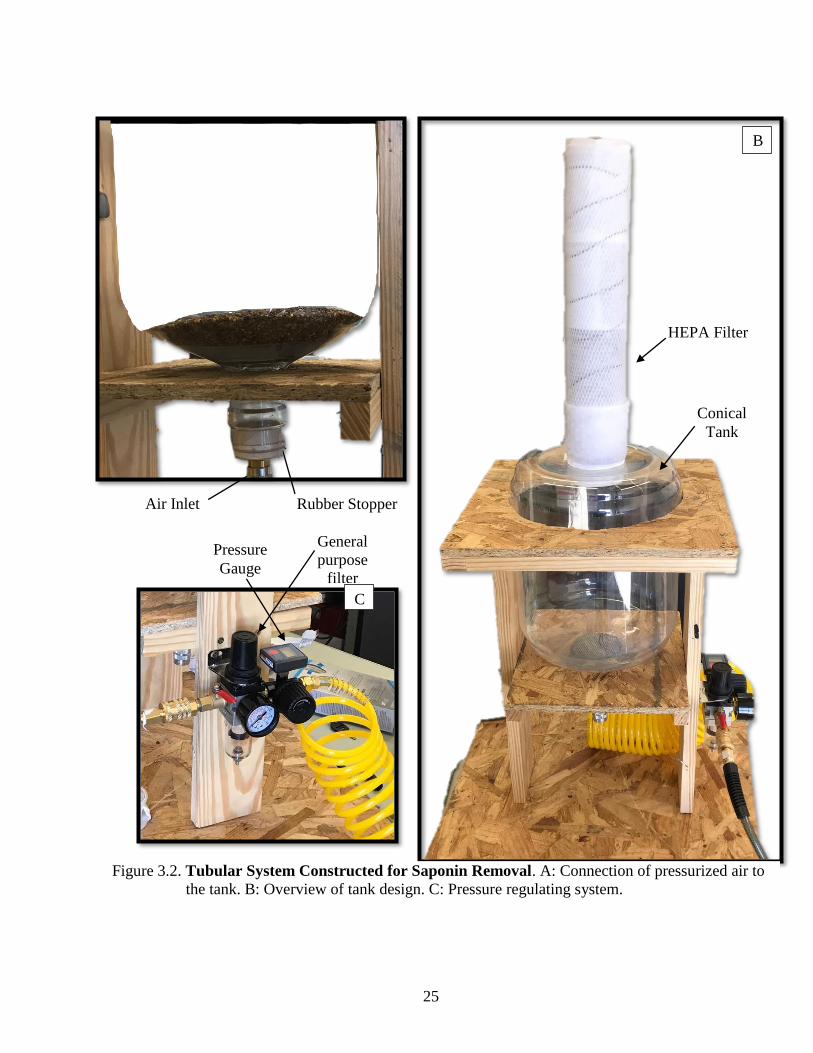
hole was cut out of the top of the carboy and a vertical HEPA filter was attached. The
bottom of the tank was plugged with a rubber carboy bung (Figure 3.2.A). The bung was
drilled out with a ¼-inch hole and a ¼-inch air hose fitting was glued into the hole. The
carboy was mounted to a wooded frame for support and to keep the tank level. The tank
was not attached to the wood, but rested on the top of the tank, so the tank could easily be
removed for cleaning (Figure 3.2.B). The air was sourced from a central air composer
and passed through an air filter and moisture trap. The air was then passed through a
digital pressure gauge before it reached the bottom of the tank (Figure 3.2.C). An air filter
was constructed from metal mesh that was glued into a 12-inch cylinder with a 3-inch
diameter. HEPA filter was wrapped around the mesh, covering all sides except the
bottom of the filter that was firmly inserted into the top of the tank. A piece of wire was
wrapped around the filter 8 times to keep the filter snug against the metal mesh. Samples
were loaded in through the top and then the air filter was snugly inserted back into the
hole.
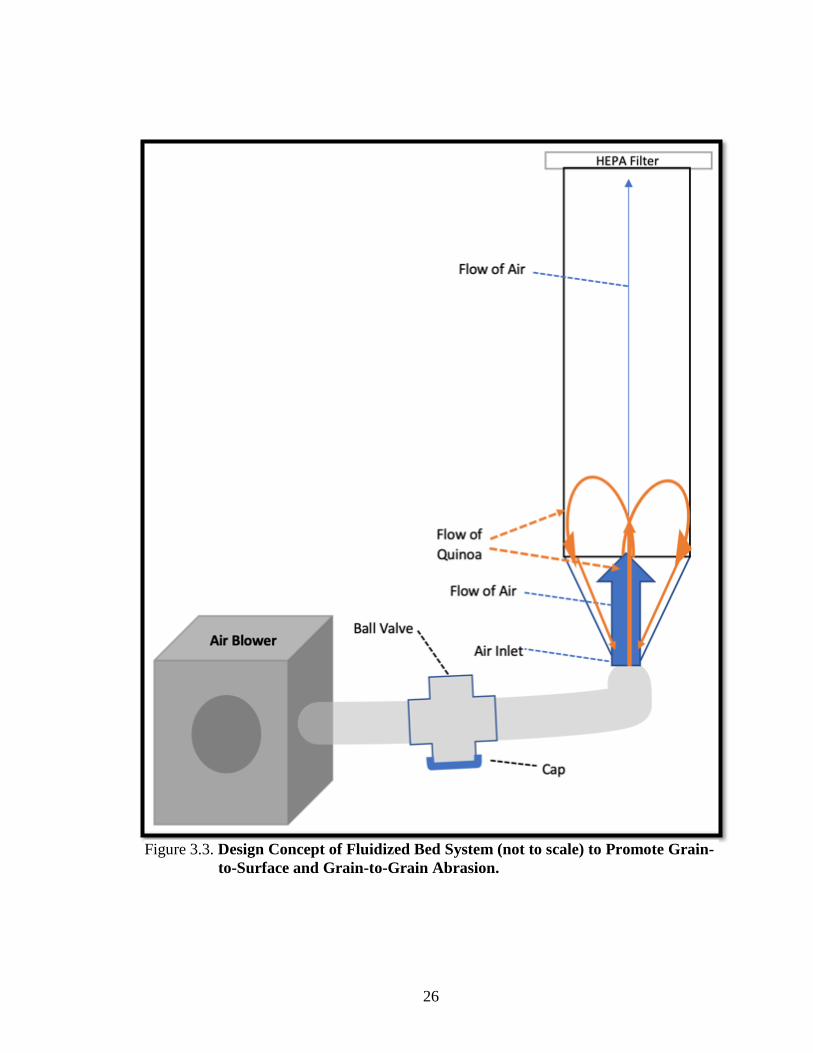
3.2.1.2. Fluidized Bed System
In an effort to reduce processing times even more to an industrial scale, (of 7
minutes or less) the addition of friction for the surrounding surfaces was integrated into a
fluidized bed system. This system was designed to increase the constant rubbing of the
grain on the surface of the bed sides (Figure 3.3.). The increase in surface area to mass
was designed to increase external surface abrasion as well as promote grain to grain
abrasion. Plexiglass panels were cut to make a 36x6x12-inch rectangle (Figure 3.4.A).
The ends were glued to 1-inch aluminum angle iron. The bottom side was then glued to a
25
Pressure
Gauge
General
purpose
filter
HEPA Filter
Conical
Tank
Air Inlet Rubber Stopper
Figure 3.2. Tubular System Constructed for Saponin Removal. A: Connection of pressurized air to
the tank. B: Overview of tank design. C: Pressure regulating system.
A B
C
26
Figure 3.3. Design Concept of Fluidized Bed System (not to scale) to Promote Grain-
to-Surface and Grain-to-Grain Abrasion.

27
Figure 3.4. Fluidized Bed System Constructed for Saponin Removal. A: Side
view of system not connected to the blower. B: Connection of air to the
system. C: Blower setup.
A B
C

28
6x12-inch air register. The inside seam of the air register and the plexiglass was
smoothed out with calking to prevent quinoa from collecting in the joint. The air register
was connected to a 6-inch to 4-inch reducer (Figure 3.4.B). At the bottom of the reducer
(4-inch side) fine screen mesh was duct taped around the bottom of the reducer to prevent
quinoa from falling into the blower. All internal seams of the air register were calked and
smoothed. The reducer was connected to a 2-foot duct that was connected to an industrial
blower. A double layer of drain pipe sock was inserted in between the connection to the
blower to reduce the flow of air. The blower was fitted with two outlets (Figure 3.4C).
One was connected to the fluidized bed and the other to a 2-inch ball valve which was
used to control the air flow. The system was built onto a wooden frame that held the
system 30-inch above the ground. The top of the system was mounted with a 1-inch angle
iron frame that fit to the outside dimensions of the top of the rectangle. The top of the
angle iron frame was fitted with padded tape to allow for a tight seal with an air filter. A
6x12-inch HEPA filter was placed onto the top of the angle iron and the sides were
clamped down tight with spring clamps.
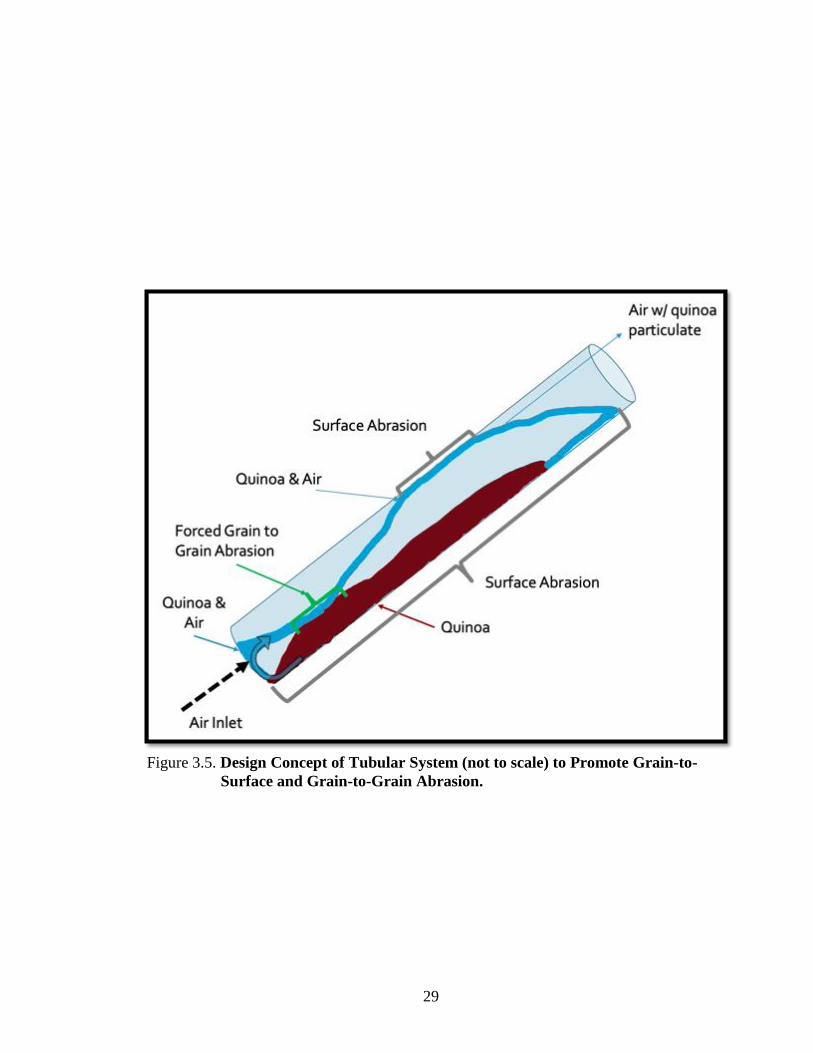
3.2.1.3. Tubular System
A third system to provide additional surface abrasion was conceptually developed
as detailed in Figure 3.5. The surface of the pipe was acted upon by a steel brush drill
attachment to produce a rough surface that could increase surface abrasion as the grain
flows up and down the tube. As the grain is flowing throughout the tube it is also being
forced across a long bed of quinoa to provide grain to grain abrasion. A 4-foot clear
polycarbonate tube (1 7/8" ID x 2" OD x 1/16" Wall) was fitted with pipe fittings on
either side. The bottom side of the pipe was fitted with a 2”x 1.5” PVC bushing. The
29
Figure 3.5. Design Concept of Tubular System (not to scale) to Promote Grain-to-
Surface and Grain-to-Grain Abrasion.
30
inside 1.5” diameter was sand down with a Dremel and sanding wheel attachment until
the pipe could be inserted into the bushing. The top side of the tube was fitted with a
1.5”x1.25” PVC bushing. The inside of the tube (first 2-feet) was roughed up with a wire
brush attached to a drill for 5 minutes. The bottom of the tube was plugged with a rubber
carboy bung. The bung was drilled out with a ¼-inch hole and a ¼-inch air hose fitting
was glued into the hole. The air was sourced from a central air compressor and passed
through an air filter and moisture trap. A 4-inch piece of angle iron was taped to the
bottom of the tube (12 inches from the bottom) to allow the pipe to stay in place during
operation. A 16x16x5-inch box was used as a frame to hold the tube in place. One of the
5-inch sides was cut down, so when the tub was placed in the box, a 32-degree angle was
produced. A 1-inch flexible pipe was fitted to the end up the tube. The tube fed into a 5-
gallon bucket through a small hole in the lid. A metal weight was wrapped around the
bottom of the tube to ensure it was held below the water’s surface. The bucket was placed
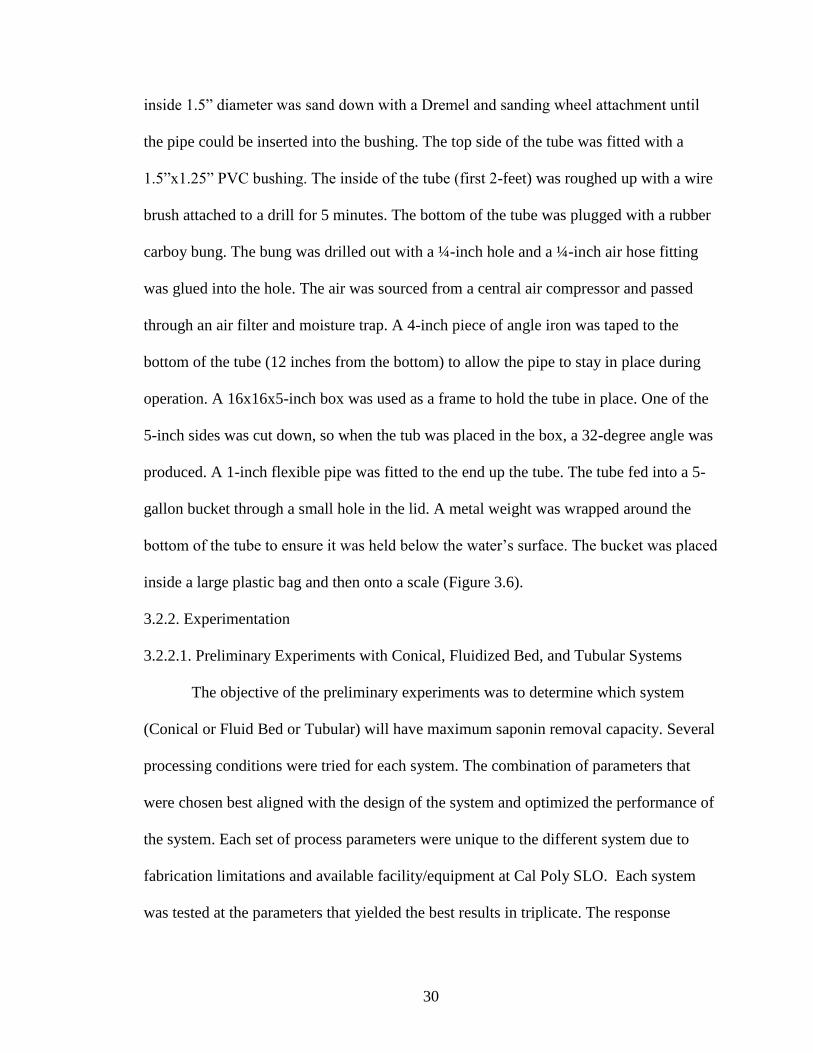
inside a large plastic bag and then onto a scale (Figure 3.6).
3.2.2. Experimentation
3.2.2.1. Preliminary Experiments with Conical, Fluidized Bed, and Tubular Systems
The objective of the preliminary experiments was to determine which system
(Conical or Fluid Bed or Tubular) will have maximum saponin removal capacity. Several
processing conditions were tried for each system. The combination of parameters that
were chosen best aligned with the design of the system and optimized the performance of
the system. Each set of process parameters were unique to the different system due to
fabrication limitations and available facility/equipment at Cal Poly SLO. Each system
was tested at the parameters that yielded the best results in triplicate. The response
Figure 3.6. Tubular Abrasion System Constructed for Saponin Removal.

32
variables collected during preliminary experimentation were pictures and mass balance.
Pictures were taken of visual observations of the following before and after processing:
quinoa, filters, processing systems and saponin containing fractions. Pictures of the
system were also taken during operation. The mass balance was calculated using before
and after weights of the input grain mass, processed grain mass and the sum of saponin
containing fractions (sieved particles less than 0.0559-inch diameter, particles collected
in the filter and residual particles remaining in the system) (section 3.2.2.1.4.2) and
reported as percent yield loss.
3.2.2.1.1. Conical System.
The tank was removed from the wooden stand, weighed and recorded. New pieces
of HEPA filter sheets were wrapped around a metal mesh cylinder. The total weight of
the HEPA filter was weighed on a scale and recorded. 300 grams of Lundberg Family
Farms Tri-Color Quinoa was weighed and recorded.
The rubber stopper was attached to the air inlet and firmly pressed into the bottom
of the conical tank. The weighed quinoa was added to the system from the top. The
HEPA filter was inserted into the top of the tank, 2-inches below the line of the tank. The
digital psi gauge was set to 11 psi. The ball valve was opened, and the system was run for
15 minutes.
The rubber stopper was disconnected from the air and the tank removed from the
wooden stand. A mesh sieve of diameter 0.0559-inch and catch basin were weighed
individually in order to calculate the total amount recovered at each level. The tank was
placed over the sieve and catch basin and the rubber stopper removed. All of the quinoa
and dust were shaken onto the sieve. The sieve was shaken for 2 minutes and amount
33
collected at each level was measured and recorded. The tank was placed on a scale,
measured and recorded to account for dust remaining on the inside of the tank. The
HEPA filter was removed, weighed and recorded. A mass balance was calculated using
the weights of quinoa and saponin containing fractions collected in the sieve and catch
basin as well as the dust collected in the HEPA filter and the residual dust in the tank.
The test was performed in triplicate at 15 minutes with 300 grams at 11 psi.
3.2.2.1.2. Fluidized Bed System.
The flex ducting, reducer, and system base (air register and plexiglass rectangle)
were weighed, photographed and recorded before experimentation to account for any dust
that may have collected. 800 grams of Lundberg Family Farms Tri-Color Quinoa was
weighed, photographed and recorded. A 12”x12” HEPA air filter was weighed,
photographed and recorded.
The bottom of the reducer was attached to the flex ducting and sealed with duct
tape. The blower was turned on and the flow of air was measured from the top of the
reducer and adjusted to different volumetric flows using the ball valve. The volumetric
flow was calculated using the 6-inch diameter of the of the circular reducer and the speed
of the air. The volumetric flow was set to 0.0931 m3/s. The blower was turned off and the
quinoa was poured into the reducer. The reducer was slid over the bottom of the air
register assembly and the seam was sealed with duct tape. The 12”x12” HEPA air filter
was fitted to the top of the plexiglass rectangle. The filter was lined up and clamped on
all edges with spring clamps so that air could not escape through the sides. The blower
was turned on and ran from 15 minutes.

34
The blower was turned off and the HEPA filter was removed, weighed,
photographed and recorded. Pressurized air was carefully used to move any dust and
quinoa from the plexiglass rectangle, air register and any rough seams to the reducer. The
reducer was removed, and the quinoa was poured over a mesh sieve of diameter 0.0559
inch and a catch basin. All of the quinoa and dust were shaken onto the sieve. The sieve
and catch basin were shaken for 2 minutes and the amount collected at each level was
measured, photographed and recorded. The flex ducting, reducer, and system base (air
register and plexiglass rectangle) were weighed, photographed and recorded. A mass
balance was calculated using the weights of quinoa and saponin containing fractions
collected in the sieve and catch basin as well as the dust collected in the HEPA filter, flex
ducting, reducer, and system base (air register and plexiglass rectangle). The test was
performed in triplicate at 15 minutes with 800 grams.
3.2.2.1.3. Tubular System
The 5-gallon bucket was filled with water 2 inches above the opening of the
inserted flexible tube. The initial weight of the polycarbonate tube disconnected from the
air supply and 5-gallon bucket with the flexible tube attached were weighed,
photographed and recorded before experimentation. 300 grams of Lundberg Family
Farms Tri-Color Quinoa was weighed, photographed and recorded before
experimentation
The rubber bung was pressed firmly into the bottom of the polycarbonate tube.
The weighed quinoa was poured into the tube. The flexible tube was inserted into the top
of the polycarbonate tube. The polycarbonate tube was placed into the cardboard rest and
35
the angle was set to 32-degrees, measured and recorded. The air was turned on to 40 psi
and the system was run for 15 minutes.
The air pressure was turned off as soon as the time had ended. A sieve of diameter
0.0559 inch and a catch basin were weighed and recorded. The flexible tube was removed
from the top of the polycarbonate tube and set on top of the sieve. The flexible tube was
shaken onto the sieve to remove any dust caught in between the 5-gallon bucket and the
polycarbonate tube. The polycarbonate tube was removed from the cardboard rest and
poured out onto the sieve. The bung was removed to ensure all grain was removed. The
tube was flipped over and shook again to remove all dust. The polycarbonate tube was
weighed and recorded to account for residual dust. The flexible tube was placed in the
same position when previously weighed and the weight of the water was measured and
recorded. The sieve was shaken for 2 minutes and amount collected in the sieve and catch
basin was measured, photographed and recorded. A mass balance was calculated using
the weights of quinoa and saponin containing fractions collected in the sieve and catch
basin as well as the dust collected in the polycarbonate tube and change in water weight.
The test was performed in triplicate at 15 minutes with 300 grams at an angle of 32
degrees and a pressure of 40 psi.
3.2.2.1.4. Evaluation of System Performance
3.2.2.1.4.1. Visual Observation
Photos and videos were taken of the systems prior, during and after
experimentation. The photos were used to analyze the amount of abrasive force acting
upon the surface of the grain. The photos were also used to understand the flow of the
grain in the system.
36
3.2.2.1.4.2. Mass Balance
A mass balance was used to determine the amount of saponin containing fractions
removed during processing. The following mass balance calculations were carried out:
Input Grain Mass = Processed Grain Mass + Sum of Saponin Containing Fractions
%Yield Loss = (Input Grain Mass
− Processed Grain Mass)/(Input Grain Mass) 𝑥 100
3.2.2.2. Final Experiment with Tubular System
The 5-gallon bucket was filled with water 2 inches above the opening of the
inserted flexible tube. The initial weight of the polycarbonate tube disconnected from the
air supply and 5-gallon bucket with the flexible tube attached were weighed,
photographed and recorded before experimentation. Lundberg Family Farms Tri-Color
Quinoa was weighed, photographed and recorded before experimentation. An
experiential design was used to determine the process parameters for the system that
resulted in the lowest saponin levels. A full factorial was designed with 3 levels of mass
(200 grams, 300 grams, and 400 grams) and 3 levels of processing time (5 minutes, 10
minutes, and 15 minutes). The processing conditions for each sample as well as the order
in which the samples were run. The randomized experimental design was developed and
analyzed using the statistical software JMP to determine statistical interactions between
process parameters (Table 3.1).
The rubber bung was pressed firmly into the bottom of the polycarbonate tube.
The weighed quinoa was poured into the tube. The flexible tube was inserted into the top
of the polycarbonate tube. The polycarbonate tube was placed into the cardboard rest and
the angle was set to 32-degrees, measured and recorded. The air pressure was set to 40

37
Table 3.5. Experimental Design for Tubular System.
Experimental Run Independent Variables Response
Variable # ID Time (min) Mass (g)
1 33 15 400
Percent
saponin
(w/w)
2 13 5 400
3 32 15 300
4 23 10 400
5 21 10 200
6 22 10 300
7 11 5 200
8 23 10 400
9 32 15 300
10 12 5 300
11 23 10 400
12 32 15 300
13 12 5 300
14 12 5 300
15 13 5 400
16 22 10 300
17 11 5 200
18 31 15 200
19 13 5 400
20 21 10 200
21 33 15 400
22 21 10 200
23 22 10 300
24 33 15 400
25 31 15 200
26 31 15 200
27 11 5 200
38
psi and the system was run for the desired time.
The air pressure was turned off as soon as the time had ended. A sieve of diameter
0.0559 inch and a catch basin were weighed and recorded. The flexible tube was removed
from the top of the polycarbonate tube and set on top of the sieve. The flexible tube was
shaken onto the sieve to remove any dust caught in between the 5-gallon bucket and the
polycarbonate tube. The polycarbonate tube was removed from the cardboard rest and
poured out onto the sieve. The bung was removed to ensure all grain was removed. The
tube was flipped over and shook again to remove all dust. The polycarbonate tube was
weighed and recorded to account for residual dust. The flexible tube was placed in the
same position when previously weighed and the weight of the water was measured and
recorded. The sieve was shaken for 2 minutes and amount collected in the sieve and catch
basin was measured. A 25 mL test tube was used to store quinoa for testing. The sample
was collected by filling the tube half way by passing through the batch in a diagonal line.
The remainder of the tube was filled by passing across the bottom of the batch. The
sample was stored in refrigerated conditions at 50 F until the sample was tested for
saponin levels using the method listed in section 3.3.1.2. Complete Saponin
Quantification Method. The method was repeated for each additional batch. A mass
balance was calculated using the weights of quinoa and saponin containing fractions
collected in the sieve and catch basin as well as the dust collected in the polycarbonate
tube and change in water weight.
When testing the control, ten mL of grain was sampled from each bag at the top,
middle, and bottom (9, 10ml samples) and combined in a coffee grinder. Five grams of

39
the sample from the grinder were used for each replicate in the saponin quantification
process. This procedure was repeated 6 times for the control sample.
The performance of the system was evaluated by comparing the saponin content
of commercially processed washed quinoa with the quinoa processed by this method. The
method was also compared to the saponin content of quinoa sourced from a quinoa
processor at the three different stages of processing, raw grain, scarified grain, and
scarified and washed.
3.2.3. Saponin Quantification Method
3.2.3.1. Adaptations to the Saponin Quantification Method
The methodology described by Ilce G. Medina-Meza, Nicole A. Aluwi, Steven R.
Saunders, and Girish M. Ganjyal (2016) for the isolation and quantification of saponin in
quinoa did not provide specific details of the different steps in the methodology. The
different steps were defined through experimentation and are listed in Table 3.2. These
adaptations are included in our method for saponin quantification.
Soxtec boiling, rinsing and evaporation times were based upon Soxtec standard
operating procedures for fat extraction. Methanol/water (4:1) (35 mL) was used as it was
able to completely submerge the sample during boiling and still provide sufficient
solution after extraction. Evaporation at a lower pressure and higher temperature was
conducted due to the availability of equipment. The volume was reduced from a starting
range of 16-20 mL to 10 mL during evaporation. Hydrolysis was first performed in a
beaker, but the solution evaporated in minutes, so a reflux condenser was used to prevent
evaporation and allow for 2 hours of hydrolysis. HCL (5 mL) was used to provide
sufficient acid for the hydrolysis of the sample. This was confirmed with a consistent pH

40
of 0 after hydrolysis. The sample was neutralized with 4N NH4OH. During liquid-liquid
partitioning the bottom layer was collected and tested for saponin. This yielded no
reaction or color change. The top layer was then tested and confirmed to contain the
saponin from the sample. The concentration of sulfuric acid was not listed, which led to
problems in oxidizing the triterpenoid. Sulfuric acid (36N) was found to adequately work
and was used for the remainder of the experiment.
3.2.3.2. Saponin Quantification using the Adapted Method
Saponin content of unprocessed quinoa (control) and processed quinoa were
determined using the adapted method. Quinoa samples (30g) were ground to a fine
powder. The powder was defatted according to method ASCI 30-25.01. Defatted quinoa
was extracted using the Soxtec method. The sample was boiled for 20 minutes, rinsed for
40 minutes in methanol/water solution (35 mL) (4:1). The crude extract was concentrated
at 2 mbar and 35 °C till the volume was reduced in half. The volume recovered after
evaporation was recorded. Concentrate (5 mL) was hydrolyzed under reflux with 6N
HCL at 110 °C for 2 h (Figure 3.7A). The hydrolysate was cooled, neutralized with 4N
NH4OH and then centrifuged at 3000g for 5 minutes. Saponins were isolated by a liquid-
liquid partition of ethyl acetate (Figure 3.7B). The solution was isolated 3 times using 5
mL of petroleum ether. The top layer was removed, and the bottom layer was repeated
(Figure 3.7B). The top layers were combined and filtered in Na2SO4. Saponin extract
(500 μL) was mixed with glacial acetic acid/sulfuric acid (1:1 v/v) (2000 μL). The
mixture was vortexed for 30 s and then heated at 60 °C for 30 minutes. The mixture was
then cooled in ice water for 3 minutes and measured in a spectrophotometer at 527nm.
Glacial acetic acid was used as a blank and a standard curve was established using the
41
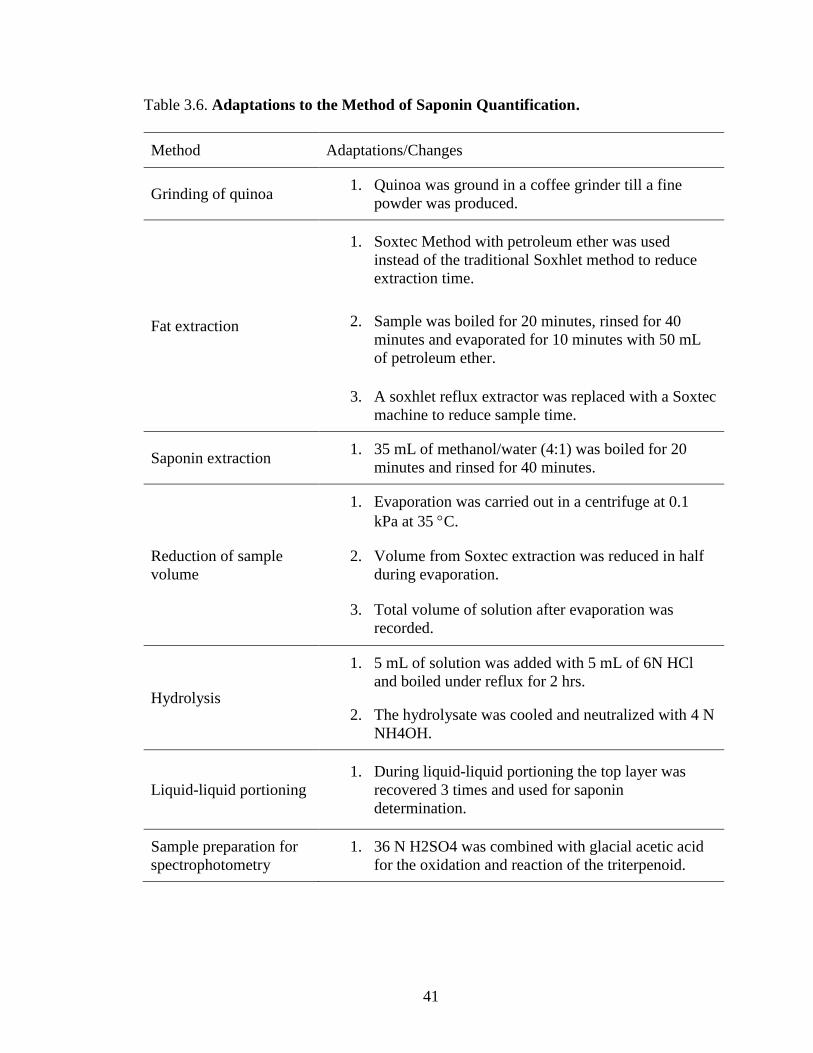
Table 3.6. Adaptations to the Method of Saponin Quantification.
Method Adaptations/Changes
Grinding of quinoa 1. Quinoa was ground in a coffee grinder till a fine
powder was produced.
Fat extraction
1. Soxtec Method with petroleum ether was used
instead of the traditional Soxhlet method to reduce
extraction time.
2. Sample was boiled for 20 minutes, rinsed for 40
minutes and evaporated for 10 minutes with 50 mL
of petroleum ether.
3. A soxhlet reflux extractor was replaced with a Soxtec
machine to reduce sample time.
Saponin extraction 1. 35 mL of methanol/water (4:1) was boiled for 20
minutes and rinsed for 40 minutes.
Reduction of sample
volume
1. Evaporation was carried out in a centrifuge at 0.1
kPa at 35 C.
2. Volume from Soxtec extraction was reduced in half
during evaporation.
3. Total volume of solution after evaporation was
recorded.
Hydrolysis
1. 5 mL of solution was added with 5 mL of 6N HCl
and boiled under reflux for 2 hrs.
2. The hydrolysate was cooled and neutralized with 4 N
NH4OH.
Liquid-liquid portioning
1. During liquid-liquid portioning the top layer was
recovered 3 times and used for saponin
determination.
Sample preparation for
spectrophotometry
1. 36 N H2SO4 was combined with glacial acetic acid
for the oxidation and reaction of the triterpenoid.

42
following concentrations of oleanolic acid in duplicate: 35.71 μg/mL, 50 μg/mL, 71.43
μg/mL, 100 μg/mL, 714.3 μg/mL and 1000 μg/mL (Medina-Meza et al., 2016). 50 μg/mL
and 1000 μg/mL were performed in triplicate. A linear regression was plotted and the
equation for the best fit was used to calculate the concentration of oleanolic acid
equivalent in the solution. The concentrations were then used to determine the final
amounts of saponin in the original batch. The total volume of the sample after filtration
was measured to determine the dilution factor of the original sample tested. The volume
was then multiplied by the concentration calculated by the standard curve and then
multiplied by 5, the final dilution of the original sample in the cuvette. This value was
then divided by the weight of sample that was used at the beginning of the process
multiplied by the percent of the sample used (5ml) after evaporation compared to the total
volume after evaporation (%Boiled). This was then multiplied by 100 to equal the percent
of saponin in the sample.
Amount of Saponin in Sample
= Total volume of Sample (ml) ∗ Concentration (g/ml) ∗ 5
Amount of Saponin in 1 g =Amount of Saponin in Sample
ground sample weight (g) ∗ %Boiled
Amount of Saponin in 1 g ∗ 100 = % Saponin in Sample
3.2.4. Data Analysis
The final experiment with the tubular system was analyzed using a two-way
ANOVA with Tukey’s HSD to determine statistical differences. One-way ANOVA with
Tukey’s HSD were used in testing the difference in commercially processed samples and
difference in tube surface. Means comparison with Dunnett’s Method was used to
determine if the processing conditions from the DOE were different from the control. All
statistical analysis was conducted in the statistical software JMP.

43
Petroleum
ether
Figure 3.7. Methods Used for the Quantification of Saponin in Quinoa. A:
Hydrolysis under reflux, B: Liquid-liquid partitioning.
A B
44
4. RESULTS AND DISCUSSION
4.1. Preliminary Experiments
All preliminary experiments were evaluated by visual observation of saponin
removal and mass balance. Quinoa processed using three systems were compared to
scarified and scarified-washed commercial products.
4.1.1 Conical System
The conical system was used in this study to replicate the work of researchers at
the Universidad Privada Boliviana in developing a complete system for the removal
of saponin from quinoa. The system was operated for 15 minutes. The pressure
remained constant at 11 psi through a 0.25-inch fitting as well as the input mass of
300 grams quinoa. After 15 minute process time the saponin removal was not
uniform. Some grains displayed partial removal while a majority of the grain
appeared to not have received any abrasion (Figure 4.1A&B).
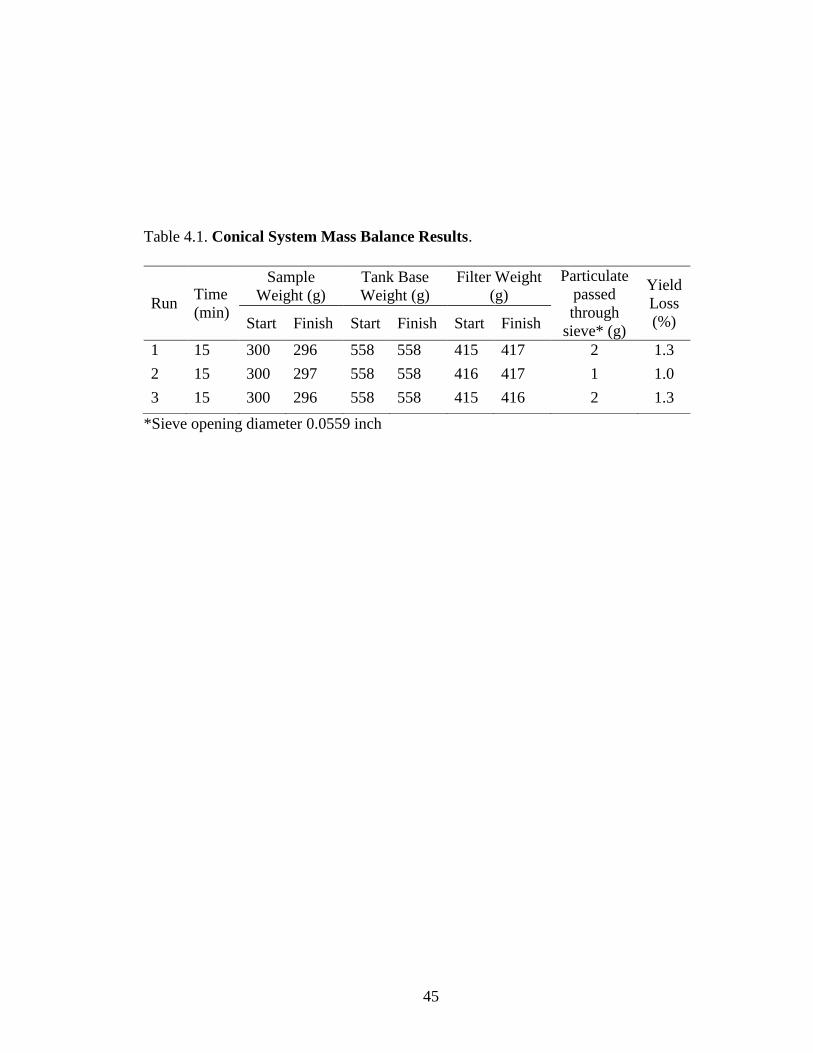
The mass balance results showed the system was able to remove around 1.3% of
the quinoa mass (Table 4.1.). The system had good vertical flow of air moving quinoa
from the bottom of the tank to the top but had little horizontal movement (Figure
4.1C). The original system design idea was to incorporate some horizontal stirring
and movement of the grain that would increase the vertical flow distribution of grain
as well as increase grain-to-grain abrasion. The main region of abrasion was located
in the neck of the conical tank. This area accounted for a small proportion of the
overall volume of the grain in the tank. At this pressure the grain was pushed almost
to the top of the tank and then fell back onto the surface of the grain. The movement
of the grain was restricted to the center of the tank. This phenomenon reduced the
45
Table 4.1. Conical System Mass Balance Results.
*Sieve opening diameter 0.0559 inch
Run Time
(min)
Sample
Weight (g)
Tank Base
Weight (g)
Filter Weight
(g)
Particulate
passed
through
sieve* (g)
Yield
Loss
(%) Start Finish Start Finish Start Finish
1 15 300 296 558 558 415 417 2 1.3
2 15 300 297 558 558 416 417 1 1.0
3 15 300 296 558 558 415 416 2 1.3

46
Figure 4.1. Processing Quinoa in a Conical Tank System. A: Quinoa after processing for 15
mins. B: Control quinoa. C: Conical tank during processing. D: Substance removed
during processing 0.0559-inch diameter.
A B
D
C

47
movement of the grain on the top outer ring of the tank and thus reduced grain-to-surface
and grain-to-grain interactions. The grain did eventually reach all areas of the tank, but
not in a consistent uniform order. This resulted in some grain receiving more abrasive
interactions and saponin removal than other grains receiving very little, if any, saponin
removal (Figure 4.1C). The area that appeared to have the greatest impact on saponin
removal was the neck of the tank. This area produced a strong “churning” affect that
forced the grains to push against each other.
The filter attached at the top tank surface became very thick with a layer of brown
dust after processing. The change in weight of the filter was often between 1.0-2.0 grams
with higher filter weights associated with greater quinoa mass removal.
It was also noted that the distance the grain traveled through quinoa mass was
very short. The angled conical slope of the tank was much less mild than desired. This
reduced grain interactions that could have occurred if the distance the grain travelled
against grain was increased. Greater mass inputss of grain were attempted, but the air
volume capabilities of the system were not great enough to facilitate grain movement in
the tank. The intensity of which the grain was forced to interact with other grains was
very mild.
This preliminary study emphasized the need of a system that allowed uniform
grain movement to promote grain-to-grain interactions. In addition, increasing surface-to-
grain abrasion will improve saponin removal while reducing process time. The churning
effect produced in the neck of the tank was noted and applied to the tubular model.
48
4.1.2. Fluidized Bed
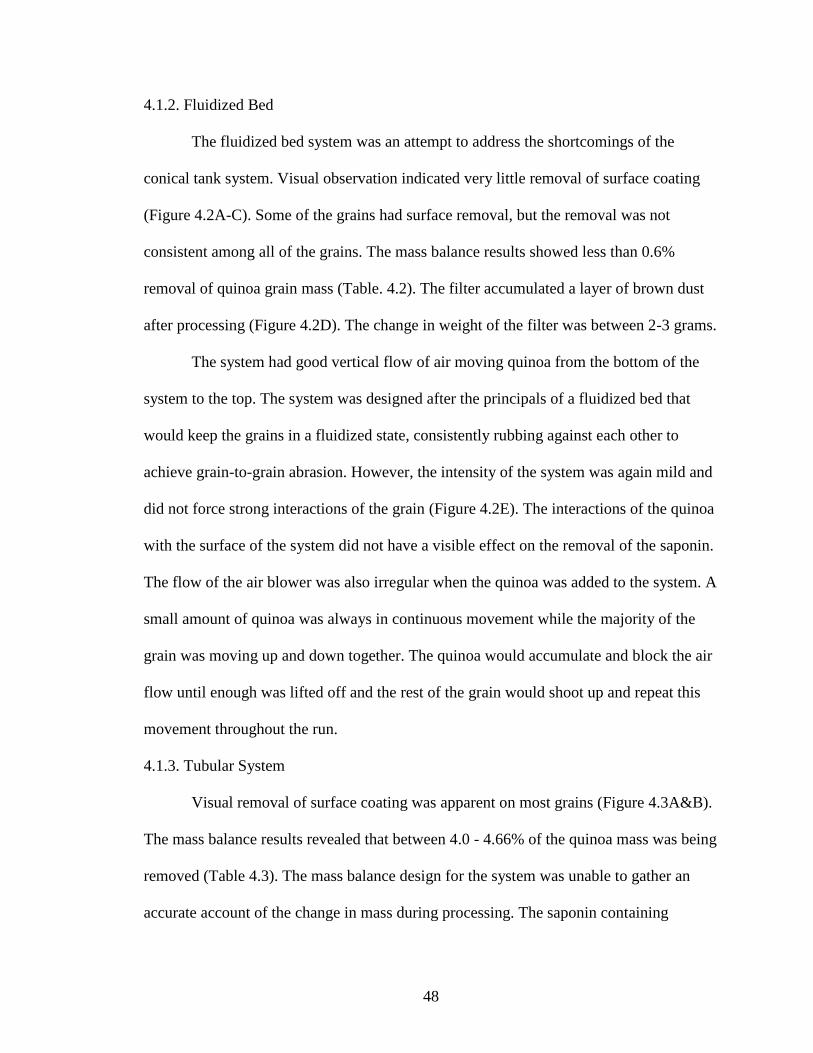
The fluidized bed system was an attempt to address the shortcomings of the
conical tank system. Visual observation indicated very little removal of surface coating
(Figure 4.2A-C). Some of the grains had surface removal, but the removal was not
consistent among all of the grains. The mass balance results showed less than 0.6%
removal of quinoa grain mass (Table. 4.2). The filter accumulated a layer of brown dust
after processing (Figure 4.2D). The change in weight of the filter was between 2-3 grams.
The system had good vertical flow of air moving quinoa from the bottom of the
system to the top. The system was designed after the principals of a fluidized bed that
would keep the grains in a fluidized state, consistently rubbing against each other to
achieve grain-to-grain abrasion. However, the intensity of the system was again mild and
did not force strong interactions of the grain (Figure 4.2E). The interactions of the quinoa
with the surface of the system did not have a visible effect on the removal of the saponin.
The flow of the air blower was also irregular when the quinoa was added to the system. A
small amount of quinoa was always in continuous movement while the majority of the
grain was moving up and down together. The quinoa would accumulate and block the air
flow until enough was lifted off and the rest of the grain would shoot up and repeat this
movement throughout the run.
4.1.3. Tubular System
Visual removal of surface coating was apparent on most grains (Figure 4.3A&B).
The mass balance results revealed that between 4.0 - 4.66% of the quinoa mass was being
removed (Table 4.3). The mass balance design for the system was unable to gather an
accurate account of the change in mass during processing. The saponin containing
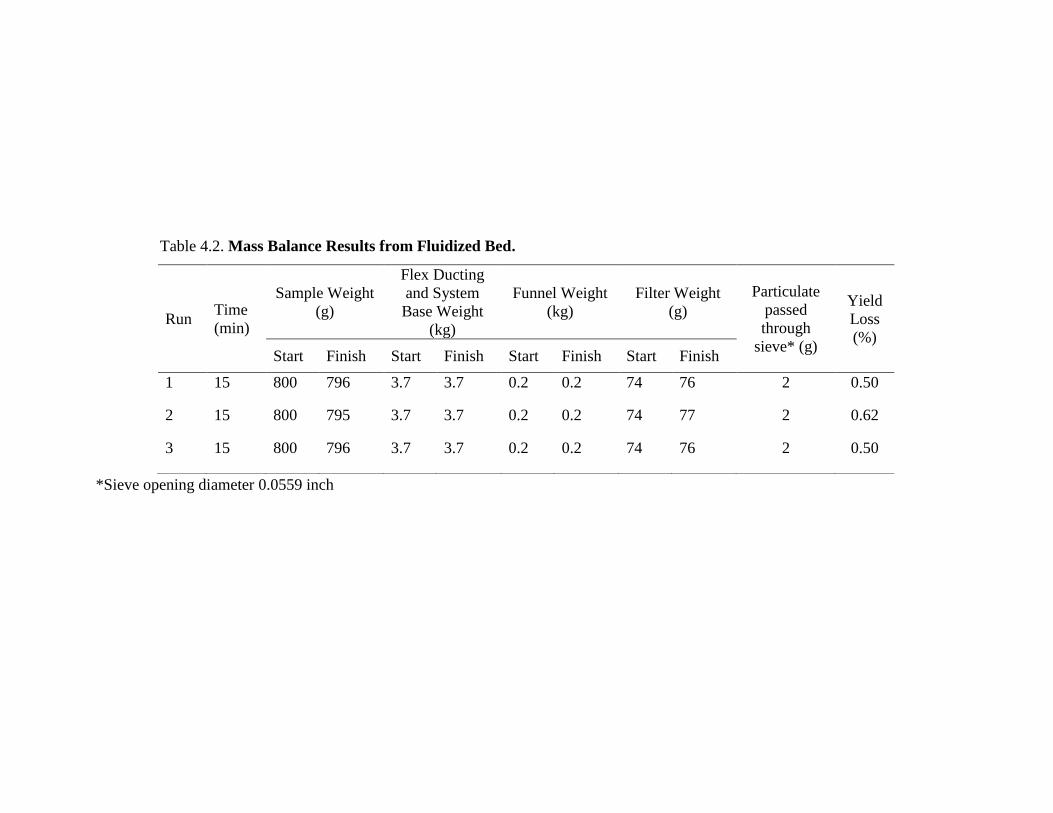
Table 4.2. Mass Balance Results from Fluidized Bed.
*Sieve opening diameter 0.0559 inch
Run Time
(min)
Sample Weight
(g)
Flex Ducting
and System
Base Weight
(kg)
Funnel Weight
(kg)
Filter Weight
(g)
Particulate
passed
through
sieve* (g)
Yield
Loss
(%)
Start Finish Start Finish Start Finish Start Finish
1 15 800 796 3.7 3.7 0.2 0.2 74 76 2 0.50
2 15 800 795 3.7 3.7 0.2 0.2 74 77 2 0.62
3 15 800 796 3.7 3.7 0.2 0.2 74 76 2 0.50

50
Figure 4.2. Processing Quinoa in a Fluidized Bed System. A: Substance removed during
processing < 0.0559-inch diameter. B: Quinoa after processing 15 minutes C:
Control quinoa. D: Filter after 15 minutes of processing. E: Fluidized bed system
during processing.
A B
E
C
D

51
Figure 4.3. Processing Quinoa in Tubular System. A: Quinoa after processing 15 minutes
B: Control quinoa. C: Saponin and water foaming during processing.
A C
B

52
Table 4.3. Tubular System Mass Balance Results.
*Sieve opening diameter 0.0559 inch
Run Time
(min)
Sample
Weight (g)
Tank Base
Weight (g)
Water
Weight (kg)
Particulate
passed
through
sieve* (g)
Yield
Loss (%) Start Finish Start Finish Start Finish
1 15 300 288 468 469 6.57 6.58 6 4.00
2 15 300 286 468 469 6.58 6.59 7 4.67
3 15 300 286 468 469 7.76 7.75 7 4.67

53
fractions and dust were removed from the system by the compressed air. A water filter,
used to collect the dust and allow the air to escape without changing the flow of air
within the tubular system, performed poorly. The saponin in the dust produced a strong
foam when combined with water. This foam was mostly contained within the designated
space of the bucket but would occasionally overflow during the processing runs that
removed the most saponin (Figure 4.3C). The overflowing of foam outside of the bucket
prevented the collection of accurate mass balance weights.
The tubular system achieved the highest removal of grain surface coating and was
selected for further experimentation. The tubular system used as the final design to
determine the effect of additional friction on reducing the overall processing time of an
abrasion only system.
4.2. Saponin Estimation
4.2.1. Final Adapted Method for Saponin Quantification
The results from the saponin quantification method for unscarified quinoa were
similar to the range of the values reported by Ilce G. Medina-Meza, Nicole A. Aluwi,
Steven R. Saunders, and Girish M. Ganjyal (2016) (Table 4.4).
Table 4.4 Saponin Content of Unscarified Quinoa Confirming the Validity of the
Adapted Method.
Method Data Obtained at Saponin Range (g/100g
DW)
UV−Vis
Spectrophotometry
School of Food Science,
Washington State University,
Pullman Washington, United
States, 2016
0.66-3.09
UV−Vis
Spectrophotometry
Department of Food Science,
California Polytechnic State
University San Luis Obispo, 2019
Study
0.53-2.06

54
The standard curve of oleanolic acid used to determine the amount of saponin in
the different samples is shown in Figure 4.4.
4.3. Final Experiment with Tubular System
The mean saponin content at different process parameters and control are
represented in Figure 4.5. The processing conditions of 15 minutes at an input mass of
300 grams yielded the lowest saponin content, 0.19% (Figure 4.5). The four processing
conditions of (10 minutes/200 grams, 10 minutes/400 grams, 15 minutes/200 grams and
15 minutes/300 grams) were statistically different from the control (unprocessed quinoa)
(Figure 4.5). The ANOVA results for the experimental design are shown in Table 4.5.
The effects of process time, input mass, and the interaction between process time and
input mass were not statistically significant (Table 4.5).
The saponin content of quinoa processed using smooth and rough tubular systems
is shown in Figure 4.6. The processing of the grain in smooth and rough tubular systems
did not show any statistical difference. However, the treatment of 15 minutes and 300
grams input mass in the rough tube had the lowest saponin content (0.19%) compared to
all other process parameters in the smooth tube (Figure 4.6).
The tubular system was able to incorporate grain-to-surface friction and high-
intensity grain-to-grain abrasion through a “churning” motion. Grain-to-surface
interactions occurred as the grain was pushed to the top of the tube and fell back to the
bottom, rubbing against the tube surface during each cycle. High-intensity grain-to-grain
abrasion was observed when the grain was pushed to the top of the tank by the
compressed air. However, the intensity of the abrasion was low during the return flow of
55
0.00
0.50
1.00
1.50
2.00
2.50
3.00
3.50
0 0.0002 0.0004 0.0006 0.0008 0.001 0.0012
Abso
rban
ce
Concentration (g/mL)
R2 = 0.96043
F = 291.2602.
Figure 4.4. Linear Regression of the Standard Curve of Oleanolic Acid at 527 nm.
Equation: Absorbance = -0.043244 + 2634.2478*Concentration (g/mL)

56
Figure 4.5. Percent Saponin in Samples After Processing at Different Time and Mass
Combinations. Data points represent a mean (n=3). Errors bars denote standard
deviations. Bars showing a different letter than the control are statistically different
(p ≤ 0.05).

57
Table 4.5.ANOVA Results from DOE of Processing Conditions.
Source Total Sum of
Squares DF
Mean Sum
of Squares F-Ratio P Value
Time 0.04408 2 0.02204 2.1143 0.1497
Weight 0.01970 2 0.00985 0.9452 0.4071
Time*Weight 0.10647 4 0.0266175 2.5536 0.0745
Error 0.18763 18 0.01042389 - -

58
0.277 0.272 0.187 0.2980.00
0.25
0.50
0.75
1.00
RT 15-200 ST 15-200 RT 15-300 ST 15-300
Sap
onin
s (g
/100g Q
uin
oa)
Time (min)
a aa a
Figure 4.6. Percent Saponin in Samples After Processing With Different Surface Roughness
and Different Input Mass. Data points represent a mean (n=3). The numbers within
the bar show the mean saponin content after processing. Errors bars denote standard
deviations. Bars showing the same letters are not statistically different (p ≤ 0.05).
R2
= 0.236
F = 0.8228
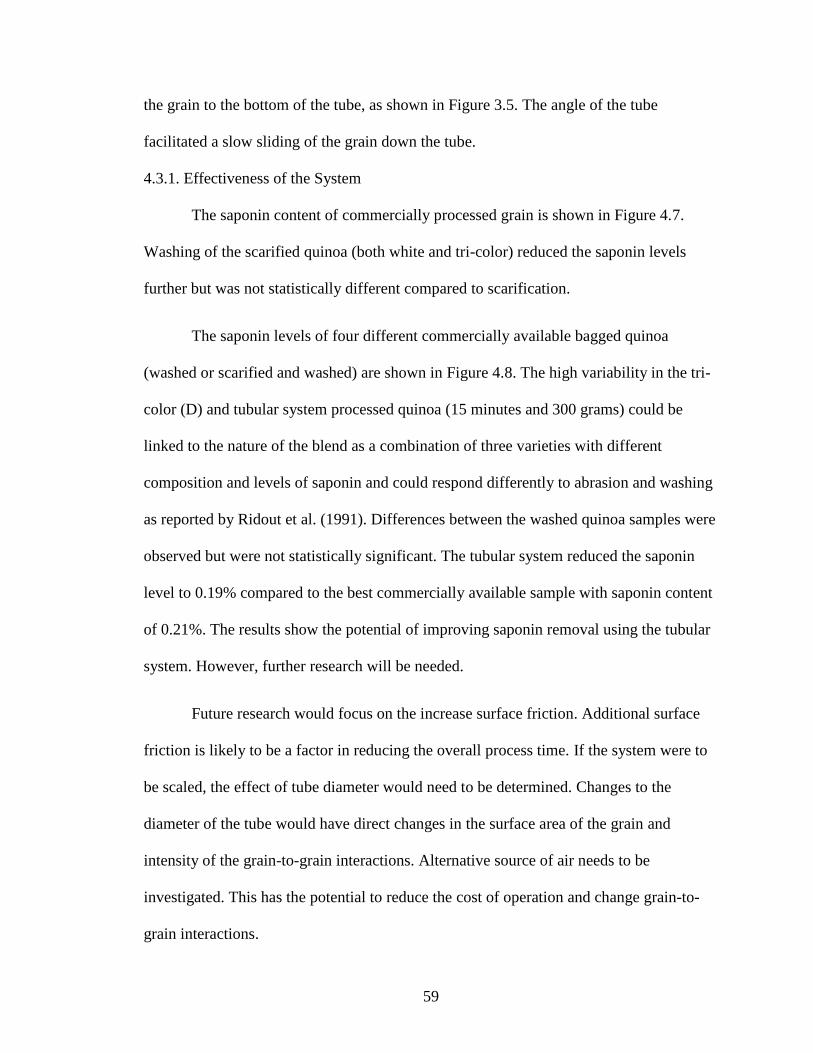
59
the grain to the bottom of the tube, as shown in Figure 3.5. The angle of the tube
facilitated a slow sliding of the grain down the tube.
4.3.1. Effectiveness of the System
The saponin content of commercially processed grain is shown in Figure 4.7.
Washing of the scarified quinoa (both white and tri-color) reduced the saponin levels
further but was not statistically different compared to scarification.
The saponin levels of four different commercially available bagged quinoa
(washed or scarified and washed) are shown in Figure 4.8. The high variability in the tri-
color (D) and tubular system processed quinoa (15 minutes and 300 grams) could be
linked to the nature of the blend as a combination of three varieties with different
composition and levels of saponin and could respond differently to abrasion and washing
as reported by Ridout et al. (1991). Differences between the washed quinoa samples were
observed but were not statistically significant. The tubular system reduced the saponin
level to 0.19% compared to the best commercially available sample with saponin content
of 0.21%. The results show the potential of improving saponin removal using the tubular
system. However, further research will be needed.
Future research would focus on the increase surface friction. Additional surface
friction is likely to be a factor in reducing the overall process time. If the system were to
be scaled, the effect of tube diameter would need to be determined. Changes to the
diameter of the tube would have direct changes in the surface area of the grain and
intensity of the grain-to-grain interactions. Alternative source of air needs to be
investigated. This has the potential to reduce the cost of operation and change grain-to-
grain interactions.

60
0.21 0.30
2.06
0.270.30
1.090.00
0.25
0.50
0.75
1.00
1.25
1.50
1.75
2.00
2.25
2.50
2.75
3.00
Washed & Scarified Scarified UnScarified
Sap
onin
s (g
/100g Q
uin
oa)
A D
c
a a a
b
a
Figure 4.7. Percent Saponin in Samples White Quinoa (A) and Tricolor Quinoa (D) at
Different Points in Processing (unscarified, scarified, and scarified-washed). Data points represent a mean (n=4). The numbers within the bar show the mean
saponin content after processing. Errors bars denote standard deviations. Bars
showing the same letters are not statistically different (p ≤ 0.05).
R2
= 0.922
F = 32.101
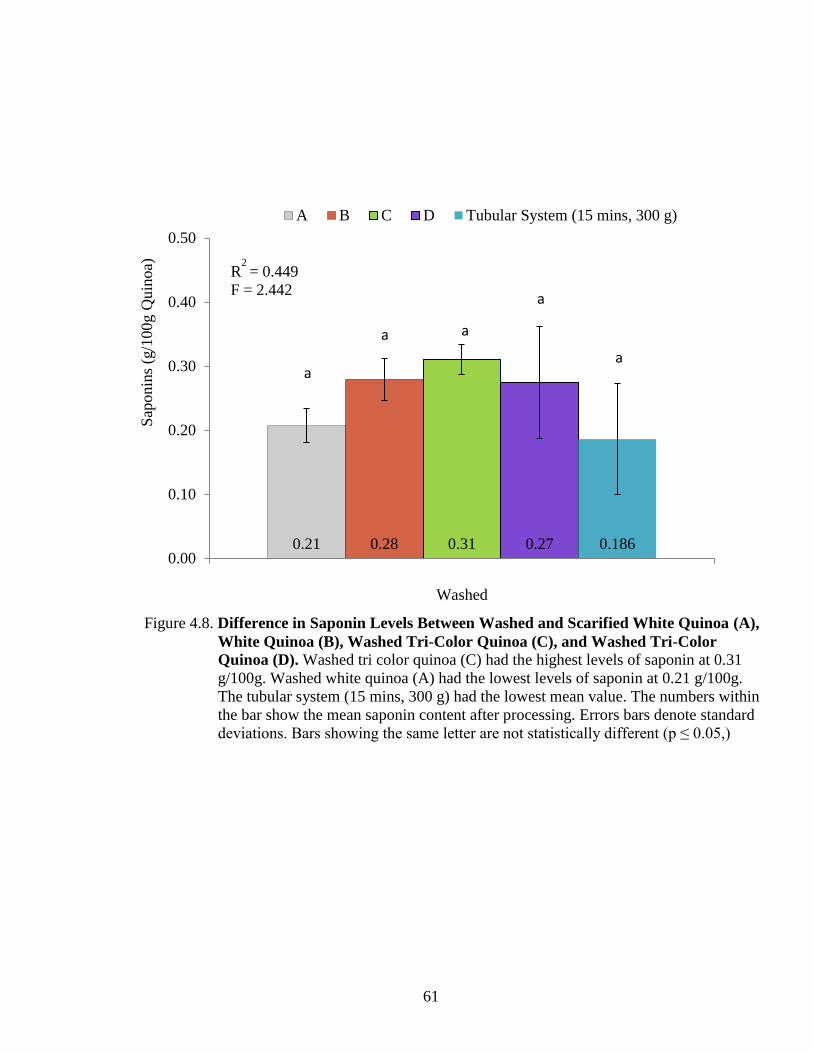
61
0.21 0.28 0.31 0.27 0.1860.00
0.10
0.20
0.30
0.40
0.50
Washed
Sap
onin
s (g
/100g Q
uin
oa)
A B C D Tubular System (15 mins, 300 g)
a
a a
a
a
Figure 4.8. Difference in Saponin Levels Between Washed and Scarified White Quinoa (A),
White Quinoa (B), Washed Tri-Color Quinoa (C), and Washed Tri-Color
Quinoa (D). Washed tri color quinoa (C) had the highest levels of saponin at 0.31
g/100g. Washed white quinoa (A) had the lowest levels of saponin at 0.21 g/100g.
The tubular system (15 mins, 300 g) had the lowest mean value. The numbers within
the bar show the mean saponin content after processing. Errors bars denote standard
deviations. Bars showing the same letter are not statistically different (p ≤ 0.05,)
R2
= 0.449
F = 2.442

62
5. SUMMARY AND CONCLUSIONS
Three abrasion systems were designed, fabricated and tested to determine the
effects of abrasion alone on the removal of saponin from quinoa. Preliminary testing
using mass balance and visual observation indicated the potential of the tubular system to
create the most abrasive forces of the three systems. Further experimentation with the
tubular system showed that the adjustment of process time and input grain mass can be
used to maximize saponin removal. The creation of surface roughness to the tubular
system appeared to have an impact on saponin removal and needs to be studied further.
The processing time with the tubular system ranges from 10 to 15 minutes and can be
reduced with further experimentation.
Industrial scale implementation of the system would improve saponin removal
from quinoa. The system would provide the industry with a sustainable process with
better saponin removal capacity.
Future focus should be on increasing surface friction, and the change in tube and
air inlet diameter. Additional surface friction is likely to be a factor in reducing the
overall process time. Changes to the diameter of the tube and air inlet would have direct
changes in the surface area of the grain and intensity of the grain-to-grain interactions and
needs to be further studied.

63
REFERENCES
Ando, H., Chen, Y.-C., Tang, H., Shimizu, M., Watanabe, K. & Mitsunaga, T. (2002).
Food Components in Fractions of Quinoa Seed. Food Sci. Technol. Res, 8, 80–84.
Arendt, E.K. & Zannini, E. (2013). Quinoa. In: Cereal Grains for the Food and Beverage
Industries. Pp. 409–438.
Balize, D;Bertero, D; Nieto, C. (FAO & C. (2015). State of the art report on quinoa
around the world in 2013. Rome: FAO.
Escalera Vásquez, R., Ledezma, C.Q. & Weill, L.A. (2010). DESARROLLO Y
DESEMPEÑO DE UN PROCESO DE BENEFICIADO EN SECO DE
VARIEDADES AMARGAS DE QUINUA BASADO EN LA APLICACIÓN DE
UN LECHO FLUIDIZADO DE TIPO SURTIDOR (LFTS), 10, 5–22.
Gonzalez, J.A., Rolden, A., Gallardo, M., Escudero, T. & Prado, F.E. (1989).
Quantitative determinations of chemical compounds with nutritional value from inca
crops:Chenopodium quinoa (?quinoa?). Plant Foods for Human Nutrition, 39, 331–
337.
Kozioł, M.J. (1992). Chemical composition and nutritional evaluation of quinoa
(Chenopodium quinoa Willd.). Journal of Food Composition and Analysis, 5, 35–
68.
Medina-Meza, I.G., Aluwi, N.A., Saunders, S.R. & Ganjyal, G.M. (2016). GC–MS
Profiling of Triterpenoid Saponins from 28 Quinoa Varieties ( Chenopodium quinoa
Willd.) Grown in Washington State. Journal of Agricultural and Food Chemistry,
64, 8583–8591.
Nickel, J., Spanier, L.P., Botelho, F.T., Gularte, M.A. & Helbig, E. (2016). Effect of

64
different types of processing on the total phenolic compound content, antioxidant
capacity, and saponin content of Chenopodium quinoa Willd grains. Food
Chemistry, 209, 139–143.
Ridout, C.L., Price, K.R., Dupont, M.S., Parker, M.L. & Fenwick, G.R. (1991). Quinoa
saponins—analysis and preliminary investigations into the effects of reduction by
processing. Journal of the Science of Food and Agriculture, 54, 165–176.
Scanlin, L. & Lewis, K.A. (2017). Chapter 14 - Quinoa as a Sustainable Protein Source:
Production, Nutrition, and Processing BT - Sustainable Protein Sources. Pp. 223–
238. San Diego: Academic Press.
Simmonds, N.W. (1965). The grain chenopods of the tropical American highlands.
Economic Botany, 19, 223–235.