sankey diagrams for energy balance statistics explained · 2020-03-10 · you can use the sankey...
TRANSCRIPT
Sankey diagrams forenergy balance Statistics Explained
Source : Statistics Explained (https://ec.europa.eu/eurostat/statisticsexplained/) - 10/03/2020 1
This article describes the Eurostat Sankey diagrams tool published on the Eurostat website to visualise energybalances. Sankey diagrams provide an overview of the main energy flows and how they contribute to the globalenergy balance of a certain territory. This article also describes the main features of the Eurostat online Sankeytool and provides instructions on how to use the different menus and available options.
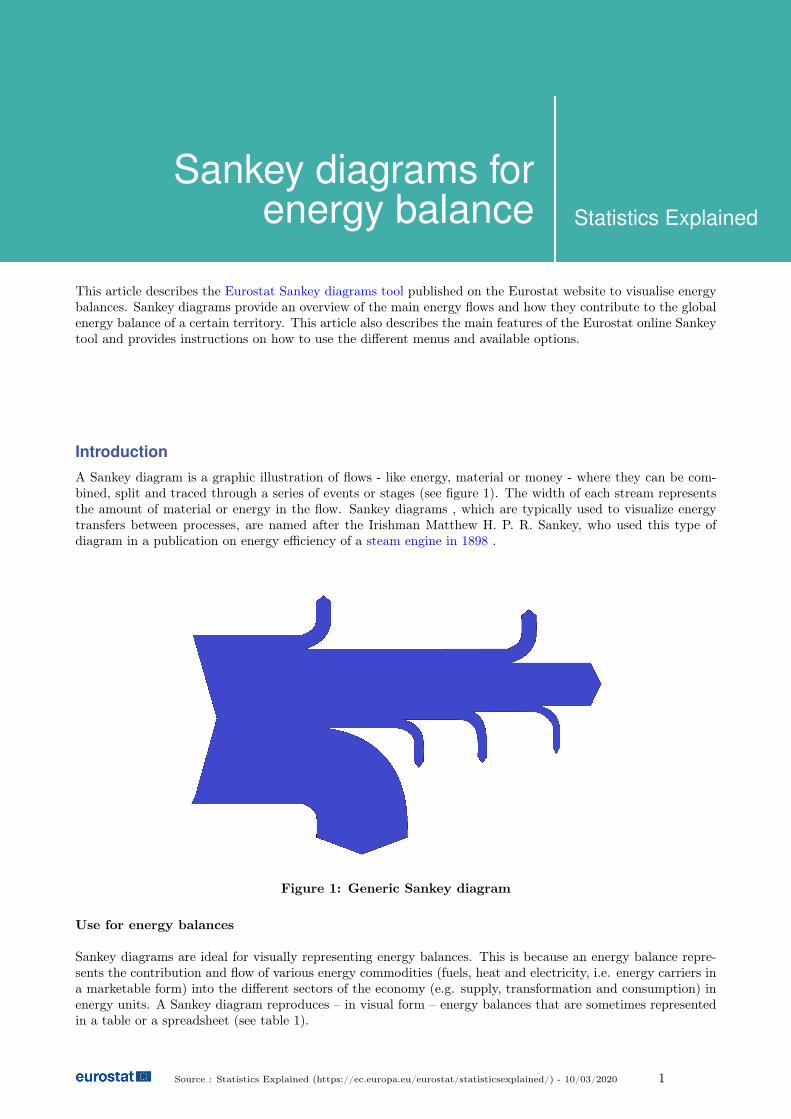
IntroductionA Sankey diagram is a graphic illustration of flows - like energy, material or money - where they can be com-bined, split and traced through a series of events or stages (see figure 1). The width of each stream representsthe amount of material or energy in the flow. Sankey diagrams , which are typically used to visualize energytransfers between processes, are named after the Irishman Matthew H. P. R. Sankey, who used this type ofdiagram in a publication on energy efficiency of a steam engine in 1898 .
Figure 1: Generic Sankey diagram
Use for energy balances
Sankey diagrams are ideal for visually representing energy balances. This is because an energy balance repre-sents the contribution and flow of various energy commodities (fuels, heat and electricity, i.e. energy carriers ina marketable form) into the different sectors of the economy (e.g. supply, transformation and consumption) inenergy units. A Sankey diagram reproduces – in visual form – energy balances that are sometimes representedin a table or a spreadsheet (see table 1).

Table 1: Eurostat energy balance (main aggregates)Source: Eurostat (nrg_bal_c)
What can you do with the Sankey tool?You can use the Eurostat tool to perform a series of operations and access certain options and levels of detaildepending on your preferences. The default view of the Sankey diagram tool is shown in Figure 2. Eurostat’sSankey diagrams are based on a series of nodes connected by energy balance flows:
• the flows represent input and output amounts
• the black nodes represent events or processes, e.g. imports, final energy consumption, etc.
Figure 3 shows an example of a node in black and a flow in green. The width of each flow corresponds to itsactual value (energy content). Each flow is defined by 4 dimensions:
• the variable of the balance (e.g. "Final energy consumption")
• the energy product or product family (e.g. "Motor gasoline" or the "Total petroleum products" family)
• the country
• the year.
The flow amount can be expressed in different units of energy measurement, for example ktoe (thousand tonnesof oil equivalent), TJ (terajoules) and GWh (gigawatt hour). Only the non-zero combinations are displayed inthe Sankey diagram (for more on this see the methodological remarks below).
Figure 2: Default view of the Eurostat Sankey diagram toolSource: Eurostat (nrg_bal_sd)
Sankey diagrams for energy balance 2

Figure 3: Example of a node and a flow in the Sankey diagramSource: Eurostat
How you can interact with a Sankey diagram ?
You can :
• move the mouse over a node - the pointer changes into a small hand, the selected node is highlighted anda small pop-up window shows the name of the node and its energy content
• click a node - a menu pops up with different options
• move the mouse over a fuel inside a flow - the pointer changes into a small hand, the fuel selected ishighlighted and a small pop-up window shows the name of the flow and its energy content
• click on a fuel inside a flow - a menu pops up with different options
• click any of the action tiles in the left-hand menu.
NODES
When you click on a node, a pop-up menu (see Figure 4) appears, offering you the following alternatives:
Figure 4: Node pop-up menu in the Sankey diagramSource: Eurostat
Collapse / Expand this node
If you select “expand”, the node will expand, showing the next level of detail for all flows connected to thenode. If the node you clicked on is already expanded, you can click again to collapse the node. This also hidesthe details that come after the node (for "Transformation input" and all nodes situated after the transforma-tion sector) or before it (for "Transformation output" and all nodes situated before the transformation sector).Figure 5 shows the collapsed and expanded view of the three Final energy consumption sectors.
Sankey diagrams for energy balance 3

Figure 5: Collapsed versus expanded view of the three final energy consumption sectorsSource:Eurostat
Some nodes cannot be expanded, specifically:
• external nodes of the Sankey diagram
• nodes that are inside the transformation sector
• the "Direct carry-over" node
• the "Transformation backflow" node.
Time graphs
You can use the Sankey diagram tool to view several graphs showing how different variables change overtime. The Y axis is the energy content (in TJ, KTOE, etc. depending on the selected unit) and the X axisrepresents the years. The following graphs are available:
• the change over time in the amount of fuels passing through the node – you will see two graphs insteadof one for nodes in the transformation sector. This is because entering and exiting fuels are different
• the change over time in the energy content of the incoming flows into the node
• the change over time in the energy content of the outgoing flows from the node.
Pie charts
You can also use the Sankey diagram tool to view pie charts showing the distribution of fuels and flows goingthrough the selected node in a selected year. The following pie charts are available:
• distribution of fuels passing through the node – you will see two pie charts instead of one for nodes locatedin the transformation sector. This is because entering and exiting fuels are different
• distribution of the energy content of the incoming flows – this pie chart is not displayed for external nodessituated before the transformation sector
• distribution of the energy content of the outgoing flows – this pie chart is not displayed for external nodessituated after the transformation sector.
Compare countries
You can also use the Sankey diagram tool to view bar charts showing the distribution of fuels and flowsgoing through the selected node in a selected year for each country (one bar per country). The following barcharts are available:
Sankey diagrams for energy balance 4

• distribution of fuels passing through the node – you will see two bar charts instead of one for nodes locatedin the transformation sector. This is because entering and exiting fuels are different
• distribution of the energy content of the incoming flows – this bar chart is not displayed for external nodessituated before the transformation sector
• distribution of the energy content of the outgoing flows – this bar chart is not displayed for external nodessituated after the transformation sector.
You can filter the countries that you want to compare and also change between absolute and percentage values.
Definitions
When you access “definitions”, you will see a pop-up window with definitions of the node itself and the flows thatenter and exit the node. The pop-up window contains links to the relevant definition in the Eurostat conceptsand definitions database .
FLOWS
When you click on a flow, you will see the pop-up menu (Figure 6) displaying the following options:
Figure 6: Fuel pop-up menu in the Sankey diagramSource: Eurostat
Hide / Show fuel details
If you click on "show fuel details", all flows will show the different fuels flowing inside with a non-zero value.(More on fuels displayed in the Sankey diagram below) If you click on "hide fuel details", all flows will collapseback into a single higher-level fuel family.
Highlight one fuel
You can only use this option when the fuel details are displayed as in the previous option. When you se-lect this option, the selected fuel or fuel family is highlighted. The rest of the fuels or fuel families are in a palegrey colour in the background. To see how the highlight option works, see Figure 7 (for the “Total petroleumproducts” family).
Sankey diagrams for energy balance 5

Figure 7: Example of the highlight option in the Sankey diagramSource: Eurostat
Display diagram for detailed fuels of the selected fuel family
You can use this option to view a Sankey diagram that shows only the detailed products of the correspondingfuel family. Figure 8 shows the detailed products of the “Renewable energies” family. If you click on “displaydiagram” when the diagram is already showing a specific fuel family, you will be taken back to the "All prod-ucts" view.
Figure 8: Example of the detailed view of the ’Renewable energies’ family in the Sankey dia-gramSource: Eurostat
Definitions
Accessing this option brings up a pop-up window with definitions relating to the selected fuel family anddetailed products. The pop-up window contains links to the relevant definition in the Eurostat concepts anddefinitions database .
ADDITIONAL FEATURES
Sankey diagrams for energy balance 6

Figure 9: Menu with general options in the Sankey diagramSource: Eurostat
In addition to the node and flow options, the tool contains a permanent menu (see Figure 9) on the left-handside with the following options:
• “select country” – use this option to change the country or aggregate of countries. you can select as manycountries as you wish and the result will be the Sankey for the group of selected countries (addition of theSankey of each selected country). See Figure 10 for the country menu
Sankey diagrams for energy balance 7

Figure 10: Menu to select a country or aggregate in the Sankey diagramSource: Eurostat
• “select unit” – use this option to change between different energy units. See Figure 11 for the unit menu
Sankey diagrams for energy balance 8
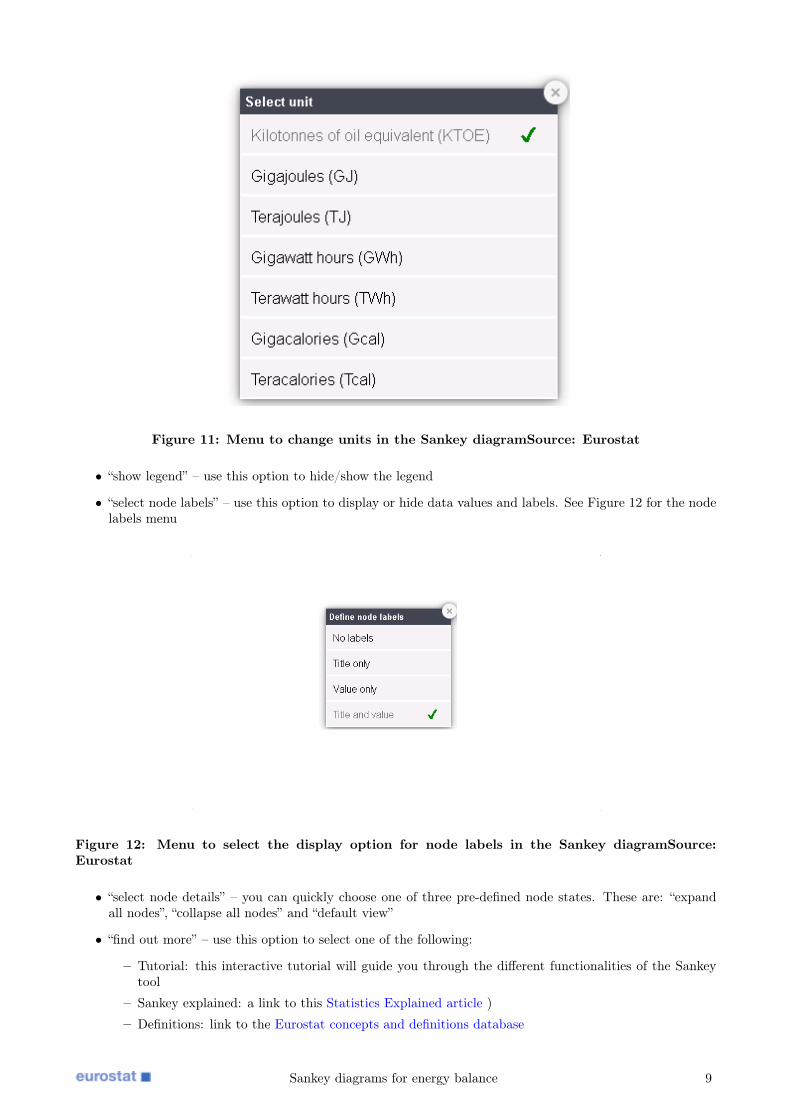
Figure 11: Menu to change units in the Sankey diagramSource: Eurostat
• “show legend” – use this option to hide/show the legend
• “select node labels” – use this option to display or hide data values and labels. See Figure 12 for the nodelabels menu
Figure 12: Menu to select the display option for node labels in the Sankey diagramSource:Eurostat
• “select node details” – you can quickly choose one of three pre-defined node states. These are: “expandall nodes”, “collapse all nodes” and “default view”
• “find out more” – use this option to select one of the following:
– Tutorial: this interactive tutorial will guide you through the different functionalities of the Sankeytool
– Sankey explained: a link to this Statistics Explained article )
– Definitions: link to the Eurostat concepts and definitions database
Sankey diagrams for energy balance 9

– Metadata: link to the official metadata for the annual energy balances Energy statistics - supply,transformation and consumption (nrg_bal)
– Sankey dataset: link to the dataset nrg_bal_sd, which contains the data used to display the Sankeydiagrams
• "save/export" - use this option to save and/or print the Sankey diagram.
If you want to change the year on display, click on the interactive time line at the bottom of the display. Youalso have the possibility to see year-on-year changes in an animated way, just by clicking on the play button.Youcan share the Sankey diagram you are viewing by clicking on one of the social media buttons in the top rightcorner. To increase or decrease the size of the diagram, you can use the zoom button in the bottom right corner.
Description of flows and nodes of the Sankey diagramFigure 2 shows the default view for the flow of all energy commodities for all products together and for the EU.The flow runs left to right. Energy commodities:
• enter the energy balance on the left (mainly from production or imports); and
• exit on the right (mainly through final consumption, exports and losses).
The middle part of the diagram also shows:
• which energy commodities are used in their original form; and
• which go through the transformation sector.
Natural gas used for heating in the residential sector is an example of a commodity being used in its originalform (i.e. "Direct carry-over"). By contrast, natural gas transformed into electricity in a thermal power plantis an example of an energy commodity going through the transformation sector. The following sections describethe main groups of nodes and their meaning in relation to the energy balance.
Energy available from all sources
The left part of the diagram corresponds to the provision of energy i.e. how the energy is made availableto the territory under consideration. This is represented in the Sankey diagram by the "Available from allsources" node). The nodes contributing to the energy available from all sources are:
• Imports – this is energy produced outside and brought into the territory in question to be consumed ortransformed into a new energy product
• Production, which is an aggregation of:
• primary production (extraction of energy products from natural sources into a usable form) and
• Recovered and recycled products, which regroup several categories, like supply of renewable energy com-modities produced in other fuel balances or certain petroleum products which are reprocessed and recycled.
• Stock draw (energy taken from storage facilities such as gas storage vessels). This involves a positivevariation of stock changes .
Once energy is made available to the territory under consideration (through the "Available from all sources"node), it can:
• go through a transformation process – it goes to the "Transformation" node, or
• be used directly in its original form – it goes to the "Direct carry-over" node.
Statistical difference
The statistical difference is the difference between:
• the energy available for final consumption, and
• final consumption.
Sankey diagrams for energy balance 10

It can be a good indicator for data accuracy. Statistical difference has been divided into its negative and itspositive components (inflow and outflow).The statistical difference - inflow is the negative difference between:
• the energy available for final consumption (calculated using supply data sources), and
• the final consumption (calculated using consumption data sources) for each fuel.
Inflow enters the Available from all sources node.
The statistical difference - outflow is the positive difference between:
• the energy available for final consumption (calculated using supply data sources), and
• the final consumption (calculated using consumption data sources) for each fuel.
Outflow comes between the Available after transformation and Final consumption nodes.
Transformation
The transformation node represents the transformation sector of the energy balance. To understand the pro-cesses occurring in the transformation sector, we need to explain what primary and secondary energy commodi-ties are:
• a primary energy commodity is extracted or captured directly from natural resources, such as crude oil,firewood, natural gas or hard coal
• secondary energy commodities (such as electricity, motor gasoline or derived heat) are produced as a resultof a transformation process, either from a primary energy commodity or from a different secondary energycommodity.
Transformation represents the energy involved in all activities where one energy commodity (either primary orsecondary) is transformed into a secondary energy commodity (e.g. natural gas transformed into electricity ina power plant). The transformation node can be expanded into:
• the transformation input , which is the sum of energy inputs to all transformation processes
• the transformation output , which is the sum of energy obtained as a result of all transformation processes.Between these two nodes, the diagram displays the nodes corresponding to the following transformationprocesses:
• Transformation - electricity and heat generation includes the production of electricity and/or heat, in-cluding renewable energies, like hydro power, wind power and solar photovoltaic, which are transformedinto electricity, or the energy transformed in nuclear or thermal power plants (e.g. burning of oil, coal,gas and biofuels) to produce electricity and/or heat, or District heating plants, which are central locationsused to produce district heat that is distributed through a network and may be used for process or spaceheating purposes.
• Transformation - Coke Ovens covers the transformation of coal into coke oven coke , which is the mostimportant raw material for blast furnaces.
• Transformation - Blast-furnaces covers the transformation of coke oven coke into blast furnace gas .
• Transformation - Gas works is the transformation of fuels into gas works gas , which is a flammable gas.
• Transformation - Refineries and Petrochemical industry covers the transformation of crude oil and otherintermediary products into refined petroleum products (like gasoline , diesel oil , fuel oil , lubricants ,etc.). It also covers the Petrochemical industry, which is the transformation of energy carriers during theproduction of petrochemicals (chemical products derived from petroleum) in the petrochemical industry.
• Transformation - BKB / PB Plants covers plants used to produce brown coal briquettes and peat briquettes. These are bricks composed of shredded peat or brown coal, compressed to form a slow-burning, easilystored and transported fuel.
• Other transformation includes the following categories: Patent fuel plants , Coal Liquefaction Plants ,For Blended Natural Gas , Charcoal production plants (transformation), Gas-to-Liquids (GTL) Plants(transformation), Non-specified Transformation Input .
Sankey diagrams for energy balance 11

• Transformation backflow includes all energy commodities obtained as outputs from transformation pro-cesses but used as an input to other transformation processes, for example fuels returned from the petro-chemical sector to refineries for further processing/blending. Although the "real" backflow is not knownfrom the energy balance, a minimal backflow can be inferred by consistency: any amount of a givenproduct that is present at the Transformation input node, but not provided by Available from all sources,must be a backflow. This minimal backflow is displayed in the Sankey diagram.
• Transformation losses represent energy not accounted for (lost) during the transformation processes. Atransformation loss is calculated as the difference between the total input and total output of each trans-formation flow.
Figure 13 shows the expanded view of the transformation node in the Sankey diagram. After going throughtransformation, secondary energy products meet those coming from "Direct carry-over" in the "Available aftertransformation" node. In other words, this node is the addition of direct carry-over and net transformationoutput (i.e. minus the backflow), meaning that it represents energy quantities that are available for use.
Figure 13: Disaggregated view of the Transformation node for
Final consumption
After leaving theAvailable after transformation node, energy commodities can either flow to become availableto final users in theFinal consumption node or be consumed in the following activities:
• Stock build - the energy stored in storage facilities (e.g. gas storage vessels). This involves a negativevariation of stock changes .
• Exports - energy quantities produced or transformed in the territory which are sent abroad.
• International Marine Bunkers - fuel consumption of ships during international navigation.
• Consumption of the energy branch - the energy consumed to operate installations for energy productionand transformation.
• Distribution and transmission losses - include energy losses due to transport or distribution of electricity,heat, gas, as well as pipeline losses.
• International aviation - aviation fuels delivered to aircraft for international aviation (e.g. jet keroseneconsumption during international flights).
The energy commodities that flow through the nodeFinal consumption are placed at the disposal of final users.They are either to be consumed:
• for energy in theFinal energy consumption node, or
• for non-energy purposes in theFinal non-energy consumption node (for instance, oil used as timber preser-vative).
Energy flowing through the nodeFinal non-energy consumption can be used in the following sectors:
• Final non-energy consumption - Industry covers quantities used for non-energy purposes in the industrysector, for instance coal used to make methanol or ammonia.
• Final non-energy consumption - Transport covers quantities used for non-energy purposes in the transportsector, for instance lubricants for cars.
• Final non-energy consumption - Other sectors covers quantities used for non-energy purposes, for example,in the energy sector , in the transformation sector and in other sectors such as asphalt in road construction.
Final energy consumption
The energy commodities which have not yet left the Sankey diagram will flow through theFinal energy con-sumption node. Final energy consumption covers all fuels used for energy in:
Sankey diagrams for energy balance 12

• industry (e.g. steam used to support industrial plant activities)
• transport (e.g. gasoline used in vehicles)
• households (e.g. electricity used at home)
• commercial/services (e.g. gas used for heating a public school)
• agriculture (e.g. diesel oil used in tractors)
• fishing (e.g. fuels used by coastal fishing boats)
• other sectors (e.g. military fuel use).
The energy commodities going through this node will flow to eitherIndustry ,Transport orOther sectors nodes.
Final energy consumption - Industry
Final Energy Consumption – Industry covers all fuels used for energy in the industry sector (e.g. steam usedto support industrial plant activities). Energy commodities flowing through this node will be consumed in oneof the following categories:
• Final Energy Consumption – Industry - Iron and Steel - all fuels used for energy in the iron and steelindustry (e.g. steam used to support a blast furnace).
• Final Energy Consumption – Industry - Chemical and Petrochemical - all fuels used for energy in thechemical and petrochemical industry (e.g. petroleum products used as a fuel in a refinery).
• Final Energy Consumption – Industry - Non-Ferrous Metals - all fuels used for energy in the non-ferrousmetals industry (e.g. fuel oil used to heat bauxite in the aluminium industry).
• Final Energy Consumption – Industry - Non-Metallic Minerals - all fuels used for energy in the non-metallicminerals industry (e.g. coal used to heat limestone and clay in the cement industry).
• Final Energy Consumption – Industry - Transport Equipment - all fuels used for energy to manufacturemotor vehicles, ships, trains, planes and other (e.g. electricity used to power a robot in a car manufacturingcompany).
• Final Energy Consumption – Industry - Machinery - all fuels used for energy to manufacture machinery,computers, optical and electrical equipment, etc. (e.g. electricity used to power a robot in a computerchip manufacturing company).
• Final Energy Consumption – Industry - Mining and Quarrying - all fuels used for energy in the ore-extraction industry (e.g. fuel used to power a rock crusher machine in a granite quarry plant).
• Final Energy Consumption – Industry - Food and Tobacco - all fuels used for energy in the food andtobacco industry (e.g. steam used in a UHT treatment to sterilise dairy products in the milk industry).
• Final Energy Consumption – Industry - Paper, Pulp and Print - all fuels used for energy in the paper, pulpand print industry (e.g. electricity used to power a belt conveyor in a paper manufacturing company).
• Final Energy Consumption – Industry - Wood and Wood Products - all fuels used for energy to man-ufacture wood and wood products, excluding paper (e.g. electricity used to power a wood saw for theproduction of assembled parquet floors).
• Final Energy Consumption – Industry - Construction - all fuels used for energy in the construction,demolition and civil engineering sectors (e.g. gasoline used to power a demolition bulldozer).
• Final Energy Consumption – Industry - Textile and Leather - all fuels used for energy in the textile andleather industry (e.g. electricity used to power a leather drying machine).
• Final Energy Consumption – Industry - Non-specified (Industry) - all fuels used for energy in other notcovered industry sectors.
Final energy consumption - Transport
Final energy consumption - Transport covers the energy used for all transport activities (e.g. electricity inrail, liquid fossil fuels in road, kerosene in aviation, fuel oil in domestic navigation). Energy commoditiesflowing through this node will be consumed in one of the following categories:
Sankey diagrams for energy balance 13

• Final Energy Consumption – Transport - Rail - the energy used for rail transport activities (e.g. electricityin rail traffic or electrified urban transport systems).
• Final Energy Consumption – Transport - Road - the energy used for the propulsion of road vehicles (e.g.gasoline or diesel oil for cars).
• Final Energy Consumption – Transport - Domestic aviation - aviation fuels delivered to aircraft fordomestic aviation (e.g. jet kerosene consumption during domestic flights).
• Final Energy Consumption – Transport - Domestic Navigation - quantities delivered to vessels of all flagsnot engaged in international navigation (e.g. fuel oil consumed by a ship in a journey between two portsof the same country).
• Final Energy Consumption – Transport - Consumption in Pipeline transport - the energy used to supportand operate pipelines transporting gases, liquids and other commodities (e.g. energy used to pump naturalgas through a pipeline).
• Final Energy Consumption – Transport - Non-specified (Transport) - quantities used for transport activ-ities not covered elsewhere (e.g. fuels used in ports for ships’ unloaders).
Final energy consumption - Other sectors
Final energy consumption – Other sectors covers quantities consumed by sectors that cannot be classified asenergy, industry or transport (e.g. energy consumed in private households, commerce, administrative bodies).Energy commodities flowing through this node will be consumed in one of the following categories:
• Final Energy Consumption - Other Sectors - Services covers energy consumed by business and offices inthe public and private sectors (e.g. electricity consumed by a public administrative building or heatingoil consumed in a private school).
• Final Energy Consumption - Other Sectors - Households - energy consumed by all households (e.g. elec-tricity for lighting and powering domestic appliances, heating fuels such as gas, wood or gasoil, etc.).
• Final Energy Consumption - Other Sectors - Agriculture/Forestry - energy consumed for agriculture,hunting and forestry (e.g. diesel consumed by tractors).
• Final Energy Consumption - Other Sectors - Fishing - energy consumed for inland, coastal and deep-seafishing (e.g. fuel oil consumed by a fishing boat).
• Final Energy Consumption - Other Sectors - Non-specified (Other) - final energy consumption not classifiedunder any other code (e.g. military fuel use).
Description of fuels used in the Sankey diagramThe default view of the Sankey diagram shows one energy commodity, called "All products" or Total fuels,which is depicted using the colour turquoise (RGB 50, 175, 175). All products is the sum of all energy productsand is composed of the following fuel families:
• solid fuels (coal)
• total petroleum products (crude oil and derived petroleum products)
• gas
• nuclear heat
• derived heat
• renewable energies
• electricity
• waste.
Sankey diagrams for energy balance 14

Figure 14 shows the Sankey diagram for all the fuel families. Each fuel family is represented by a differentcolour. You can also go into a selected fuel family to see which individual fuels make up that family. Theindividual fuels are represented by a single colour within the same range as the corresponding family.
Figure 14: View of all the fuel families in the Sankey diagramSource: Eurostat
Figure 15 shows the colour associated with each family and each individual energy product (fuel) in the Sankeydiagram. There you can see the different fuel families displayed in the Sankey tool and the individual productsshown in each family.
Figure 15: Colour code for each fuel and fuel family in the Sankey diagramSource: Eurostat
Sankey diagrams for energy balance 15

What follows is a list of the different fuel families, the individual products included in each family and thecolours used to represent the different fuel families in the Sankey diagram.
Solid fuels
Solid fuels are fossil fuels covering various types of coals and solid products derived from coals. They con-sist of carbonised vegetable matter and usually have the physical appearance of a black or brown rock. Thecolour in the Sankey diagram is brown (RGB 128, 0, 0).The individual products in this family are:
• Coking Coal is a solid fossil fuel which is used in blast furnaces.
• Other Bituminous Coal is a solid fossil fuel mainly used for steam raising purposes (in other words, toincrease the temperature and/or pressure of steam).
• Lignite/Brown Coal is a solid fossil fuel presented as a soft brown combustible sedimentary rock. It isused almost exclusively as a fuel for steam-electric power generation.
• Coke Oven Coke is a solid fossil fuel obtained from carbonization of coal, principally coking coal, at hightemperature. It is used mainly in the iron and steel industry.
• Other solid fuels covers the rest of solid fossil fuels and includes Patent Fuels , Anthracite , Sub-bituminousCoal, Gas Coke , Coal Tar , BKB (brown coal briquettes) , Peat and Peat products , as well as Oil shaleand oil sands .
Total Petroleum products
Total petroleum products are fossil fuels (usually in liquid state) and include crude oil and all products de-rived from it (e.g. when processed in oil refineries), including motor gasoline, diesel oil, fuel oil, etc. The colourin the Sankey diagram is blue (RGB 20, 55, 90).The individual products in this family are:
• Crude oil is a mineral oil, extracted from underground reserves, comprising a mixture of hydrocarbonsand associated impurities such as sulphur. It was formed when large quantities of dead organisms, usuallyzooplankton and algae, were buried underneath sedimentary rock and subjected to both intense heat andpressure.
• Other primary oil includes the following primary (not processed) oil products: Natural gas liquids (NGL), Refinery feedstocks , Additives/Oxygenates and Other hydrocarbons .
• Motor Gasoline , also known as petrol, is obtained by processing crude oil. It is a transparent liquid thatis used primarily as a fuel in internal combustion engines.
• Gas/diesel oil is obtained by processing crude oil. It is a liquid fuel used in diesel engines.
• Kerosene type jet fuel is obtained by processing crude oil. It is a liquid fuel used in aviation engines.
• Total fuel oil or heavy fuel oil is obtained by processing crude oil. It is a liquid fuel used in a furnaceor boiler for the production of heat or in an engine for the generation of power (for example in maritimetransport).
• Other petroleum products include Refinery gas, Ethane , Liquified petroleum gas (LPG) , Aviation gasoline, Other kerosene , Gasoline type jet fuel , Naphtha , White Spirit and SBP , Lubricants , Bitumen ,Petroleum coke , Paraffin Waxes and Other Oil Products .
Gas
Gas includes natural gas and derived gases (the latter called "other gases" here). The colour in the Sankeydiagram is orange (RGB 250, 165, 25).The individual products in this family are::
• Natural gas consists mainly of methane (CH4). It is taken from natural underground reserves.
• Other gas consists of derived gases manufactured in some industrial processes. They include Coke OvenGas , Blast Furnace Gas , Gas Works Gas and Other recovered gases .
Nuclear heat
Nuclear heat is the thermal energy produced in a nuclear power plant (nuclear energy). It is obtained from thenuclear fission of atoms, usually of uranium and plutonium. The colour in the Sankey diagram is pink (RBG
Sankey diagrams for energy balance 16

200, 75, 150).Nuclear heat cannot be split into individual products.
Derived heat
Derived heat is used for warming spaces and for industrial processes and is obtained by burning combustiblefuels like coal, natural gas, oil, renewables (biofuels) and wastes, or also by transforming electricity to heat inelectric boilers or heat pumps.The colour in the Sankey diagram is salmon (RGB 249, 192, 166).Derived heatcannot be split into individual products.
Renewable energies
Renewable energies are energy sources that replenish (or renew) themselves naturally, such as solar, wind,hydro, geothermal, biofuels, renewable wastes, etc. The colour in the Sankey diagram is green (RGB 95, 180,65).The individual products in this family are:
• Hydro power refers to the energy obtained from falling or running water, which is converted into electricityin hydroelectric plants.
• Wind power refers to the energy obtained from wind, which is converted into electricity in wind turbines.
• Solar thermal is the energy collected from the sun by means of solar panels or similar devices to producedomestic hot water or electricity in solar thermal power plants.
• Solar photovoltaic is the direct conversion of sunlight into electricity by means of photovoltaic panels
• Solid biofuels are organic (non-fossil) solid materials of biological origin that can be burnt to produce heator electricity, like fuelwood, wood residues, etc.
• Liquid biofuels are organic (non-fossil) liquid materials of biological origin that can be burnt to produceheat or electricity. They can be used to replace petroleum products in motor engines, for example. Theyinclude Biodiesels , Biogasoline , Bio jet kerosene and Other liquid biofuels .
• Municipal waste (renewable)
• Biogas
• Geothermal energy
• Ambient heat (heat pumps)
• Other renewable energies include Tide, Wave and Ocean and Charcoal
Electricity
Electricity is a form of energy associated with the presence and flow of electric charges. It has a very widerange of applications in almost all kinds of human activity ranging from industrial production, household use,agriculture or commerce and it is normally used for running machines, lighting and heating. The colour in theSankey diagram is red (RGB 215, 60, 65).Electricity cannot be split into individual products.
Waste (non-renewable)
Waste (non-renewable) consists of materials coming from combustible industrial, institutional, hospital andhousehold wastes such as rubber, plastics, waste fossil oils and other similar types of wastes, which can be eithersolid or liquid. The colour in the Sankey diagram is yellow (RGB 255, 215, 0).The individual products in thisfamily are:
• Municipal waste (non-renewable) covers wastes produced by households and the tertiary sector from non-renewable origin, like plastics, synthetic rubber, inorganic materials, etc. which are incinerated to produceelectricity and/or heat.
• Industrial wastes cover wastes of industrial non-renewable origin (solid and liquids), like used oils, chemicalsolvents, paper products, etc. which is burnt to produce electricity and/or heat.
Sankey diagrams for energy balance 17

How to interpret a Sankey diagramTo illustrate how to interpret a Sankey diagram as displayed by the Eurostat Sankey tool, we have selected anexample showing the Sankey for the EU (only for illustrative purposes, data correspond to an old release for2014), showing details for fuel families.
• If you look at the Sankey diagram in Figure 14, you can see that most of the energy available in the EUis imported, while only a smaller proportion is produced internally.
If you select the "Pie charts" option in the Available from all sources node, you can see the distribution ofincoming fuels and flows.
• In the example, around 36% of the energy comes from the Production flow, against 64% which is imported.The pie charts show that most of the energy available is in the form of total petroleum products (includingcrude oil), followed by natural gas, solid fuels, renewable energies and nuclear heat.
If you want to see more detail on the composition of each family, you can view the detailed Sankey for eachfamily and the relevant pie charts.
• In the example, 62% of the total energy available in the EU goes into the transformation sector, while38% is used without any transformation (i.e. Direct carry-over).
If you expand the "Transformation" node, you can see the transformation sectors in detail (Figure 16). You canobtain data on the composition of sectors and fuels by displaying pie charts in every node you are interested in.If you do this in the Transformation input node, for example, you can see that:
• the family petroleum products constitute almost half of the amount of fuels sent to Transformation
Figure 16: Disaggregated view of the transformation sector at
• the Refineries sector deals with 44% of the fuels going into transformation (Figure 17).
Figure 17: Pie chart showing the distribution of outgoing flows from the
If you want to see how the Refineries sector changes over time in that node, select the "Time graphs" option.Figure 18 shows an example of one of the displayed graphs, namely “Fuels going out from refineries”. If youare interested in the composition of fuels sent into Thermal power stations, you can obtain it by displaying piecharts in that node.
Figure 18: Example of time graph showing the distribution of outgoing fuels from the
• In the example, 53% are solid fuels, followed by 26% gas and 14% renewable energies (combustible renew-ables like solid or liquid biofuels).
You can use the "Exchanges, transfers and returns" node to see the amount of renewable energies produceddirectly in the form of electricity (like hydro, wind or solar photovoltaic). If you want to see details of eachrenewable energy source in each node, you can do this by displaying the detailed family diagram for the renewableenergies flow. The "Available after transformation" node shows fuels ready to be used or exported.
• If you go to the Exports node and display the pie charts, you will see that the energy exported by the EUin 2014 consisted mainly of petroleum products.
• If you display the pie charts for the “Total petroleum products” family in the Exports node, you will seethat most of them (86%) are secondary energy products like gas/diesel oil, gasoline and fuel oil, whileonly 14% is crude or other primary oil.
Sankey diagrams for energy balance 18
The "Final energy consumption" node shows the amount of fuels consumed for energy purposes in the differentfinal sectors (industry, transport, residential, commercial, etc.). Most of the fuels consumed in the transportsector are petroleum products and most of them are consumed in road transport. You can take a detailed lookat each individual sector. For the residential sector, most of the energy consumed is gas, followed by electricityand renewable energies (mostly solid biofuels and some solar thermal). You can analyse the rest of the sectorsand/or flows in detail using a combination of the different features offered by the Sankey tool. These will giveyou a general and/or detailed overview of the energy flows/sectors in the territory in question.
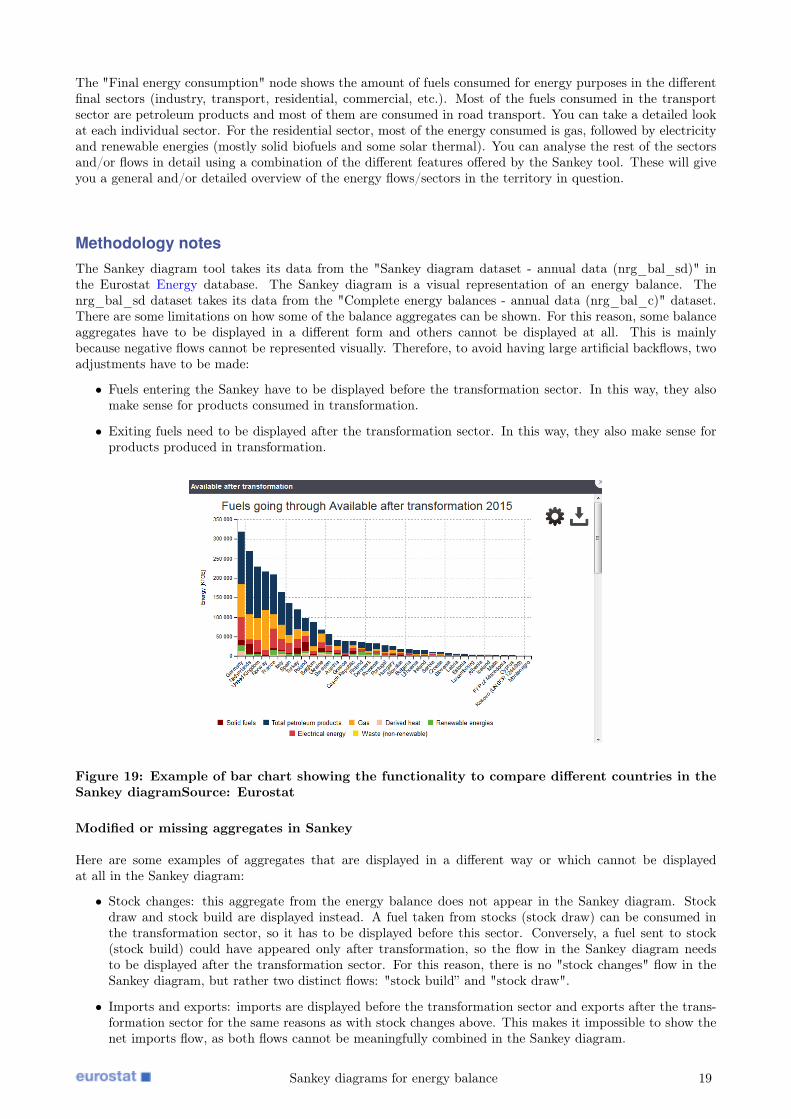
Methodology notesThe Sankey diagram tool takes its data from the "Sankey diagram dataset - annual data (nrg_bal_sd)" inthe Eurostat Energy database. The Sankey diagram is a visual representation of an energy balance. Thenrg_bal_sd dataset takes its data from the "Complete energy balances - annual data (nrg_bal_c)" dataset.There are some limitations on how some of the balance aggregates can be shown. For this reason, some balanceaggregates have to be displayed in a different form and others cannot be displayed at all. This is mainlybecause negative flows cannot be represented visually. Therefore, to avoid having large artificial backflows, twoadjustments have to be made:
• Fuels entering the Sankey have to be displayed before the transformation sector. In this way, they alsomake sense for products consumed in transformation.
• Exiting fuels need to be displayed after the transformation sector. In this way, they also make sense forproducts produced in transformation.
Figure 19: Example of bar chart showing the functionality to compare different countries in theSankey diagramSource: Eurostat
Modified or missing aggregates in Sankey
Here are some examples of aggregates that are displayed in a different way or which cannot be displayedat all in the Sankey diagram:
• Stock changes: this aggregate from the energy balance does not appear in the Sankey diagram. Stockdraw and stock build are displayed instead. A fuel taken from stocks (stock draw) can be consumed inthe transformation sector, so it has to be displayed before this sector. Conversely, a fuel sent to stock(stock build) could have appeared only after transformation, so the flow in the Sankey diagram needsto be displayed after the transformation sector. For this reason, there is no "stock changes" flow in theSankey diagram, but rather two distinct flows: "stock build” and "stock draw".
• Imports and exports: imports are displayed before the transformation sector and exports after the trans-formation sector for the same reasons as with stock changes above. This makes it impossible to show thenet imports flow, as both flows cannot be meaningfully combined in the Sankey diagram.
Sankey diagrams for energy balance 19
– Note: for aggregates of countries (e.g. EU), imports and exports are calculated as the sum of totalimports or total exports for each of the countries included in the aggregate, without subtracting theinternal trade between the countries of the aggregate (i.e exports of one country of the aggregate toanother country of the aggregate are not subtracted).
• Gross inland consumption: cannot be displayed in the Sankey diagram since it depends on net imports.As explained above, net imports cannot be displayed in the Sankey.
• Statistical difference: statistical difference is simply a positive or negative number in the table of theenergy balance. In the Sankey diagram, it is either an incoming or outgoing flow depending on its sign.
New aggregates in Sankey
Conversely, some new aggregates need to be included in the display of the Sankey diagram. This is the case forthe following aggregates, which are not shown in the energy balance:
• Available from all sources: the aggregate where all the entering flows converge, namely imports, productionand stock draw
• Transformation backflow: the minimal backflow needed to cover all transformation inputs, for an exactdefinition see above
• Direct carry-over: the total amount of fuels which are directly consumed and do not go through transfor-mation
• Available after transformation: the sum of transformation and direct carry-over
• Final consumption: the sum of the Final energy consumption and Final non-energy consumption energybalance flows. This is created only to introduce the statistical difference in a meaningful way in the display.
In addition, some flows shown separately in the energy balance are put together in the Sankey diagram. Thisis done especially when they are very small and where separating them does not add any value in the display.For an example of this see the "Other production" or "Transformation losses" nodes created exclusively for theSankey diagram. The nodes are defined above.
What to do with small or negative flows
When handling very small flows in the Sankey diagram, a special methodology is needed. Some flows mayeven be negative due to statistical discrepancies. The method used is as follows: an ad hoc threshold is appliedto decide whether any given fuel on display inside a Sankey diagram flow should be drawn or not. This thresholdis quite arbitrary and reflects only the limitations on what can be shown.In detail, two rules are applied to eachsingle flow in the Sankey tool:
• The entire flow is drawn only if the energy content of at least one fuel on display inside this flow, expressedin the currently selected unit, rounds to 1 or more.
• If the resulting width of a fuel inside this flow on the screen, expressed in pixels, is less than 0.5, it isincreased to 0.5 pixels.
Nodes to which no flow is attached after this selection (i.e. none flowing in and none flowing out) are not drawneither.
See also• Energy statistics introduced
• Energy production and imports
• Energy statistics - an overview
• Shedding light on energy in the EU - a guided tour of energy statistics
Sankey diagrams for energy balance 20

Database• Energy , see:
Energy statistics, quantities - annual data (nrg_quanta)
Energy balances (nrg_bal)
Sankey diagram dataset - annual data (nrg_bal_sd)
Dedicated section• Energy
Methodology• Energy statistics - energy balances (ESMS metadata file — nrg_bal_esms)
Legislation• Regulation (EC) No 1099/2008 of 22 October 2008 on energy statistics
External links• Wikipedia - Sankey diagram
• Sankey diagrams of the International Energy Agency
• Sankey Tool of the U.S. Department of Energy
View this article online at http: // ec. europa. eu/ eurostat/ statistics-explained/ index. php/ Sankey_diagrams_ for_ energy_ balance
Sankey diagrams for energy balance 21