sankey diagrama melt furnaces sorg-g-oct04-qk
DESCRIPTION
furnaces heat sankey glassTRANSCRIPT
MELTING TECHNOLOGY
OCTOBER 2004 294 GLASS
One of the conclusions reached at the United Nations
Climate Convention in Kyoto in 1997 was the need
for self-regulation as a method of reducing
greenhouse gas emission levels within a decade.
By the year 2012 European Union (EU) countries will have to
reduce their emissions by 8% from their 1990 level. EU
authorities have defined their self-regulation programme so that
EU countries will make individual contributions to the total
amount of carbon dioxide reduction (or more precisely, the CO2
equivalent of a number of different greenhouse gases).
The reduction programme will operate from 2008-2012.
From 2005 onwards, emission monitoring and trading
programmes will be established. During the first stage
emissions will have to be registered
nationally, in accordance with an ‘allocation
plan’ to be drawn up by each EU country.
Each procedure will be different for each
country. Each company registered as an
emission source must acquire certificates for
their current emission level. In Germany, the
National Environment Ministry has already
stated that a limited number of certificates
will be made available and that these will not
equate with the total emission levels
registered in the allocation plan(1).
Limiting emissions will have a major
economic impact. The German Glass
Industry Federation (HVG) is concerned and has discussed
the matter with the Environment Ministry, placing emphasis
on the special situation for the glass manufacturing industry
where some basic aspects of melting technology mean that
significant energy savings cannot be expected within the near
future. No conclusion was reached during the discussions
and the HVG has therefore called for further lobbying(2).
The basic energy balance of a glass melting furnace and the
energy efficiency of modern furnaces are described below.
This data is analysed in order to identify any possible way of
optimising energy consumption.
Energy balance ina glass furnaceA standard type of glass
furnace will be used for
comparison. The most
common furnace type in
use for container glass is
end-fired and heated with
gas or oil. A regenerator is used at the end of the furnace to
recover waste gas energy, and the batch is charged from one
or both sides near the back wall. The energy balance for an
energy-consuming process can be shown in a Sankey
diagram.
Heat content of the glassThe heat content of the molten glass consists of the chemical
heat reached to convert the batch to glass, and the heat
required to raise the glass to the target or exit temperature. The
chemical heat needed to convert batch to glass is independent
of the melting technology used. It can only be influenced by
the cullet ratio or the batch moisture level.
Fig 3 shows how the chemical heat, the
cullet ratio and the moisture content of the
batch relate to each other. The extreme
values shown are the result of a 25%
reduction in energy consumption. The
glass exit temperature depends on the
individual furnace design and the glass
produced. High quality glass requires a
higher process temperature in order to
ensure complete refining.
Special refining procedures and furnace
designs, such as vacuum refining or the
shallow refining bank, can help to reduce
the average process temperature by releasing
blisters without running the furnace at high
temperatures. However, the potential energy
savings need to be studied in relation to the
energy balance of the entire system.
Heat flow through the wallsHeat loss through the bottom, tank side
walls, furnace superstructure (the side
The challengeDr MatthiasLindig*examines thefeasibility ofreducinggreenhouse gasemissions in theglass industry,in line withEuropean Unionobjectives.
of conventional furnace design
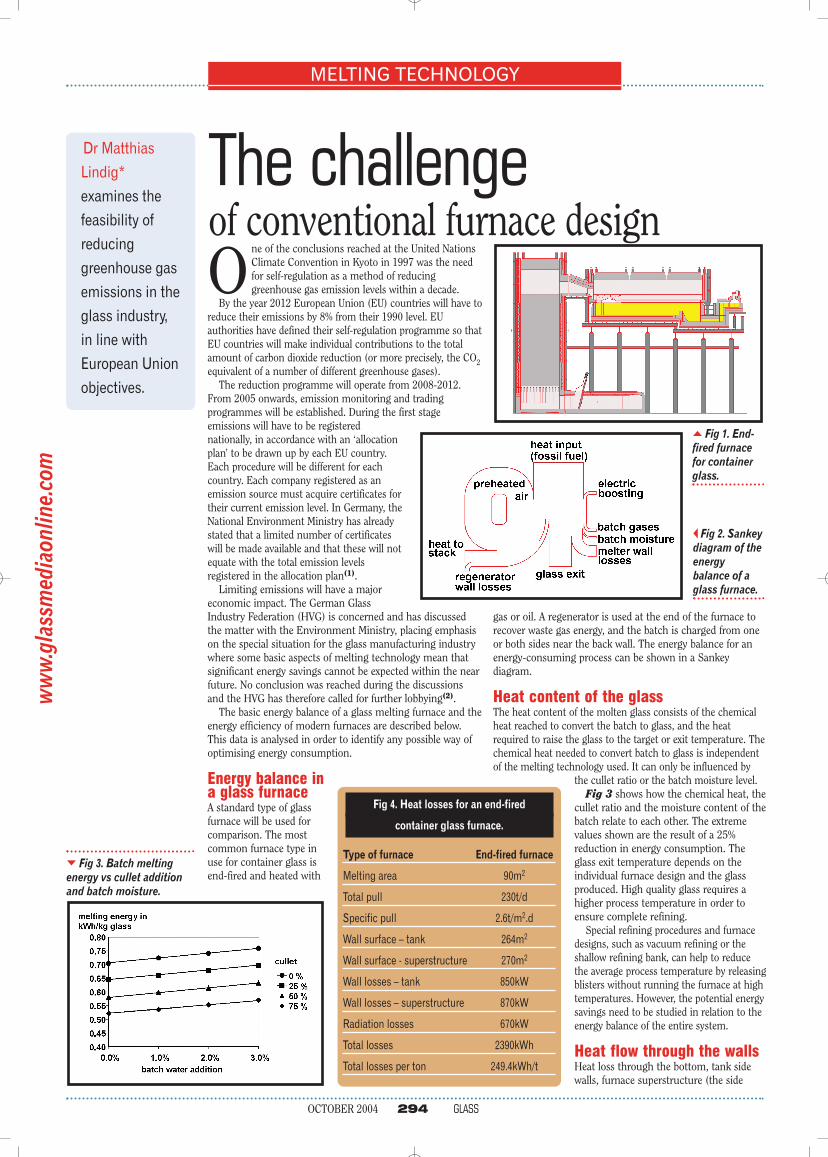
� Fig 1. End-fired furnacefor containerglass.
� Fig 2. Sankeydiagram of theenergybalance of aglass furnace.
Fig 4. Heat losses for an end-fired
container glass furnace.
Type of furnace End-fired furnace
Melting area 90m2
Total pull 230t/d
Specific pull 2.6t/m2.d
Wall surface – tank 264m2
Wall surface - superstructure 270m2
Wall losses – tank 850kW
Wall losses – superstructure 870kW
Radiation losses 670kW
Total losses 2390kWh
Total losses per ton 249.4kWh/t
� Fig 3. Batch meltingenergy vs cullet additionand batch moisture.
ww
w.g
lass
med
iaon
line.
com
walls of the combustion chamber) and crown has
been significantly reduced in recent years by the
development of new refractories with several layers
with a higher insulating efficiency. A typical heat
loss calculation for a 90m2 melting area end-fired
furnace is given in fig 4.
Total losses from furnace walls are less than half
of the heat content of the glass so there is no
significant potential for reducing wall heat loss,
except by minimising uninsulated wall areas.
Joints and areas that are kept free of insulation
because of bracing can comprise up to 10% of the
overall wall surface.
Wall heat loss is actually a function of the
average process temperature and melter surface
area for the furnace. Larger furnaces have a better
ratio between pull and melter surface compared
with smaller furnaces. Furnaces with several
chambers (ie for melting and refining) will always
have higher relative wall losses.
Regenerator efficiencyThe third potential optimisation area is the
regenerator efficiency. The temperature of the
preheated air depends on the heat capacity and the
surface of the checker packing, the flow speed of
the gases and the temperature difference between
gases and packing.
Efficient end-fired furnaces operate with a waste
gas temperature of less than 450°C after the
regenerator, and a preheat temperature of more
than 1200°C. Further small increases in heat
recovery are possible but if the combustion air
temperature is to be increased further, the
remaining temperature difference between the
packing and the air will be very small.
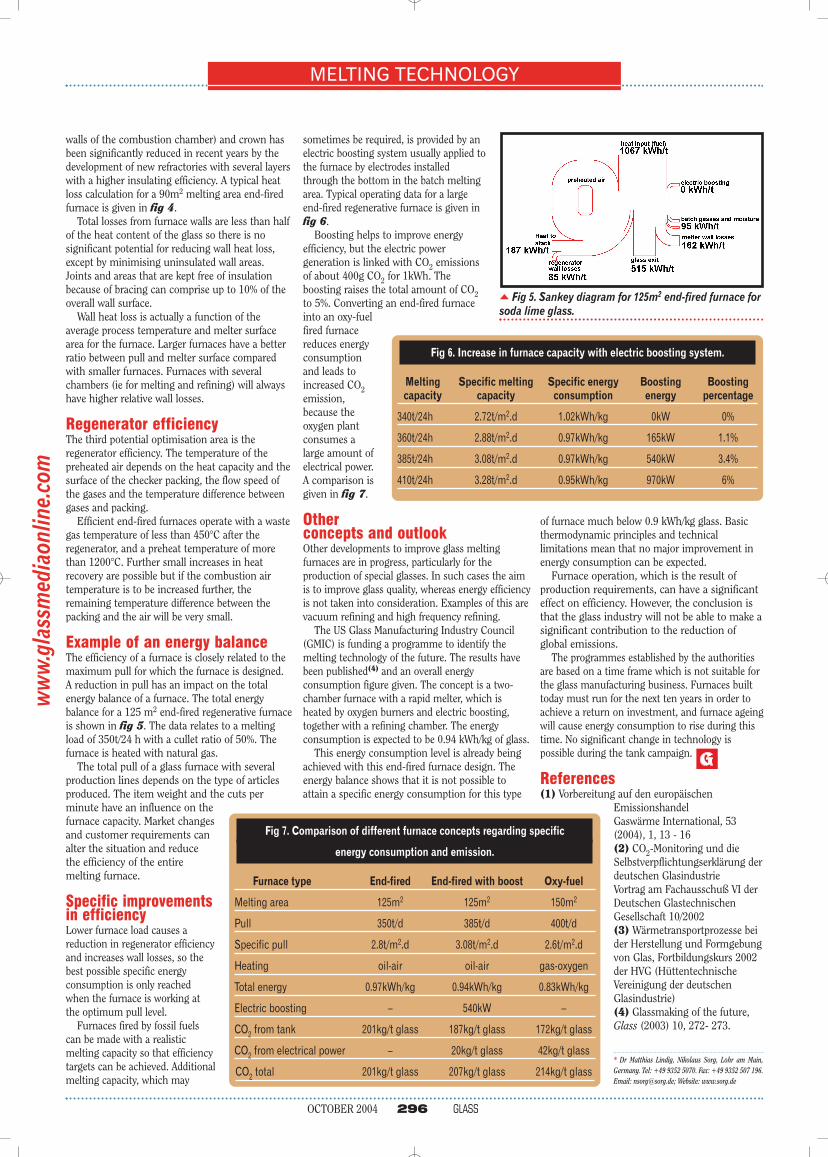
Example of an energy balance The efficiency of a furnace is closely related to the
maximum pull for which the furnace is designed.
A reduction in pull has an impact on the total
energy balance of a furnace. The total energy
balance for a 125 m2 end-fired regenerative furnace
is shown in fig 5. The data relates to a melting
load of 350t/24 h with a cullet ratio of 50%. The
furnace is heated with natural gas.
The total pull of a glass furnace with several
production lines depends on the type of articles
produced. The item weight and the cuts per
minute have an influence on the
furnace capacity. Market changes
and customer requirements can
alter the situation and reduce
the efficiency of the entire
melting furnace.
Specific improvementsin efficiencyLower furnace load causes a
reduction in regenerator efficiency
and increases wall losses, so the
best possible specific energy
consumption is only reached
when the furnace is working at
the optimum pull level.
Furnaces fired by fossil fuels
can be made with a realistic
melting capacity so that efficiency
targets can be achieved. Additional
melting capacity, which may
MELTING TECHNOLOGY
sometimes be required, is provided by an
electric boosting system usually applied to
the furnace by electrodes installed
through the bottom in the batch melting
area. Typical operating data for a large
end-fired regenerative furnace is given in
fig 6.
Boosting helps to improve energy
efficiency, but the electric power
generation is linked with CO2 emissions
of about 400g CO2 for 1kWh. The
boosting raises the total amount of CO2
to 5%. Converting an end-fired furnace
into an oxy-fuel
fired furnace
reduces energy
consumption
and leads to
increased CO2
emission,
because the
oxygen plant
consumes a
large amount of
electrical power.
A comparison is
given in fig 7.
Otherconcepts and outlookOther developments to improve glass melting
furnaces are in progress, particularly for the
production of special glasses. In such cases the aim
is to improve glass quality, whereas energy efficiency
is not taken into consideration. Examples of this are
vacuum refining and high frequency refining.
The US Glass Manufacturing Industry Council
(GMIC) is funding a programme to identify the
melting technology of the future. The results have
been published(4) and an overall energy
consumption figure given. The concept is a two-
chamber furnace with a rapid melter, which is
heated by oxygen burners and electric boosting,
together with a refining chamber. The energy
consumption is expected to be 0.94 kWh/kg of glass.
This energy consumption level is already being
achieved with this end-fired furnace design. The
energy balance shows that it is not possible to
attain a specific energy consumption for this type
OCTOBER 2004 296 GLASS
of furnace much below 0.9 kWh/kg glass. Basic
thermodynamic principles and technical
limitations mean that no major improvement in
energy consumption can be expected.
Furnace operation, which is the result of
production requirements, can have a significant
effect on efficiency. However, the conclusion is
that the glass industry will not be able to make a
significant contribution to the reduction of
global emissions.
The programmes established by the authorities
are based on a time frame which is not suitable for
the glass manufacturing business. Furnaces built
today must run for the next ten years in order to
achieve a return on investment, and furnace ageing
will cause energy consumption to rise during this
time. No significant change in technology is
possible during the tank campaign.
References(1) Vorbereitung auf den europäischen
Emissionshandel
Gaswärme International, 53
(2004), 1, 13 - 16
(2) CO2-Monitoring und die
Selbstverpflichtungserklärung der
deutschen Glasindustrie
Vortrag am Fachausschuß VI der
Deutschen Glastechnischen
Gesellschaft 10/2002
(3) Wärmetransportprozesse bei
der Herstellung und Formgebung
von Glas, Fortbildungskurs 2002
der HVG (Hüttentechnische
Vereinigung der deutschen
Glasindustrie)
(4) Glassmaking of the future,
Glass (2003) 10, 272- 273.
* Dr Matthias Lindig, Nikolaus Sorg, Lohr am Main,
Germany. Tel: +49 9352 5070. Fax: +49 9352 507 196.
Email: [email protected]; Website: www.sorg.de
ww
w.g
lass
med
iaon
line.
com
� Fig 5. Sankey diagram for 125m2 end-fired furnace forsoda lime glass.
Fig 6. Increase in furnace capacity with electric boosting system.
Melting Specific melting Specific energy Boosting Boostingcapacity capacity consumption energy percentage
340t/24h 2.72t/m2.d 1.02kWh/kg 0kW 0%
360t/24h 2.88t/m2.d 0.97kWh/kg 165kW 1.1%
385t/24h 3.08t/m2.d 0.97kWh/kg 540kW 3.4%
410t/24h 3.28t/m2.d 0.95kWh/kg 970kW 6%
Fig 7. Comparison of different furnace concepts regarding specific
energy consumption and emission.
Furnace type End-fired End-fired with boost Oxy-fuel
Melting area 125m2 125m2 150m2
Pull 350t/d 385t/d 400t/d
Specific pull 2.8t/m2.d 3.08t/m2.d 2.6t/m2.d
Heating oil-air oil-air gas-oxygen
Total energy 0.97kWh/kg 0.94kWh/kg 0.83kWh/kg
Electric boosting – 540kW –
CO2 from tank 201kg/t glass 187kg/t glass 172kg/t glass
CO2 from electrical power – 20kg/t glass 42kg/t glass
CO2 total 201kg/t glass 207kg/t glass 214kg/t glass