e!sankey - ifu hamburg gmbh...ifu hamburg gmbh e!sankey 4 user manual page 5 1 introduction e!sankey...
TRANSCRIPT

e!Sankey v4.5
User Manual
ifu Hamburg GmbH Max-Brauer-Allee 50
22765 Hamburg / Germany
DocVersion: 3.51
Date: May 2018 Publisher: ifu Hamburg GmbH
www.ifu.com
www.e-sankey.com

e!Sankey® is a registered trademark of ifu Hamburg GmbH
Microsoft and MS are registered trademarks. Windows and Excel are trademarks of
Microsoft Corp.
Other brand and product names are trademarks or registered trademarks of their
respective holders.
Information in this user manual is subject to change without notice. No liability for
the correctness of the information in this manual. All figures are for illustration
purposes only and contain fictitious data.
Reproduction or translation of this manual is permitted and encouraged, as long as
the original author and the document version number and date are cited, and the
copyright notice is maintained.

ifu Hamburg GmbH e!Sankey 4
User Manual Page 3
Contents 1 Introduction .................................................................................. 5 2 Installation ................................................................................... 7
License Activation .......................................................................... 8 3 General Functions of e!Sankey ...................................................... 12
Screen Layout and Windows Handling ............................................ 12 Undo/Redo .................................................................................. 14 Search ....................................................................................... 14 Option Settings ........................................................................... 15
4 Getting Started............................................................................ 19 Creating a Diagram File ................................................................ 19 Three Basic Steps: Drawing Processes and Arrows, Entering Flows .... 19
5 Arrows ....................................................................................... 23 Flows Table ................................................................................. 23 Arrow Properties .......................................................................... 24 Arrow Labels ............................................................................... 26 Flow Labels ................................................................................. 28 Arrow Routing and Waypoints ....................................................... 34
6 Processes ................................................................................... 39 Options for Processes ................................................................... 39 Using Images and Icons for Processes ............................................ 42 Hidden Processes ......................................................................... 43 Changing Process Size and Shape .................................................. 44 Aligning Processes ....................................................................... 44
7 Additional Diagram Elements ......................................................... 46 Graphical Shapes ......................................................................... 46 Text Element ............................................................................... 47 Legend ....................................................................................... 47 Scale .......................................................................................... 48 Background Image ....................................................................... 49 Useful Hints for Drawing Sankey Diagrams ..................................... 51
8 Entries ....................................................................................... 52 9 Unit Types .................................................................................. 56 10 Templates ................................................................................... 62 11 Live Link to Excel ......................................................................... 64 12 Process Operations ...................................................................... 68
Automatic ................................................................................... 68 Merge ........................................................................................ 70 Sum ........................................................................................... 72 Difference ................................................................................... 72 Split ........................................................................................... 73 Transform ................................................................................... 75 Ignore ........................................................................................ 76
13 Exporting and Printing .................................................................. 80 14 Further Hints ............................................................................... 82 15 SDK and Integration of Sankey Diagrams ....................................... 83
General Information ..................................................................... 83 Handling Key Fields (for SDK) ....................................................... 83
Index .............................................................................................. 86

e!Sankey 4 ifu Hamburg GmbH
Page 4 User Manual

ifu Hamburg GmbH e!Sankey 4
User Manual Page 5
1 Introduction
e!Sankey is a software tool that helps you draw so-called Sankey diagrams.
Figure 1: A simple Sankey diagram
Sankey diagrams are directed graphs, where the magnitude of the arrow line represents the quantity of flow. Today, Sankey diagrams are used for a
variety of flow visualizations. These are not limited to energy or material, but indeed to any (real or virtual) matter that flows "from" a source "to" a
destination.
"Sankey diagrams are a specific type of flow diagram, in which the width of the arrows is shown proportionally to the flow quantity. They are typically
used to visualize energy or material transfers between processes." (Wikipedia)
Sankey diagram visualizations draw the viewer’s attention to the largest
flows, while at the same time showing the proportions of the flows among each other and indicating a "from-to" flow direction. In that sense they
convey efficiency of transformation processes and also allow to assess the balance of input/output streams.
Sankey diagrams are named after Captain Matthew Henry Phineas Riall Sankey, an Irish engineer (1853-1925).
The software e!Sankey is a member of the Umberto software1 family. While e!Sankey simply allows drawing Sankey diagrams, the Umberto software
tools are fully-fledged modelling tools where material, energy and cost flows are determined based on process specifications. The Sankey diagrams in
Umberto are one of the display options to visualize the calculated flows and environmental impacts.
We hope you enjoy working with e!Sankey!
1 http://www.umberto.de

e!Sankey 4 ifu Hamburg GmbH
Page 6 User Manual
Further Reading on Sankey Diagrams
Schmidt, Mario (2006) Der Einsatz von Sankey-Diagrammen im Stoffstrom-management. Beiträge der Hochschule Pforzheim Nr. 124 (in German)
Schmidt, Mario (2008) The Sankey Diagram in Energy and Material Flow Management. Part I: History. Journal of Industrial Ecology 12 (1), 82–94
Schmidt, Mario (2008) The Sankey Diagram in Energy and Material Flow
Management. Part II: Methodology and Current Applications. Journal of Industrial Ecology 12 (2), 173–185
Links
http://en.wikipedia.org/wiki/Sankey_diagram http://www.sankey-diagrams.com
http://www.e-sankey.com
A hint or additional advice.
Cross-reference to a related topic within the user manual
ifu Hamburg GmbH e!Sankey 4
Page 7 User Manual
2 Installation
Administrator rights are required to install e!Sankey on your computer. Contact your administrator, if you only have limited rights on your machine.
System Requirements To install and run e!Sankey the following requirements have to be met:
• Operating system Windows 7, Windows 8, or Windows 10
• Microsoft .NET Framework 4.62 • Memory 1 GB RAM or higher
• Available hard disk space: at least 250 MB • Monitor with at least 1280 x 1024 px resolution (recommended) and
up to 1920 x 1080 px resolution3
Running the Installer File
Run the installer file by clicking on the downloaded executable (the file is named 'esankey.exe' or 'esankey4.exe'). You need administrator rights on your local machine for the installation.
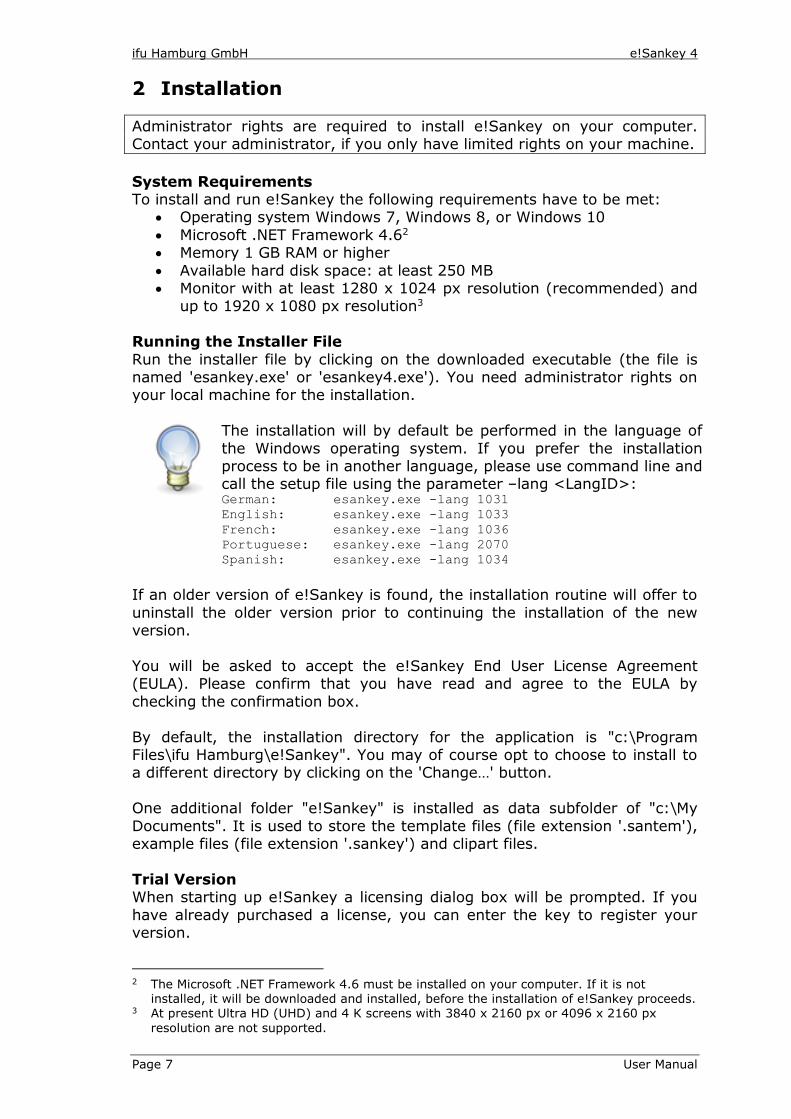
The installation will by default be performed in the language of
the Windows operating system. If you prefer the installation process to be in another language, please use command line and call the setup file using the parameter –lang <LangID>: German: esankey.exe -lang 1031
English: esankey.exe -lang 1033
French: esankey.exe -lang 1036
Portuguese: esankey.exe -lang 2070
Spanish: esankey.exe -lang 1034
If an older version of e!Sankey is found, the installation routine will offer to
uninstall the older version prior to continuing the installation of the new version.
You will be asked to accept the e!Sankey End User License Agreement (EULA). Please confirm that you have read and agree to the EULA by
checking the confirmation box.
By default, the installation directory for the application is "c:\Program Files\ifu Hamburg\e!Sankey". You may of course opt to choose to install to a different directory by clicking on the 'Change…' button.
One additional folder "e!Sankey" is installed as data subfolder of "c:\My
Documents". It is used to store the template files (file extension '.santem'), example files (file extension '.sankey') and clipart files.
Trial Version When starting up e!Sankey a licensing dialog box will be prompted. If you
have already purchased a license, you can enter the key to register your version.
2 The Microsoft .NET Framework 4.6 must be installed on your computer. If it is not
installed, it will be downloaded and installed, before the installation of e!Sankey proceeds. 3 At present Ultra HD (UHD) and 4 K screens with 3840 x 2160 px or 4096 x 2160 px
resolution are not supported.
e!Sankey 4 ifu Hamburg GmbH
Page 8 User Manual
If you don't enter license key, you can run e!Sankey as a trial version for 14
days from the date of installation. The trial version almost has the same functionality as the full version, but the following limitations:
• watermark over the Sankey diagram in the editor
• no export in EMF format
The trial version prompts for a registration key on start-up. Just leave the license key field empty and hit 'OK'.
To get a licensed version of e!Sankey, you can purchase a license key from our online shop at http://www.e-sankey.com.
Users of the trial version can purchase license keys using the online shop at http://www.e-sankey.com/en/purchase/ or by contacting an e!Sankey sales
representative at ifu Hamburg ([email protected]).
License Activation
This section refers to the activation of single-user or multi-seat license packages. Floating licenses have to be activated
differently. We are providing a separate documentation to administrators, helping them to configure and activate the floating licenses server.
When launching an unregistered copy of e!Sankey, a licensing dialog will be
displayed. This dialog can also be launched via the 'Help' menu using the entry 'Enter/Edit License...'.
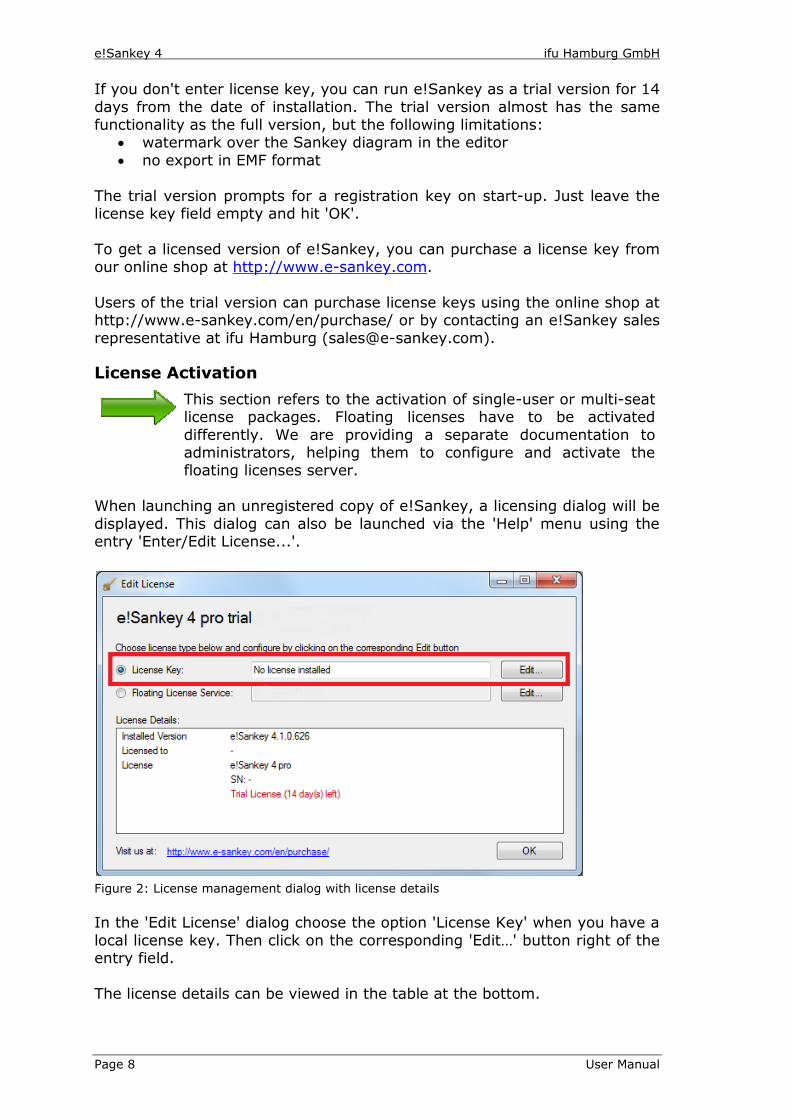
Figure 2: License management dialog with license details
In the 'Edit License' dialog choose the option 'License Key' when you have a
local license key. Then click on the corresponding 'Edit…' button right of the entry field.
The license details can be viewed in the table at the bottom.

ifu Hamburg GmbH e!Sankey 4
User Manual Page 9
Figure 3: Entering and activating the license key
Enter the license key you have received when purchasing the software and
authenticate the license key online by clicking on 'Activate'. An internet connection is required and the process should take only a few seconds.
There are three options to activate your license:
• Online: This is the fastest way to activate a license and should be
used if you are connected to the Internet and if the security setting of your network connection allows communication with a server over
the Internet. License data will be transferred encrypted to our license management server. The server will send the activated license back to your computer within seconds.
• Via Web Page: This is a three step process. It can be used if e!Sankey is behind a firewall that prohibits the online activation as
described above. You will have to create a license info file ('eSankeyLicenseInfo.lic') using the button "1. Save License Info". This file has to be uploaded to our authentication web page using the
link offered. In return you will be provided a processed license info file that you can download to your computer. Finally this
'AuthenticatedLicense.lic' file has to be imported using the button "3. Import License Info".
• By E-mail: This is also a three step process, similar to the above: You will create a license info file ('eSankeyLicenseInfo.lic') that you can send to us by e-mail. You will receive an authentication license
info file from us in return by e-mail too. This .lic file then has to be imported. Allow up to 2 work days for processing.
Should you have upgraded from e!Sankey standard to e!Sankey pro, or from a temporary license to an indefinite license, or have extended the
number of users (multi-seat license) you will be asked upon completion of the extended license to just update your license. In this case your existing
license will be updated on our activation server and all you need to do is click on 'Update' in the 'Enter/Edit License' dialog.
License Transfer/Deactivation: In case you have obtained a new computer, or you decide to continue to use e!Sankey on a different
computer from the computer where you originally installed it, the license needs to be transferred. To transfer (move) a license of the software to another computer, proceed as follows:
• In the existing e!Sankey installation, run e!Sankey a last time: From the 'Help' menu choose 'Enter/Edit License...' to open the licensing
dialog. • Click on 'Deactivate' in this dialog. The license will be removed.

e!Sankey 4 ifu Hamburg GmbH
Page 10 User Manual
• On the new computer: Use the installation file and install the latest
version of the software (see above). Enter the license key in the license dialog. Click on 'Activate' or use one of the two other options to activate the license
If a deactivation of the license is not possible any more (e.g. because your
computer has been stolen, the hard disk has crashed, etc.), please contact [email protected] to deactivate the license. Should you have lost your license key information, please also contact [email protected] to
retrieve it.
Updates When new versions of e!Sankey are released, a notification on the start page will indicate the availability of an update. Click on the link shown to
access a web page where you can download the new version.
You can also use the command 'Check for Updates…' from the Help menu, to find out whether an update is available.
Please note that both, the automatic update notifier, as well as the check for updates feature might not work, if you don't have access to the
Internet, or if security settings of your firewall prohibit communication with the update server. In this case, please check the community board for announcements regularly, and contact ifu Hamburg GmbH for a new version
to be sent.
The update notification service can be deactivated in the Options dialog accessible via the Tools menu.
Support The help system (Menu Help > Index, or press F1 on the keyboard) is
always the first option when you have a question on the software. It describes the functions available, but also contains hints on the use of e!Sankey, and on modelling the product life cycle.
For technical support issues the e!Sankey help desk can be reached by e-
mail at [email protected]
In your support request please indicate the exact version number (see About dialog) of e!Sankey you are using, and the operating system of your computer. Please try to be as specific as possible when explaining the
technical problem that occurred.
In some cases our help desk will ask you to submit log files from your computer, which can help us identify the issue. The log files can be found at the following default location (localized operating systems might have
different folder names): C:\Users\[USER]\AppData\Roaming\Ifu Hamburg GmbH, Germany\e!Sankey\4\log
The log file is called "general.txt" and should be submitted with your technical support inquiry to our help desk. It can be viewed with a simple
text editor.

ifu Hamburg GmbH e!Sankey 4
User Manual Page 11
A community bulletin board is available at http://forum.e-sankey.com. It contains useful tips and tricks, and also has a FAQ (frequently asked
questions) section. You can browse the posts of other users of e!Sankey and discuss with them.
Uninstalling To uninstall e!Sankey from your computer, remove the software via the
Control Panel > Add/Remove Programs. A deinstallation of the product is proposed when running the installation of a
newer version of the software. Please uninstall prior to installing a new version.

e!Sankey 4 ifu Hamburg GmbH
Page 12 User Manual
3 General Functions of e!Sankey
Screen Layout and Windows Handling
The main working area of the e!Sankey application has several panels and
areas. In the default layout, they look more or less like this:
Figure 4: e!Sankey default screen layout, window panes are numbered
The main window panes are:
• Editor (Drawing Area): this is where the Sankey diagrams are
drawn, several diagrams can be opened at once (1) • Properties: allows to edit the properties of the network element
marked in the drawing area (2) • Entries: list of material, energy, or the like that are used as flows in
the arrows of the Sankey diagram (3)
• Controller: allows to scale the flows in the diagram separately for each unit type, edit unit types (4)
• Overview: shows a miniature view of the Sankey diagram (Note: this window may be hidden by default) (5)
The latter four window panes can be hidden and shown using the 'Show' buttons in the toolbar at the top. Window panes can be adapted and
arranged, so that the user can customize the screen layout to his/her individual requirements and working style.
Moving Windows: You can move a window pane wherever you want it by clicking the blue title bar and dragging the window where you want it.
Floating Windows: If you drop the window pane at a random location in the program window, it becomes a 'floating' window.

ifu Hamburg GmbH e!Sankey 4
User Manual Page 13
Docking Windows: Docking a window means to attach it to the edge of the program window. This allows you to reposition the various tool windows
such as the 'Entries', the 'Properties' or the 'Controller' to dock against different application edges. To do this, move the floating window pane by clicking in the title bar of the window pane, drag it to the edge where you
want to dock it, and drop it onto one of the blue arrows that appears near the edges of the program window. To be able to dock a window, make sure
the dockable Windows command is activated in the 'View' menu.
Figure 5: Docking icons (center, dock left, dock top, dock right, dock bottom)
Hide Window Panes: To hide window panes completely, unmark the respective entry in the View menu. To make a hidden pane visible again, set the tick mark in front of the menu entry.
Auto Hiding Windows / Tabbed Windows: In the top-right corner of
every window pane, you will see a small button that looks like a pin. If you click this button, the window pane is hidden (or "pinned" to the edge of the
program window). However, you can still see the title of the window pane along the edge of the program window. When hovering the mouse over the title, the window pane temporarily displays again until you move the mouse
off the window pane. Click the button again to "un-pin" the window pane.
Presentation Mode: If you wish to show the Sankey diagram in full screen without any elements of the application (no windows, no toolbars), switch
to the presentation mode by clicking on the button "Presentation Mode" in the toolbar above the editor. The diagram will be zoomed to the largest possible size and is not editable. This is ideal for presentations.
To end the presentation mode, use the 'ESC' key, or click on the button in the dropdown toolbar that appears, when you hover the mouse in the middle of the top edge of the screen (12'o clock position on the monitor).
Design Mode: Similar to the above presentation mode, switch to the so-
called design mode by clicking on the button "Design Mode" in the toolbar above the editor. This will only show the editor area in a maximum size,
and all other windows hidden. The menu bar, the toolbar and the context menu remain accessible. This is useful to continue editing the Sankey diagram, but not have other widows reducing the available editor size.
To end the design mode, click again on the 'Design Mode' button in the toolbar.
Reset Panes: To reset the window panes to the default setting (Properties and Overview docked on the left, Entries docked at the bottom, and
Controller docked at the right) just select the Reset command from the View menu.

e!Sankey 4 ifu Hamburg GmbH
Page 14 User Manual
User Interface Language: The user interface language of e!Sankey can
be switched to English, German, French, Spanish and Portuguese. Access the 'Options' dialog via the 'Edit' menu. On the 'General' tab choose the new language. A restart of the application is required for the change to take
effect.
Undo/Redo
e!Sankey has an Undo and Redo functionality for almost all actions performed by the user in the course of a work session with the software.
Undo: To undo (revert) an action that has been done in the software, click
on the button 'Undo' in the main toolbar or use the menu entry 'Undo' in the Edit menu. The hint of the button and the menu entry show the last action performed that will be undone. Alternatively use the keyboard shortcut
CTRL-Z.
Several multiple actions can be reverted (undone) by repeating this action.
Redo: To redo (revert undo) an action that has been undone, click on the button 'Redo' or use the menu entry 'Redo' in the 'Edit' menu. The bubble hint of the button and the menu entry show the last action performed that
has been undone and that will be reverted. Alternatively use the keyboard shortcut 'CTRL-Y'.
Search
In larger Sankey diagrams it can be helpful to browse for a specific process (node) or arrow.
Use the button "Search" in the editor toolbar to open a search field in the
top right corner of the editor area. Alternatively, the search field can be called using the "Search" command from the 'Edit' menu or with the
keyboard shortcut 'CTRL+F'.

ifu Hamburg GmbH e!Sankey 4
User Manual Page 15
Figure 6: The search feature in the top right corner of the Sankey diagram editor area
In the search field type a text string, then hit the 'RETURN' key to start the
search. The hit list will show arrows that contain a flow entry with the text string, as well as process names, where the text string is part of the process
label. Also, you will find text elements that match the search criteria. Skip through the dropdown list that contains the matching elements and
select one entry (arrow, process, text element), to bring this element into focus and select it in the editor.
You can use the "Search Next" command from the 'Edit' menu or the keyboard shortcut 'F3' to jump to the next diagram element from the search
results.
Option Settings
There are a number of option settings for working on Sankey diagrams in the editor.
Open the options dialog from the 'Edit' menu. There are three pages: "General", "Diagram" and "Extended".
Figure 7: Options dialog, 'General' page
General Options: On the "General" options page a number of settings can be made that determine the behavior of the application.

e!Sankey 4 ifu Hamburg GmbH
Page 16 User Manual
• Updates: Determine whether e!Sankey is allowed to search for
updates and to update the news on the start page. For further information on updates, see above in chapter 2.
• Templates: Set the directory path where template files (.santem) are
located ("Template Directory"). You can define the path to your preferred Sankey diagram template in the "Default Template" field.
• User Interface: Choose the language of the graphical user interface from the dropdown list. A restart of the application is required for the change of GUI language to take effect.
• Modes for Adding Elements : By default, adding a new process or drawing an arrow in the diagram can be done repeatedly when
selecting the insert mode. Users who prefer to insert only one single element after activating the insert mode can use these options for process, arrow and/or shape/image/text
Figure 8: Options dialog, 'Diagram' page
Diagram: On the "Diagram" options page settings for the diagram editor and the layout of the diagram can be made.
• Behavior: Some options for the behavior of e!Sankey • Arrow: You can change the default segment lengths of the first/last
arrow segment (from the process symbol to the yellow arrow point) and the default curviness (softness of a rounded arrow bend) of
arrows. When checking "Highlight Invisible Source and Destination Processes for Selected Arrows" it is easier to see processes that are hidden

ifu Hamburg GmbH e!Sankey 4
User Manual Page 17
when selecting the arrows attached to them. See below in chapter 6 in the section on "Hidden Processes".
• Label: When setting the option "Show Label Connection Line", a line will be shown from the flow content label to the arrow. The color of the line can be defined using the color dialog. See below in chapter 5
in the section on Flow Content Labels. • Grid: The default grid size is "8". Set the grid size in the entry field.
The option "Show Lines at Major Steps" will display additional helper lines in the grid to facilitate alignment of elements. The default value is "6", i.e. a horizontal and vertical line is shown every 6 x 8 = 48
pixels. Set the grid color according to your taste.

e!Sankey 4 ifu Hamburg GmbH
Page 18 User Manual
Extended: On the "Extended" options page users preparing template files
that are fed with data from an external data source using the e!Sankey Software Development Kit (SDK) can adjust the settings and reference a key lookup list.
Figure 9: Options dialog, 'Extended' page
• Use with SDK: Should you plan to reference elements of the diagram and automatically update a Sankey diagram with data from an external source using the e!Sankey Development Kit (SDK) you will
use the option "Show Key Field". Setting a check mark will add a "Key" column in the flows table, the stocks table and for text labels,
more details in chapter 15). The users of the e!Sankey SDK will find a description of the use of
the key field in the SDK documentation. • Lookup List Path: If you are using a key list in CSV format (e.g.
exported from your energy management software), you can set the
path to this lookup list here. This will help you enter the keys based on the list of available IDs in your data source.
• Format Dropdown List: Set the format how keys are presented in the dropdown list of the "Key" field". Either one column (just the ID), or two columns (name/description and ID).

ifu Hamburg GmbH e!Sankey 4
User Manual Page 19
4 Getting Started
Creating a Diagram File
To create a new diagram file, click on the button "New Document" in the
toolbar. Alternatively select "New" from the 'File' menu and choose one of the predefined templates. Or, click on one of the templates listed in the
'Templates' section on the start page. Templates have entries, units, preferences settings and color pallets
predefined. You will learn more about templates later.
To save a diagram file, click on the 'Save Document' button in the toolbar, or choose 'Save As…' from the file menu. You will be asked to enter a name. e!Sankey diagram files have the file suffix ".sankey".
Three Basic Steps: Drawing Processes and Arrows, Entering
Flows
In this section you will learn how to draw Sankey diagrams in e!Sankey. Sankey diagrams consist of processes (also referred to as "nodes") and
arrow lines between the processes. Flows are entered in the flows with their quantities and represented with the arrow width proportional to the magnitude of the flow.
Even if the process boxes are not visible (hidden) in the diagram, they must
first be drawn, in order to be able to connect an arrow to them. 1 - Draw Process: To draw a process, click on the button 'Process' in the
toolbar, then click in the drawing area where you wish to place the process (node).
Figure 10: Selecting the Process button and positioning a process symbol in the editor
You can continue to insert processes when in the insert mode until you choose another command (or hit 'ESC', or click the right mouse button to end the insert mode).
e!Sankey 4 ifu Hamburg GmbH
Page 20 User Manual
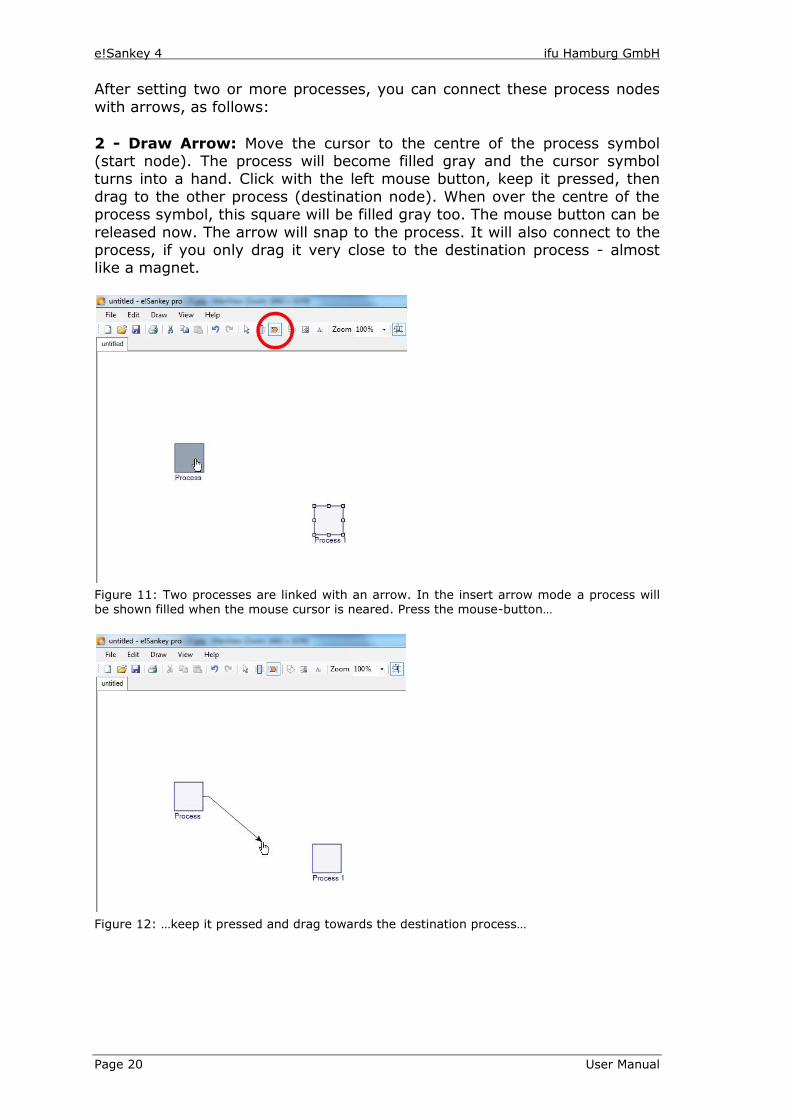
After setting two or more processes, you can connect these process nodes
with arrows, as follows:
2 - Draw Arrow: Move the cursor to the centre of the process symbol (start node). The process will become filled gray and the cursor symbol turns into a hand. Click with the left mouse button, keep it pressed, then
drag to the other process (destination node). When over the centre of the process symbol, this square will be filled gray too. The mouse button can be
released now. The arrow will snap to the process. It will also connect to the process, if you only drag it very close to the destination process - almost like a magnet.
Figure 11: Two processes are linked with an arrow. In the insert arrow mode a process will be shown filled when the mouse cursor is neared. Press the mouse-button…
Figure 12: …keep it pressed and drag towards the destination process…

ifu Hamburg GmbH e!Sankey 4
User Manual Page 21
Figure 13: …the destination process will be shown filled when the mouse cursor is moved
over it. This signals that the arrow will snap to that process. Release the mouse button.
The arrow at that stage is empty. This is indicated with the hint "<No Flows>". The arrow shows two yellow marker points and two red points
where it connects to the processes. You will learn more how to use these points later.
Figure 14: An arrow has been drawn, but it contains no flows at this stage.
Finally, you have to define what flows along the arrows from one process to
the next. This can be material, products, heat or any other form of energy, persons, money … These items can be defined in the 'Entries' window.
3 - Enter Flow in Arrow: Use the pre-defined sample items in the 'Entries' window. Drag the entry "water" onto the arrow. The Arrow Property dialog
will come to front (make sure the Property pane is visible and docked), and the entry water will appear in the flow list. You can directly enter a quantity
in the "Quantity" column of the flow entry. When you click return, the arrow line between the two processes is shown at a width, representing 300 kg of water.

e!Sankey 4 ifu Hamburg GmbH
Page 22 User Manual
Figure 15: Entering a quantity value for the entry that has been dragged onto the arrow
These three steps are essentially what you need to know to create a Sankey diagram.
In the next chapters, you will learn how to use the many option settings
and individual properties of the diagram elements, to improve the layout and design of your Sankey diagram.

ifu Hamburg GmbH e!Sankey 4
User Manual Page 23
5 Arrows
Arrows are the most important elements in a Sankey diagram. They always run between two process symbols, and are directed from a source (starting node) to a target (destination node). Arrows can take up flows from the
Entries list. The quantities of the flows are represented by the width of the arrow.
Several flows can run in one arrow (multi-flow arrow).
Arrows are drawn in the Sankey diagram between two processes by choosing the button "Arrow/Draw Arrow Between Processes" in the toolbar,
then clicking on a process in the diagram, keeping the left mouse button pressed, and dragging to another process.
The insert mode is turned on and allows repeated drawing of arrows until you return to the edit mode with a right mouse click or choose another
element from the toolbar. An alternative single arrow insert mode can be activated in the Options > General dialog.
An advanced arrow drawing mode exists for advanced users: Rather than setting two processes and drawing an arrow
between these, you can just click on an empty space in the editor and drag to another position in the editor. Processes will
be added at the beginning and end of the new arrow.
Flows Table
Flows on an arrow are shown in the 'Flows' table in the bottom section of
the arrow properties dialog when the arrow is marked. As has been described above in chapter 4 the flows can be directly inserted into an
arrow by dragging&dropping an entry directly onto this table. Alternatively, the flow will also be shown in this table when an entry is dragged&dropped
onto an arrow in the editor drawing area. The 'Quantity' column is used to enter or modify the flow quantity (that is
used to determine the width of the Sankey arrow)
Figure 16: Arrow Properties, Flows Table
For multi flow arrows (i.e. arrows that have more than one flow) the sort order in can be adapted using the 'Move Up' / 'Move Down' buttons.
A flow can be removed from an arrow by selecting it and then clicking on the button 'Delete Flow'.

e!Sankey 4 ifu Hamburg GmbH
Page 24 User Manual
Users preparing Sankey diagram template files for use with the
e!Sankey SDK (automation of Sankey diagram creation) have additional column 'Key' in this table. Further hints on the 'Key' field in chapter 15
Arrow Properties
Click on an arrow to mark it, and the arrow properties dialog will be shown
in the property pane.
Figure 17: Arrow Properties
The 'Edit Type' dropdown list at the top of the Properties dialog allows editing the properties of several selected element of this type. The number in brackets indicates the number of elements selected and affected by the
changes. In the image above, only one arrow is marked in the Sankey diagram.
Arrows can be shown with different layout options. Check the possibilities in the property dialog. Below are just some of the options for arrow
appearance.
The options 'Arrow Head' and 'Arrow Tail' can be used to individually turn on or off the base (tail) or the head of each arrow.
Figure 18: No arrow head/tail on the arrow (left), arrow head/tail option turned on (right)
The shape of the arrow head can be adapted and can look differently. For
example an explicit arrow spike can be added.
ifu Hamburg GmbH e!Sankey 4
User Manual Page 25
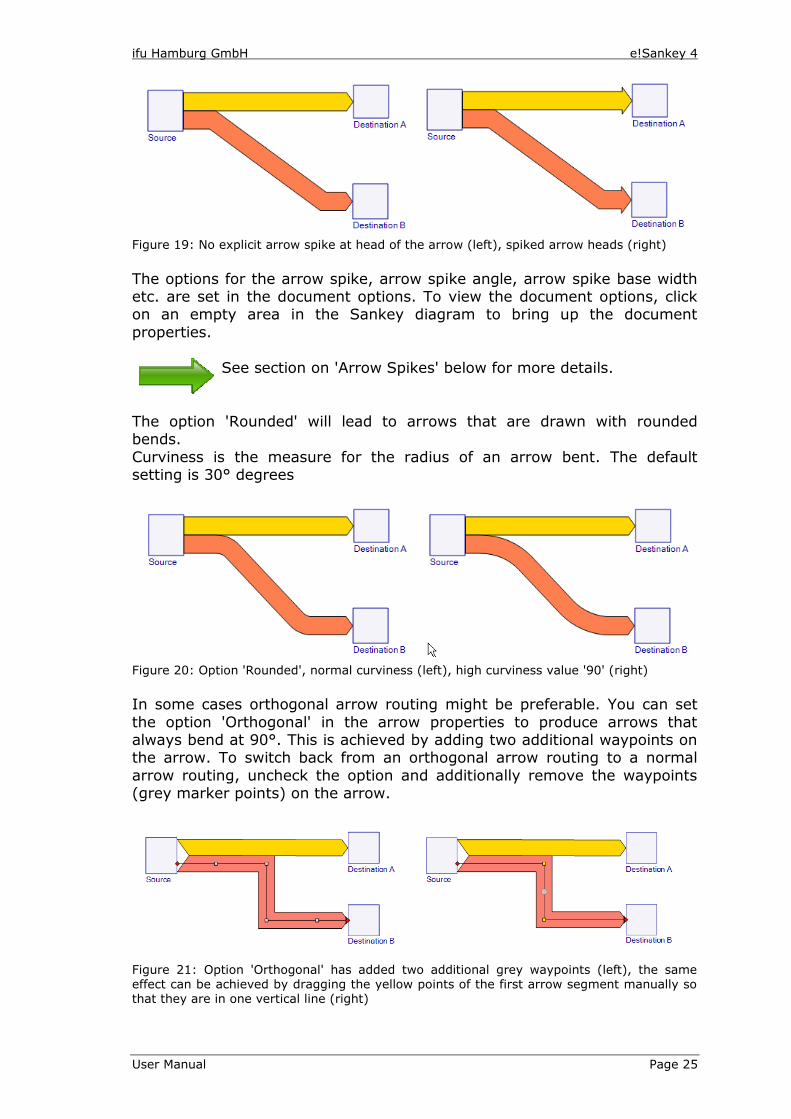
Figure 19: No explicit arrow spike at head of the arrow (left), spiked arrow heads (right)
The options for the arrow spike, arrow spike angle, arrow spike base width etc. are set in the document options. To view the document options, click on an empty area in the Sankey diagram to bring up the document
properties.
See section on 'Arrow Spikes' below for more details.
The option 'Rounded' will lead to arrows that are drawn with rounded bends.
Curviness is the measure for the radius of an arrow bent. The default setting is 30° degrees
Figure 20: Option 'Rounded', normal curviness (left), high curviness value '90' (right)
In some cases orthogonal arrow routing might be preferable. You can set
the option 'Orthogonal' in the arrow properties to produce arrows that always bend at 90°. This is achieved by adding two additional waypoints on the arrow. To switch back from an orthogonal arrow routing to a normal
arrow routing, uncheck the option and additionally remove the waypoints (grey marker points) on the arrow.
Figure 21: Option 'Orthogonal' has added two additional grey waypoints (left), the same effect can be achieved by dragging the yellow points of the first arrow segment manually so that they are in one vertical line (right)

e!Sankey 4 ifu Hamburg GmbH
Page 26 User Manual
Instead of using the 'Orthogonal' option for arrow routing, the
same effect can also be achieved by dragging the yellow arrow points, that force a horizontal/vertical first segment away from the process, so that the middle arrow segment bends at 90°
Read more about the grey and yellow arrow waypoints below.
Use 'Draw Border' to determine, whether an arrow should have a border
line. Click on "Select Color" to set the border line color, width and style.
Figure 22: Showing border line (left), option 'Draw Border' turned off (right)
These are just some of the possibilities you have for changing the arrow routing and appearance. Settings are made for arrows individually or by
using multiple edit for selected arrows.
Use 'Set As Default' from the context menu of the arrow to remember the settings for the next arrows you will be drawing in the diagram.
Arrow Labels
The options in the "Label" section of the arrow properties allow showing or
hiding flow labels.
Figure 23: For each arrow an automatically created flow content label is shown. It can be hidden. An additional a comment label for free text can be displayed
There are two different labels available for each arrow:
The flow content label is created automatically when a flow and a flow quantity is entered into the arrow. By default it is turned on (visible). Remove the check mark in front of the "Display Flow Content" option to
hide this label. The label is made up from the entry name, quantity and unit
The flow content label and its appearance can be customized. The elements to be shown in the flow content label can be turned on and off individually. the label can be rotated and
fixed to the arrow segment. Read more about these label
ifu Hamburg GmbH e!Sankey 4
User Manual Page 27
options below.
The arrow comment label is an additional optional label, where free text can be entered by the user.
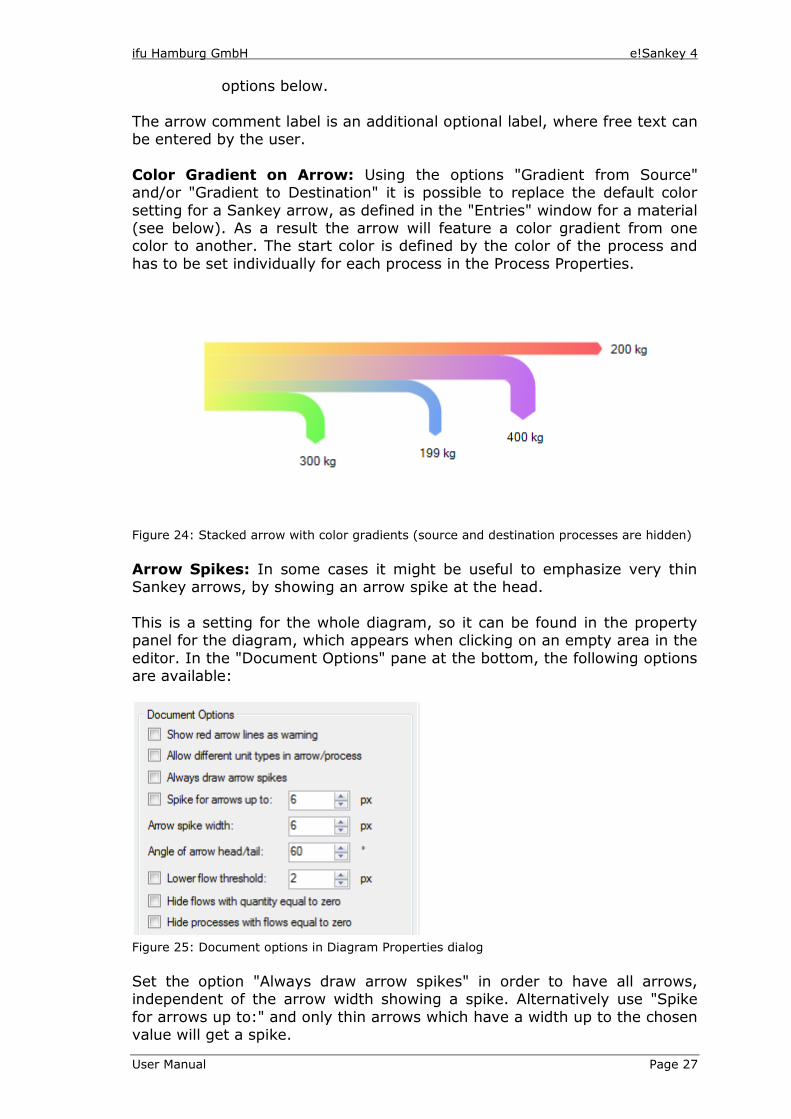
Color Gradient on Arrow: Using the options "Gradient from Source" and/or "Gradient to Destination" it is possible to replace the default color
setting for a Sankey arrow, as defined in the "Entries" window for a material (see below). As a result the arrow will feature a color gradient from one color to another. The start color is defined by the color of the process and
has to be set individually for each process in the Process Properties.
Figure 24: Stacked arrow with color gradients (source and destination processes are hidden)
Arrow Spikes: In some cases it might be useful to emphasize very thin Sankey arrows, by showing an arrow spike at the head.
This is a setting for the whole diagram, so it can be found in the property panel for the diagram, which appears when clicking on an empty area in the
editor. In the "Document Options" pane at the bottom, the following options are available:
Figure 25: Document options in Diagram Properties dialog
Set the option "Always draw arrow spikes" in order to have all arrows, independent of the arrow width showing a spike. Alternatively use "Spike
for arrows up to:" and only thin arrows which have a width up to the chosen value will get a spike.

e!Sankey 4 ifu Hamburg GmbH
Page 28 User Manual
Figure 26: This option can be used when arrows of the diagram don't show spikes to give only a spike to thinner arrows (left). Alternatively, the option "Always draw arrow spikes" will produce spikes event for wider arrows (right).
You can use the "Arrow spike width setting" to determine the width of the base of the spikes. Use this option with caution, as a wide base over-
emphasizes smaller arrows.
Figure 27: Arrow spikes with a normal base (left) and a wide spike base (right, not
recommended)
Use the "Angle of arrow head/tail" to set the spike angle.
Please note that the flow values remain unchanged. Just by changing the arrow head (spike) settings, the impression the Sankey diagram conveys is
quite different.
Flow Labels
Flow content labels are created automatically when inserting a flow into an arrow and entering its quantity. They are placed at a default position near the middle of the arrow route. The arrow label can be dragged around and
positioned where it fits best.
Click on a flow content label and the properties dialog will be shown in the property pane. The entry in the 'Edit Type' dropdown list shows the number
of flow content labels that are selected and that will be affected by property changes.

ifu Hamburg GmbH e!Sankey 4
User Manual Page 29
Figure 28: Flow Content Label Properties
The default display option for the arrow label is set to "Values", so that the flow quantities are shown. "Sum" refers to multi flow arrows (several flows
in one arrow), and forces the sum of the flows with the same unit type to be displayed.
Flow content labels are made up from the flow name, the quantity and the unit. They are made up automatically and therefore cannot be edited
directly. Name, quantity and unit can be turned on and off individually. Use the tick mark in front of the item in the "Content" section.
The 'Alignment' and 'Font Style' of the flow content label can be edited in the "Font" pane.
Note: To hide a flow content label entirely, remove the check
mark in front of the "Display Flow Label" option in the arrow (!) property dialog.
Show Percentage in Flow Labels: Since e!Sankey is a visualization tool and thus does not have any calculation functionality to calculate flow
quantities (see comment on last page for more information), there is a feature that allows to determine the percentage of a flow within a multi flow arrow, or the percentage of its quantity in relation to the largest quantity of
a flow of the same unit type in the whole diagram.
In the Flow Content Label property panel, set the 'Percentage' option to "Arrow" to show the percentage contributions of each flow in a multi flow arrow.

e!Sankey 4 ifu Hamburg GmbH
Page 30 User Manual
Figure 29: Percentages of the flow in a multi flow (option "Arrow")
Use the setting "Model" in the 'Percentage' option to show the percentage
contributions of each flow of the same unit type in regard to the largest flow in the model.
Figure 30: Percentages in the arrow labels (for "Model")
A third 'Percentage' option (percentage of output from a process or input into a process per unit type) is available using
keywords in a custom defined flow label. See hereafter.
Custom Flow Labels: In addition to the automatically created flow labels,
users may choose to create custom flow labels using format strings. Custom flow labels offer a variety of possibilities to individually adapt the way the flow labels are displayed (e.g. labels on multiple lines or characters
interjected).
To modify one or more selected flow content labels switch to the option "Custom" in the properties dialog of the flow label.
Figure 31: Flow Content Label Properties, custom format string
In the "Custom Format" field enter a format string using the keywords in curly brackets (braces). After the keywords enter a double pipe "||"
followed by one or more operations. When using several operations, they must be separated with a pipe "|". Do not use line breaks unless intended.

ifu Hamburg GmbH e!Sankey 4
User Manual Page 31
When typing an opening curly bracket "{" a selection list drops down and
allows choosing a keyword. When typing a double pipe "||" or a pipe ("|") a selection list drops down from which an operation can be chosen.
Keywords:
{EntryName} displays entry name
{GroupName} displays group name of entry
{NewLine} creates a line feed
{PercentArrow} shows percentage value of flow
quantities of the same unit type in the respective arrow (multi-flow arrows)
{PercentModel} shows percentage value of flow quantity in relation to the largest flow quantity of this unit type
{PercentProcessDestination} shows percentage value of flow quantity of the overall flow quantity of
this unit type at the process located at the destination of the arrow
{PercentProcessSource} shows percentage value of flow quantity of the overall flow quantity of
this unit type at the process located at the beginning of the arrow
{Quantity} displays flow quantity
{UnitName} displays unit name
{UnitTypeName} displays unit type name
Operations:
groupByUnitType For multi flow entries the entries are
summed up per unit type, and the number of items given instead of a list of entry names. Note that flows of
different unit types in one arrow are possible only when the option "Allow
Different Unit Types in Arrow" is set in the document options panel of the diagram properties
replace("text1","text2") text1 in the first quotation marks is replaced by the text2 in the entry
name
setEllipsis("chars") Use this to replace the default ellipsis
("…") used for truncated entry names by the string in quotation marks
setMaximumEntryNameLength(20) Cuts the entry name after the number of characters indicated in brackets. The
last three characters of a truncated entry name is replace by an ellipsis ("…").
setPercentageDecimals(1) Sets the number of decimal places for percentage values calculated with one
of the above percent keywords. If not used, the default number format will be
valid for percentage values.
setPostfix("text") The text in quotation marks is set after
e!Sankey 4 ifu Hamburg GmbH
Page 32 User Manual
the actual flow content label. Instead
of a text string also use one or more key words: {BasicUnitName}
{CountEntries}
{CountUnitTypes}
{NewLine}
{SumBasicUnit}
setPrefix("text") The text in quotation marks is set before the actual flow content label. Instead of a text string also use one or
more key words: {BasicUnitName}
{CountEntries}
{CountUnitTypes}
{NewLine}
{SumBasicUnit}
setSeparator ("text") The character or text in quotation
marks is used to separate the entry names in multi flow arrows (by default
a line break is used).
Examples: • {EntryName} from group {GroupName} creates a flow label such as
"cadmium from group heavy metals" or "mercury from group heavy metals" (2 keywords with an interjected text string using the name of
the entry group) • {EntryName} {UnitTypeName}: {Quantity} {UnitName}||
groupByUnitType creates a flow label for a multi flow that would
look similar to this:
2 Entries Mass: 1200 kg 3 Entries Energy: 4000 MJ
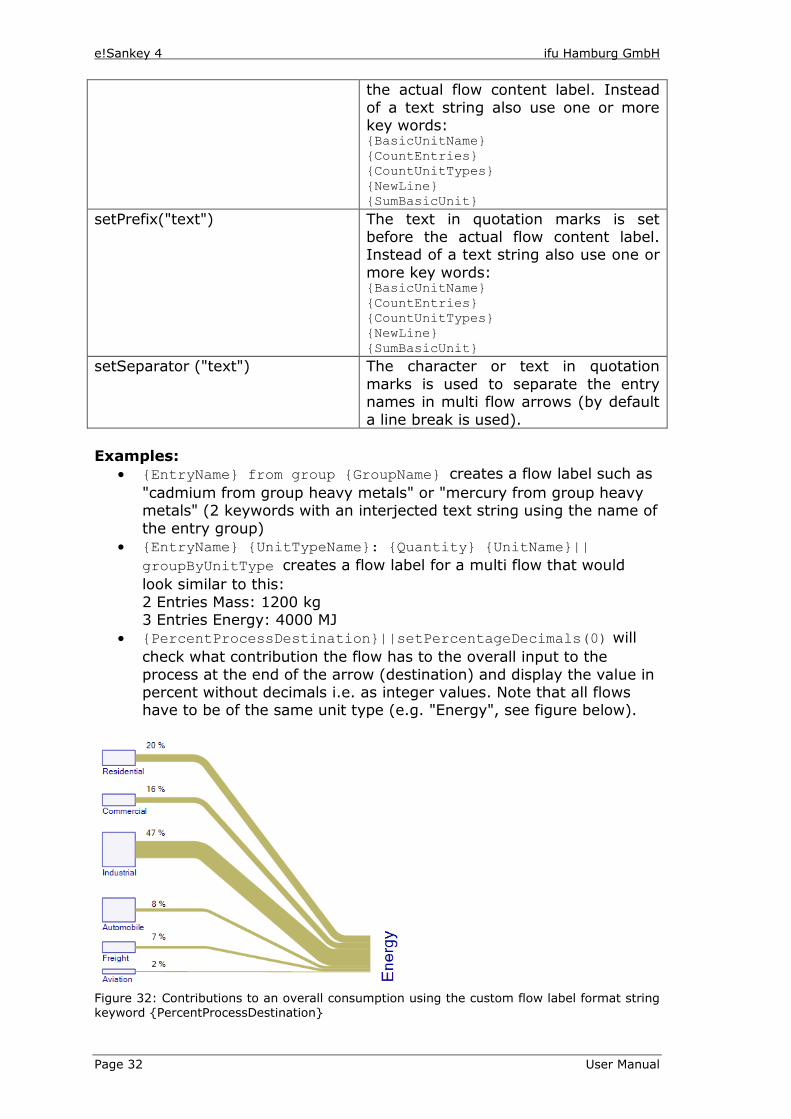
• {PercentProcessDestination}||setPercentageDecimals(0) will
check what contribution the flow has to the overall input to the
process at the end of the arrow (destination) and display the value in percent without decimals i.e. as integer values. Note that all flows have to be of the same unit type (e.g. "Energy", see figure below).
Figure 32: Contributions to an overall consumption using the custom flow label format string keyword {PercentProcessDestination}

ifu Hamburg GmbH e!Sankey 4
User Manual Page 33
Flow Comment: Additionally to the flow content label, created automatically, an arrow comment label can be created, where free text can
be entered, e.g. for comments etc. Flow Labels for Arrows with Multiple Flows: Multi flow arrows are
arrows that contain more than one flow entry. For multi flow arrows, the arrow label can be switched from individual "Values" to the "Sum" of all
flows. If the flows are all in one group and have the same unit type, then the name of the group will be displayed along with the sum value. If flows are located in different entry groups, then the word "Sum" will be shown
instead.
Figure 33: Multi flow with detailed arrow label and with "Sum" arrow label
The sort order in Multi Flow arrows can be adapted using the 'Move Up' /
'Move Down' buttons in the flows table in the bottom part of the arrow properties dialog.
Use 'Set As Default' from the context menu of the file to remember the settings for the next arrows labels.
Rotate Flow Label Both arrow labels as well as arrow comment labels can be rotated, e.g. to be able to place the label parallel to an arrow route.
Figure 34: The Flow Label can be rotated around an axis by dragging the yellow point.

e!Sankey 4 ifu Hamburg GmbH
Page 34 User Manual
You can use the yellow point to rotate the label around the blue turning
point or enter an angle degree in the "Angle" field. The label is freely rotatable only in the "Free" setting of the "Fix to Segment" option.
The label can be fixed to an arrow segment, so that it follows with its angle to a changing arrow segment orientation, By that, when dragging a process
and the connected arrow follows the node, the label will stay fixed to it.
Use the dropdown list "Fix to Segment" in the properties dialog to choose
an orientation of the flow content label in relation to the arrow segment. The default is "Free", so that the flow content label stays with the middle
segment of the arrow but doesn't change its angle when the arrow angle changes. Use "Forward" to lock the angle to the segment. "Backward" might be meaningful when the arrow label is overhead (upside down).
Figure 35: Fixing the flow content label to the arrow segment in a given orientation
Arrow Routing and Waypoints
The routing of an arrow between two process nodes is done automatically.
The arrow line has certain arrow points that determine the route. Further points can be added. These points become visible when the arrow is clicked. Additionally the connectivity behavior at the process can be set, which also
influences the arrow routing.
The yellow points (lug points or hook points) are created by default at the end of the first segment after at a horizontal or vertical offset from the process node, and at the beginning of the last segment of an arrow that is
linked to the process node. These yellow points can only be moved horizontally or vertically, depending on the orientation of the base segment
or head segment of the arrow to the process node. They cannot be removed.
The red points are shown at the head and at the foot (tail) of the arrow where it connects to the process. These points can be used to disconnect
the arrow from the process and reconnect it to another process.
ifu Hamburg GmbH e!Sankey 4
User Manual Page 35
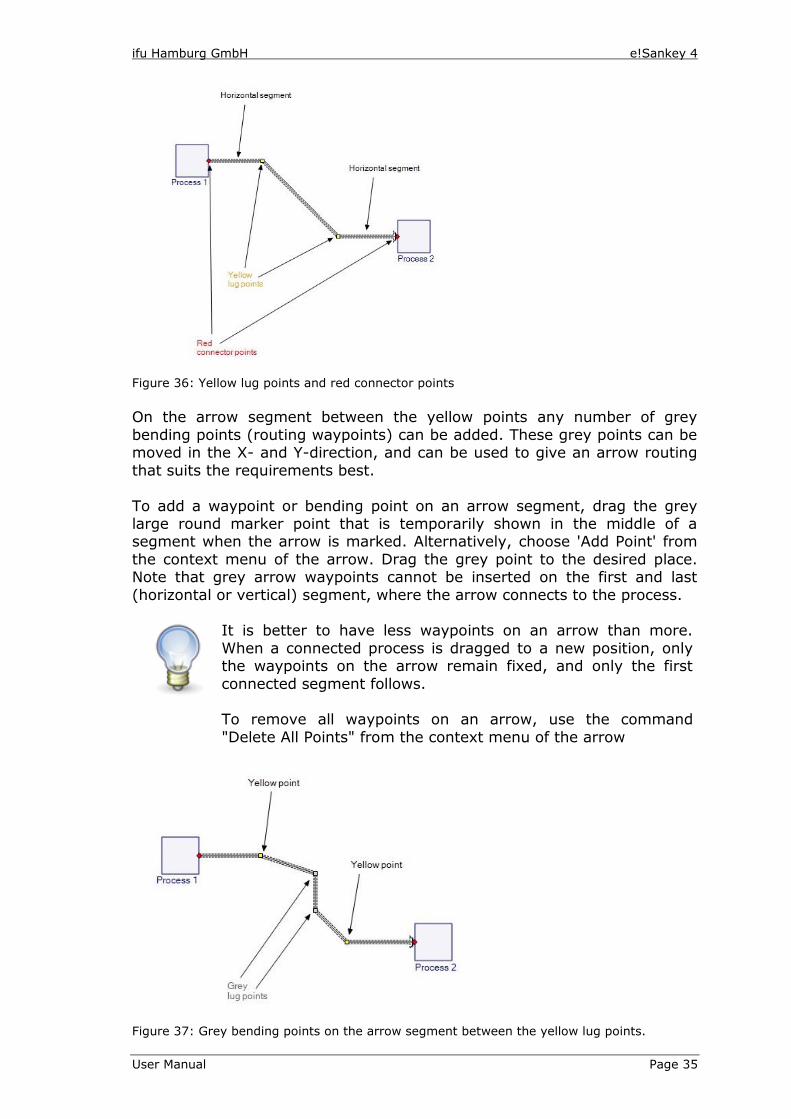
Figure 36: Yellow lug points and red connector points
On the arrow segment between the yellow points any number of grey
bending points (routing waypoints) can be added. These grey points can be moved in the X- and Y-direction, and can be used to give an arrow routing
that suits the requirements best.
To add a waypoint or bending point on an arrow segment, drag the grey large round marker point that is temporarily shown in the middle of a segment when the arrow is marked. Alternatively, choose 'Add Point' from
the context menu of the arrow. Drag the grey point to the desired place. Note that grey arrow waypoints cannot be inserted on the first and last
(horizontal or vertical) segment, where the arrow connects to the process.
It is better to have less waypoints on an arrow than more.
When a connected process is dragged to a new position, only the waypoints on the arrow remain fixed, and only the first
connected segment follows. To remove all waypoints on an arrow, use the command
"Delete All Points" from the context menu of the arrow
Figure 37: Grey bending points on the arrow segment between the yellow lug points.

e!Sankey 4 ifu Hamburg GmbH
Page 36 User Manual
Connectivity: The way an arrow connects to a process node depends on the connectivity setting in the process property dialog. The default setting is "Free", i.e. the connection direction is not restricted to a certain mode, but
will be determined automatically depending on the angle of an imaginary line between process nodes. Thus the arrow offset will 'jump' to the other
side of a process node when you move the process connected to it on the other end of the arrow to another position, where this imaginary line is above or below a 45° angle.
Figure 38: Automatic routing and connectivity depends on the angle between the imaginary connection line between the process symbol centre and a vertical line. Arrow connects at top.
Figure 39: The angle between the imaginary connection line between the process symbol centres and a vertical line exceeds 45° the arrow connection "flips" to the side.
If you want to force the arrow to connect to a specific side of a process, set the connectivity in the process property dialog to one of the following options: Left-To-Right, Right-to Left, Top-To-Bottom, Bottom-To-Top. The
automatic connection direction as shown above will be overruled.

ifu Hamburg GmbH e!Sankey 4
User Manual Page 37
Z-Order: In stacked arrows (arrow sections where several arrows join to
form one arrow head, or, one common arrow base), the automatic algorithm using the angle of the imaginary line between the process centres might lead to a wrong sorting order in the stacked arrow segment.
Figure 40: Process 2 (light sand color) is at the bottom
Figure 41: Process 2 (light sand color) is moved up to the middle…
Figure 42: … then to the top the order in the stacked arrow segment is sorted accordingly (option "Sort by Angle")
In case such automatic sorting is undesired, click on the process where the
stacked arrow segment connects (here: Process 3) and switch to "By Z-Order" in the Stacking option. In this case the automatic stacking by angle
will be superseded.

e!Sankey 4 ifu Hamburg GmbH
Page 38 User Manual
The Z-Order of arrows (the layer on the drawing area) can be influenced by defining the element layer with the command 'Bring Forward' or 'Send Backward' from the context menu of an arrow. Using 'Bring To Front' brings
the selected arrow all the way to the front, while 'Send to Back' sends it to the last layer of the diagram. With this option, the arrow which is in the
front (topmost layer) will be the first arrow to connect to the process, while the one that is on the last layer is the one that connects at the bottom of the process.
Z-Order for Crossing Arrows: For crossing arrow lines, the Z-Order
setting can be used to determine which of the arrows runs on top of the other. Click on the arrow that is supposed to be on the top layer and select "Bring to Front" from the context menu. Alternatively, click on the arrow
underneath and choose "Send Backward" (repeat several times, if necessary, arrow will be moved backward one layer each time.
The commands for changing the element layer 'Bring Forward', 'Send Backward', 'Bring To Front' and 'Send to Back' are also
available in the main toolbar.
Note: Z (in addition to X- and Y-axis) is the axis orthogonal to the drawing area.
In the figure on the left the blue arrow is in front, the pink arrow is in the back. In the same diagram on the right the blue arrow is send backward,
the pink arrow is now on the top layer.
Figure 43: Z-Order determines the order of superimposition, which is important especially for crossing arrows

ifu Hamburg GmbH e!Sankey 4
User Manual Page 39
6 Processes
Processes (or nodes) are set in the Sankey diagram by choosing the button "Process/Add Process to Diagram" in the toolbar and then clicking at a position somewhere in the drawing area.
The insert mode is turned on and allows repeated insertion of process until
you return to the edit mode with a right mouse click or choosing another element from the toolbar. An alternative single process insert mode can be activated in the Options > General dialog.
Processes have to be set at the beginning (foot) and the end (head) of each
Sankey arrow. They may be turned invisible (hidden), but still they do have to exist. Click on an arrow to mark it, and the hidden process symbol can be seen.
Options for Processes
When marking a process symbol in the diagram, the properties pane will
show the process property dialog.
The entry in the 'Edit Type' dropdown list shows the number of processes selected that will be affected by the property changes.
The option 'Display Process' allows hiding the process symbol (remove tick mark). The option 'Display Label' allows hiding the label of the process
(remove tick mark). By default a process (node) is shown as a square symbol or rectangle.
Alternatively, you can set the shape of the process to be displayed as a rounded rectangle, or ellipse/circle.
Mind that the look of the process symbol is defined in the
diagram template (see chapter 10 of this user manual). So if you wish to always use rounded rectangles or circles as process symbols, you can just define this and store it as your preferred
template (default diagram template).
The 'Line Color' and 'Fill Color' of the process symbol can be adapted individually. Click on the color field or the button next to it to call the color selection dialog.
The "Arrows" section in the process property dialog relates to the way that
arrows are connected to the process. The connectivity and stacking settings are explained above in chapter 5 on arrows in the section on 'Z order'.

e!Sankey 4 ifu Hamburg GmbH
Page 40 User Manual
Figure 44: Process Properties
Balance Check: This feature will let you verify whether inputs and outputs
at a process are balanced for the selected unit type. Enable this feature in the document options (the properties dialog with the document options is visible, when you click on an empty area in the diagram, i.e. when no
explicit element is marked), if you want to perform a balance check at processes.
Balance check must be enabled for the unit type in the 'Edit Unit Type' dialog before it can be used.
To do a balance check for the unit type for which this has been enabled, set the flag "Show balance warning at process" in the document options. A red marker will be shown on the process.

ifu Hamburg GmbH e!Sankey 4
User Manual Page 41
Figure 45: Option "Show balance warning at process" is turned on. A red warning marker is shown because input and output of the process don't match.
Hover the mouse pointer over the exclamation mark in the process to get more information. Additionally, when selecting the process, details will be shown in the process properties dialog in the 'Balance Check' panel.
Figure 46: Balance check details at process, selectively per unit type
Stocks: "Stocks" are a feature of e!Sankey pro. This feature allows painting
stubs to represent stock increase or decrease, or balance differences at processes.
To visualize a stock increase or a stock decrease simply drag an entry from the Entries window onto a process symbol. Alternatively add the entry in
the "Stocks" table in the properties of the process. Then enter a quantity for the entry in the column "In" and/or "Out".
The order of stocks in the table can be adapted using the 'Move Up' / 'Move Down' buttons.
An entry can be removed from the stocks table by selecting it and then clicking on the button 'Delete Stock'.
Users preparing Sankey diagram template files for use with the
e!Sankey SDK (automation of Sankey diagram creation) can see an additional column 'Key' in this table. Further hints on
the 'Key' field in chapter 15 Stocks are only shown if the 'Connectivity' setting is not set to "Free" (read
more on connectivity in section 5).

e!Sankey 4 ifu Hamburg GmbH
Page 42 User Manual
Figure 47: Stock changes on the input side and on the output side of a process
Using Images and Icons for Processes
The color of the process symbol border line and filling can be set
individually. Instead of the default process symbol, you can also set an icon or image.
This feature is especially helpful, when you prepare your diagram for presentation, and want to create even more appealing Sankey diagrams.
Use the "Select Image" button in the process properties to load a graphics
file instead of the default square or rectangle node symbol. The following file formats are supported: BMP, GIF, JPG, PNG, ICO, TIF, EXIF, EMF, WMF,
UMF. Set the option "Maintain Aspect Ratio" to keep the original image aspect
ratio, even when the process shape is resized. To remove an image and return to the default process symbol, use the "Delete Image" button.
Figure 48: Sankey diagram section using photos as overlay for process symbols
Two clipart libraries (flat icon libraries licensed from third parties) with over 2000 PNG graphics files are included in e!Sankey and supply icons for
Sankey diagrams. The default path to these libraries is "C:\Users\<USER>\Documents\e!Sankey\<VERSION>\clipart\".
• Clipart library "Colored": a colorful and fancy collection of icons from different topic areas, all with a round backdrop
• Clipart library "Dark Grey and Green": simple, serious icons held in green and black

ifu Hamburg GmbH e!Sankey 4
User Manual Page 43
Figure 49: Samples from the clipart galleries "Colored" (left) and "Dark Gray and Green" (right)
Hidden Processes
If you prefer not to see the process box, it is possible to hide it by unchecking the 'Display Process' option in the process property dialog. The accompanying process label can be hidden separately, using the 'Display
Label' option.
Often Sankey diagrams look better without the process symbols. Nevertheless, to draw the arrows, and to move the arrow head around, it is required to first draw the process symbols and then hide it.
Figure 50: This simple Sankey diagram has four process symbols that are hidden
The process symbols will be shown transparently when the arrow that
connects to them is marked. This allows dragging the process, if required. Process can also be hidden in the process list of the diagram properties
dialog (click on empty area in the editor to bring up the diagram properties).
Figure 51: The same Sankey diagram, the process symbols are visible in transparent color when the arrows are marked

e!Sankey 4 ifu Hamburg GmbH
Page 44 User Manual
Padding for Processes: By default the arrows connect exactly at the border line of a process. This looks OK in many cases, and works especially well when you remove arrow head and tail.
With a process icon instead of the default square symbol, however, the
connecting arrow sometimes seemed to be "glued" to the icon too closely. The padding option for processes in this case can be set to a positive value, increasing the distance of the arrow connect by adding an invisible padding
area.
The padding value can also be negative, so that the arrow head and tail connection underruns the default border line of the process.
Figures 52: Padding at process, negative value, process itself is hidden
Changing Process Size and Shape
When inserting a process by clicking in the drawing area, the process is shown as a square. The size can be changed by dragging the points that are
shown when the process is marked.
To adapt process symbols of different size and shape all to the same process size, mark the processes that require adaptation, then go to one process that has the correct size and shape (and can serve as the role
model for the others). From the context menu of this process symbol choose "Set Size to this Element"
Also, the process height or width can automatically be adapted depending of the arrows connected to it. To do so, choose the command 'Adapt Process
Size' from the context menu of the process. In the cascading menu select 'Height to Arrow', 'Width to Arrow', or 'Height/Width to Arrow'.
Figure 53: Default process size ('Process') and automatically adapted process height
('Process 1')
Aligning Processes
To align a number of process elements, mark these elements, then go to the process node to which the other elements shall be aligned. Open the
context menu and choose "Align to this Element". From the cascading menu select one of the alignment modes.

ifu Hamburg GmbH e!Sankey 4
User Manual Page 45
Figure 54: Aligning three processes to the top (using the right process as orientation)
In addition to the alignment in one line, it is sometimes necessary to
distribute a number of process elements evenly at the same distance. To set a number of processes at a same distance from each other, mark
these process elements, then open the context menu and choose "Set at Same Distance".
Did the alignment or equidistant setting go wrong because you accidentally chose the wrong alignment direction or the
processes ended up clumped together? Just use 'Undo' (CTRL+Z) to revert the action.

e!Sankey 4 ifu Hamburg GmbH
Page 46 User Manual
7 Additional Diagram Elements
Graphical Shapes
Additional graphical elements are available to improve a Sankey diagram
layout. These are: rectangle (not the process symbol!), rounded rectangle, ellipse and line (not the Sankey arrow line!). These items are available in
the 'Shapes' menu in the toolbar. The insert mode for graphical shapes elements is turned on and allows
repeated drawing of the selected shape until you return to the edit mode with a right mouse click or choose another element from the toolbar. An
alternative single shape element insert mode can be activated in the Options > General dialog.
The rectangle, if set to transparent can be used to draw a frame around certain sections of the diagram for additional graphical structuring or
grouping.
Simple non-Sankey arrows, lines and boxes can be used to add comments in a diagram, as shown in the figure below.
Figure 55: Use of boxes with fill color and pointer arrows for additional comments

ifu Hamburg GmbH e!Sankey 4
User Manual Page 47
Text Element
To add additional text to a Sankey diagram, select the "Add Text" button
from the editor toolbar. Alternatively choose the command "Text" from the 'Draw' menu. Then click at the position in the editor where the text element
should be placed. The insert mode for text elements is turned on and allows repeated drawing
of these elements until you return to the edit mode with a right mouse click or choose another element from the toolbar. An alternative single text
element insert mode can be activated in the Options > General dialog. The 'Text' property dialog can be used to replace the default text. You can
also directly click the text element to edit the text (inline editing).
If you have text copied to the clipboard, the 'Paste' command from the context menu of the diagram will create a text element and add the text at the cursor position.
Alignment, font, font size, font color can also be edited in the text
properties for one or more selected text element.
Text labels can be rotated either by dragging the yellow point, or by entering an angle value in the properties.
Text labels can be linked to an external source using Live Links (pro version only). Read chapter 11 for more information.
Legend
To identify the flows (streams) in a Sankey diagram by their color, in
addition to any flow labels that might be visible next to the Sankey arrow, a legend can be added in the diagram.
Add a legend element by clicking on "Show Legend" in the 'Draw' menu.
Figure 56: Legend for a Sankey diagram, sorted by groups with some custom sorting
The legend can be dragged to the most appropriate position and adapted using the legend property dialog. In this property dialog, there are two

e!Sankey 4 ifu Hamburg GmbH
Page 48 User Manual
pages of properties. Click on "Graphical" to adapt lines, background color,
font and other graphical items of the legend. In the panel "Entries" choose whether you wish to show only the "Name of
Entry" in the legend, or if you wish to add the basic unit name, the unit type or the group name in brackets behind the legend entry.
The color box for an entry can show a frame line around it ("Show Border of Color Box").
On the page "Content" you can set options for sorting and display of legend
entries. Sorting of the entries in the legend by default is alphabetically. You can also sort "Alphabetically Group Name, Entry Name" or switch to "Custom". For custom sorting use the list below and mark specific entries,
then shift them up or down using the two arrow buttons.
Figure 57: Legend properties, page 'Content'
Use the "DEL" key or the command "Delete" from the context menu to
remove the legend again. It can be shown again any time by calling "Show Legend" from the 'Draw' menu.
Scale
When individual flow quantities are not shown on each arrow, a scale can be
displayed in the diagram. The scale will present three representative arrow magnitudes for each unit type.
To show the scale element, choose "Show Scale" from the 'Draw' menu.

ifu Hamburg GmbH e!Sankey 4
User Manual Page 49
Figure 58: Scale
The properties of this graphical element can be edited in the properties
dialog when the element is marked. To remove the scale element, mark it and press "DEL" or use "Delete" from
the context menu.
Background Image
Images can be embedded as background for the Sankey diagram. This feature can be used e.g. to add a map, a drawing of the shop floor, a
technical drawing etc. in the background of the Sankey diagram.
Figure 59: Background image in a Sankey diagram
To add an image, choose "Image" from the 'Draw' menu. Then draw a frame with the dimensions the image shall have in the editor area. In the properties dialog of the image element, click on "Open Image File" to select
a graphics file. The following file formats are supported: BMP, GIF, JPG, PNG, ICO, TIF, EXIF, EMF, WMF, UMF.
Change the element layer using the commands from the context menu or the corresponding buttons in the toolbar. Typically the image element will
be behind the Sankey diagram ("Send to Back").

e!Sankey 4 ifu Hamburg GmbH
Page 50 User Manual
The image element can be resized using the marker points. Marker points are not visible, if the option "Original Size" is turned on.
You can set a tick mark in front of the option "Maintain Aspect Ratio" to ensure that the image is not distorted by changing width/height
proportions. Use the option "Original Size" to reset the image size after the size or shape has been modified.
"Lock Position" can be used to fix an image at its present position and to avoid that it is selected or moved accidentally
Image transparency can be set in the "Transparency" field. Reduced transparency might produce a good effect for background images.
To remove the image element, mark it and press "DEL" or use "Delete"
from the context menu.

ifu Hamburg GmbH e!Sankey 4
User Manual Page 51
Useful Hints for Drawing Sankey Diagrams
Copy & Paste: 'Copy & Paste' can be used to copy diagram sections. You can copy diagram sections between different diagram files (Hint: open
several files in tabbed editor areas), but mind that the flows in the copied file might have different unit types and colors in the other diagram file.
There is no automatic unit conversion. Scaling might be required after copying and pasting between diagrams.
Multiple Element Editing: To mark several elements of the diagram, drag a marking frame around them with the mouse button pressed. Mark the
whole diagram with all elements using CTRL+A. Move the selected elements of the diagram with the mouse or the cursor keys or edit several element properties at once. For editing the properties of multiple elements, choose
the element type from the dropdown list 'Edit Type'.
Figure 60: Multiple element editing in properties dialog
To select all elements of a specific type for joint editing, you
can mark one of the elements (e.g. an arrow) first, then use CTRL+A. The respective element is then already been set in
the "Edit Type" dropdown list. Property settings will be applied to all elements.
Set as Default: Alternatively use 'Set As Default' from the context menu of an element (e.g. arrow, process, …) and mark the settings of the current
element as the preferred one for this element type. When inserting a new element of this type the settings will be used. This requires however, that
you have a vision of how the arrows and processes should look like at an early stage of designing your diagram.
Use of Grid: To properly align process elements, it is helpful to turn on the grid. Process elements will snap to the grid if the "Snap to Grid" button is
also active. Both buttons can be found in the editor toolbar. Options for the grid can be set in the 'Options" dialog, such as the distance of grid points and additional grid helper lines. By default the grid distance is 6 px.

e!Sankey 4 ifu Hamburg GmbH
Page 52 User Manual
8 Entries
For each diagram, the items used as flows in the arrows have to be defined in the 'Entries' list. This list is located at the bottom of the screen by
default.
Create a new entry by clicking on the 'Add Entry' button in the 'Entries window. Alternatively, use the keyboard shortcut CTRL+E to create a new entry in the current folder. Replace the default "New Entry" placeholder with
the actual name and select the unit type (for unit types see below in chapter 9) of this entry.
A color will be assigned automatically, but you can choose any other color from the color set defined for the unit type, by selecting it from the
dropdown list. Any other color can be chosen by clicking on the button with the three points (for more information see color management dialog below).
Figure 61: Entries dialog
The 'Entries' list can be grouped in folders. Groups help to structure extensive lists of materials, substances, energies etc.
A new group on the same level can be created by clicking on the button
"Add New Group". Use "Add New Group" to create a folder within the currently selected entries folder. Folder symbols can be moved within the hierarchical structure on the left side of the "Entries" window using
drag&drop. A selected folder can be deleted using the button "Delete Folder". Mind that entries within the folder will also be deleted (after an
additional request for confirmation) even if they are already used as a flow in the Sankey diagram.
Adding Entries in an Arrow: As described above in the "First Steps" section, the entries from the entries list are added to an arrow in a Sankey
diagram and a quantity is stated.
Adding a flow to an arrow from the Entries window can be done in three different ways:
• Drag the entry directly onto the arrow in the Sankey diagram
• Mark the arrow in the diagram, so that the arrow properties dialog comes to front. Then drag an entry onto the 'Flows' table in the arrow
properties dialog

ifu Hamburg GmbH e!Sankey 4
User Manual Page 53
• Mark the arrow in the diagram, so that the arrow properties dialog comes to front. Then select an entry in the 'Entries' window and click
on the button 'Insert Entry in Arrow' The name of the entry is displayed in the arrow content label next to an
arrow when the entry has been used to define a flow and a quantity has been entered.
Changing a name of a material, a unit, or a color will result in an updating of the flow everywhere in the diagram wherever it is used.
Deleting an entry from the entries list will lead to a removal of all flows of
this entry in the Sankey arrow. You will be asked to confirm this action. The command 'Delete Unused Entries' from the context menu of the 'Entries'
window can be used to remove entries that are not used as flows in the diagram.
When saving a diagram as template, the Entries list will be part of the template. Therefore you can create a model Entries list
that you wish to use in different of your diagrams, and save it as a template file (.santem). New diagrams created using this template will feature the pre-defined entries list, including the
colors and unit settings.
Color Management: By default, the color pallet defined for a unit type will be suggested for the entries defined within the unity type (see chapter 9 on unit types). However, individual colors can of course be chosen for an entry.
For choosing individual colors for an entry, click on the button with the
ellipsis (…) in the "Color" column of the 'Entries' window. The 'Edit Fill Color' dialog will be prompted. This dialog has three tabs. On
the "Named Color" tab choose from one of the 256 named colors.

e!Sankey 4 ifu Hamburg GmbH
Page 54 User Manual
Figure 62: 'Select Fill Color' dialog, 'Named Colors' tab
Alternatively use the color wheel on the "Color Circle" tab to define any other color by its RGB value, or using values for hue, saturation, brightness.
You can create a list of favorite colors (shown on the 'Color Set' tab) that will be populated, when the "Add to Color Set" check box is marked when
choosing a color.
Transparency can be set from the dropdown list in the Properties pane. You can choose a fill pattern for the color from the dropdown list in the
Properties pane on the left.

ifu Hamburg GmbH e!Sankey 4
User Manual Page 55
Figure 63: Color Circle tab with pattern drop down list

e!Sankey 4 ifu Hamburg GmbH
Page 56 User Manual
9 Unit Types
For each material in the Entries dialog, a unit type has to be selected. Unit types are administered in the "Edit Unit Types" dialog accessible using the
"Edit Unit Types" button in the 'Controller' window.
Depending on the template you have chosen for opening the Sankey diagram file, several unit types may already be defined and ready for use. If there are no unit types available it is
required to define at least one unit type, before being able to define entries. In most templates shipped in e!Sankey the
common unit types "Mass" and "Energy" are pre-defined and activated.
The names of the unit types are listed in the "Unit Type" list box at the top. Mark one entry in this list to view the basic unit and the other units
available for this unit type in the table in the bottom part of the window.
Figure 64: Edit Unit Types dialog
The list of unit types can be sorted by using the buttons 'Move Up' and
'Move Down' with the arrows below the list. Mark one entry then click on these buttons to change its position in the list. The order of the unit type is
used for the order of the scaling sliders in the 'Controller' window, and the
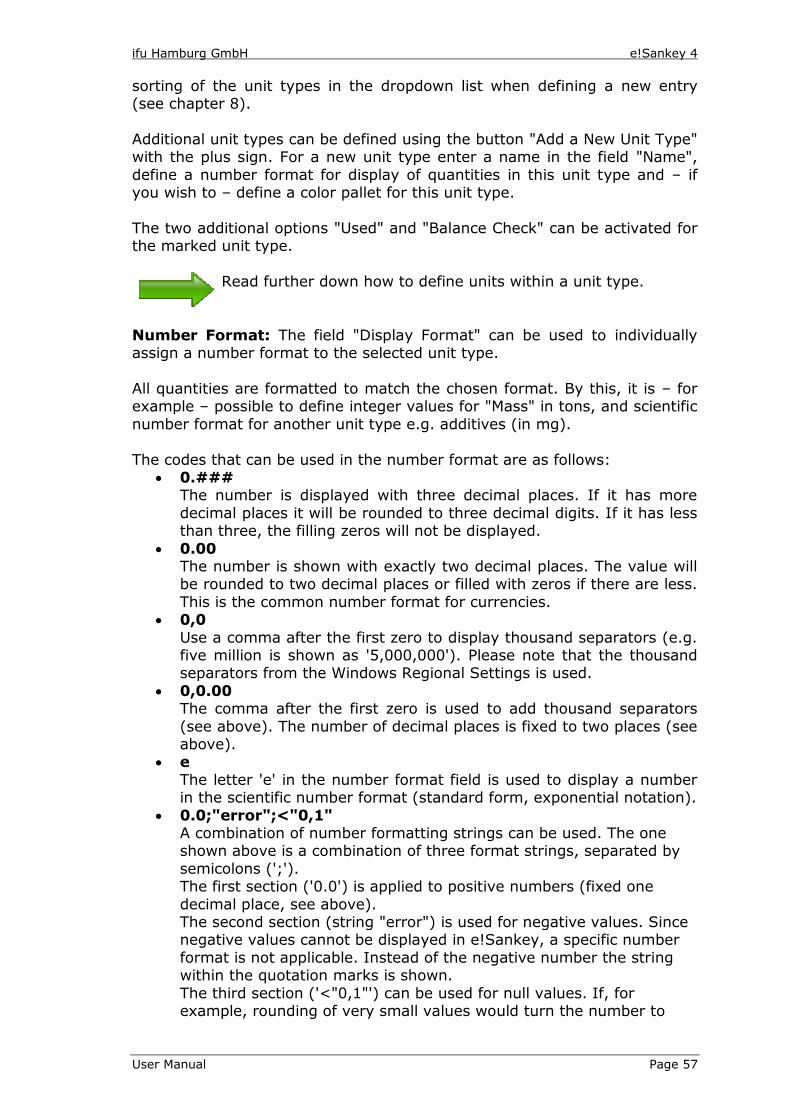
ifu Hamburg GmbH e!Sankey 4
User Manual Page 57
sorting of the unit types in the dropdown list when defining a new entry (see chapter 8).
Additional unit types can be defined using the button "Add a New Unit Type" with the plus sign. For a new unit type enter a name in the field "Name",
define a number format for display of quantities in this unit type and – if you wish to – define a color pallet for this unit type.
The two additional options "Used" and "Balance Check" can be activated for the marked unit type.
Read further down how to define units within a unit type.
Number Format: The field "Display Format" can be used to individually assign a number format to the selected unit type.
All quantities are formatted to match the chosen format. By this, it is – for example – possible to define integer values for "Mass" in tons, and scientific
number format for another unit type e.g. additives (in mg).
The codes that can be used in the number format are as follows: • 0.###
The number is displayed with three decimal places. If it has more
decimal places it will be rounded to three decimal digits. If it has less than three, the filling zeros will not be displayed.
• 0.00 The number is shown with exactly two decimal places. The value will be rounded to two decimal places or filled with zeros if there are less.
This is the common number format for currencies. • 0,0
Use a comma after the first zero to display thousand separators (e.g. five million is shown as '5,000,000'). Please note that the thousand separators from the Windows Regional Settings is used.
• 0,0.00 The comma after the first zero is used to add thousand separators
(see above). The number of decimal places is fixed to two places (see above).
• e
The letter 'e' in the number format field is used to display a number in the scientific number format (standard form, exponential notation).
• 0.0;"error";<"0,1" A combination of number formatting strings can be used. The one shown above is a combination of three format strings, separated by
semicolons (';'). The first section ('0.0') is applied to positive numbers (fixed one
decimal place, see above). The second section (string "error") is used for negative values. Since negative values cannot be displayed in e!Sankey, a specific number
format is not applicable. Instead of the negative number the string within the quotation marks is shown.
The third section ('<"0,1"') can be used for null values. If, for example, rounding of very small values would turn the number to

e!Sankey 4 ifu Hamburg GmbH
Page 58 User Manual
zero, the operator and the string within the quotation marks can be
shown (in this example '<0,1').
Figure 65: Example for the use of a number format for a Unit Type
Color Set: A color set can be defined for each unit type in the "Color Set"
field. If a color set is defined, the color of an entry defined within this unit type will be suggested from this pre-defined color set. Nevertheless, it is
always possible to assign individual other colors to an entry, even if this color has not been defined in the color set.
Click on the button "Edit Color Set" to open the color pallet definition dialog. In this dialog colors can be selected and added to the color set for the unit
type. Use the button "Add" to amend the color to the list on the right side. Use Replace to overwrite the marked entry in the list with another color. With the arrow buttons you can change the order of the colors within the
color set.
Figure 66: Creating color pallets for unit types
Balance Check: This feature will enable you to verify whether inputs and
outputs at a process are balanced for the selected unit type. Enable this feature if you want to perform a balance check at processes.
See section on processes for settings and visualization of the balance check per unit type.

ifu Hamburg GmbH e!Sankey 4
User Manual Page 59
Used: Only if the check box "Used" is checked, will the unit type be activated and entries can be defined using this unit type. If you have a
template with many unit types defined, you should only set this flag for unit types that you are actually using for flows. Otherwise you will have many (unused) scaling sliders in the 'Controller' and a long dropdown list of
possible unit types to select from when defining a new entry.
Units for a Unit Type: For each unit type defined in the "Edit Unit Types" dialog at least a basic unit must be defined. The basic unit can be "kg" or "ton" for the "Mass" unit type, it can be "kWh" or "PJ" for the unit type
"Energy". If you have defined any other unit type by yourself, please think of a meaningful basic unit. When no other units next to the basic unit are
set, then all flows of entries that have this unit type are entered and shown in the basic unit.
Units can be used to enter flow quantities in arrows and stock change quantities (stock increase and stock decrease) in processes. Even though
the quantities are entered in another unit, it will be converted to the basic unit for the unit type and the width of Sankey arrow will still be displayed
correctly and proportionally. To change an existing basic unit, just click in the first line of the units table
in the "Name" column and edit the unit name there. Mind that changing a basic unit does not convert any flow quantities. The existing quantities will
just show the modified basic unit name (e.g. "cbm" instead of "cubic metres").
Additional units with a conversion factor can be defined in the list of units for a unit type. Click on the button "Add Unit" next to the table to create a
new entry. Define a name and enter the conversion factor of the unit to the basic unit in the "Coefficient" column. Check the conversion shown upon leaving this field.
Figure 67: Examples for units with conversion factor (unit type 'Energy')
To delete a unit entry, mark it and click on the button "Delete Unit" next to the table. Mind that units that are already being used for flows or stocks
cannot be deleted.
Scaling: Each unit type can be scaled individually using the sliders shown on the Controller panel. Drag the slider to the left or to the right to adapt the width of the arrows with flows of the respective unit type.
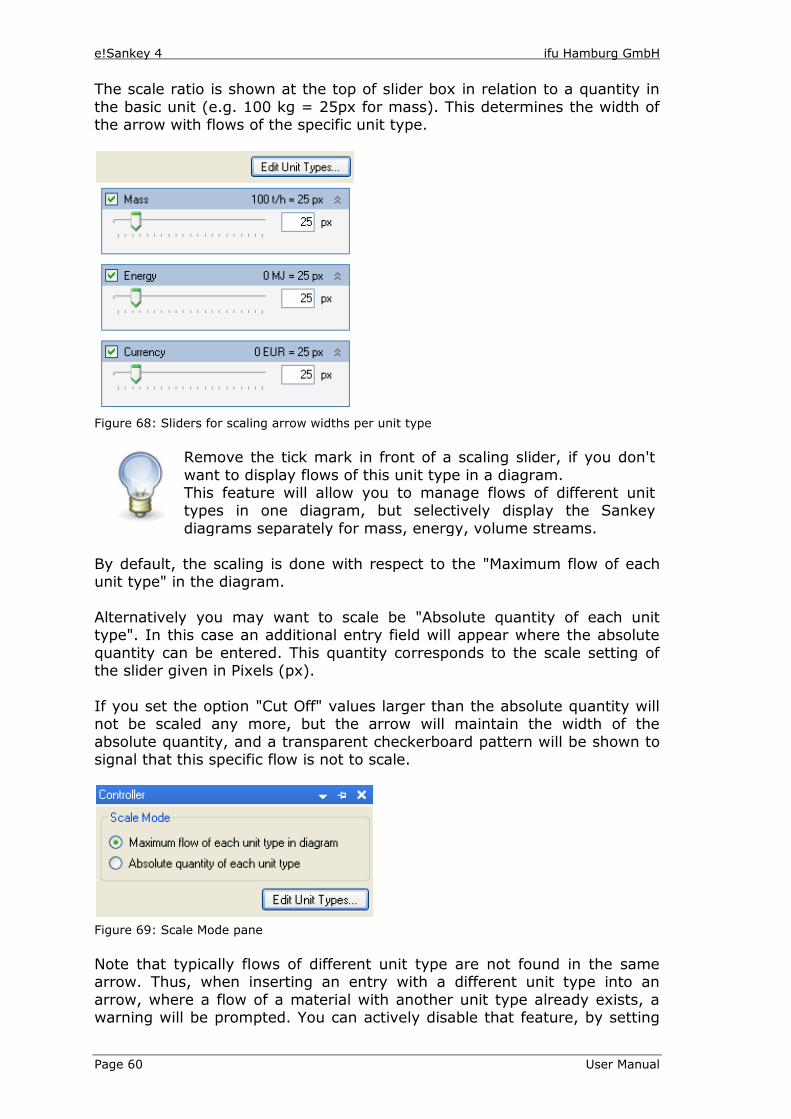
e!Sankey 4 ifu Hamburg GmbH
Page 60 User Manual
The scale ratio is shown at the top of slider box in relation to a quantity in
the basic unit (e.g. 100 kg = 25px for mass). This determines the width of the arrow with flows of the specific unit type.
Figure 68: Sliders for scaling arrow widths per unit type
Remove the tick mark in front of a scaling slider, if you don't
want to display flows of this unit type in a diagram. This feature will allow you to manage flows of different unit types in one diagram, but selectively display the Sankey
diagrams separately for mass, energy, volume streams.
By default, the scaling is done with respect to the "Maximum flow of each unit type" in the diagram.
Alternatively you may want to scale be "Absolute quantity of each unit type". In this case an additional entry field will appear where the absolute
quantity can be entered. This quantity corresponds to the scale setting of the slider given in Pixels (px).
If you set the option "Cut Off" values larger than the absolute quantity will not be scaled any more, but the arrow will maintain the width of the
absolute quantity, and a transparent checkerboard pattern will be shown to signal that this specific flow is not to scale.
Figure 69: Scale Mode pane
Note that typically flows of different unit type are not found in the same arrow. Thus, when inserting an entry with a different unit type into an
arrow, where a flow of a material with another unit type already exists, a warning will be prompted. You can actively disable that feature, by setting

ifu Hamburg GmbH e!Sankey 4
User Manual Page 61
the "Allow different unit types in one arrow" flag in the diagram properties dialog.

e!Sankey 4 ifu Hamburg GmbH
Page 62 User Manual
10 Templates
e!Sankey allows to save diagrams as template files. Template files can serve as models for creating new diagrams in the same styles. When saving
a diagram as a template file, the following items will be included: • Entries
• Unit Types (with their units, number format and color pallets) • Process and arrow properties (see 'Set As Default' command) • Graphical elements (shapes, text elements, legend)
• Options settings
When you create new diagram using a stored template, all of the above will be available.
To store a diagram file as template file, use the 'Save As…' command from the File menu. In the Standard file save dialog choose 'e!Sankey Template
(.santem)' from the file type dropdown list. A "Save as Template" dialog will be prompted. A one line description of the
template must be entered that allows identifying the template in the list of templates on the start page.
Figure 70: Saving a template file
If the newly created template should be presented on the start page of
e!Sankey to use it for creating new Sankey diagrams, you can check the option "Copy template to template directory".
If, in addition the option "Make this template the default template" is checked, this template will appear at the top of the list of available
templates in bold font. It will also be set as the template that is used when creating a new Sankey diagram using the "New Diagram" button in the
toolbar or opening a new diagram file with the "New Diagram" command from the File menu.

ifu Hamburg GmbH e!Sankey 4
User Manual Page 63
Figure 71: List of templates on the start page with the default template at the top
The default template can be set in the Options dialog on the 'General' page.
Using templates: To create a new diagram file using a specific template, either click on the entry in the list in the 'New Diagram' section on the start page or choose the template by its description from the cascading menu of
the 'New' command in the File menu.
The template files (.santem files) are typically located in the "Templates" subdirectory of the e!Sankey installation. If you receive template files from someone else, you can just copy them into that folder, and they will appear
as a template to choose from in the list.
The default template directory can be defined in the 'Options' dialog on the 'General' page. You can find more information in chapter 3.

e!Sankey 4 ifu Hamburg GmbH
Page 64 User Manual
11 Live Link to Excel
The Live Link feature is available in e!Sankey pro and calc only.
With this feature a "live" connection from one or more Excel spreadsheets to an e!Sankey diagram can be established. When changes are made in the spreadsheets connected to the e!Sankey diagram file, it can be updated
(automatically or manually), so that the arrow widths and the text labels in the diagram reflect the new values.
Live Links to Excel can only be created for existing diagram elements. Drawing new diagram elements with this feature is not possible. The Live Link to Excel works for Excel XP (2002) and newer versions.
Excel Live Link for Numeric Values: The Excel Live Link dynamically links the quantity value for a flow in an existing diagram file in e!Sankey
with a cell in an Excel spreadsheet. When the user changes the value in the cell of the Excel sheet, the value in the Sankey diagram will be updated automatically and the arrow is redrawn accordingly, so that its magnitude
represents the new value.
Figure 72: Manually specified flow, no Live Link has been created yet
A Live Link is created by copying a cell value in Excel ('Ctrl-C') and pasting it ('Ctrl-V') in the "Quantity" field in the Arrow properties panel. To have this
Properties panel visible, the arrow must be selected, before the cell content

ifu Hamburg GmbH e!Sankey 4
User Manual Page 65
is pasted. A Live Link reference to the address of the cell in the spreadsheet will be created. An icon in the column is shown, to indicate the status of the
Live Link.
Figure 73: Copy the cell value in Excel. Select the arrow in e!Sankey. On the left side of the screen, paste into the area below "Flows”.
Note that there can be multiple Live Links from one or more Excel worksheet(s) in one or more Excel file(s) into one e!Sankey diagram. The Excel files can also be located on a shared network drive so that other users
can update the values.
Note that the Live Link references to the value of the cell, so that the cell in Excel may also contain a formula or a currency sign (e.g. "1.000 $").
Update of Live Links: When a Sankey diagram file that contains Live Links
is opened, the user is prompted with a dialog box and asked whether Live Links should be updated.
Live Links can also be updated at any time using the commend 'Update Live Links' (menu 'Edit' > command 'Update Live Links…') or by clicking on the
'Update' button in the Edit Live Links dialog. The update works even if the Excel file is closed.
In case you wish to view changes made in Excel directly in the Sankey diagram, you can keep the Excel file open at the same time. In this case
make sure you have updated the Live Links as described above at least one time. All changes of values in the cells referenced with a Live Link will cause the Sankey diagram to update immediately.

e!Sankey 4 ifu Hamburg GmbH
Page 66 User Manual
Editing Live Links: An overview of all Live Links can be seen in the 'Edit
Live Links' dialog (menu 'Edit' > command 'Live Links…').
Figure 74: Edit Live Links dialog shows the Excel files and cells to which Live Links have been created
The name of the source Excel file is shown in a selection list in the panel
'Source' at the top. The path to the location of the file is shown below the list. To modify the source Excel file click on the button "Edit…".
To open the connected Excel file click on "Open…".
For the Excel file selected in the dropdown list 'Source' above, all existing Live Links are shown in the 'Source Live Links' table below. Each Live Link
entry can also be directly edited in this table: A Live Link reference can be pasted directly in one selected line (as an alternative to pasting it into the flow table in the Properties dialog of an arrow as described above).
The table can be copied using the button "Copy Table". It can then be
inserted to a Word or Excel document, where it can be printed. Such a list of Live Links can serve to check the completeness or for auditing purposes.
Remove individual Live Links from the table by clicking them in the list and then clicking the button "Remove". Remove all Live Links by clicking the
button "Remove All" (make sure you really want to remove all Live Links!). In case the Live Link is to direct cell address, this address (e.g.
"Table1!A15") is shown in the column 'Reference'. Should the reference be into a named cell (see below), this is shown in the columns 'Name' and
'Scope' (i.e. the name of the worksheet).

ifu Hamburg GmbH e!Sankey 4
User Manual Page 67
Live Link for Text String: Additionally to the Live Link for numerical values, text strings from Excel sheets can also be linked to text elements in
the e!Sankey diagram file. This can be done for Text Labels, Process Labels and Arrow Comment
Labels. (Note: Arrow Labels are created automatically from the entry name, the quantity, and the unit. They are not directly editable, thus cannot be
updated via an Excel Live Link.) A Live Link for a text string is created by first copying a cell value in Excel
('CTRL+C'). Then mark the text label, process label or arrow comment field in the diagram to bring up the 'properties' dialog. Use the "Paste Live Link"
button below the text field. The Live Link is shown by the active Live Link icon.
Figure 75: Copy the text from a cell in Excel. Click the existing text label in e!Sankey. In the Properties dialog click on the button "Paste Live Link".
Note: Pasting the content of the clipboard with 'CTRL+V' will just paste the content as normal text, but will not set the Live
Link! Use the "Paste Live Link" button below the text field instead.
To remove a Live Link reference, click on the button "Remove Live Link"
below the text entry field of a text label, process label or arrow comment.
To edit a Live Link for a text string, click on the button "Edit Live Link" below the text entry field.
Using Named Cell Areas in Excel to Maintain Live Links to Cells: When a Live Link is created to a cell in an Excel sheet, the reference is by
default made to the cell ID (e.g. "C1"). However, if the spreadsheet layout is changed the location of the cell with the value that is linked to the diagram in e!Sankey might be shifted. This happens, for example, when
columns or lines are inserted.
In order to maintain the Live Links even when the location of the original cell, thus its cell ID, changes, it is necessary to work with named cells. Before you create the Live Link as described above, name the cell (in Excel
2003: Menu Insert > Names > Define, in Excel 2007: Menu Formulas > Define Names or context menu of selected cell > Name a Range > New
Name). When a Live Link is created, it will use the name of the cell instead of the direct cell address ID. The named cell can be located anywhere in the Excel sheet, even when it is moved. When the value in the named cell is
updated, the Live Link will still work even though it might have a different location.

e!Sankey 4 ifu Hamburg GmbH
Page 68 User Manual
12 Process Operations
The Process Operation feature is available in e!Sankey calc only.
You can set the values of flows with data defined in Excel workbooks using Excel Live Links (see chapter 11). Process Operations allow the automatic creation and calculation of flows directly in e!Sankey without the need of
external programs. To achieve this simple calculation operations like Sum or Division are defined for a process and a small number of operation
parameters have to be specified. Based on this information e!Sankey is now capable to calculate flow values. You can freely mix flows specified manually or via Excel Live Links with flows calculated using process operations.
Process Operations Dialog
To define a Process Operation, double-click on the process or use the context menu (right-click "Process Operations…”). After selecting an operation, closing the dialog with "OK” will trigger an automatic calculation
of the diagram. Currently the dialog offers seven different Process Operations to choose
from: "Automatic”, "Merge”, "Sum”, "Difference”, "Split”, "Transformation” and "Ignore”. Selecting a Process Operation on the left side of the dialog will allow the use to configure the operation on the right.
Process Operations have different sets of parameters. A parameter all share
is the direction. The direction can be changed in the top left corner of the dialog by selecting if the inputs or outputs of a process should be calculated. This will change the direction for all operations in the dialog.
After having selected an operation and having set all necessary parameters,
closing the dialog with "OK” will trigger an automatic calculation and e!Sankey will calculate new flows in the relevant arrows.
Be aware that when you are working with an existing diagram and using Process Operations, the calculation may delete some
flows depending on your configuration. You can always Undo the calculation to restore your previous flows in case of an
unwanted change. For Process Operations to be applicable, certain prerequisites have to be
met depending on type and direction. An error message will appear in the dialog if the Process Operation cannot be applied with the current
composition of the process and its connected arrows.
Automatic
This is the default behavior for all processes, unless a specific Process
Operation has been selected. It can calculate missing flows per entry if all but one connected arrow contains a flow for that entry.
The automatic calculation follows the below rules:

ifu Hamburg GmbH e!Sankey 4
User Manual Page 69
o It is tried to create a balance between input and output flows.
o This compensation takes place per entry. There is no allocation of flows of different entries in the same arrow.
o All arrows without existing flows with the corresponding entry
are considered valid targets for calculated flows. Regardless of whether flows for other entries are contained in the particular
arrow. o "Existing" flows are all flows defined manually or generated by
the calculation of upstream or downstream processes.
o The automatic calculation requires exactly one candidate arrow for each entry.
o Negative flows cannot be generated. o The calculation direction is determined automatically. The
selection of whether incoming or outgoing flows should be calculated has no effect on the automatic calculation.
Below you will find examples that illustrate the possibilities and constraints of the automatic calculation:
Figure 76: Automatically calculable processes
The processes in the above can all be calculated by the Automatic Process Operation. All of them are connected to exactly one arrow which does not
yet have flows for the given entries. The examples on the left will calculate a blue flow in either the empty output (above) or the empty input (below)
arrow. Respectively the examples on the right will create two flows, one blue and one yellow.

e!Sankey 4 ifu Hamburg GmbH
Page 70 User Manual
Figure 77: Examples for automatic calculation
Of the four examples shown above only the last one (4) will be able to
calculate a flow. 1) Cannot be calculated because there are two potential targets for the
calculated blue flow.
2) Cannot be calculated even though there is only one potential target. When subtracting the input from the output amount, the calculated
flow would be negative. 3) Even though the second input arrow contains a yellow flow it is
considered empty with regards to the blue entry. So there are two
target arrows available for the blue entry. 4) A flow will be added to the empty input arrow. The amount will be
positive when subtracting the input from the output flows.
Merge
The "Merge” Process Operation takes all flows from all incoming or outgoing arrows and passes them to the single output or input arrow, depending on the selected direction. Flows of the same entry will be summed up in a new
flow; all other entries will be passed on with their initial values (see Figure 78 below).

ifu Hamburg GmbH e!Sankey 4
User Manual Page 71
Figure 78: Process Operation "Merge”
Figure 79: Process Operation "Merge” with errors

e!Sankey 4 ifu Hamburg GmbH
Page 72 User Manual
To be able to use the "Merge” Process Operation, the chosen process needs
to have at least one input arrow and exactly one output arrow for the output direction or at least one output arrow and exactly one input arrow for the input direction. Otherwise an error will be shown in the dialog and
the operation cannot be selected. In Figure 79 above, the Process Operation cannot be selected because the prerequisites were not fulfilled.
Sum
The "Sum” Process Operation calculates the sum of all input or output flows and creates a flow of the selected entry at the single outgoing or incoming
arrow, depending on the selected direction.
Figure 80: Process Operation "Sum” with direction output
To configure the operation, select an entry from all available entries in your diagram to define the entry for the calculated input or output flow. After a successful calculation, the output or input arrow will contain a single
flow of the selected entry with the calculated sum of all incoming or outgoing flows (depending on the chosen direction).
To be able to use the "Sum” Process Operation, the chosen process needs
to have at least one input arrow and exactly one output arrow for the output direction or at least one output arrow and exactly one input arrow for the input direction. Otherwise an error message will appear on the
dialog and the operation cannot be selected.
Difference
The "Difference” Process Operation calculates the difference of the surrounding flows and creates a flow of the selected entry at the outgoing
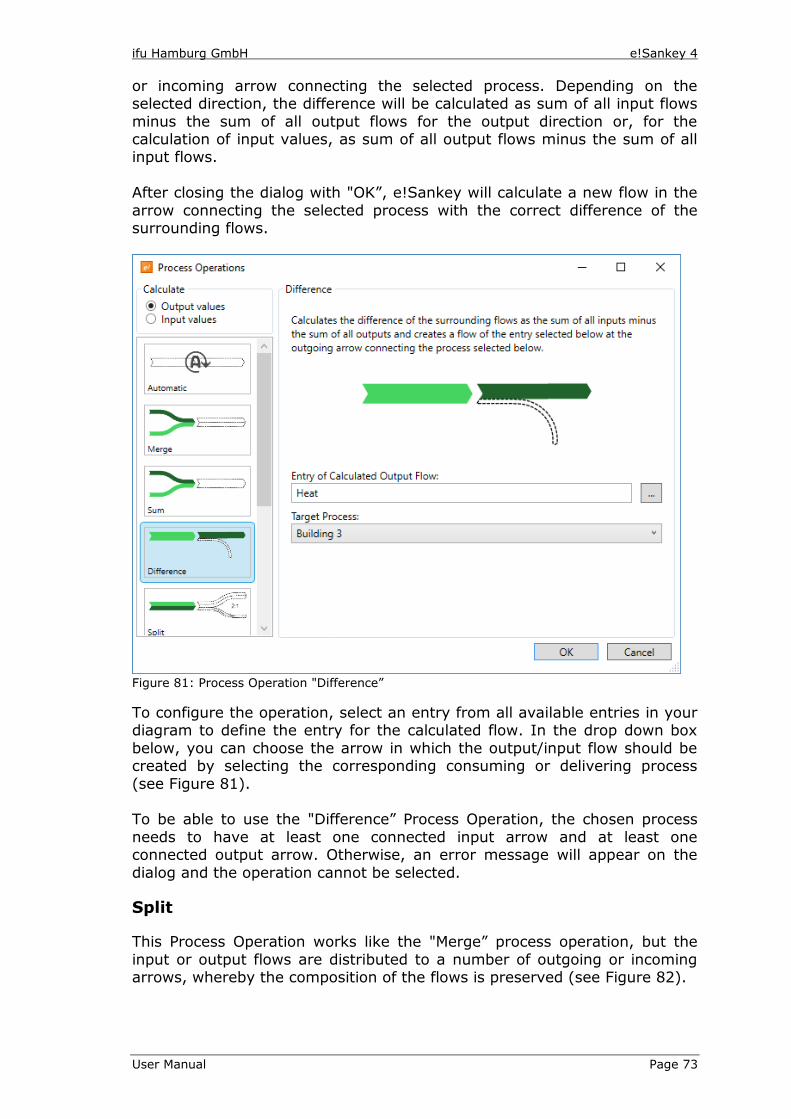
ifu Hamburg GmbH e!Sankey 4
User Manual Page 73
or incoming arrow connecting the selected process. Depending on the selected direction, the difference will be calculated as sum of all input flows
minus the sum of all output flows for the output direction or, for the calculation of input values, as sum of all output flows minus the sum of all input flows.
After closing the dialog with "OK”, e!Sankey will calculate a new flow in the
arrow connecting the selected process with the correct difference of the surrounding flows.
Figure 81: Process Operation "Difference”
To configure the operation, select an entry from all available entries in your diagram to define the entry for the calculated flow. In the drop down box
below, you can choose the arrow in which the output/input flow should be created by selecting the corresponding consuming or delivering process
(see Figure 81). To be able to use the "Difference” Process Operation, the chosen process
needs to have at least one connected input arrow and at least one connected output arrow. Otherwise, an error message will appear on the
dialog and the operation cannot be selected.
Split
This Process Operation works like the "Merge” process operation, but the
input or output flows are distributed to a number of outgoing or incoming arrows, whereby the composition of the flows is preserved (see Figure 82).

e!Sankey 4 ifu Hamburg GmbH
Page 74 User Manual
Figure 82: Process Operation "Split”
The proportion per arrow is calculated as follows:
proportion (arrow) = ratio (arrow) / sum (all ratio values)
For the sake of illustration, see Figure 83 and Figure 84. Here, the incoming flows are distributed to the outgoing arrows in a ratio of 3:2.
Figure 83: Process Operation "Split” before calculation

ifu Hamburg GmbH e!Sankey 4
User Manual Page 75
Figure 84: Process Operation "Split” after calculation
To define a process as "Split”, it must be connected to at least one input
and one output arrow.
Transform
This Process Operation is similar to the "Split” Process Operation. The flows are also split, but instead of being forwarded, a new entry is selected for
each incoming or outgoing arrow (see Figure 82: Process Operation "Split”).
Figure 85: Process Operation "Transform”
For the sake of illustration, see Figure 86 and Figure 87. Here, the incoming
flows for the upper arrow are transformed into 4 parts of the entry "Product”, 2 parts of the entry "By-Product” for the middle arrow and one
part of the entry "Waste” for the lower arrow.

e!Sankey 4 ifu Hamburg GmbH
Page 76 User Manual
Figure 86: Process Operation "Transformation” example before calculation
Figure 87: Process Operation "Transformation” example after calculation
To define a process as "Transformation”, it must be connected to at least
one input and one output arrow.
Ignore
This process will be ignored during calculation and no flows, neither input nor output, will be created or changed by this process.
Note that when setting the process operation to "Ignore", the process is passive, and does not inspect or handle any flows in the adjacent arrows.
This is similar to the behavior of the e!Sankey basic or e!Sankey pro version.
Calculation Example In the diagram in Figure 88, the overall amount of mixed water should be
calculated based on the known water sources (company well, rainwater reservoir, public water supply).

ifu Hamburg GmbH e!Sankey 4
User Manual Page 77
Figure 88: Water usage example diagram before calculation
For this, the process "Water treatment” is selected and the Process
Operation dialog is opened. The most suitable Process Operation for this calculation is the "Sum” operation. The entry "Mixed water” is chosen as entry for the resulting output flow.
After a successful calculation, there is a new flow in the arrow leaving the
process "Water treatment” with the entry "Mixed water” and the correct sum of 3500 liters (see figure below).
Figure 89: Water usage example diagram after calculation
In the properties window of the arrow we can see a calculation icon in the LL column of the flow, indicating that the flow has been created by the
calculation (see figure below).
Figure 90: Flow properties show calculation as origin for quantity value
Working with Process Operations After having defined at least one Process Operation in your diagram, you
may want to adjust your diagram, e.g. adding new arrows, flows or updating values manually or via Excel Live Links. The automatic calculation of flows only occurs after having selected a Process Operation. If you want
to re-calculate your diagram after having made other changes, select the

e!Sankey 4 ifu Hamburg GmbH
Page 78 User Manual
menu item "Start” from the "Calculation” menu. Alternatively you can use
the keyboard shortcut "F9” at any time.
Figure 91: Calculation menu items
Calculation Errors
Each time a calculation is performed, a message indicates if the calculation was successful or not. In case of an unsuccessful calculation, an error
message shows how many processes have calculation errors. An exclamation mark indicates the affected processes. Moving your mouse over the icon, a tooltip message will explain in detail where the problem lies and
suggests possible solutions.
In case you want to clear the error indicators from the calculation, you can use the menu entry "Clear Error Messages” from the "Calculation” menu. After a new calculation, the error messages and indicators will appear again
if the reasons for the errors have not been fixed.
Balance warnings are not affected by this.
Figure 92: Calculation error message example
Using the menu item "Reset” from the "Calculation” menu, you can delete all flows created by the calculation.

ifu Hamburg GmbH e!Sankey 4
User Manual Page 79
The menu entry "Process Operation…” will open the process operations dialog of the selected process. This corresponds to double clicking on the
process. Calculation and Units of Measurement
To achieve correct results which fulfill expectations, flows that are defined in different units of measurement (e.g. one flow in g and one flow in kg) and
which should be offset against one another, have to be converted by the calculation beforehand. At the moment the calculation only works with units of measurement from the International System of Units (SI) and uses the
provided conversion factors. You can see a list of currently supported SI units (from the International System of Units) using the menu item "List of
available SI units” in the "Calculation” menu.
If you are using units of measurement beyond the supported SI units, you may be alerted by error messages that the calculation did not succeed. On the one hand this can mean the calculation is incomplete and not all
processes could be calculated. On the other hand this can also mean that although processes have been calculated and flows have been created, the
result (the amount of the calculated flows) is not valid because of missing conversion factors.
In such cases an error indicator can be found at the affected processes. Please check if you can use a SI unit instead of the used unit of
measurement. You can either rename the used unit or create and use a new unit of measurement according to the most suitable SI unit.

e!Sankey 4 ifu Hamburg GmbH
Page 80 User Manual
13 Exporting and Printing
Save a Sankey diagram file using the 'Save As' command in the file menu, An e!Sankey diagram file has the file extension '.sankey'.
To create an image file from the Sankey diagram you created in e!Sankey,
choose the 'Export…' command from the File menu, and select a file type. The following file types are available: PNG, JPG, GIF, BMP, EMF.
Note that the graphics file created is typically limited directly by the network elements, i.e. does have a narrow 2 pixel white margin around it.
In order to produce high resolution image export files, the following "Choose Export Quality" dialog will come up. It allows for setting a scaling
factor for the export or determine a custom export size.
Figure 93: Export Quality dialog
It is recommended to select a large zoom factor (e.g. 400%) before exporting the diagram to a file, and then reduce the size of the image file,
in order to obtain the best quality (e.g. in a printout).
EMF is a vector graphics format. PNG typically produces a good quality, especially when setting the scale factor higher. PDF format can be used by professional printers to embed in printing jobs.
Copy to Clipboard: An alternative way to quickly use the Sankey diagram
created in another application is via the Windows Clipboard. It may however not yield the best results in regard to image quality.
To directly copy a Sankey diagram, select all elements (either by pulling a frame around it, or by using CTRL-A), then copy it (with CRTL-C or with the
Copy command from the Edit menu). Switch to the other application (Word, Power Point, etc.) and paste the content of the clipboard.
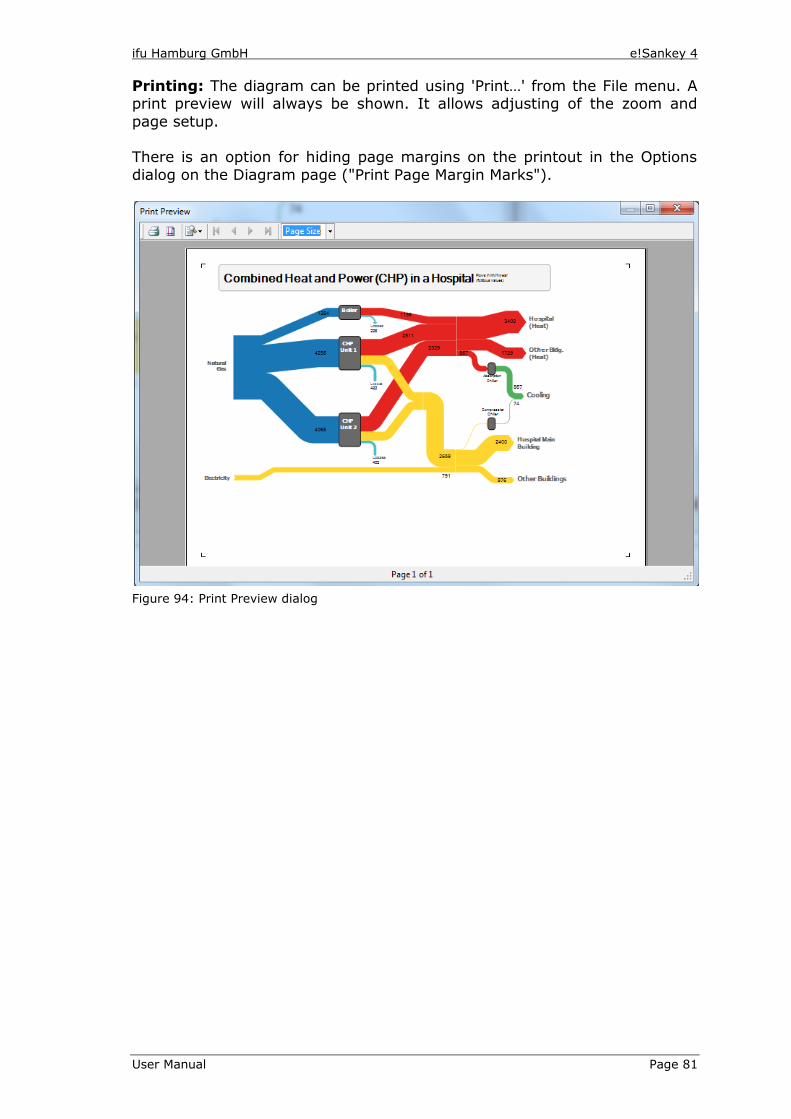
ifu Hamburg GmbH e!Sankey 4
User Manual Page 81
Printing: The diagram can be printed using 'Print…' from the File menu. A print preview will always be shown. It allows adjusting of the zoom and
page setup. There is an option for hiding page margins on the printout in the Options
dialog on the Diagram page ("Print Page Margin Marks").
Figure 94: Print Preview dialog
e!Sankey 4 ifu Hamburg GmbH
Page 82 User Manual
14 Further Hints
GUI language: You can change the language setting of the user interface of e!Sankey in
the 'Options' dialog. Restarting is required for the language change to take effect. Currently the following languages are supported: English, German,
French, Spanish and Portuguese. Version Update:
The 'Version' panel on the start page will show you, if the license is up-to-date or if an update version has been made available. This check for
updates can be disabled in the 'Options' dialog. If it is disabled, use "Check for Updates…' from the Help menu. An internet connection on port 80 is required. If your corporate security policies prohibit this, please see the
announcements on http://www.e-sankey.com/ or in the e!Sankey forum (bulletin board) to find out if there is a new version.
Updates within the same version level (e!Sankey 4.x) are typically free-of-charge.
Support:
Visit the e!Sankey forum at http://www.e-sankey.com/smf/index.php to read hints, get support and discuss with other e!Sankey users.
The support e-mail address is [email protected]

ifu Hamburg GmbH e!Sankey 4
User Manual Page 83
15 SDK and Integration of Sankey Diagrams
General Information
A software development kit (SDK) version of e!Sankey is available. It allows
for automatic updating of Sankey diagrams from a data source, and for setting up Sankey diagrams using XML files.
The e!Sankey SDK can be used to integrate Sankey diagrams into other applications (e.g. energy management software, plant control applications,
measurement data databases). Please contact [email protected] should you be interested in a
customized solution. Please inquire about licenses at [email protected] should you be interested in the SDK package.
Handling Key Fields (for SDK)
If you are using your e!Sankey pro desktop version to prepare Sankey diagrams that are subsequently being used as templates for a solution developed with the e!Sankey software development kit (SDK), then you
might need to work with key fields.
Keys are the unique IDs that are used to reference elements of a diagram that are updated with values from an external data source.
The elements that have key fields for unique IDs are • Flows (for flow quantity) in arrows
• Stocks (stock increase quantity, stock decrease quantity) at processes
• Process labels (process names)
• Text labels
The programmatic addressing of keys is described in the e!Sankey SDK documentation. However, if your task is to set the keys in a Sankey diagram, you need to know the following:
The key column is only available (visible) when the option "Show Key Field"
on the 'Extended' page of the options dialog is turned on (see 'Options Dialog' in chapter 3 of this manual). Turn it on to be able to enter keys.
Keys are strings made up from characters and numbers. They must be unique in the diagram (i.e. you cannot use the same key for two different
elements). Key names can contain spaces. Keys are case-sensitive, i.e. there is a difference between lowercase and uppercase caption.
The data source typically provides key/value pairs. Check whether a list of keys is available from the data source that will later be used to provide the
data for update of the Sankey diagram. Copy these keys from the key/value pair list provided and type them in the "Key" field for the respective
element.

e!Sankey 4 ifu Hamburg GmbH
Page 84 User Manual
Key Overview: When the option "Show Key Field" is set, a "Keys in
Diagram" window can be called from the Edit menu. This list will give you an overview which keys have been defined for each element.
Figure 95: List of keys in the diagram
Copy the list of keys with their current values to the clipboard using the button 'Copy to Clipboard'
If you want to create your own set of keys rather than using pre-existing keys from your data source and typing them in by yourself, use 'Initialize
Process Keys'. This will create a key for all process names in the Sankey diagram. Existing keys will not be overwritten. (Note: this feature is not available for keys for flows, stocks and texts).
Key Lookup: If the administrator of the data source can provide a list of
keys, it can be used as a lookup list in your desktop version. This will immensely help you to select the keys and also avoid mistyping the key name.
The lookup list must be a CSV file and can be located either on your
computer or anywhere on an accessible network drive. The path to the lookup list CSV must be set in the options dialog on the 'Extended' page.
The format of the CSV file used for lookup should be as follows: There is one entry per line. The file has one or two columns. If there are more
columns all columns after column two will be ignored. • If there is only one column, this has to be a simple list with tag IDs
serving as keys. • If there are two columns, then the first column should be a name or
description of the element (string), the second should contain the tag
ID. The value in the second column will be used and copied to the "Key" field.
Several delimiters (e.g. ' or ") are allowed, so are the separators (e.g. comma, semicolon, pipe). The algorithm will try to determine the delimiter
and separator.

ifu Hamburg GmbH e!Sankey 4
User Manual Page 85
Since spaces are allowed within the values, the space as separator should be avoided, unless you have the values in
explicit delimiters (e.g."value")
If a lookup list is available and has been set in the option, then typing some
characters in any of the key fields will automatically bring up a list of hits with keys (IDs or names) that match. You can then select the correct entry
from the lookup list.
Figure 96: Using lookup lists to enter keys
The entered characters can be either in the key ID itself or in a description or real name of an equipment or machine the key references.
If you don't wish to use a lookup list, or if no lookup list is configured you can always type the key directly into the key field.
e!Sankey – show the flow / Umberto – know the flow The software e!Sankey for the visualization of material and energy flows is a side product of the development of the material and energy flow modeling
software Umberto. While e!Sankey requires all flows to be known, and can only display these flows in an graphically appealing diagram, it's bigger
brother 'Umberto' is a fully fledged modeling tool.
It is used to determine material and energy flows in a process system using process specifications and powerful calculation algorithms. It also allows calculating the costs associated with material and energy flows in the
production system, and the environmental impacts. Sankey diagrams are an alternative display option for the modeling results.
Read more about Umberto at http://www.umberto.de

e!Sankey 4 ifu Hamburg GmbH
Page 86 User Manual
Index
—A—
Activation ........................................................................................... 8
Add Flow .......................................................................................... 52 Alignment ................................................................................... 44, 47
Arrow .............................................................................................. 23 Border .......................................................................................... 26 Color Gradient ................................................................................ 27
Delete Flow .................................................................................... 23 Enter Flow ..................................................................................... 23
Flow Content Label ......................................................................... 26 Flow Table ..................................................................................... 23
Label ....................................................................................... 27, 28 Orthogonal .................................................................................... 25 Properties ...................................................................................... 24
Rounded ........................................................................................ 25 Spikes ........................................................................................... 27
Arrow Head ...................................................................................... 24 Arrow Points ..................................................................................... 34 Arrow Routing ................................................................................... 34
Arrow Tail ........................................................................................ 24 Arrow Waypoint ................................................................................ 35
Aspect ............................................................................................. 42 Aspect Ratio ..................................................................................... 50 Automatic ........................................................................................ 68
—B—
Background ...................................................................................... 49 Balance Check ............................................................................. 40, 58
Balance Difference ............................................................................. 41 Basic Unit ......................................................................................... 59
BMP ................................................................................................. 80 Border ............................................................................................. 26 Brightness ........................................................................................ 54
—C—
Clipart ............................................................................................. 42 Color ............................................................................................... 53
Brightness ..................................................................................... 54 Entry ............................................................................................ 52
Flow ............................................................................................. 52 Grid .............................................................................................. 17 Hue .............................................................................................. 54
Legend .......................................................................................... 47 Pattern .......................................................................................... 54
RGB .............................................................................................. 54 Saturation ..................................................................................... 54 Transparency ................................................................................. 54
Color Gradient .................................................................................. 27 Color Set ..................................................................................... 53, 58
Comment Label ................................................................................. 27

ifu Hamburg GmbH e!Sankey 4
User Manual Page 87
Connectivity ..................................................................................... 36 Content ........................................................................................... 48
Controller ......................................................................................... 59 Copy ............................................................................................... 51 CSV ............................................................................................ 18, 84
Curviness ......................................................................................... 25 Custom Flow Label ............................................................................ 30
Customizing ..................................................................................... 83
—D—
Deactivation ....................................................................................... 9
Default Template .............................................................................. 63 Delete
Entry ............................................................................................ 53
Flow ............................................................................................. 23 Stocks .......................................................................................... 41
Design Mode ..................................................................................... 13 Diagram
Export ........................................................................................... 80
Print ............................................................................................. 80 Diagram Options ............................................................................... 15
Difference ........................................................................................ 72 Drawing Arrow .................................................................................. 19
Drawing Process ............................................................................... 19
—E—
Edit Live Link .................................................................................... 66 Element Layer ............................................................................. 38, 49
Ellipse .............................................................................................. 46 EMF ................................................................................................. 80
English ............................................................................................ 82 Enter Flow ........................................................................................ 19
Entries Group ................................................................................... 52 Entry ............................................................................................... 52
Color ............................................................................................ 52
Search .......................................................................................... 14 Equidistant Processes ........................................................................ 45
Excel ............................................................................................... 64 Export ............................................................................................. 80 Export Quality................................................................................... 80
—F—
Favourite Colors ................................................................................ 54 Fill Pattern ....................................................................................... 54
Find ................................................................................................. 14 Fix to Segment ................................................................................. 34
Floating License .................................................................................. 8 Flow ................................................................................................ 53
Delete ........................................................................................... 23
Enter ............................................................................................ 23 Search .......................................................................................... 14
Flow Color ................................................................................... 27, 52 Flow Comment .................................................................................. 33 Flow Content Label ............................................................................ 28

e!Sankey 4 ifu Hamburg GmbH
Page 88 User Manual
Flow Label ........................................................................................ 28
Fix to Segment ............................................................................... 34 Name ............................................................................................ 29 Rotate ........................................................................................... 33
Sum ............................................................................................. 29 Value ............................................................................................ 29
Flow Table ........................................................................................ 23 Folder .............................................................................................. 52 Font ................................................................................................ 47
French ............................................................................................. 82 Fullscreen ......................................................................................... 13
—G—
German ........................................................................................... 82 Getting Started ................................................................................. 19
GIF .................................................................................................. 80 Gradient ........................................................................................... 27 Grey Point ........................................................................................ 35
Grid ............................................................................................ 17, 51 Group .............................................................................................. 52
—H—
Head ............................................................................................... 24 Help Desk......................................................................................... 82
Hidden Process ................................................................................. 43 Hue ................................................................................................. 54
—I—
Icon ................................................................................................. 42
Ignore ............................................................................................. 76 Image ......................................................................................... 42, 49
Image Export .................................................................................... 80 Insert Mode ...................................................................................... 16
Installation ......................................................................................... 7 Integration ....................................................................................... 83
—J—
JPG.................................................................................................. 80
—K—
Key ................................................................................................. 83 Key Field ..................................................................................... 18, 83
Keywords ......................................................................................... 31 Kiosk Mode ....................................................................................... 13
—L—
Label ............................................................................................... 26 Number Format .............................................................................. 57
Search .......................................................................................... 14 Label Connection Line ........................................................................ 17 Language .................................................................................... 16, 82
Legend ............................................................................................. 47 Add .............................................................................................. 47
Color ............................................................................................. 47

ifu Hamburg GmbH e!Sankey 4
User Manual Page 89
Remove ........................................................................................ 48 License .......................................................................................... 7, 8
License Deactivation ............................................................................ 9 License Removal ................................................................................. 9 License Transfer .................................................................................. 9
License Update ................................................................................... 9 Line ................................................................................................. 46
Live Link .......................................................................................... 64 Cell Reference ................................................................................ 64 Copy&Paste ................................................................................... 64
Create .......................................................................................... 64 Delete ........................................................................................... 66
Edit .............................................................................................. 66 Keep Value .................................................................................... 16
List ............................................................................................... 66 Named Cell Areas ........................................................................... 67 Numeric ........................................................................................ 64
Print ............................................................................................. 66 Remove ........................................................................................ 66
Text ......................................................................................... 47, 67 Update .......................................................................................... 65
Lock Position .................................................................................... 50
Lookup List .................................................................................. 18, 84
—M—
Material ........................................................................................... 52
Merge .............................................................................................. 70 Multiple Element Editing ..................................................................... 51
—N—
Node ................................................................................. see: Process Number Format ................................................................................ 57
—O—
Options ....................................................................................... 10, 15 Original Size ..................................................................................... 50 Orthogonal ....................................................................................... 25
—P—
Padding ........................................................................................... 44 Page Margin Marks ............................................................................ 16
Paste ............................................................................................... 51 Pattern ............................................................................................ 54
PDF ................................................................................................. 80 Percentage ....................................................................................... 29 Pixel ................................................................................................ 60
PNG ................................................................................................. 80 Portuguese ....................................................................................... 82
Presentation Mode ............................................................................. 13 Print ................................................................................................ 80 Process ............................................................................................ 39
Alignment ...................................................................................... 44 Balance ......................................................................................... 40
Equidistant .................................................................................... 45
e!Sankey 4 ifu Hamburg GmbH
Page 90 User Manual
Hide ......................................................................................... 39, 43
Icon .............................................................................................. 42 Padding ......................................................................................... 44 Properties ...................................................................................... 39
Search .......................................................................................... 14 Shape ........................................................................................... 39
Show ............................................................................................ 39 Size .............................................................................................. 44 Stocks ........................................................................................... 41
Process Operations ............................................................................ 68 Automatic ...................................................................................... 68
Calculation..................................................................................... 77 Difference ...................................................................................... 72 Errors ........................................................................................... 78
Ignore ........................................................................................... 76 Merge ........................................................................................... 70
Split .............................................................................................. 73 Sum ............................................................................................. 72 Transform ..................................................................................... 75
Properties Legend .......................................................................................... 47
Text .............................................................................................. 47 Purchasing ......................................................................................... 7
—R—
Rectangle ......................................................................................... 46 Red Point ......................................................................................... 34 Redo ................................................................................................ 14
Registration .................................................................................... 7, 8 RGB ................................................................................................. 54
Rotate ............................................................................................. 33 Rounded .......................................................................................... 25 Rounded Rectangle ............................................................................ 46
—S—
Sankey Arrow ....................................................................... see: Arrow Sankey Diagram................................................................. see: Diagram
santem ....................................................................................... 16, 62 Saturation ........................................................................................ 54
Scale ............................................................................................... 48 Scaling ............................................................................................. 59 SDK ............................................................................................ 18, 83
Search ............................................................................................. 14 Shapes ............................................................................................ 46
Size ................................................................................................. 44 Sorting ............................................................................................ 48 Spanish ............................................................................................ 82
Spike Angle ...................................................................................... 28 Spikes ............................................................................................. 27
Split ................................................................................................ 73 Stock Decrease ................................................................................. 41 Stock Increase .................................................................................. 41
Stocks ............................................................................................. 41 Delete ........................................................................................... 41
ifu Hamburg GmbH e!Sankey 4
User Manual Page 91
Enter ............................................................................................ 41 Stocks Table ..................................................................................... 41
Sum ................................................................................................ 72 Support ...................................................................................... 10, 82 System Requirements .......................................................................... 7
—T—
Tail .................................................................................................. 24 Template ......................................................................................... 62
Template Directory ............................................................................ 63 Text ................................................................................................ 47
Alignment ...................................................................................... 47 Edit .............................................................................................. 47 Font .............................................................................................. 47
Live Link .................................................................................. 47, 67 Properties ...................................................................................... 47
Rotate ........................................................................................... 47 Search .......................................................................................... 14
Transfer License .................................................................................. 9
Transform ........................................................................................ 75 Transparency ............................................................................... 50, 54
Trial Version ....................................................................................... 7
—U—
Umberto .......................................................................................... 85
Undo ............................................................................................... 14 Uninstall .......................................................................................... 11 Unit Type ......................................................................................... 56
Balance ......................................................................................... 58 Color Set ....................................................................................... 58
Define ........................................................................................... 57 New .............................................................................................. 57
Number Format .............................................................................. 57 Scaling .......................................................................................... 59 Sorting .......................................................................................... 56
Units ............................................................................................. 59 Used ............................................................................................. 59
Units ............................................................................................... 59 Basic Unit ...................................................................................... 59 Conversion Factor .......................................................................... 59
Delete ........................................................................................... 59 New .............................................................................................. 59
Update ..........................................................................................9, 82 Update Live Link ............................................................................... 65 Updates ........................................................................................... 10
Used ................................................................................................ 59
—V—
Version ............................................................................................ 82
—W—
Waypoint ......................................................................................... 35 Windows .......................................................................................... 12
Windows Handling ............................................................................. 12

e!Sankey 4 ifu Hamburg GmbH
Page 92 User Manual
—Y—
Yellow Point ...................................................................................... 34
—Z—
Z-Order ........................................................................................... 37