sanjiv k. bhatia*
TRANSCRIPT

156 Int. J. Computational Vision and Robotics, Vol. 2, No. 2, 2011
Copyright © 2011 Inderscience Enterprises Ltd.
Effect of font size, italics, and colour count on web usability
Sanjiv K. Bhatia* Department of Mathematics and Computer Science, University of Missouri – St. Louis, St. Louis, MO 63121, USA E-mail: [email protected] *Corresponding author
Ashok Samal and Nithin Rajan Department of Computer Science and Engineering, University of Nebraska – Lincoln, Lincoln, NE 68588, USA E-mail: [email protected] E-mail: [email protected]
Marc T. Kiviniemi Department of Community Health and Health Behavior, University at Buffalo, Buffalo, NY 14214, USA E-mail: [email protected]
Abstract: Web usability measures the ease of use of a website. This study attempts to find the effect of three factors – font size, italics, and colour count – on web usability. The study was performed using a set of tasks and developing a survey questionnaire. We performed the study using a set of human subjects, selected from the undergraduate students taking courses in psychology. The data computed from the tasks and survey questionnaire were statistically analysed to find if there was any effect of font size, italics, and colour count on the three web usability dimensions. We found that for the student population considered, there was no significant effect of font size on usability. However, the manipulation of italics and colour count did influence some aspects of usability. The subjects performed better for pages with no italics and high italics compared to moderate italics. The subjects rated the pages that contained only one colour higher than the web pages with four or six colours. This research will help web developers better understand the effect of font size, italics, and colour count on web usability in general, and for young adults, in particular.
Keywords: web usability; web factors; user interfaces; font selection; colour selection.
Reference to this paper should be made as follows: Bhatia, S.K., Samal, A., Rajan, N. and Kiviniemi, M.T. (2011) ‘Effect of font size, italics, and colour count on web usability’, Int. J. Computational Vision and Robotics, Vol. 2, No. 2, pp.156–179.

Effect of font size, italics, and colour count on web usability 157
Biographical notes: Sanjiv K. Bhatia is an Associate Professor in the Department of Computer Science and Mathematics at the University of Missouri at St. Louis. His research interests include algorithms, computer vision, and image analysis.
Ashok Samal is a Professor in the Department of Computer Science and Engineering at the University of Nebraska-Lincoln. His research interests include image analysis including biometrics, document image analysis and computer vision applications.
Nithin Rajan was a graduate student in the Department of Computer Science and Engineering at the University of Nebraska-Lincoln.
Marc T. Kiviniemi is an Assistant Professor in the Department of Community Health and Health Behavior at the University of Buffalo. His work focuses on understanding how people make decisions about engaging in health-related behaviours, how individuals process and respond to information about their health, and how to communicate that information most effectively.
1 Introduction
With the advances in management information systems and enterprise resource planning, the necessary information about a product is just a click away. This is not restricted to just the consumer products but also extends to educational information, health care, and other industries. In today’s e-commerce world, consumers are the end users. These end users are not limited to any particular region or ethnicity but are a part of the internet world, which has more than 1.5 billion users worldwide (Internet World Stats, 2009). A statistic conducted by European Interactive Advertising Association shows that 45% of internet users in Europe go online everyday and spend 11 hours 20 minutes a week on an average. Furthermore, about 78% of those users shop online (BizReport, 2007). Since the consumer base over the internet is vast, the web has become an important medium to serve the customers. This, in turn, has made the design of websites and web interfaces a very important and integral part of contemporary commerce.
The presence of a corporation on the web is the first point of contact for many consumers with the corporation. In recent times, just having a web presence is not enough; the customers expect the web page to be easy to use, attractive, and informative. This has obviously created an added pressure on the web developers to quickly create web pages and maintain them to display the most current information. The increased pressure to develop content for web pages, with the increase in the need of web pages, has resulted in many web designers creating the web pages without considering the strengths and limitations of human information processing. The necessity to design an easy to use web page, which allows a user to process the information effectively, is often ignored. There have been many studies to examine the usability of a web page (Boyarski, et al., 1998; Ivory and Hearst, 2002; Palmer, 2000; Resnick and Fares, 2004). These studies have identified many factors such as font type, colour, style, and font size that affect the usability of a page. The current study attempts to extend the existing work within an educational setting by examining the role of font size, font style, and colour count on the usability of a page using a human study.
158 S.K. Bhatia et al.
1.1 What is usability and why is it important?
The initial web pages were created using the basic markup language HTML. Those pages were fairly simple to create. As the web grew, the pages grew complex in design; both in terms of creation as well as use. These developments led to the demand for research in user-centred design. In another development, the business world started changing from technical to consumer-oriented design in the last century, with more emphasis on ergonomics to make complex interfaces simple for an average user. The professionals realised that customers, consumers, or users have to be positioned at the centre of the business model. A model or a system which is not user-friendly is unlikely to survive in the long run. Thus, usability of a system is about solving the question: How do you help your users succeed within the context of achieving your own business or organisation goals (Brinck et al., 2001)? Usability basically refers to how easy it is for users to learn a system, how efficiently they can use it once they have learned it, and how pleasant it is to use (Honold, 2000).
The International Standards Organization (ISO) defines usability as the extent to which a product can be used by specified users to achieve specified goals in a specified context of use with effectiveness, efficiency, and satisfaction (Barnum and Dragga, 2001; ISO, 1999). Barnum and Dragga (2001) noted that usability is not quality assurance, zero defects, or utility of design features. These terms reflect the issues related to the product itself and not the interaction of a person with the product. The key to website usability is to ensure that the site is both useful and usable for its intended audience (Murray and Costanzo, 1999). Hammond et al. (1987) have discussed making user interfaces more usable using research studies in the area of human factors and cognitive psychology. Usability is a combination of factors that affect the user’s experience with the product or system, including ease of learning, efficiency of use, memorability (Nielsen, 1993), the frequency and severity of errors, and subjective satisfaction.
The discussion of what constitutes a ‘usable’ web interface is ongoing. However, there is general agreement that a usable web interface is one that is accessible, appealing, consistent, clear, simple, navigable, and forgiving of user mistakes. Brinck et al. (2001) have shown that people cannot find the information they seek on websites about 60% of the time. This leads to wasted time, reduced productivity, increased frustration, and loss of repeat visits and money. High usability is the key factor in achieving maximum return on information technology investment by a corporation (Brinck et al., 2001).
1.2 Dimensions of usability
Usability dimensions are an important component of the usability evaluation for an object. The ISO Standard 9241 suggests using effectiveness, efficiency, and satisfaction measures for this purpose (ISO, 1999). Effectiveness is the accuracy and completeness with which users achieve specific goals. It is determined by looking at whether the user’s goals were successful and whether the work is correct. Efficiency is a user’s ability to quickly achieve tasks with ease and without frustration. It can be determined by looking at the total time the user takes to complete a task. Satisfaction is how much the user enjoys using the website. It can typically be determined by looking at the user satisfaction survey. Other dimensions of usability mentioned by researchers include error tolerance, ease of learning, flexibility, and memorability. Designing a website incorporating all the factors that affect its usability is complex because of the sheer number of those factors.

Effect of font size, italics, and colour count on web usability 159
But studying the effects of some of the more important factors provides guidance to designing web pages with greater usability. The specific objectives of this study are to determine the effect of font size, italics, and the number of colours for body text (colour count) on web page usability. In order to achieve these goals, we designed nine content web pages with different values of font size, italics, and colour count, and measured their usability using a human study. We tested the effect of these factors on the three classes of Bloom’s Taxonomy (Anderson and Sosniak, 1994) for learning: knowledge, comprehension, and analysis for young adults. This provides greater granularity in understanding web usability. Our results show that for content pages, many of these factors do not play a significant role in usability for young adults.
In addition to contributing to the body of research in web usability, the research results can be used to determine an automated index for web usability. This index can be used to estimate the usability of web pages and can be further integrated with a search engine to obtain web pages with higher usability.
The remainder of this paper is organised as follows: In Section 2, we describe the background literature on web usability, effects of font size, italics, and colour count. Section 2 also provides details of Bloom’s Taxonomy to characterise learning activities and the Webby awards criteria to evaluate usability. The research design and procedure to carry out the human experiment are discussed in Section 3. In Section 4, we present the analysis and results of the study. Finally, we summarise our research and present directions for future research in Section 5.
2 Related work
In this section, we present the related literature relevant to this study. We first discuss web usability and its importance. We then present related work in usability methods and relevant literature in web. We briefly discuss the judging criteria for the Webby Awards, which are widely used to estimate ‘goodness’ of web. Finally, we summarise Bloom’s Taxonomy.
2.1 Web usability
Usability is the key to making systems easy to learn and easy to use (Nielsen, 1994, 1994a). In the context of web usage, usability includes the consistency and ease with which a user can manipulate and navigate a website. It also includes the clarity of interaction, ease of reading, and arrangement of information on the web page as well as the download speed. Usability analysis can be used to improve the design of user interfaces by evaluating the organisation, presentation, and interactivity of the interface (Schneiderman, 2000). Earlier Human Computer Interaction (HCI) research suggests that usability is associated with reduction in the number of errors, enhanced accuracy, a more positive attitude of the user towards the target system, and increased usage of the system by the user (Lecerof and Paterno, 1998; Nielsen, 1996, 1999).
HCI principles apply equally well to the design of both the graphical user interfaces (GUIs) and the web interfaces. However, there are significant differences between GUI and web interface. The web interface has to deal with many unique features, including compatibility with device and browser diversity, user-initiated and

160 S.K. Bhatia et al.
controlled navigation, and low cost of switching between sites. The unique features include multiple points of page entry into a site, ease of being distracted with the enormity of information available, and the easy ability to personalise what visitors want to see (Badre, 2002).
Designing usable websites requires more attention to context than designing usable GUIs. User interaction with the web also takes on added importance because of the ease with which users can turn off one site and move on to another. In addition to supporting simple interaction, the web designers must also make sure that the user feels comfortable in the interaction (Badre, 2003).
In order to develop web pages with acceptable usability, it is vital for developers and designers to understand the factors that determine how people operate and make use of computer technology effectively. They should then translate this understanding into a system that will enable the users to achieve efficient, effective, and safe interaction with the web interface. In short, usability is a key to evaluate the success of an organisation’s web presence (Agarwal and Venkatesh, 2002).
Web usability became a particular focus of the HCI community during the late 1990s (Nielsen, 1999). This interest was elevated by the fact that web developers were poorly designing the corporate websites. Poor websites with unclear navigation and obscure site structure result in lower customer satisfaction and hence, become an important issue in e-commerce (Barnum and Dragga, 2001). According to some estimates, for every dollar spent on usability, the organisation will realise a benefit of between $10 and $100 (Donahue et al., 1999).
2.2 Usability methods
Usability of websites has been measured by two methods:
a inspection methods
b user test methods.
Both the methods have their own advantages and disadvantages. An effective usability process should ideally combine both the inspection and user testing methods (Kantner and Rosenbaum, 1997; Rosenbaum, 2000). We will briefly describe the two methods below.
• Inspection methods: The inspection methods, such as heuristic evaluation, cognitive walkthrough, pluralistic usability walk-through, and collaborative usability inspection, help in detecting the usability problems. The developers or usability experts frequently employ these methods. The role of the end user in these methods is limited to inspection techniques. In heuristic evaluation, the goal is to find usability problems early in the design so that improvements can be made as a part of the iterative design process (Nielsen and Phillips, 1993). The evaluation is conducted using a small set (one to three) of independent evaluators. In cognitive walkthrough, designers or other experts complete a set of tasks (similar to a formal usability test) using the website instead of using real users. Observers monitor the process and note any problem areas or concerns (Karat et al., 1992). Other inspection techniques include pluralistic usability walk-through (Bias, 1994) and collaborative usability inspection (Rubin and Chisnell, 2008).

Effect of font size, italics, and colour count on web usability 161
• User test methods: Usability testing or the user test methods employ techniques to collect data while representative users use the product to perform representative tasks. These tasks may be either formal in nature, where actual experiments are conducted to accept/reject a hypothesis. In other cases, an iterative cycle of tests can be conducted to identify the usability deficiencies and gradually improve the concerned product (Rubin and Chisnell, 2008). Test methods such as card sorting, thinking aloud, questionnaires, interviews, task analysis, usability tests, and focus groups are widely used to gauge the user satisfaction and opinion about the features of a website. Task analysis means learning about your users’ goals – what they want to do at a website, and the users’ ways of working. Task analysis can also mean figuring out what more specific tasks users must do to meet those goals and what steps they must take to accomplish those tasks. In a usability test, representative users try to do typical tasks with the product, while observers, including the development staff, watch, listen, and take notes.
2.3 Web factors
Web factors include the information that the web designers use to improve a website. A web interface is a mix of web elements such as text, links, and graphics. There are many features that affect these elements and thus, the overall quality of a website. Ivory (2001) recognised 157 of these features and organised them into general classes. These classes include metrics for text elements, link elements, graphic elements, text formatting, link formatting, graphic formatting, page formatting, page function, and page performance. In this research, we focus on the text formatting class. The features identified in this class include body text emphasis, underlined text, font styles and sizes, text colours, the number of times the text is re-positioned on the page, and how the text areas are highlighted. We discuss the background on three specific measures: colour count, font size, and italics on web usability since they are directly related to our research.
2.3.1 Font size
The role of font size on web usability is widely reported in literature (Bernard and Mills, 2000; Flanders and Willis, 1998; Ivory and Hearst, 2002; Nielsen, 1999; Schriver, 1997). Bernard et al. (2001a, 2001b) studied the legibility, reading time, and general font preference for two types of fonts: serif and sans serif. They evaluated font sizes 12- and 14-point for older adults (age range from 63 to 82 years). They developed eight passages with an average of 683 words per passage. Participants were positioned at a fixed distance from the computer screen and were asked to find the incorrect words in the passages and rank the fonts for general preference. Font size 14 points was preferred over 12 points for its legibility and enhanced reading. They also observed that serif fonts were preferable to the sans serif fonts. Bernard et al. (2002) conducted a similar experiment for font sizes 10, 12, and 14 points. The average age of the participants was 24 years. They determined that 12-point size was preferred over ten- and 14-point sizes. The findings were in agreement with the recommendation given by Nielsen for the usage of 12-point font for web pages (Nielsen, 1999). Ivory and Hearst classified web pages as good, average, and poor based on the ratings given by judges of the Webby Awards (Ivory and Hearst, 2002; Webby Awards, 2009). They then developed profiles for good, average and poor pages by computing the 157 web factors for the rated sites. It was found that for a

162 S.K. Bhatia et al.
content page to be good, font sizes greater than nine-point should be used. Flanders and Willis (1998) and Schriver (1997) also reported that font sizes greater than nine-point should be used.
2.3.2 Italics
Boyarski et al. (1998) examined the readability and subjective preferences of Verdana font against Verdana Italic for screen display. They developed eight passages and performed a reading comprehension test. In the comprehension test, the subjects’ response time and performance were recorded. The subjects’ response on survey questions was used to understand the subjects’ performance on the fonts. The study concluded that the readers preferred Verdana over Verdana Italic. Hill and Scharff (1997) investigated the effects of italicised and plain word styles on readability of websites. In their study, the participants scanned a screen of text to find words that described a target shape. Once they found the target word, they clicked on the corresponding shape at the bottom of the screen. The response times were collected for this activity. They found that the response to plain text was faster than italicised text. Flanders and Willis (1998) suggest that italics should be sparsely used in web pages. They also suggest that bold style of fonts should be used for text emphasis. Ivory and Hearst inspected ‘good’ web pages and identified that they rarely contained italicised words (Ivory and Hearst, 2002).
2.3.3 Colour count
Brady and Phillips studied the role of aesthetics in website usability (Brady and Phillips, 2003). In their study, the participants were shown four sites and asked to complete five search tasks with answers located at various levels within the site. Later, they were also asked to do a user satisfaction survey and to rate the sites based on perceived usability and overall aesthetic appeal by showing them the screen shots of the four sites. They found that there was no statistical difference in user satisfaction between the four sites and sites with triadic colour scheme were rated high. Hill and Scharff (1997) investigated the effects of six foreground/background colour combinations. They found that the participants responded quickly for a median colour contrast combination (green and yellow had the fastest response time) which was in support of Powell (1990), who suggested avoiding sharp contrasts. Flanders and Willis (1998) suggest using contrasting text and background colours. They also recommend minimising the number of text colours as the mixing of colours confuses the user. Therefore, web designers should be conservative when using colours for text. Ivory and Hearst identified that ‘good’ web pages generally have one to three different colours for body text (Ivory and Hearst, 2002).
2.4 The Webby Awards judging process
The Webby Awards, also known as ‘Oscars of the internet’, are organised by the International Academy of Digital Arts and Sciences. The 12th Webby Awards received a record 10,000 entries from sites in more than 60 countries (Webby Awards, 2009). The Webby Awards judging process is a three stage process: review, nomination, and final.

Effect of font size, italics, and colour count on web usability 163
Anyone can nominate any site to the review stage (10,000 sites were nominated in 2008). The judges ( > 100) filter this list to a smaller number of sites based on the overall experience and five other judging criteria. Out of these candidates, judges select one winner for each category: 70 categories were considered in 2006. Judges rate websites based on six criteria: content, structure and navigation, visual design, functionality, interactivity, and overall experience. In our work, we have used two of the judging criteria: structure and navigation and overall experience to develop the questionnaire for the survey.
2.5 Bloom’s taxonomy
Bloom developed the taxonomy of educational standards to characterise the level of difficulty and abstraction for tasks performed by learners (Anderson and Sosniak, 1994). The scheme attempts to divide cognitive objectives into six subdivisions ranging from the simplest to the most complex. This classification is widely used in educational and learning research and is used in this research to develop tasks of different complexity. The six tasks in the classification are enumerated as knowledge tasks, comprehension, application, analysis, synthesis, and evaluation. Knowledge tasks involve memory and recall of previously learned material. Comprehension is defined as the ability to grasp the meaning of material. Application is the ability to use learned material in a new situation. Analysis refers to the ability to break down material into its component parts so that its organisational structure may be understood. Synthesis refers to the ability to put parts together to create a new, possibly complex, object. Evaluation is concerned with the ability to judge the value of material (statement, novel, poem, research report) for a given purpose.
3 Research methodology
In this section, we describe the experiments performed to test the effects of three web factors that affect the usability of a content page: font size, italics, and colour count. We designed nine web pages with three different values for each of those factors. One of the values for each factor is based on the optimal values as reported in the literature. The other two values were chosen to be slightly lower and slightly higher than the optimal value. Each of these web pages had only one different value of a factor with the other two factors kept constant. We developed a set of hypotheses to compare the usability of these pages with different values of factors. To verify these hypotheses, we performed a study using human subjects. In the study, a set of subjects were asked to view a page and then to perform a set of tasks based on the page. The subjects were also given a survey questionnaire to express their view on the web page. Performance on the tasks is used to determine the effectiveness and efficiency of the page, while satisfaction is measured using analysis of the responses to the questionnaire. To provide greater resolution, the tasks were further classified using Bloom’s Taxonomy (Anderson and Sosniak, 1994). We used only three classes from the taxonomy in our study (knowledge, analysis, and comprehension). The questionnaire was also organised into four classes: ease of use, likeability, structure, and overall experience.

164 S.K. Bhatia et al.
3.1 Hypotheses
We developed a set of hypotheses to systematically study the effect of the factors that influence the usability of a page. We denote these hypotheses as Hf for font size, Ht for italics, and Hc for colour count. Each hypothesis further consists of three sub-hypotheses that contain specific details about the three components of usability (effectiveness, efficiency, and satisfaction). Thus, the hypothesis for font size is expressed as:
{ }, , ,, ,f f t f c f sH H H H=
where Hf,t, Hf,c, and Hf,s are the sub-hypotheses relating to the effectiveness, efficiency, and satisfaction for the font size, respectively. Similarly,
{ }{ }
, , ,
, , ,
, ,
, ,
i i t i c i s
c c t c c c s
H H H H
H H H H
=
=
where Hi,t, Hi,c, and Hi,s are the sub-hypotheses related to effectiveness, efficiency, and satisfaction for the italics pages, respectively, and Hc,t, Hc,c, and Hc,s are the sub-hypotheses relating to effectiveness, efficiency, and satisfaction for the colour count pages, respectively. Each of these sets contains three hypotheses that compare the effect of the treatment variables on the usability of a page. The details of the hypotheses and development of pages for the same are described in Section 3.3.
3.2 Participants
We recruited 180 subjects to participate in the current study to examine the usability of the nine web pages specifically designed for this study. These subjects were young adults (at least 19 years of age) enrolled in courses offered by the Department of Psychology at the University of Nebraska. The participants were recruited using the Department of Psychology’s Experimetrix web-based signup system. Students received course extra credit and completed the study in small groups of three to ten students over a period of three weeks. Each student was given a separate web page on a computer screen in a laboratory setting.
3.3 Development of web pages
As described above, this study focuses on three factors that affect the usability of a web page: font size, italics, and colour count. These factors are deemed to be among the most important (Ivory, 2001). We developed nine separate web pages to measure the effect of these factors on web usability. The content in all the nine web pages was the same; each page contained information about course requirements for psychology majors. Each page consisted of 315 words of text in addition to the header information about the university and the department. In each case, the usability of the page is measured using the metrics of effectiveness, efficiency, and satisfaction, separately. Therefore, there are a total of nine hypotheses for each of the factors. Next, we will discuss the details of our hypotheses on each of the factors.

Effect of font size, italics, and colour count on web usability 165
3.3.1 Font size
Previous research results (Bernard et al., 2002; Ivory and Hearst, 2002) have indicated that a font size of 12 points is best suited for web pages. For users over age 65, it may be better to use at least 14-point fonts. We designed three web pages with font size of 9-, 12- and 14-point sizes. Table 1 shows sample text from the three web pages. Table 1 Sample texts from 9, 12, and 14 point font size web pages
Font size Sample text from web pages
9 pt If you transfer in an introductory Psychology course 12 pt If you transfer in an introductory Psychology course 14 pt If you transfer in an introductory Psychology course
We developed a set of hypothesis (Hf) to perform pair-wise comparison of the usability of these three pages:
1 pf(12 pt) > pf(9 pt): performance of subjects using the page with 12-point font is higher than that of subjects using the page with nine-point font
2 pf(12 pt) > pf(14 pt): performance of subjects using the page with 12-point font is higher than that of subjects using the page with 14-point font
3 pf(14 pt) > pf(9 pt): performance of subjects using the page with 14-point font is higher than that of subjects using the page with nine-point font.
3.3.2 Italics
Flanders and Willis (1998) have determined that short italicised phrases are preferred by users. We designed three web pages with no italics (web page with no text italicised), moderate italics (web page with short phrases italicised; about 11 percent of the total characters in the page were italicised), and high italics (web pages with italicised sentences; about 37 percent of the total characters in the page were italicised). Figure 1 shows sample text from these web pages.
Figure 1 Sample texts from three measures of italics web pages, (a) text from no italics web page (b) text from moderate italics web page (c) text from high italics web page
(a)
(b)
(c)

166 S.K. Bhatia et al.
We developed a set of hypothesis (Ht) to perform pair-wise comparison of the usability of these three pages:
4 pf(moderate italics) > pf(no italics): performance of subjects using the page with moderate italics is higher than that of subjects using the page with no italics
5 pf(moderate italics) > pf(high italics): performance of subjects using the page with moderate italics is higher than that of subjects using the page with high italics
6 pf(no italics) > pf(high italics): performance of subjects using the page with no italics is higher than that of subjects using the page with high italics.
3.3.3 Colour count
Ivory and Hearst have indicated that a web page looks better when it contains up to three colours (Ivory and Hearst, 2002). We developed three web pages with colour counts of one, four, and six colours (Figure 2).
Figure 2 Web pages with different colours, (a) one colour (b) four colours (c) six colours (see online version for colours)
(a) (b)
(c)

Effect of font size, italics, and colour count on web usability 167
The set of hypothesis (Hc) to perform pair-wise comparison of the usability of these three pages are:
7 pf(one colour count) > pf(four colour count): performance of subjects using the page with colour count of one is higher than that of subjects using the page with colour count of four
8 pf(one colour count) > pf(six colour count): performance of subjects using the page with colour count of one is higher than that of subjects using the page with colour count of six
9 pf(four colour count) > pf(six colour count): performance of subjects using the page with colour count of four is higher than that of subjects using the page with colour count of six.
3.4 Instruments to measure usability
We developed two instruments to measure the usability of a web page along three different dimensions: effectiveness, efficiency, and satisfaction. We developed a set of tasks to be performed by the subjects after viewing a web page. The accuracy of the subjects in performing the tasks is used as a measure of effectiveness of the page. The time taken to perform the tasks is used as a gauge of efficiency. We also developed a survey instrument to measure the satisfaction dimension of the page. The two instruments are explained in detail next.
3.4.1 Tasks
It is a known fact that most of the web users skim the text of the content. Therefore, it is important for the content of a web page to be designed in such a way that users can acquire knowledge, and understand and be able to break down the information into smaller parts in a speedy manner (Nielsen, 1999). We developed a set of six tasks to find the effect of web factors on effectiveness and efficiency. The subjects’ performances on these tasks were accounted as the measure of effectiveness. The time taken to answer these tasks was recorded to measure efficiency. The list of tasks is shown in Table 2. Table 2 List of tasks
1 What group does PSYC 287 fall under? a 200 level Group 2 b 200 level Group 1 c It is not part of a group d PSYC 287 is not a psychology course 2 Which of the following courses is mandatory for a psychology major to take?
(Select all that apply) a PSYC 181 b PSYC 350 c PSYC 472 d None of these

168 S.K. Bhatia et al.
Table 2 List of tasks (continued)
3 To satisfy the major requirements in Psychology a student may take courses from which of the following departments? (Select all that apply.)
a Psychology b Biology c Sociology d Statistics 4 Which of the following courses would satisfy the requirement of two additional
400 level courses? a PSYC483 if you have already taken PSYC465 b PSYC460 if you have already taken PSYC463 c PSYC497 d None of these 5 Tom is an undergraduate student. He has already taken PSYC181, PSYC350, PSYC263,
PSYC373, PSYC380, PSYC287, BIOS462, PSYC485 and PSYC483. In order to complete the requirements for the Psychology major, which of the following courses does Tom still need to take?
a PSYC288 b PSYC467 c PSYC360 d None of these 6 What is the minimum number of Psychology courses a student must take to satisfy the
requirements for a major in psychology? a Eight courses b Nine courses c Ten courses d None of these
We further grouped the tasks into three Bloom categories (knowledge, comprehension, and analysis). The main goal was to understand the effect of the measures at greater resolution. Questions 1 and 2 are knowledge level tasks; Questions 5 and 6 are comprehension tasks; Questions 3 and 4 are analysis tasks.
3.4.2 Survey questionnaire
We developed a survey instrument consisting of ten questions to measure the satisfaction component of usability. The participants were asked to respond using a seven-point Likert scale (1 = strongly agree to 7 = strongly disagree). We grouped the questions into four sub categories to derive deeper understanding of satisfaction; the four categories are enumerated as: ease of use, likeability, structure and overall experience.
• Ease of use: Ease of use is a measure of web usability. We use three questions to asses this component. The mean response to the questions is used to measure this component. The questions used to derive this are: 1 I can easily find the requirements for the major in psychology. 2 The tasks I was asked to do were easy to complete. 3 The page is easy to understand.
Effect of font size, italics, and colour count on web usability 169
• Likeability: Likeability measures how much the users like the web page. This is important to know because it is a yardstick to know the impression the user is going to have about the web page. We used two questions to assess likeability. Participants responded on a seven-point Likert scale. The questions used to derive likeability are: 1 The page is visually appealing. 2 I liked using this page.
The next two sub categories are two of the six criteria mentioned in the Webby awards judging criteria used to rank a web page.
• Structure: Structure refers to the framework of the page and the organisation of the content. We used two questions to assess structure. Participants responded on a seven-point Likert scale. The questions used to derive structure are: 1 There is nothing distracting in the content of the web page. 2 The information in this page is organised well.
• Overall experience: Overall experience covers all the other five categories of the Webby awards judging criteria as a whole and also includes other subtle experiences that make one stay on, or leave, a web page. Three questions assessed overall experience. The questions are: 1 I would recommend this page to other psychology majors. 2 I will come back to this page when I need information about requirement for the
major in psychology. 3 I would bookmark this page.
3.5 Procedure
The experimental procedure consisted of viewing a web page by a subject followed by providing some responses. Each user was given one of the nine web pages designed for this study. In the beginning of the actual experiment, the subjects were told about the three different web pages (instructions page, content page, and the questions page) displayed on the computer screen.
The content page was displayed on a computer screen such that the whole page was visible without any scrolling. Next, the subject was asked to read the content page and then perform a set of tasks based on the contents of the page. The page was available until the user had finished completing the tasks and answered all questions on the survey. The tasks were assigned one at a time. They were also given the freedom to move back and forth between the web pages while they answered the questions. There was no time limit to answer the questions; the subjects could take their own time to complete. On an average, a student took 10 to 15 minutes to complete all the tasks. A total of 180 subjects participated in the experiment. All the participants were students taking courses in psychology at the University of Nebraska.
3.6 Data collection
We developed a software tool to collect student responses for our experiment, using asp.net, C# and SQL Server 2005. The tool consists of

170 S.K. Bhatia et al.
a a user interface
b an application logic module
c a database.
The user interface shows the tasks and survey questionnaire to the subject at the client side browser. The application logic module handles the calculation of response time for the tasks using the time stamps for the response and page load events. The database stores the subject responses for the tasks and questionnaire at the server. For each task, we keep the actual responses as well as the time taken to complete the tasks. For the survey questions we only keep the responses.
3.7 Analysis plan
As described before, we have a total of nine student groups based on the nine web pages derived for different values for the web factors. Our goal is to determine if there is any difference in the performance among the participants who use different web pages. We use three measures to determine the performance of the page: effectiveness, efficiency and satisfaction.
• Effectiveness: The goal here was to determine which page(s) had the highest effectiveness. To determine this, we compared the performance of the subjects using pairs of web pages with different values of the same web factor. In addition, we compared the effectiveness for tasks at different levels of Bloom’s taxonomy. Performance of a subject was determined by the number of correctly answered tasks. For each pair of values for a given web factor, we have two sets of scores from subjects, one for each value of the factor (e.g., one for nine-point font and one for 12-point). Using a standard chi-square test, we determine the χ2 value, degrees of freedom, and the p-value. If the computed p-value was < 0.05, the results were deemed significant.
• Efficiency: The goal here was to determine which type of page(s) had the highest efficiency. We determine this by comparing the response time of the subjects using pairs of web pages with different values of the same web factor. In addition, we compared the efficiency for tasks at different levels of Bloom’s taxonomy. For each pair of values for a given web factor, we have two sets of response time from subjects, one for each value of the factor (e.g., one for no italics and one for high italics). Given the significance level, the degree of freedom, and the t-value, we can conclude if the difference between the means for the two groups is significant.
• Satisfaction: The goal here was to determine the subjects’ view of which page(s) provided the highest satisfaction. To determine this, we compared the performance of the subjects using pairs of web pages with different values of the same web factor. Satisfaction of a subject was determined by the higher rating for the questionnaire. As in efficiency, the t-test was used to determine the page(s) with highest satisfaction ratings.

Effect of font size, italics, and colour count on web usability 171
4 Results and analysis
In this section, we present the results of our experiments to determine the impact of the three factors on the three dimensions of web usability: effectiveness, efficiency, and satisfaction. The effect of font size, italics, and colour count on effectiveness is described in Section 4.1. Using statistical analysis, we have analysed the performance of participants on knowledge, analysis, and comprehension tasks. Section 4.2 discusses the results of the effect of web factors on efficiency. The response time to complete the tasks is used for this purpose. Section 4.3 presents the results for satisfaction using the response to the survey questions. We summarise all our results and provide a discussion in Section 4.4. It should be noted that Task 4 was phrased ambiguously for the subjects and hence, is not considered for any analysis.
4.1 Effectiveness
Table 3 summarises the results of the chi-square test on the subjects’ performance on the tasks (Section 3.7) for web pages with differing values of font size, italics, and colour count. The table shows the web factors and the corresponding hypotheses for different task categories. The ‘overall’ column shows the significance of all categories put together. The table indicates the chi-square values of each task category for each hypothesis and whether the values are statistically significant (shown with ‘**’) or not. A statistically significant chi-square value implies that the performance of the students vary with the variation of page type. Table 3 Summary of χ2 test on effectiveness
Factors Hypothesis Effectiveness
Knowledge Analysis Comprehension Overall Font size
pf(12 pt) > pf(9 pt) 1.333 0.784 1.074 4.182 pf(12 pt) > pf(14 pt) 0.784 0.784 0.639 2.540 pf(14 pt) > pf(9 pt) 2.918 0.00 1.865 4.476
Italics pf(moderate italics) > pf(no italics)
1.711 4.021** 0.068 4.001
pf(moderate italics) > pf(high italics)
0.011 8.105** 0.774 3.493
pf(no italics) > pf(high italics) 1.476 1.328 1.199 4.788 Colour count
pf(four colour count) > pf(one colour count)
0.360 0.533 0.210 1.210
pf(four colour count) > pf(six colour count)
0.229 2.849 0.420 2.536
pf(one colour count) > pf(six colour count)
1.111 0.960 0.486 1.727
Note: **Significant at p = 0.05
Table 4 gives a summary of task analysis of the different page types grouped by Bloom categories. The table shows the number of subjects who were exposed to different page types and the number of questions they answered correctly in each category.

172 S.K. Bhatia et al.
Table 4 Statistics of number of students who answered the tasks accurately
Num
ber o
f sub
ject
s with
cor
rect
ans
wer
s
Bloo
m ty
pe
Kno
wle
dge
Anal
ysis
C
ompr
ehen
sion
K
now
ledg
e Pa
ge ty
pe
Fact
ors
Valu
es o
f fac
tors
N
umbe
r of s
ubje
cts
Task
1
Task
2
Ta
sk 3
Task
5
Ta
sk 6
1 Fo
nt si
ze
9 20
19
18
4
12
14
2
12
20
20
18
2
10
13
3
14
20
20
16
4
10
10
4
Italic
s N
one
21
20
19
4
9
13
5
M
oder
ate
19
19
13
0
10
10
6
Hig
h 20
20
14
7
11
13
7
Col
our c
ount
1
20
20
19
6
14
11
8
4 20
20
18
4
10
13
9
6
20
20
17
9
12
11
Tota
l
180
17
8 15
2
40
98
108

Effect of font size, italics, and colour count on web usability 173
The table shows that each page type was shown to around 20 subjects. We can see that the number of students who performed the tasks correctly was directly proportional to the complexity of the tasks (the order of complexity being knowledge, comprehension, and analysis). Of the 180 students who participated in the study, 152 students (84%) answered knowledge tasks correctly, 98 students (54%) answered comprehension tasks correctly, and 40 students (22%) answered analysis task correctly.
• Font size: Table 3 shows that the font size for a web page has no statistically significant effect on the subjects’ performance of knowledge, comprehension, and analysis tasks for a web page.
• Italics: Table 3 shows that italics has no effect on the subjects’ performance of knowledge and comprehension tasks. However, there is a significant effect on the subjects’ performance of the analysis tasks. Students viewing pages with no italics performed better than those viewing pages with moderate italics. In addition, students viewing pages with high italics (web page with a few complete sentences italicised) performed better than the students viewing pages with moderate italics.
• Colour count: Table 3 shows that colour count has no effect on the performance of the subjects for knowledge, comprehension, and analysis type tasks.
4.2 Efficiency
The efficiency of a page is measured by the time taken by the users to perform the tasks. We used the t-test to compare the performance of users for different treatments. Table 5 summarises the results for web pages with differing values of font size, italics, and colour count. The table shows the web factors, the corresponding hypotheses, and the t values for the task categories. A statistically significant t value implies that the response times of the subject groups vary with the variation of page type. Table 5 Summary of t-test for efficiency
Variables Hypothesis Efficiency
Knowledge Analysis Comprehension
Font size pf(12 pt) > pf(9 pt) –0.643 –0.841 0.419 0.281 0.530 pf(12 pt) > pf(14 pt) 0.189 0.038 –0.277 0.115 –1.477 pf(14 pt) > pf(9 pt) –0.394 –0.843 0.099 0.506 –0.588
Italics pf(moderate italics) > pf(no italics) 0.833 0.835 0.525 –0.010 1.809 pf(moderate italics) > pf(high italics) –0.901 –1.057 –0.782 0.092 –1.248
pf(no italics) > pf(high italics) 0.012 –0.315 –0.152 0.088 0.540 Colour count
pf(four colour count) > pf(one colour count)
–0.021 0.461 1.415 0.036 –1.370
pf(four colour count) > pf(six colour count)
1.314 –0.608 –1.014 –0.511 –0.003
pf(one colour count) > pf(six colour count)
1.109 –0.390 0.400 –0.519 –1.578
Note: **Significant at p = 0.05
174 S.K. Bhatia et al.
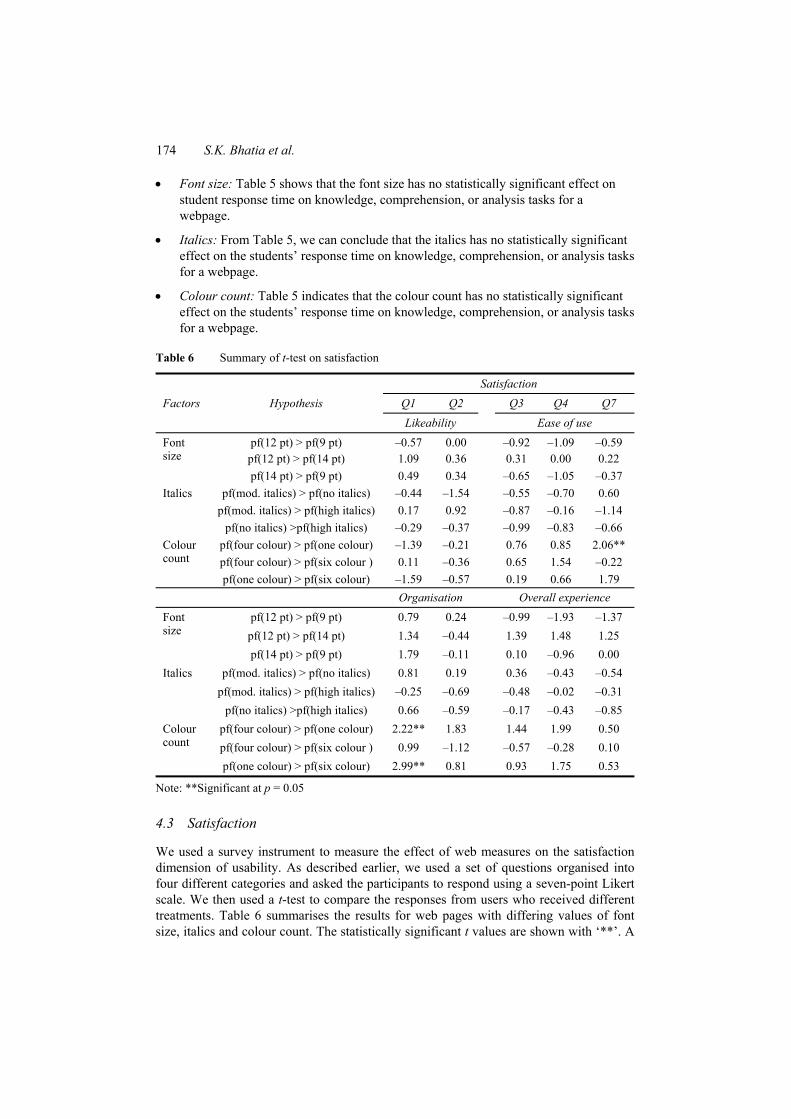
• Font size: Table 5 shows that the font size has no statistically significant effect on student response time on knowledge, comprehension, or analysis tasks for a webpage.
• Italics: From Table 5, we can conclude that the italics has no statistically significant effect on the students’ response time on knowledge, comprehension, or analysis tasks for a webpage.
• Colour count: Table 5 indicates that the colour count has no statistically significant effect on the students’ response time on knowledge, comprehension, or analysis tasks for a webpage.
Table 6 Summary of t-test on satisfaction
Factors Hypothesis Satisfaction
Q1 Q2 Q3 Q4 Q7 Likeability Ease of use
Font size
pf(12 pt) > pf(9 pt) –0.57 0.00 –0.92 –1.09 –0.59 pf(12 pt) > pf(14 pt) 1.09 0.36 0.31 0.00 0.22 pf(14 pt) > pf(9 pt) 0.49 0.34 –0.65 –1.05 –0.37
Italics pf(mod. italics) > pf(no italics) –0.44 –1.54 –0.55 –0.70 0.60 pf(mod. italics) > pf(high italics) 0.17 0.92 –0.87 –0.16 –1.14
pf(no italics) >pf(high italics) –0.29 –0.37 –0.99 –0.83 –0.66 Colour count
pf(four colour) > pf(one colour) –1.39 –0.21 0.76 0.85 2.06** pf(four colour) > pf(six colour ) 0.11 –0.36 0.65 1.54 –0.22 pf(one colour) > pf(six colour) –1.59 –0.57 0.19 0.66 1.79
Organisation Overall experience
Font size
pf(12 pt) > pf(9 pt) 0.79 0.24 –0.99 –1.93 –1.37 pf(12 pt) > pf(14 pt) 1.34 –0.44 1.39 1.48 1.25 pf(14 pt) > pf(9 pt) 1.79 –0.11 0.10 –0.96 0.00
Italics pf(mod. italics) > pf(no italics) 0.81 0.19 0.36 –0.43 –0.54 pf(mod. italics) > pf(high italics) –0.25 –0.69 –0.48 –0.02 –0.31
pf(no italics) >pf(high italics) 0.66 –0.59 –0.17 –0.43 –0.85 Colour count
pf(four colour) > pf(one colour) 2.22** 1.83 1.44 1.99 0.50 pf(four colour) > pf(six colour ) 0.99 –1.12 –0.57 –0.28 0.10 pf(one colour) > pf(six colour) 2.99** 0.81 0.93 1.75 0.53
Note: **Significant at p = 0.05
4.3 Satisfaction
We used a survey instrument to measure the effect of web measures on the satisfaction dimension of usability. As described earlier, we used a set of questions organised into four different categories and asked the participants to respond using a seven-point Likert scale. We then used a t-test to compare the responses from users who received different treatments. Table 6 summarises the results for web pages with differing values of font size, italics and colour count. The statistically significant t values are shown with ‘**’. A

Effect of font size, italics, and colour count on web usability 175
significant t value indicates that there is a difference between the satisfaction levels of the subject groups.
• Font size: Table 6 shows that the font size has no statistically significant effect on the subjects’ rating of likeability, ease of use, organisation, and overall experience for a web page.
• Italics: Table 6 shows that the amount of italics in a web page has no statistically significant effect on the subjects’ web page rating of likeability, ease of use, organisation, and overall experience.
• Colour count: Table 6 shows that the colour count has no statistically significant effect on the subjects’ rating of likeability and overall experience for a web page. However, colour count has significant effect on the subjects’ rating of ease of use and organisation for a web page. Furthermore, students viewing pages with one colour rated the page higher in terms of organisation than students viewing the page with six colours.
4.4 Summary
Table 7 shows the relation between the web factors and the web usability dimensions. A significant effect of the web factor on the dimension, indicated with a ‘√‘ and ‘ב, shows that there is no significant effect. Table 7 Summary of results showing the effect of the web factors on web usability dimensions
Factors Web usability dimension
Effectiveness Efficiency Satisfaction
Font size × × × Italics √ (a) × × Colour count × × √ (o)(e)
Notes: √: significant, ×: not significant, (a) analysis tasks, (o) organisation, (e) ease of use
Table 7 shows that there is no statistically significant effect of font size on any of the three dimensions of usability: effectiveness, efficiency, and satisfaction. The results obtained in this study were in contrast to the results of some previous studies. The previous studies had indicated that the 12-point font is the best for web pages. Bernard et al. (2002) studied the comparison of font sizes 10, 12, and 14 by examining their differences in reading time, font attractiveness, and general preference. They found that the text with 12-point font was read faster than the text with ten-point font. Ivory et al. investigated the effect of fonts and found that a font size greater than nine-point was preferred (Ivory et al., 2001). Table 4 shows that the number of correct answers given by participants viewing nine-point font was greater compared to the number of participants viewing 12-point and 14-point fonts. This means that the nine-point font may have significance in terms of readability, even though this result is not statistically significant. A detailed analysis that produces more correct answers for analysis tasks could bring out this effect. Table 6 shows that the t value (1.929) for nine-point font and 12-point font for overall experience (Q9) is marginally significant (p = 0.06 > 0.05). Participants viewing 12-point font (mean = 6.45) may have had a better experience compared to the

176 S.K. Bhatia et al.
participants viewing nine-point font (mean = 5.60), even though this result is not statistically significant.
There is no statistically significant effect of italics on efficiency and satisfaction; however there is a significant effect of italics on effectiveness. For simple tasks, subjects have to spend less time while for a complex task, subjects need to spend comparatively more time. Students viewing moderate italics performed worse for complex tasks compared to students viewing both no italics and high italics. Subjects’ performance was better when the page was not italicised and when the page was highly italicised (a few complete sentences italicised) but the subject did not perform well when the page was moderately italicised. This result did not match with the previous work (Flanders and Willis, 1998). According to Flanders and Willis, a page with only a few words italicised is the ideal way of italicising. However, our results matched with the guideline given by Ivory that states that good web pages rarely use italics (Ivory, 2001). As noted earlier, some authors italicised the whole page for their analysis. In this research, the high italics page has about 37% of the characters italicised and moderate italics page has only 11% of characters italicised.
There is no statistically significant effect of colour count on effectiveness and efficiency; however there is a significant effect of colour count on satisfaction. We found that the students viewing the web pages with only one colour found the web page easy to use and more organised compared to the one with more colours. Table 6 shows that the t-value (1.999) for colour count 1 and 4 for overall experience (Q9) is marginally significant (p = 0.053 > 0.05). Participants viewing the page with colour count of 1 (mean of 6.10) had a better experience compared to the participants viewing the page with colour count of 4 (mean of 5.40), even though this result is not statistically significant. Subjects’ satisfaction was affected by the usage of colours, specifically for ease of use and organisation of the web page. Subjects were more satisfied when the page had only one colour compared to the pages with four or six colours. This matched with previous work (Flanders and Willis, 1998; Ivory et al., 2001) that proposed the minimisation of number of colours.
Overall, we found that the subjects performed better with web pages with no italics or high italics. We also identified that the students who viewed web pages with only one colour found them easy to use and more organised.
5 Summary and future work
In this research, we have studied the effect of three factors (font size, italics, and colour count) on the three dimensions of web usability (effectiveness, efficiency, and satisfaction) for simple and complex tasks. A set of young adults were shown web pages with different values of web factors. We developed a set of tasks to determine the effectiveness and efficiency of those web pages, while a survey instrument was used to measure satisfaction. Using statistical analysis, we computed the effect of the factors (font size, italics, and colour count) on effectiveness, efficiency, and satisfaction. Our research showed that for the population of subjects used in this study (young adults), the font size had no statistically significant effect on the performance, efficiency, and satisfaction. However, there was statistically significant effect due to the use of italics on the subjects’ performance. Still, there was no statistically significant effect of italics on the subjects’ efficiency and satisfaction. There was also a statistically significant effect of

Effect of font size, italics, and colour count on web usability 177
colour count on satisfaction but there was no statistically significant effect of colour count on the subjects’ performance and efficiency.
5.1 Future work
The work done in this study can be extended in many directions. Additional web factors are listed in the literature, including text element measures (e.g., content percentage, navigation, and information quality), link element measures (e.g., text links, link graphics, and redundant links), graphic element measures (e.g., graphical ads, graphical links, and animation), page formatting measures (e.g., colour combinations, interactive elements, and layout quality), and page performance measures (e.g., page bytes and download speed). The effect of these measures on the performance of users can be studied to provide additional insights.
In this study, we used only undergraduate students who are currently enrolled in the psychology courses. The students are mostly young adults and hence, as a group our sample population is not representative of the general population. A more general study can be undertaken to determine the effect of the measures for other age groups and for all users. We did the experiment using only a content page. We can extend it for other kinds of pages like home, link, form, and other pages.
Using this research, one can develop an index that specifies the goodness of a page. This can then be integrated into a search engine. In this study, we used only a page with a small amount of content (315 words). This study can also be extended to pages with greater content.
References
Agarwal, R. and Venkatesh, V. (2002) ‘Assessing a firm’s web presence: a heuristic evaluation procedure for the measurement of usability’, Information Systems Research, June 2002, Vol. 13, No. 2, pp.168–186.
Anderson, L.W. and Sosniak, L.A. (Eds.) (1994) ‘Bloom’s taxonomy of educational objectives: a forty year retrospective’, National Society for the Study of Education Yearbooks, Chicago.
Badre, A.N. (2002) Shaping Web Usability: Interaction Design in Context, Addison Wesley, Reading, MA.
Barnum, C.M. and Dragga, S. (2001) Usability Testing and Research, Allyn and Bacon, Needham Heights, MA.
Bernard, M. and Mills, M. (2000) ‘So, what size and type of font should I use on my web site?’, Usability News, July 2000, Vol. 2, No. 2, Online journal.
Bernard, M., Liao, C. and Mills, M. (2001a) ‘Determining the best online font for older adults’, Usability News, January 2001, Vol. 3, No. 1, Online journal.
Bernard, M., Liao, C.H. and Mills, M. (2001b) ‘The effects of font type and size on the legibility and reading time of online text by older adults’, CHI ‘01 Extended Abstracts on Human Factors in Computing Systems, Seattle WA, pp.175–176.
Bernard, M., Lida, B., Riley, S., Hackler, T. and Janzen, K. (2002) ‘A comparison of popular online fonts: which size and type is best?’, Usability News, January, Vol. 4, No. 1, Online journal.
Bias, R.G. (1994) ‘The pluralistic usability walkthrough: coordinated empathies’, in Nielsen, J. and Mack, R.L. (Eds.): Usability Inspection Methods, pp.63–76, John Wiley, New York, NY.

178 S.K. Bhatia et al.
BizReport (2007) E-commerce: Euro Surfers Spend Time & Money Online, available at http://www.bizreport.com/2007/01/euro_surfers_spend_time_money_online.htm (accessed on 09 June 2011).
Boyarski, D., Neuwirth, C., Forlizzi, J. and Regli, S.H. (1998) ‘A study of fonts designed for screen display’, Proceedings of the SIGCHI Conference of Human Factors in Computing Systems, April, Los Angeles, CA, pp.87–94.
Brady, L. and Phillips, C. (2003) ‘Aesthetics and usability: a look at color and balance’, Usability News, February, Vol. 5, No. 1.
Brinck, T., Gergle, D. and Wood, S.D. (2001) Usability for the Web: Designing Web Sites that Work (Interactive Technologies), Morgan Kaufmann, San Francisco, CA.
Donahue, G.M., Weinschenk, S. and Nowicki, J. (1999) Usability is good business. Compuware Corporation Report.
Flanders, V. and Willis, M. (1998) Web Pages That Suck: Learn Good Design by Looking at Bad Design, SYBEX, Alameda, CA.
Hammond, N., Gardiner, M.M. and Christie, B. (1987) ‘The role of cognitive psychology in user-interface design’, Applying Cognitive Psychology to User-Interface Design, pp.13–52, John Wiley, New York, NY.
Hill, A.L. and Scharff, L.V. (1997) ‘Readability of screen displays with various foreground/background color combinations, font styles, and font types’, Proceedings of the Eleventh National Conference on Undergraduate Research, Vol. 2, pp.742–746.
Honold, P. (2000) ‘Culture and context: an empirical study for the development of a framework for the elicitation of cultural influence in product usage’, International Journal of Human-Computer Interaction, Vol. 12, No. 3–4, pp.327–345.
International Standards Organization (ISO) (1999) ISO 9241: Ergonomic Requirements for Office Work with Video Display Terminals.
Internet World Stats (2009) Usage and Population Statistics, available at http://www.internetworldstats.com/stats.htm (accessed on 15 May 2009).
Ivory, M.Y. (2001) An Empirical Foundation for Automated Web Interface Evaluation, PhD thesis, University of California, Berkeley, CA.
Ivory, M.Y. and Hearst, M.A. (2002) ‘Improving web design’, IEEE Internet Computing, Vol. 6, No. 2, pp.56–63.
Ivory, Y.M., Sinha, R.R. and Hearst, M.A. (2001) ‘Empirically validated web page design metrics’, Proceedings of the SIGCHI Conference on Human Factors in Computing Systems, Seattle, WA, pp.53–60.
Kantner, L. and Rosenbaum, S. (1997) ‘Usability studies of WWW sites: heuristic evaluation vs. laboratory testing’, Proceedings of the 15th Annual International Conference on Computer Documentation, Salt Lake City, UT, pp.153–160.
Karat, C-M., Campbell, R. and Fiegel, T. (1992) ‘Comparison of empirical testing and walkthrough methods in user interface evaluation’, Proceedings of the SIGCHI Conference on Human Factors in Computing Systems, Monterey, CA, pp.397–404.
Lecerof, A. and Paterno, F. (1998) ‘Automatic support for usability evaluation’, IEEE Transactions on Software Engineering, Vol. 24, No. 10, pp.863–888.
Murray, G. and Costanzo, T. (1999) ‘Usability and the web: an overview’, Network Notes, 61, National Library of Canada, available at http://epe.lac-bac.gc.ca/100/202/301/netnotes/netnotes-h/notes61.htm (accessed on 22 May 2009).
Nielsen, J. (1993) Usability Engineering, Morgan Kaufmann, San Francisco, CA. Nielsen, J. (1994) ‘Enhancing the explanatory power of usability heuristics’, Proceedings of the
SIGCHI Conference on Human Factors in Computing Systems: Celebrating Independence, Boston, MA, pp.152–158.
Nielsen, J. (1994a) ‘Heuristic evaluation’, in Nielsen, J. and Mack, R.L. (Eds.): Usability Inspection Methods, pp.25–62, John Wiley & Sons, New York, NY.
Effect of font size, italics, and colour count on web usability 179
Nielsen, J. (1996) ‘Usability metrics: tracking interface improvements’, IEEE Software, Vol. 13, No. 6, pp.12–13.
Nielsen, J. (1999) Designing Web Usability: The Practice of Simplicity, New Riders Publishing, Thousand Oaks, CA.
Nielsen, J. and Phillips, V.L. (1993) ‘Estimating the relative usability of two interfaces: heuristic, formal and empirical methods compared’, Proceedings of the INTERACT ‘93 and CHI ‘93 Conference on Human Factors in Computing Systems, Amsterdam, The Netherlands, pp.214–221.
Palmer, J.W. (2000) ‘Web site usability, design, and performance metrics’, Information Systems Research, Vol. 13, No. 2. pp.151–167.
Powell, J.E. (1990) Designing User Interfaces, Microtrend Books, San Marcos, CA. Resnick, M.L. and Fares, C. (2004) ‘Visualizations to facilitate online tabular presentation of
product data’, Proceedings of the Human Factors and Ergonomics Society Annual Meeting. Rosenbaum, S. (2000) ‘Not just a hammer: when and how to employ multiple methods in usability
programs’, Proceedings of UPA. Rubin, J. and Chisnell, D. (2008) Handbook of Usability Testing: How to Plan, Design and
Conduct Effective Tests, 2nd ed., John Wiley. Schriver, K.A. (1997) Dynamics in Document Design: Creating Text for Readers, John Wiley &
Sons, New York, NY. Schneiderman, B. (2000) ‘Designing trust into online experiences’, Communications of the ACM,
Vol. 43, No. 12, pp.57–59. Webby Awards (2009) Judging Criteria, available at
http://www.webbyawards.com/entries/criteria.php (accessed on May 2009).