sandra sequeira, johannes spinnewijn, guo xu rewarding ...eprints.lse.ac.uk/68279/1/sequeira et...
TRANSCRIPT

Sandra Sequeira, Johannes Spinnewijn, Guo Xu Rewarding schooling success and perceived returns to education: evidence from India Article (Accepted version) (Refereed)
Original citation: Sequeira, Sandra, Spinnewijn, Johannes and Xu, Guo (2016) Rewarding schooling success and perceived returns to education: evidence from India. Journal of Economic Behavior & Organization, 131 . pp. 373-392. ISSN 0167-2681 DOI: 10.1016/j.jebo.2016.08.015 Reuse of this item is permitted through licensing under the Creative Commons: © 2016 Elsevier CC BY-NC-ND This version available at: http://eprints.lse.ac.uk/68279/ Available in LSE Research Online: November 2016 LSE has developed LSE Research Online so that users may access research output of the School. Copyright © and Moral Rights for the papers on this site are retained by the individual authors and/or other copyright owners. You may freely distribute the URL (http://eprints.lse.ac.uk) of the LSE Research Online website.

Rewarding Schooling Success and PerceivedReturns to Education: Evidence from India∗
Sandra Sequeira†, Johannes Spinnewijn‡and Guo Xu§
July 25, 2016
Abstract
This paper tests two specific mechanisms through which individuals canform expectations about returns to investments in education: recognition forschooling performance, and exposure to successful students through family orsocial networks. Using a regression discontinuity design, we study the impactof two fellowship programs recognizing educational performance in secondaryschools in India. We find that the fellowship award is associated with a sig-nificant increase in the perceived value of education, by both increasing theperceived mean of earnings (0.74 standard deviations (SD)) and decreasing theperceived variance in earnings (1.03 SD) associated with additional years ofschooling. The effects spill over only selectively to social and family networks.Peers exposed to successful students do not update their beliefs but parentsof fellows report higher perceived returns to education. Peers of fellows arehowever more informed about fellowship opportunities and report a higher in-tention to apply for the fellowship, thus contributing to the persistence of thepotential impact of the fellowship across different cohorts.
Keywords: Returns to Education, Subjective Expectations, Peer EffectsJEL codes: D84; I25; J24
∗We are very grateful for the hard work of the survey teams led by Roshan Gupta, SiddharthaGupta, Enkhtur Maini, Brajesh Pandey, VS Sridhar and the support of Shama Afroz, SourabhChakraborty, Udita Das, Reshma Dixit, Mohd. Faheem, Baby Nayak, Preeti Pundir and PankajSharma. We also thank David Atkin, Oriana Bandiera, Pedro Bordalo, Gharad Bryan and EstherDuflo for very thoughtful comments. All errors remain our own.†London School of Economics, Department of International Development and STICERD,
Houghton Street London WC2A 2AE, United Kingdom. (e-mail: [email protected])‡London School of Economics, Department of Economics and STICERD, Houghton Street, Lon-
don WC2A 2AE, United Kingdom (e-mail: [email protected])§London School of Economics, Department of Economics and STICERD, Houghton Street, Lon-
don WC2A 2AE, United Kingdom (e-mail: [email protected])
1

1 Introduction
Investments in human capital have long been considered a fundamental part of any
sustainable process of economic development and growth (Barro, 1998; Romer, 1989;
Mincer, 1974). And yet, despite growing evidence of both the importance of educa-
tion in the formation of human capital and of high individual returns to schooling
(Attanasio and Kaufmann, 2010; Jensen, 2010; Carneiro et al., 2011), demand for
education has remained persistently low, particularly among low-income groups in
the developing world (Banerjee and Duflo, 2011).
Becker’s canonical model (Becker, 1962) of investment in human capital theorizes
that demand for education is driven by students’ and parents’ perception of educa-
tion as an investment in future income earning capacity: families weight the cost of
an additional year of schooling against the perceived benefits accrued by the house-
hold in terms of future income. While a growing empirical literature has confirmed
the impact of perceived returns to education on schooling decisions (Dominitz and
Manski, 1996; Padula and Pistaferri, 2001; Belzil and Hansen, 2002; Nguyen, 2008;
Attanasio and Kaufmann, 2009; Jensen, 2010; Attanasio and Kaufmann, 2010), it is
also well documented that returns to education are perceived to be low in developing
economies (Attanasio and Kaufmann, 2009; Jensen, 2010; Attanasio and Kaufmann,
2010), which could drive down demand for education. The mechanisms through which
low perceived returns to education are formed remain, however, poorly understood.
Yet, understanding these mechanisms is critical for the design of policies that effec-
tively (and sustainably) increase demand for education in the developing world.
In contrast to the recent literature exploring the impact of providing more accurate
information about real returns to education on schooling decisions, this paper ex-
amines how perceived returns to education can be endogenously formed in the first
place. First, we investigate how being recognized for schooling success affects an indi-
2

vidual’s perception of future returns to additional years of schooling, where success is
evidenced by receiving a fellowship award for academic performance. We then inves-
tigate whether exposure to the educational success of others affects one’s perceptions
of returns to education. We do so by looking at whether changes in perceived re-
turns to education of those rewarded for their schooling performance spill over into
their family and social networks. While there is a growing literature documenting the
importance of peer effects in schooling behavior in general (Sacerdote, 2001; Kremer
and Levy, 2008; Epple and Romano, 2011), the role of peer effects in the formation
of perceptions about the value of education remains unexplored.
To analyze the link between rewards for educational performance and perceptions, we
measure the impact of two comparable fellowship programs rewarding high performing
students in secondary school in India on perceptions of future wages associated with
the completion of different levels of schooling. We first designed a survey to examine
the impact of recognition for schooling performance on fellows and on those in their
networks. We then implemented an extended survey in a different region to validate
our main findings and further explore potential mechanisms.
In both settings, we adopt a fuzzy regression discontinuity design to identify a causal
relationship between the fellowship award and perceived returns to education. Both
fellowships are awarded to students pursuing secondary education in India based on
a continuous score that measures each student’s academic performance. The final
score is based on both written tests and interview performance, and is not observed
by the applicants. We exploit a discontinuity in the probability of being awarded the
fellowship around a cutoff score defined by the pre-determined budget of the fellowship
program. We take advantage of this same cutoff to identify family and social networks
that are exogenously exposed to students who either just made the award criteria or
came very close to meeting it. Since exposure is randomly assigned to a set of peers
3

that pre-date the fellowship, it is unrelated to other factors that drive perceptions
about the value of education. This enables us to overcome problems of reflection and
correlated unobservables that constrain the identification of peer effects.
We present three main findings. First, we show that recognizing students for school-
ing performance has a significant impact on their perceived returns to investing in
additional years of schooling: fellowship recipients perceive that completing higher
education relative to lower secondary school can increase monthly entry salaries by
an additional 1,369 Rs ($231 or 0.74 standard deviations (SD)) in the first five years
after graduation. This leads the recipients to have more accurate perceptions of
returns to higher education when measured against actual entry-level wages in the
marketplace.
Second, fellowship recipients also expect a stronger decrease in the salary variance as-
sociated with completing higher levels of education. Recognition for schooling perfor-
mance lowers the perceived standard deviation of the expected monthly entry salary
upon completion of higher education by 1,163 Rs ($20 or 1.03 SD). Taken together,
these two findings show that those rewarded for their schooling performance perceive
education as an investment with higher return and lower risk relative to those who
achieved similar levels of academic performance but were not rewarded for it.
Third, exposure to successful students recognized for their efforts does not affect the
perceived returns to education of friends, neighbors and siblings. We do, however,
find that these peers in the network of successful students are 9.2% points more likely
to know about sources of funding for secondary education (mean: 27%) and 12.8%
points more likely to consider applying for the fellowship itself (mean: 48.7%).
All our main results are confirmed for the fellowship program implemented in a second
region in India, which supports both the external validity and the generalizability
1To facilitate this comparison, we also express the monetary values in US dollar terms ($) usingthe exchange rate of $1 ≈ 60 Rs
4

of our findings. The point estimates on the impact of the fellowship on fellows’
average expectations are nearly identical for both studies, with an estimated increase
in perceived returns of 1,690 Rs ($28.2) compared to 1,369 Rs ($23).
In this second study, we extended our survey to explore some of the particular mech-
anisms underlying our main results. In theory, recognition for educational success
can directly shape expectations about future earnings through different mechanisms.
In uncertain environments, recognition for educational success can, among others,
allow an individual to extract a signal about her own skills, or it may change the in-
dividual’s overall valuation of education by strengthening the perceived link between
schooling effort and rewards. We provide evidence that is consistent with the second
mechanism. Fellowship recipients are more likely to encourage their peers to apply
for the fellowship and they report higher perceived returns to education not only for
themselves, but also for others in their cohort.
The second study confirms the selective transmission of information across networks.
While perceptions about returns to education do not spill over to peers, we find that
parents of successful fellows perceive higher expected earnings for additional years of
schooling (with a point estimate of 1,162 Rs or $19.4, which is of similar magnitude
to that of fellows) and report a higher valuation of education for all of their offspring.
Taken together, our results suggest that uptake of the fellowship program is more
likely to occur if a peer or a sibling has been recognized for her schooling efforts. The
mechanism appears to be driven by changes in parental beliefs about the value of
education and the transmission of information to peers on how to apply to different
fellowship opportunities. These spillover effects then have important implications for
the persistence of the impact of the fellowship award program across cohorts.
Our results lend support to studies showing that low-income groups in the developing
world underestimate returns to education (Attanasio and Kaufmann, 2010; Kauf-
5

mann, 2008; Nguyen, 2008; Jensen, 2010), that information leads students to update
beliefs about returns to education (Jensen, 2010; Nguyen, 2008; Wiswall and Zafar,
2011; Zafar, 2011) and that perceptions of risk are important determinants of school-
ing choices (Kodde, 1986; Altonji, 1993; Padula and Pistaferri, 2001). It directly
adds to this literature by examining the mechanisms through which perceived re-
turns to education are formed in the first place. In particular, it tests the importance
of recognizing schooling effort on beliefs about returns to education.2 This link be-
tween recognition (or lack thereof) and expectations can reinforce potentially unequal
investments in education and, consequently, schooling outcomes across time.
Our findings also contribute to a growing literature that identifies the determinants
of subjective expectations in the developing world in a variety of contexts. Attanasio
et al. (2005) investigate the determinants of subjective expectations of household
income in Colombia; Delavande and Kohler (2009) of risk perceptions of HIV/AIDS;
Gine et al. (2008) of farmers’ expectations regarding the timing of the onset of the
monsoon; and McKenzie et al. (2007) of decisions to migrate. Finally, it contributes
to the literature on the importance of peer effects for take up of social programs
(Duflo and Saez, 2003; Kremer and Miguel, 2007; Dahl et al., 2014).
The rest of the paper proceeds as follows: section 2 presents a conceptual framework
that will guide the empirical analysis; section 3 discusses the empirical setting and
the data used in the study; section 4 presents the analysis and discusses the impact of
rewards for performance on perceived returns to education, while section 5 presents
our findings on peer effects. We validate our main findings in a second study site
in Section 6. Section 7 explores the potential mechanisms through which rewards
for educational performance could affect perceived returns to education, section 8
discusses robustness checks and section 9 concludes.
2The closest paper to our approach is Jensen (2010), which suggests that residential segregationcan affect exposure to information that then shapes perceived returns to education.
6

2 Conceptual Framework
2.1 Perceived Returns to Education
In Becker’s seminal work on investments in human capital (Becker, 1962), education
represents an investment in future income earning capacity. Demand for education
can be low if the cost of this investment - both the direct costs of schooling or the
indirect costs of foregone income and professional experience - is high or if the returns
to it are perceived to be low (Manski, 1993).
In theory, more years of schooling increase the expected level of earnings, but may
also affect future income uncertainty (Levhari and Weiss, 1974; Olson et al., 1979;
Eaton and Rosen, 1980; Snow and Warren, 1990). To formalize how the returns
to education depend on its impact on future earnings, consider an individual i who
chooses how much to invest in schooling. The optimal years of schooling si maximizes
the individual’s expected lifetime utility accounting for the (opportunity) cost of
schooling,
U (si|λi, θ) = Σk>0βkE[u(yi,k)|si, λi, θ]− C (si) .
The individual’s distribution of future earnings yi,k, conditional on her education,
depends on the overall returns to education, captured by a general parameter θ, and
the individual’s earning capacity determined by his or her ability and other individual-
specific characteristics, captured by an individual-specific parameter λi. Individuals
form beliefs about both general and individual-specific characteristics, and how they
affect the distribution of future earnings. While we cannot observe the primitives
underlying an individual’s belief formation, in order to determine his or her perceived
return to additional schooling, it is sufficient to measure gains in perceived expected
utility across different levels of schooling. Assuming that the expected utility of
uncertain earnings can be well approximated with mean-variance preferences, the
7

expected lifetime utility simplifies to3
U (si|λi, θ) ∼= Σk>0βk {E[yi,k|si, λi, θ]− ηivar[yi,k|si, λi, θ]} − C (si) . (1)
The return to additional schooling thus depends on its impact on both the mean
and the variance of future earnings. In particular, an individual’s choice between
two degrees involving sH and sL schooling years will depend on E[yi,k|sH , λi, θ] −
E[yi,k|sL, λi, θ] and var[yi,k|sH , λi, θ] − var[yi,k|sL, λi, θ]. The difference in mean and
variance of future earnings related to different schooling choices are the two statistics
we will focus on in our empirical analysis.4
In low-income rural environments, perceptions of returns to education are likely to be
formed in contexts of great uncertainty and poor information. Students have limited
exposure to higher levels of education since parents may not have earned an education
themselves, and individuals who did tend to migrate to urban areas. Households also
have limited access to information on earnings and unemployment rates for different
schooling scenarios given that labor market data are seldom gathered and dissemi-
nated in any systematic way.5 Low income households are therefore more likely to
form erroneous beliefs about returns to education, which can then affect their school-
ing decisions (Attanasio and Kaufmann, 2009; Jensen, 2010).6 This may result in
3Note that the approximation is exact when earnings are normally distributed and the individualhas CARA preferences with 2ηi being the parameter of absolute risk aversion. Note also that the(opportunity) cost of schooling is likely to differ across individuals, but our empirical analysis shedsno light on this.
4Note that while equation (1) suggests that risk preferences (ηi) may play a role in determiningexpected lifetime utility, differences in risk preferences in our sample wash out in the regressiondiscontinuity analysis.
5Testing an argument propounded by Wilson (1987) and Jensen (2010) documents how residentialsegregation can reinforce exposure to different levels and types of information about returns toeducation due to important selection effects: those living in poor neighborhoods are likely to formerroneous perceptions about the value of education as they are exposed to others with low levels ofschooling and to those who, having received schooling, represent the tails of the distribution andhave performed poorly in the labor market. The reverse form of selection can occur in high incomeneighborhoods, reinforcing perceptions about the value of education.
6Jensen (2010) finds that a $24 increase in implied perceived returns to secondary educationincreases the likelihood of returning to school the following year by eight percentage points, and
8

a vicious cycle in which inaccurate beliefs translate into insufficient investments in
education, affecting future labor market outcomes and keeping perceived returns to
education low. The result can pose a policy challenge of significant heterogeneity and
inequality in schooling outcomes, even when, absent variations in the source and type
of information available, preferences about schooling trade-offs are similar. In this
context, understanding how perceived returns to education are formed in the first
place becomes a central theoretical and empirical question.
In this paper we examine the impact of an intervention that sheds light on how per-
ceived returns to education can be endogenously formed. First, we investigate whether
being recognized for educational success can directly shape expectations about future
earnings associated with different levels of schooling attainment. Second, we examine
peer effects as a channel through which expectations of returns to education can be
formed, given that peers may form beliefs based on their exposure to the successful
or unsuccessful outcomes of those in their social and family networks.
2.2 Rewarding Schooling Performance: Direct Effects
In theory, rewards for schooling performance can affect perceived returns to educa-
tion by providing individual-specific feedback to the students, captured by λi above.
Students often have imperfect knowledge about their own skills and they will update
their beliefs when receiving relevant feedback information: successful students are
then expected to revise their beliefs upward, while the unsuccessful students would
revise their beliefs downward.7 If ability and schooling investments are either com-
the likelihood of completing high school by nine percentage points. These results are consistentwith Kaufmann (2008) and Attanasio and Kaufmann (2009), who find that measures of adolescents’perceived returns are correlated with high school and college enrolment in Mexico.
7See Azmat and Iriberri (2010) and Bandiera et al. (2012) for a more detailed discussion of thismechanism. These studies investigate the impact of feedback information about school performance,either absolute or relative to others, on their future performance.
9
plements or substitutes, this feedback effect could have a direct impact on future
schooling investments.
Besides providing an individual-specific signal, the reward can also change a student’s
perception about the overall value of education. A student who sees her studying
efforts rewarded may positively update her beliefs about the returns to further in-
vestments in education. Alternatively, the reward may encourage students to seek
information about earnings associated with more education. Since students in the
developing world often underestimate the returns to education (Attanasio and Kauf-
mann, 2009; Jensen, 2010), the reward could reduce this pessimistic bias for successful
applicants. These are examples illustrating that the recognition for schooling success
can not only affect the individual-specific returns, but also the general returns to
education, captured by θ above.
2.3 Rewarding Schooling Performance: Peer Effects
Motivated by an extensive literature documenting how information obtained through
social networks can drive investment decisions (Foster and Rosenzweig, 1995; Bandiera
and Rasul, 2006; Conley and Udry, 2010), we investigate whether rewarding educa-
tional performance affects the perceived returns to education of individuals in the
networks of fellowship recipients.8
Beliefs about the returns to schooling can be driven by exposure to others experiencing
different levels of academic success. An important channel through which peers can
matter is through their own beliefs about the returns to education. If academic success
8An important finding from this literature is that the type and size of the social network candetermine the extent of social learning. Social learning appears to be maximized when informationis transmitted across agents who are most similar in terms of important economic and personalcharacteristics like gender, income level and ethnicity (Conley and Udry, 2010) or who face similarcircumstances (Foster and Rosenzweig, 1995).
10

leads to more positive beliefs about the general value of education, this may spill over
into their family and social networks. Successful peers may also increase overall
exposure to information about education and how to pursue funding opportunities
that can enable additional years of schooling. Similarly, exposure to unrecognized
peers may lead to lower perceived returns to education if students learn that effort
is not rewarded. In principle, the direction of peer effects resulting from exposure to
the schooling outcomes of peers is ambiguous. Observing high-performing role models
among those in their network of friends, family or neighbors may lead the agent to
revise her beliefs upward on the probability of achieving similar levels of success, but
also to revise them downward if peers perceive underlying quality differences relative
to the role model (particularly if the level of effort of the role model is difficult to
observe).
Understanding how perceptions about returns to education spill over across networks
is relevant because it highlights another mechanism through which unequal invest-
ments in education could persist - exposure to people with varying degrees of aca-
demic success. In our specific context, peer effects can alter the cost-benefit calculus
of the fellowship program itself. The cost-effectiveness of any program that intends
to increase educational attainment is highly dependent on the distribution of direct
and indirect treatment effects, including those that reach beyond the immediately
targeted group.
The main focus of our empirical analysis is to identify the presence and estimate the
magnitudes of both the direct and peer effects of rewarding school performance. In
section 7 we return to our conceptual framework and provide some suggestive evidence
that highlights the potential mechanisms that underlie our findings.
11

3 Empirical Setting
3.1 Rewards for Schooling Performance
We investigate the impact of education rewards on perceived returns to education
in the context of two fellowship programs that reward high-performing students at-
tending secondary education in India. Both fellowship programs are comparable and
funded by the same non-governmental organization (NGO). Our main results are ob-
tained from the first fellowship program, where we collected data in 2011, after the
distribution of the fellowship. In 2013, we applied the same research design to the
second fellowship program to test the external validity of our initial results, but also
to shed additional light on the mechanisms at play, which we discuss in sections 6
and 7 respectively. For expositional purposes, we first focus on the earlier study to
explain the empirical setting and to discuss our main results.9
The first fellowship program under study was launched in Dehradun district in the
state of Uttarakhand in India. The fellowship targets talented girls from disadvan-
taged backgrounds to encourage them to continue their studies through higher sec-
ondary school (hereafter HSC, equivalent to 11th and 12th grades). This is a partic-
ularly important demographic group given that higher tuition fees and employability
render lack of demand for secondary education particularly acute. Female students
may also be less exposed to information about employment opportunities associated
with different levels of schooling as they typically lack role models and access to
networks of other females entering the labor market.
Our sample covers three waves of eligible applicants for the fellowship program, to-
taling 570 applicants. The selection process consisted of three stages: the first stage
attributed scores to eligible students based on the documentation submitted in their
9Appendix B5 contains a detailed discussion of the major differences across both study sites.
12

application. Incomplete or poorly documented applications were rejected. The sec-
ond stage involved a written test, and the third stage consisted of an interview with
the candidates and their parents. To ensure that potential candidates did not under-
report their income to meet the eligibility criterion, house visits were scheduled for all
applicants who passed the third stage; eligibility was then verified using observable
proxies for income. The final selection was based on a composite score of the marks
given for secondary school, the written test, the interview and the home visit. We
provide a detailed description of the selection process in Appendix B2.
Successful applicants were awarded Rs 7,000 per annum ($116), paid in four equal
installments throughout the year, which were picked up at quarterly workshops held
by the NGO. The workshops provided general guidance on study skills and personality
development.10 Unlike the interventions in Jensen (2010) and Nguyen (2008), which
provided statistics on the actual returns to schooling, the workshops in our context
did not communicate any information about wages associated with different levels of
schooling.11 The fellowship would be withdrawn if students discontinued their studies
or if the scholarship was spent for purposes other than education.12
3.2 Data
We conducted three cross-sectional surveys in 2011. The main survey targeted a
random sample of students drawn from a sampling frame of all students who applied to
the fellowship program between 2008 and 2010. At the time of the survey, all batches
have completed grade 12 (HSC), with the majority enrolled in higher education.
Appendix Figure B1 summarizes the timing the fieldwork.
10The most frequent workshop topics focused on improving communication skills, spoken English,problem solving skills and stress management during examinations. The speakers were drawn fromthe NGO staff or volunteers from local educational institutions. See Appendix B2 for more detailsabout the program implementation.
11The second fellowship we examine in this paper did not include workshops.12Only 8 fellowships were withdrawn due to lack of effort or marriage.
13

To ensure enough observations for the analysis of peer effects, the sample was stratified
according to students close to the cutoff and in the remainder group.13 The 400
students closest to the cutoff were covered. The overall targeted sample size was of
570 students, while the realized sample has 525 students (92%).14 The survey data
was supplemented with administrative data, which included the contact details, socio-
economic background and application outcome of each applicant. Table 1 provides
the basic summary statistics for all respondents as well as for the sub-sample around
the cut-off.15 There are no statistically significant differences between fellowship
recipients and non-recipients around the cut-off.
We conducted a second survey targeting those in the social and family networks of
students who were close to the cutoff (both for award recipients and non-recipients).
Respondents to the main survey were asked to name, in descending order, three of
their closest neighbors, friends and siblings who were female and in grades 8 or 9,
thus still eligible to apply for the fellowship and in the process of deciding whether to
invest in higher secondary education.16 We then captured indicators of the frequency
with which our respondents interacted with these networks, with a particular focus
on the interactions leading to exchanges of information about schooling, jobs and
career choices. Our final peer sample (581) was restricted by the fact that both
award recipients and non-recipients were often unable to name a close peer: it was
only possible to survey 57 siblings as many recipients and non-recipients did not have
13The cutoff value was determined by the score that coincided with the capacity limit in a givenbatch. The interval of 0.1 score points around the identified cutoff was used to define the restrictedsample of applicants with scores close to the cutoff. The remaining observations comprise the restof the sample.
14We do not find any evidence of systematic non-response bias, as evidenced by Table A2.15More detailed summary statistics is reported in Table A1.16Whenever the closest peer was unavailable (after three attempts), the team surveyed the second
closest friend. In cases in which the fellows and non-recipients were unable to provide a full list ofclosest peers either because they lived in remote mountainous areas with few neighbors or becausethey did not know someone in their network who could still apply, the definition of neighbors andfriends was relaxed to include acquaintances. This occurred in approximately 15% of our sample.Our main results remain unchanged when we exclude these cases from the analysis.
14

a sibling in grades 8 or 9. We find, however, no evidence that this constraint varies
differentially across networks of recipients and non-recipients (Table A3).
Both surveys collected general information about the student and her peers’ socioeco-
nomic and demographic background, as well as detailed information on past schooling
and academic performance. To elicit information on perceived returns to education
we designed a survey module that captured the individual’s perceived distribution of
future earnings associated with different levels of schooling. The levels of schooling
considered were secondary education (SSC), equivalent to grade 10, higher secondary
education (HSC), equivalent to grades 11 and 12, and higher education (HE). The
nature of our data allows us to take into account not only average expected returns
but also to derive other moments in the distribution of expected earnings associated
with different levels of investments in schooling.17
Finally, we conducted an independent audit study to obtain entry level wages in
Dehradun district for job seekers with different levels of schooling, among a randomly
selected sample of private and public entities in the district. We cross-validated these
figures against district-level earnings data collected through India’s 61th wave of the
NSS (National Sample Survey) conducted in 2004-05. These data are used to evaluate
the accuracy of perceived returns to education of fellows and non-recipients.
3.3 Identification
To measure the effect of the fellowship on perceived returns to education, we adopt
a regression discontinuity design (RDD). In our setting, assignment to treatment is
determined by the student’s score in the selection process relative to a cutoff value.
17See Appendix B4 for a detailed description of the showcards we used to elicit the conditionalearnings distributions. Following common practice in the literature, we resorted to visual aids andexamples to assist respondents with understanding probabilities prior to answering these expectationquestions (Dominitz and Manski, 1996; Attanasio and Kaufmann, 2009; Delavande et al., 2011;Luseno et al., 2003; Lybbert et al., 2004).
15

This cutoff was decided by the NGO in charge of the program, based on available
funding for each year. Neither the cutoff nor the final score are observed by the
applicants, so the recognition through the fellowship award carries an important signal
even for those close to the cutoff. While the assignment to treatment does not depend
deterministically on the application score, Figure 1 shows a strong discontinuity in
the probability of assignment around the cutoff.18 We exploit this discontinuity as a
source of variation to identify the causal relationship between the fellowship award
and the outcomes of interest. We adopt a fuzzy regression discontinuity design (FRD),
where we flexibly control for the student’s score and instrument the fellowship award
with whether the student’s score exceeds the cutoff value (Lee and Lemieux, 2010;
Thistlethwaite and Campbell, 1960; Hahn et al., 2001; Angrist and Lavy, 1999).
[Figure 1 here]
Identification further requires that all relevant factors besides treatment vary smoothly
around the cutoff of assignment to treatment (Campbell, 1969). A concern could for
example emerge due to selective sorting or manipulation of students’ scores close to
the cutoff. To directly test for the plausibility of this identifying assumption, Figure
2 plots important baseline characteristics of the applicants such as household size,
household income levels and performance in 10th grade as a function of the forcing
variable. The forcing variable is centered around the cutoff, marked by a solid vertical
line. The dashed lines to either side of it define the sample of comparable students
around the cutoff. Figure 2 confirms that all functions are smooth, exhibiting no
discontinuities around the cutoff.19
[Figure 2 here]
18This can simply be due to mis-assignment or due to re-assignment by the program administrationbased on variables that are unobserved by us.
19We also formally test for the absence of a discontinuity in a Seemingly Unrelated Regression(SUR) model and cannot reject that the treatment coefficient is jointly zero for all covariates (seeTable A11 in the Online Appendix.)
16

We apply the same intuition underlying the regression discontinuity design to estimate
spill over effects onto the social and family networks of fellowship recipients and non-
recipients. We restrict our analysis to peers who are in the networks of students
located close to the cutoff point.20 To mitigate concerns with endogenous network
formation in response to the outcome of the fellowship process, we restrict our sample
to networks that were identified as pre-dating the fellowship program. We define peers
as including close friends, younger siblings and neighbors.
4 Rewarding Schooling Performance: Direct Ef-
fects
4.1 Expected Future Earnings
Our main measure of expected earnings is based on the elicited individual distribution
of income earnings for different levels of education. In particular, we elicited the sub-
jective probabilities respondents assign to receiving earnings in each of the following
bins Y = {0 − 5, 000; 5, 001 − 10, 000; 10, 001 − 15, 000; 15, 001 − 20, 000;> 20, 000}.
The choice of bin-width was based on the wage distribution of the Indian National
Sampling Survey of 2004. The average probabilities of each future earnings bin is
reported in the Online Appendix Table A16.
The expected income for a given schooling level s is calculated by weighting each
20Tables 1 and A4 confirm that we fail to reject tests of equality of variable means and distributionsat conventional levels when comparing award recipients and non-recipients, and their respectivepeers, close to the cutoff. These results suggest that targeted recipients and non-recipients, andtheir peers are indeed comparable. Note that we relax this constraint in the second study to includepeers of fellows and non-fellows that are further from the cutoff.
17

income band (using the lower bound) with its perceived probability pi(yj|s)21:
Ei[y|s] = Σjpi(yj|s)× yj (2)
In Figure 3, we examine the direct effect of the fellowship award on our first mea-
sure of perceived returns to education, exploiting the regression discontinuity. Our
first measure equals the perceived gain in average earnings from completing higher
education (HE) vis-a-vis lower secondary school (SSC),
Ei[y|HE]− Ei[y|SSC]
After controlling for age, household size, caste, schooling stream and cohort effects, we
plot the residuals of this estimation against the forcing variable.22 We observe a stark
increase in perceived returns to completing higher education vis-a-vis lower secondary
education at the cutoff point. This increase coincides with the discontinuous jump
in the probability of treatment, revealing that the fellowship award shifted perceived
returns to higher levels of education.
[Figure 3 here]
To measure the magnitude of the effect, we estimate the following equation:
Ei[y|HE]−Ei[y|SSC] = α+ β × treatmenti + g(scorei− cutoffi, γγγ) +XXX ′iδ+ εi (3)
The treatment variable represents a dummy variable indicating the fellowship award;
g(·, γγγ) is a polynomial function with parameter vector γγγ that controls for the forcing
variable which is centered around the cut-off. XXX i is a vector capturing several control
21The results are robust to alternative definitions of expected income using the upper bound andthe midpoint of the income bins (Table A10 of the online appendix).
22School streams capture whether students are pursuing their field of specialization in arts, scienceand commerce.
18

variables such as the age, household size, caste dummies, schooling stream dummies23
and batch dummies for each wave of the fellowship, for a total of three years of the
program. The standard errors are clustered at the school-level to allow for arbitrary
correlations of unobservables among students attending the same school.
This equation is first estimated using a sharp regression discontinuity design, where
we replace the treatment variable by a dummy for whether the student was above or
below the cut-off score, cutoff i (Table 2, OLS in Panel A). This can be interpreted
as our reduced-form estimate of the direct effect. Our preferred estimation, however,
uses the fuzzy regression discontinuity design where the treatment variable (fellowi)
is instrumented with the dummy cutoff i (Panel B) to account for the mis-assignment
to treatment around the cut-off, and includes the most flexible polynomial controls
for the forcing variable.
[Table 2 here]
Table 2 confirms the previous graphical results: we detect a statistically significant im-
pact of the fellowship award on the increase in average expected earnings associated
with additional schooling. Students above the cut-off report an expected monthly
wage increase from completing higher education compared to lower secondary educa-
tion by 744 Rs. (Column 1).24 The estimated magnitude increases once accounting
for the misassignment around the cut-off using the fuzzy regression discontinuity de-
sign (Column 2), consistent with an attenuation bias stemming from the imperfect
compliance and fuzziness in assignment to treatment.25 The estimates are stable
23The caste dummies are for Other Backward Castes (OBC), Scheduled Caste (SC), ScheduledTribe (ST) and Muslim castes. The schooling streams are Arts, Science and Commerce.
24This effect is driven primarily by an increase in the expected wage when completing highereducation rather than by a decrease in the expected wage when only completing lower secondaryeducation (See Table A17).
25We can also statistically reject that the OLS and IV estimates are equal (See Appendix A15).The difference between the reduced form and the IV estimate is driven by the imperfect complianceas shown in the first-stage Appendix Table A7.
19

when allowing for higher order polynomials (Columns 3-5).26
The point estimate of the preferred specification (Column 4) suggests that the fellow-
ship increases the perceived average gain in expected monthly earnings for obtaining
a higher education degree vis-a-vis a secondary schooling degree by 1,369 Rs ($23).
This corresponds to an increase in the perceived average gain of completing higher
education of about 0.74 standard deviations. This sizable increase in the higher edu-
cation premium corresponds to about 45% of the average monthly household income
of fellowship applicants.27
4.2 Accuracy of Perceived Returns to Education
We analyze how perceived returns of fellowship recipients and rejects compare to
actual average returns in the marketplace. To estimate the latter we rely on Mincer
earnings regressions (Mincer, 1974; Lemieux, 2006) applied to India’s National Sample
Survey (NSS) from 2004. We restrict the sample to the state of Uttarakhand where
the program is offered and we adjust for inflation using the annual inflation rates
between 2004-2008.28
[Figure 4 here]
Figure 4 compares the estimated coefficients of the difference between perceived and
actual returns (unconditional means). The NSS estimate reveals that higher educa-
tion graduates earn, on average, 3,606 Rs ($60) per month more than SSC graduates.
We find that perceived returns to education reported by fellowship recipients are more
closely aligned with actual Mincerian returns to education than for non-recipients.
26Our results are also robust when using fractional polynomials and fitting linear/quadratic func-tions of the forcing variable at each side of the discontinuity. The specification that minimizes theAkaike Information Criterion is the linear specification.
27Note that these results are also consistent with a discouragement effect among unsuccessfulapplicants to the fellowship, which would magnify the pessimistic bias.
28World Bank, World Development Indicators (2013)
20

We decompose the impact of additional education into the impact of higher education
(i.e., HE relative to HSC) and the impact of completing secondary education (i.e.,
HSC relative to SSC). Comparing HE with HSC, we find that all groups underesti-
mate returns to higher education, but the award of the fellowship appears to reduce
this pessimistic bias. Comparing HSC with SSC, we find that both fellowship recipi-
ents and non-recipients seem to overestimate returns to having completed secondary
education. Comparing HE with SSC we find that fellows report accurate returns
relative to non-recipients and others in their network.
Our estimates of perceived returns to education are thus consistent with previous
evidence of a pessimistic bias (Attanasio and Kaufmann, 2009; Jensen, 2010). To this
we add the new finding that recognizing educational performance can reduce the gap
between perceived and actual returns.
4.3 Variance of Expected Future Earnings
Given that our survey elicited the entire earnings distribution, we can also evaluate
how the fellowship affects the perceived impact of education on the uncertainty of
future earnings. To do so, we construct the standard deviation of perceived future
earnings for individual i for a given schooling level s:
SDi[y|s] =√
Σjpi(yj|s)× (yj − Ei[y|s])2 (4)
where Ei[y|s] is the expected perceived wage derived in (2). We analyze the im-
pact of the fellowship award on the difference in standard deviations, SDi[y|HE] −
SDi[y|SSC], capturing the gain or loss in income variability associated with complet-
ing one schooling degree over the other.
[Figure 5 here]
21

Figure 5 suggests that the fellowship award decreased the perceived variability of
future income associated with higher education. This is confirmed by the regression
estimates presented in Table 3: while in the total sample the completion of higher
education is not expected to have a significant impact on income risk, the fellowship
award significantly decreases the standard deviation of expected income gain upon
completion of higher education, to a value that is below the standard deviation of ex-
pected income associated with secondary education. The magnitude of this difference
is also economically significant: the fellowship award decreases the difference in stan-
dard deviations by 1,164 Rs ($20, Column 5).29 These results are consistent across
both the sharp (Column 1) and fuzzy discontinuity designs (Column 2-5).
[Table 3 here]
Our findings are also robust to alternative measures of dispersion in the distribu-
tion of perceived earnings, such as the gap between the probability of the highest
expected earnings and the probability of the lowest expected earnings for each level
of schooling, pi(ymax|s) − pi(ymin|s) and the inverse of the coefficient of variation,
which enables a unit-free comparison across distributions of earnings for each school-
ing level.30 Overall, these results indicate that fellows perceive investments in higher
education not only to increase average earnings but also to reduce the variability of
their starting salaries.
29This effect is driven primarily by an increase in the variance in expected earnings when com-pleting lower secondary school rather than by a decrease in the variance when completing highereducation. (See Table A18).
30See Tables A5 and Table A6 in the online appendix.
22

5 Rewarding Schooling Performance: Peer Effects
5.1 Perceived Returns to Education
In this section we investigate whether changes in perceived returns to education trig-
gered by rewards for academic performance spill over into social and family networks.
Figure 6 compares the impact of the fellowship award on the aggregate distribution
of perceived returns to education for fellows and their peers. In the left panel, we
plot the average difference-in-differences in the perceived probability of ending up
in each of the income categories when finishing higher education (HE) relative to
lower secondary education (SSC) for recipients and non-recipients, after controlling
for a set of individual-level characteristics. The right panel plots the same difference-
in-difference results, but for peers of recipients and non-recipients. The left panel
suggests that fellowship recipients experience a systematic upward shift in their dis-
tribution of perceived returns. That is, fellowship recipients expect that completing
higher education has a larger negative effect on the probability of ending up in the
lower income bands and a larger positive effect on the probability of ending up in the
highest income bands. In contrast to the clear distributional shift for the fellowship
applicants (left panel), we do not find a statistically significant effect for their peers
(right panel).
[Figure 6 here]
To further test for peer effects in perceived returns to education, we estimate the
following equation:
Yi = α + β × treatmenti +XXX ′iδ + εi (5)
with Yi equal to Ei[y|HE] − Ei[y|SSC] and SDi[y|HE] − SDi[y|SSC] respectively.
This sample is restricted to the peers of students with scores around the cut-off
so that we cannot exploit the fuzzy discontinuity and flexibly control for the score
23

variable. We relax this in the second study and find similar results when exploiting
the discontinuity. Notice also that restricting the analysis to applicants around the
cut-off does not affect our estimates of the direct effects either. Since several peers
may be exposed to the same fellowship applicants, standard errors are clustered at
the level of the applicant, corresponding to the level of treatment.
The regression results confirm the absence of differential spill overs on perceived re-
turns of those among the networks of recipients and non-recipients, measured both
by the mean (Table 4, Panel A) and standard deviation (Panel B).31 Peer effects on
perceived mean earnings are never statistically significant. For peer effects on per-
ceived standard deviations, some estimates are marginally significant, but, in contrast
to our results for the direct effects of the fellowship on fellows, these estimates are
not robust to alternative measures of dispersion in earnings. Moreover, in all cases,
the estimated magnitudes are very small relative to the corresponding estimates of
the direct effects (see Columns 1 and 5). To directly test for treatment heterogeneity,
we also break down the regressions by network type: endogenous networks of friends
and exogenous networks of neighbors and siblings. We fail to detect any statistically
significant differential spill over effects on perceived returns across these groups.
[Table 4 here]
5.2 Information about Financial Support for Schooling
While changes in perceived returns to education do not appear to be transmitted
from fellows to their peers, we find systematic evidence of the spilling over of factual
information from fellowship recipients to those in their networks (Table 5). In our
context, factual information is defined as knowledge about the eligibility criteria and
31Note that the peer sample is larger than the original applicant pool as we collected informationon more than one participant in each applicants’ networks (friends, neighbors and relatives).
24

the application process for the fellowship32 (Columns 1), as well as knowledge about
funding opportunities other than the fellowship under study (Columns 2). We also
examine peers’ reported intention to apply to the fellowship (Columns 3).
Those in the networks of successful applicants scored 4% points higher in the knowl-
edge index, reflecting an improved understanding of the fellowship criteria and appli-
cation procedures (Column 1).33 We also find that those in the networks of successful
fellows are 9% points more likely to know about alternative sources of funding (Col-
umn 2). Since knowledge about alternative sources is otherwise very low (with an
average score of 27%), this represents a sizable improvement. More importantly, these
factual spill overs seem to translate into investment decisions: those exposed to a suc-
cessful fellow were 13% points more likely to consider applying to the fellowship in
the subsequent round (Column 3).
Overall, our results suggest that while agents do not update their perceived returns
to education when exposed to someone in their network who received a reward for
academic performance, they hold higher levels of information regarding the fellowship
application process and report a higher intention to apply for it. They are also better
informed about alternative sources of funding that could enable them to continue
their studies. Note that this also suggests an important way in which peer effects can
increase the take up and long-run impact of fellowship programs.
32The variable knowledge is defined as the percentage of criteria and application procedures therespondent was able to name unprompted. In our survey, the respondents were asked to identify thethree main criteria for eligibility to the fellowship: 1) total income less than 96,000 Rs ($1600) peryear, 2) secondary school marks higher than 60%, and 3) admitted to grade 11 at time of application.The three steps involved in the application process that students were asked to identify were: formalapplication, written test and interview.
33When breaking the index down and examining the questions separately, we find that the result isdriven by better knowledge about the formal application, the test procedure, the monetary eligibilitycriteria and the requirement that students need to be admitted to grade 11 at the time of application.
25

6 External validity
We conducted a second study to examine the impact of rewards for schooling per-
formance on perceived returns to education. This allowed us to test the external
validity of our findings and to further explore the potential mechanisms driving our
results. The second fellowship scheme was implemented in Sambalpur district, state
of Orissa, and was comparable to the program in the main study area in Dehradun,
state of Uttarakhand. This second fellowship had however the additional advantage
of including both boys and girls.34 We repeated the relevant surveys described in
Section 3.3, with an added survey module to elicit parents’ beliefs about education.
This additional module was motivated by previous studies showing that parents’ be-
liefs about potential earnings associated with additional years of schooling may have
a significant impact on their children’s investment in education.35 Finally, we also
extended the sample of peers beyond the cut-off to mitigate concerns that our spill
over tests in the first study were underpowered.
Table 6 summarizes the main findings for both fellowships and confirms the previous
results. For the pooled results including both boys and girls, the point estimate for the
effect of the fellowship award is 1,690 Rs ($28.2, Column 2), which is nearly identical
to the 1,369 Rs ($22.8) estimated in the first study site (Column 1). While the point
estimate for girls only is slightly higher in Orissa (2,173 Rs, $36.2, Column 3), the
overall direction and magnitude of the effects appears to be similar across genders.
34See Appendix B1 for the timeline and Appendix B5 for a detailed summary of the eligibilitycriteria for the Orissa fellowship program and a detailed description of the data collection undertakenfor the study. For instance, in this second fellowship, we observe four cohorts of students. The lasttwo cohorts in our sample experienced changes in the cutoff for eligibility to the fellowship, drivenmostly by the general quality of the applicant pool and the capacity for the NGO to administer thefellowship. Unfortunately, we lack statistical power to be able to estimate treatment effects for thedifferent cutoffs.
35Nguyen (2008) finds evidence in Madagascar that informing parents about the average incomegains from spending one more year in school for children with similar background to their own had asizable effect on student test scores, particularly for parents who more significantly underestimatedreturns to education before receiving this information. Jensen (2010) finds similar results amonghigh school students in the Dominican Republic.
26

For the standard deviation, we find an effect for girls that is similar in magnitude, but
it is no longer significant (Column 6).36 While the point estimate for boys is smaller,
we cannot statistically reject that the estimated effects are equal across genders.
[Table 6 here]
Despite the larger sample of peers in this second study, we again find no spill over
effects for the wage distribution. Since we sampled peers beyond the cutoff in the
second study, we can implement the sharp and the fuzzy RDD to estimate these
indirect effects. The point estimates are close to zero (see Table 7).
[Table 7 here]
For the most part, these results lend support to the external validity of our findings.37
The second study also allows us to more closely examine the mechanisms through
which the fellowship award translates into higher perceived returns. We discuss this
evidence in the following section.
7 Evidence on Mechanisms
While previous work has established the importance of perceived returns to educa-
tion for educational investments, our results shed light on the reverse relationship.
Students whose achievement in school is recognized expect higher future returns from
investing in education: fellowship recipients expect additional years of schooling to
both increase their mean earnings and decrease the variance in their earnings. In this
section we provide suggestive evidence on the mechanisms through which recognition
36Note that the estimates for girls become significant when we cluster the standard errors at thecohort level rather than the school level. Still, the results are not as robust when considering otherdispersion measures, unlike the results in the first study.
37This is particularly the case given that the two study sites present some important differences.Orissa is poorer and has lower average levels of education relative to Uttarakhand. The averagedistrict-level literacy rate in the main study site (Dehradun, Uttarakhand) is 77% compared to 67%in Sambalpur, Orissa (Census 2011).
27

for performance could affect perceived returns to education.
As discussed in section 2.2, the reward could reveal individual-specific information
by allowing the applicant to revise beliefs about her ability. However, the reward
could also change a student’s general view on returns to education, by for example
changing beliefs about how schooling effort can be financially rewarding.38 Distin-
guishing between these two broad mechanisms is important, as it can determine both
the efficiency of additional schooling investments and the potential for spill-over ef-
fects.39
In the following sections we provide suggestive evidence on how the fellowships appear
to alter beliefs about the value of education: fellows report higher expected returns to
education for themselves but also for others in their cohort, and they are more likely
than non-recipients to encourage their peers to apply for fellowships and pursue other
sources of funding to continue their studies. We also find that parents of fellows have
higher perceived returns to investments in education and are more likely to value
education for all of their progeny relative to parents of non-fellowship recipients who
exerted the same level of schooling effort, but were not recognized for it.
7.1 Value of Education
If the reward for schooling performance allows fellows to extract a signal about their
individual types only, we would not expect them to revise their beliefs about returns
to others’ education. In the second survey in Orissa, we elicited the distribution of
38Note that the fellowship is not distributed by the school but by an independent NGO.39The workshops through which the fellowship installments were distributed in Dehradun did not
convey information about the wage structure in the marketplace. Given (endogenous) variation inthe number of workshops attended by different fellows, we directly test for this possibility and findno statistically significant relationship between reported perceived returns and the number of work-shops attended by fellows in Dehradun, when controlling for observable individual characteristics.Moreover, there were no such workshops associated with the fellowship in Orissa and yet our mainresults were nearly identical.
28

wages fellows and non-fellowship recipients expect other students in their cohort to
earn upon obtaining different educational degrees. This allows us to test whether
the fellowship is interpreted as a signal of individual ability, by introducing a wedge
between perceptions of own earning capabilities and that of others.40 We construct
the same measures for the perceived returns to education as described in Section 4.1,
but now applied to other students rather than to the respondents themselves.
[Table 8 here]
Table 8 shows that fellows report not only substantially higher returns to education
for themselves (Column 2), but also for others (Column 4). The magnitude of the
estimates is similar. We fail to detect a statistically significant difference between the
expected increase in own earnings and the expected increase in others’ earnings at
the discontinuity point.41
Table 9 reveals that fellowship recipients encourage, on average, 84% more peers to
apply to the fellowship relative to non-recipients (Column 2). Since those in the
networks of fellows and non-recipients are comparable and determined before the
award, the observed encouragement pattern is also suggestive of an increase in the
general value of education.42 This complements the earlier results that peers of fellows
express a stronger intention to apply to the fellowship and are also more likely to be
aware of the eligibility criteria and of alternative sources of funding (Tables 4).
[Table 9 here]
40The question asked was “Suppose someone from your school completed [Level of schooling]. Foreach case, what would you expect their monthly salary to be for the first 5 years of their career?”
41In the survey conducted in Uttarakhand, respondents were asked to report average sectoralentry salaries for higher education graduates in their cohort. Using these data, we also fail to detecta statistically significant difference between the perceived level of earnings for themselves and forothers. However, we did not elicit the full distribution of wages conditional on different educationlevels in this first study.
42Note that it is still possible that fellows consider friends and siblings to be of comparable ability,and are therefore more likely to encourage them to apply for the fellowship. These results wouldthen be consistent with the fellowship allowing fellows to extract a signal of individual ability, forthemselves and for their friends and siblings. Note however that our sample of peers also includesneighbors, who are less likely to be perceived as being of similar ability.
29

In Orissa, our survey elicited further information on the perceived trade off between
education and marriage for girls, so as to obtain an indirect measure of the perceived
value of education. As further evidence of our proposed mechanism, Table 9 shows
that fellowship recipients are more likely to recognize the general trade-off between
completing education and early marriage by perceiving it to be more difficult to
complete schooling after marriage (Column 3-4), and by reporting a higher optimal
age for marriage (Column 5-6).
Taken together, the evidence from both study sites is suggestive of the fellowship
award sending a signal of the general value of education as a high-return investment.
Fellowship recipients will then hold more accurate beliefs as discussed earlier due to
their increased optimism about the impact of schooling in general or because they are
motivated to seek direct information on wages in the marketplace, among others.
7.2 Selective spill-overs
In Section 5, we documented the selective transmission of information to younger
peers who can apply for the fellowship in the future. While we are unable to deter-
mine the reasons for this selective transmission, it is possible that information about
perceived returns to education is more abstract and harder to accurately convey to
peers, relative to actionable information on how to seek fellowships that recognize
schooling success. To test if this selective transmission is driven not only by the con-
tent of the information but also by the type of recipient, we examine the impact of
the fellowship on parental beliefs and attitudes.
[Table 10]
In contrast to younger peers, parents of fellows report higher perceived returns to
education, particularly when we account for imperfect compliance using the fuzzy RD
30

(Table 10, Panel A, Column 1). The magnitude of this increase is again comparable
to the direct effect on fellows (1,690 Rs ($28.2)). Moreover, parents report higher
expectations for all their progeny, not only for the child receiving the fellowship
(Column 2). They do not however report lower perceived dispersion in expected
returns (Columns 3-4).
We also find significant shifts in parental attitudes towards education. Parents are
more likely to recognize the trade-off between early marriage and completing educa-
tion (Panel B). Parents of recipients are more likely to agree that “all children should
pursue the highest education possible” (Column 5-6). They are also more likely to
agree that their younger children should follow the success of the older ones (Column
7) and that children, in general, should postpone marriage until they have completed
schooling (Column 8).
8 Robustness Checks
There are three potential concerns with the robustness of the main results: mea-
surement error in perceived returns to education, manipulation of students’ scores
and the endogeneity of network formation in the peer effect analysis. We argue that
measurement error due to social desirability bias is unlikely given that we did not
elicit any direct measure of returns to education, but instead, captured the expected
wage distributions conditional on different years of schooling. Moreover, the data
collection was conducted by an independent NGO and was advertised as a general
study of trends in education, without any direct link to the program providing the
fellowship. A related concern is that students exhibit preference bias, which would
lead them to adjust their responses based on schooling decisions they have already
made or anticipate to make for other reasons. Our results, however, are based on a
31

direct comparison between students around an arbitrary cut-off so that past schooling
efforts are comparable by construction. Moreover, if fellowship recipients are mak-
ing (or anticipate to make) different schooling investments, this would still have been
driven by the fellowship program and its effect on their valuation of education. Again,
given the indirect elicitation of perceived returns to education, it seems less plausible
that a change in schooling preferences (for some other reason) has affected their be-
liefs rather than the other way round.43 A second type of concern is that there might
have been manipulation in the scores assigned to candidates around the cut-off. In
Figure A1 we plot the number of observations in each bin against the midpoints of
the bins, to examine whether the distribution of the forcing variable itself is smooth
around the cut-off (McCrary, 2008). In Uttarakhand, we find evidence of potential
manipulation in the third batch of applicants. When we exclude this batch from
the analysis, our results become even stronger. (Tables A11. For Orissa, we find no
evidence of manipulation around the cut-off.
[Figure A1 here]
A third concern with our analysis relates to the challenge of identifying the correct
network of peers of fellowship applicants through self-reported network data (Conley
and Udry, 2010; Bandiera and Rasul, 2006). In both our studies, the realized sam-
ple of peers was substantially smaller than our initial targeted sample since many
respondents were unable to name a close peer. In Table A2, we directly test for
reporting differences between fellows and non-fellows whose networks we were able
to fully sample and find no evidence of sampling bias. Moreover, we restrict the
survey to networks that pre-dated the fellowship program to avoid the problem of
endogenous network formation in response to the treatment itself.
43For a more detailed discussion of measurement error in our outcome of interest see Section A ofthe Online Appendix.
32

9 Conclusions
In the developing world, perceptions of returns to education are likely to be formed
in contexts of incomplete information: there is often considerable uncertainty and
misinformation regarding students’ employment prospects and how these prospects
vary with different levels of schooling. While recent literature has focused on the
provision of information to increase perceived returns to education in the developing
world, in this study, we test two important channels through which perceived returns
to education may be formed in the first place. First, we find that being recognized
for schooling performance is strongly associated with higher (and therefore more
accurate) expectations of average earnings associated with higher levels of education,
but also of less risky jobs and wage profiles relative to students who exerted a similar
effort in school but who failed to receive recognition for their efforts. Recognition for
performance increases the short-run financial benefits of schooling and may motivate
students to seek out information on future financial rewards associated with further
schooling investments. Second, we find no robust evidence that being exposed to those
recognized for their schooling performance through networks of friends, neighbors or
siblings changes perceived returns to education. This exposure does however lead to
the transmission of information on sources of funding to support secondary education,
to a reported higher intention to apply for the fellowship program in the future and
to the ability to accurately identify the factual details of the application process. We
also detect significant spillover effects from fellows to their parents, as they report
both higher perceived returns to additional years of schooling, a desire to support the
education of all their offspring and a more acute perception of the trade off between
investing in education and early marriage for girls.
Overall, our findings suggest that financial recognition for schooling performance
increases the valuation of the relationship between educational effort and financial
33

reward, and as such may be an important driver of further educational investments.
Low-income groups in the developing world often fail to be recognized for their school-
ing efforts, which can ultimately reinforce unequal investments in education across
time. Programs that attempt to recognize students for their performance in school
may therefore represent an important policy mechanism to increase students’ and
parents’ valuation of the long-term payoffs associated with schooling effort.
References
Altonji, J. G. (1993): “The Demand for and Return to Education When Education
Outcomes Are Uncertain,” Journal of Labor Economics, 11, 48–83.
Angrist, J. D. and V. Lavy (1999): “Using Maimonides’ Rule To Estimate The
Effect Of Class Size On Scholastic Achievement,” The Quarterly Journal of Eco-
nomics, 114, 533–575.
Attanasio, O. and K. Kaufmann (2009): “Educational Choices, Subjective Ex-
pectations, and Credit Constraints,” NBER Working Papers 15087, National Bu-
reau of Economic Research, Inc.
Attanasio, O., C. Meghir, and M. Vera-Hernandez (2005): “Elicitation,
Validation, and Use of Probability Distributions of Future Income in Developing
Countries,” mimeo.
Attanasio, O. P. and K. M. Kaufmann (2010): “Subjective Returns to School-
ing and Risk Perceptions of Future Earnings: Elicitation and Validation of Subjec-
tive Distributions of Future Earnings,” mimeo.
Azmat, G. and N. Iriberri (2010): “The importance of relative performance feed-
34

back information: Evidence from a natural experiment using high school students,”
Journal of Public Economics, 94, 435–452.
Bandiera, O., V. Larcinese, and I. Rasul (2012): “Blissful Ignorance? A
Natural Experiment on the Effect of Feedback on Students’ Performance,” mimeo.
Bandiera, O. and I. Rasul (2006): “Social Networks and Technology Adoption
in Northern Mozambique,” Economic Journal, 116, 869–902.
Banerjee, A. and E. Duflo (2011): Poor Economics: A Radical Rethinking of
the Way to Fight Global Poverty, Poor Economics: A Radical Rethinking of the
Way to Fight Global Poverty, PublicAffairs.
Barro, R. (1998): Determinants of Economic Growth: A Cross-Country Empirical
Study, The Lionel Robbins Lectures, Mit Press.
Becker, G. S. (1962): “Investment in Human Capital: A Theoretical Analysis,”
Journal of Political Economy, 70, 9.
Belzil, C. and J. Hansen (2002): “Unobserved Ability and the Return to School-
ing,” Econometrica, 70, 2075–2091.
Campbell, D. T. (1969): “Reforms as Experiments,” American Psychologist, 24,
409–429.
Carneiro, P., J. J. Heckman, and E. J. Vytlacil (2011): “Estimating
Marginal Returns to Education,” American Economic Review, 101, 2754–81.
Conley, T. G. and C. R. Udry (2010): “Learning about a New Technology:
Pineapple in Ghana,” American Economic Review, 100, 35–69.
Dahl, G. B., K. V. Loken, and M. Mogstad (2014): “Peer Effects in Program
Participation,” American Economic Review, 104, 2049–74.
35

Delavande, A., X. Gine, and D. McKenzie (2011): “Measuring subjective
expectations in developing countries: A critical review and new evidence,” Journal
of Development Economics, 94, 151–163.
Delavande, A. and H.-P. Kohler (2009): “Subjective expectations in the context
of HIV/AIDS in Malawi,” Demographic Research, 20, 817–875.
Dominitz, J. and C. F. Manski (1996): “Eliciting Student Expectations of the
Returns to Schooling,” Journal of Human Resources, 31, 1–26.
Duflo, E. and E. Saez (2003): “The Role Of Information And Social Interactions
In Retirement Plan Decisions: Evidence From A Randomized Experiment,” The
Quarterly Journal of Economics, 118, 815–842.
Eaton, J. and H. S. Rosen (1980): “Taxation, Human Capital, and Uncertainty,”
The American Economic Review, 70, pp. 705–715.
Epple, D. and R. E. Romano (2011): “Peer Effects in Education: A Survey of
the Theory and Evidence,” Handbook of Social Sciences, 1B.
Foster, A. D. and M. R. Rosenzweig (1995): “Learning by Doing and Learning
from Others: Human Capital and Technical Change in Agriculture,” Journal of
Political Economy, 103, 1176–1209.
Gine, X., R. Townsend, and J. Vickery (2008): “Patterns of Rainfall Insurance
Participation in Rural India,” World Bank Economic Review, 22, 539–566.
Hahn, J., P. Todd, and W. Van der Klaauw (2001): “Identification and
Estimation of Treatment Effects with a Regression-Discontinuity Design,” Econo-
metrica, 69, 201–09.
Jensen, R. (2010): “The (Perceived) Returns to Education and the Demand for
Schooling,” The Quarterly Journal of Economics, 125, 515–548.
36

Kaufmann, K. (2008): “Understanding the Income Gradient in College Attendance
in Mexico: The Role of Heterogeneity in Expected Returns to College,” Discussion
Papers 07-040, Stanford Institute for Economic Policy Research.
Kodde, D. A. (1986): “Uncertainty and the Demand for Education,” The Review
of Economics and Statistics, 68, pp. 460–467.
Kremer, M. and D. Levy (2008): “Peer Effects and Alcohol Use among College
Students,” Journal of Economic Perspectives, 22, 189–206.
Kremer, M. and E. Miguel (2007): “The Illusion of Sustainability,” The Quar-
terly Journal of Economics, 122, 1007–1065.
Lee, D. S. and T. Lemieux (2010): “Regression Discontinuity Designs in Eco-
nomics,” Journal of Economic Literature, 48, 281–355.
Lemieux, T. (2006): “The Mincer Equation Thirty Years After Schooling, Experi-
ence, and Earnings,” in Jacob Mincer A Pioneer of Modern Labor Economics, ed.
by S. Grossbard, Springer US, 127–145.
Levhari, D. and Y. Weiss (1974): “The Effect of Risk on the Investment in
Human Capital,” American Economic Review, 64, 950–63.
Luseno, W. K., J. G. McPeak, C. B. Barrett, P. D. Little, and G. Ge-
bru (2003): “Assessing the Value of Climate Forecast Information for Pastoralists:
Evidence from Southern Ethiopia and Northern Kenya,” World Development, 31,
1477–1494.
Lybbert, T. J., C. B. Barrett, S. Desta, and D. L. Coppock (2004):
“Stochastic wealth dynamics and risk management among a poor population,”
Economic Journal, 114, 750–777.
37

Manski, C. F. (1993): “Adolescent Econometricians: How Do Youth Infer the
Returns to Schooling?” in Studies of Supply and Demand in Higher Education,
National Bureau of Economic Research, Inc, NBER Chapters, 43–60.
McCrary, J. (2008): “Manipulation of the running variable in the regression dis-
continuity design: A density test,” Journal of Econometrics, 142, 698–714.
McKenzie, D., J. Gibson, and S. Stillman (2007): “Moving to Opportunity,
Leaving Behind What? Evaluating the Initial Effects of a Migration Policy on
Incomes and Poverty in Source Areas,” mimeo.
Mincer, J. (1974): Schooling, experience, and earnings, Human behavior and so-
cial institutions, National Bureau of Economic Research; distributed by Columbia
University Press.
Nguyen, T. (2008): “Information, Role Models and Perceived Returns to Education:
Experimental Evidence from Madagascar,” mimeo.
Olson, L., H. White, and H. M. Shefrin (1979): “Optimal Investment in
Schooling When Incomes Are Risky,” Journal of Political Economy, 87, pp. 522–
539.
Padula, M. and L. Pistaferri (2001): “Education, Employment and Wage Risk,”
mimeo.
Romer, P. M. (1989): “Human Capital And Growth: Theory and Evidence,” NBER
Working Papers 3173, National Bureau of Economic Research, Inc.
Sacerdote, B. (2001): “Peer Effects With Random Assignment: Results For Dart-
mouth Roommates,” The Quarterly Journal of Economics, 116, 681–704.
Snow, A. and J. Warren, Ronald S. (1990): “Human Capital Investment and
38

Labor Supply Under Uncertainty,” International Economic Review, 31, pp. 195–
206.
Thistlethwaite, D. L. and D. T. Campbell (1960): “Regression-Discontinuity
Analysis: An Alternative to the Ex Post Facto Experiment,” Journal of Educational
Psychology, 51, 309–17.
Wilson, W. (1987): The Truly Disadvantaged: The Inner City, the Underclass, and
Public Policy, Sociology, urban studies, black studies, University Press.
Wiswall, M. and B. Zafar (2011): “Belief updating among college students:
evidence from experimental variation in information,” mimeo.
Zafar, B. (2011): “How Do College Students Form Expectations?” Journal of Labor
Economics, 29, pp. 3.01–348.
39

Figure 1: Probability of treatment as a function of the forcing variable
0.2
.4.6
.81
Tre
atm
ent p
roba
bilit
y
< -0.2 -0.2 to -0.1 -0.1 to 0 0 to 0.1 0.1 to 0.2 > 0.2
Notes: The forcing variable is normalized around the cut-off. Solid line indicates the cut-off,dashed lines indicate the sample “close” to the cut-off.
Figure 2: Baseline variables as a function of the forcing variable
1000
2000
3000
4000
5000
Inco
me
per
mon
th in
Rs.
< -0.2 -0.2 to -0.1 -0.1 to 0 0 to 0.1 0.1 to 0.2 > 0.2
5.2
5.4
5.6
5.8
66.
2H
ouse
hold
Siz
e
< -0.2 0.2 to 0.1 0.1 to 0 0 to 0.1 0.1 to 0.2 > 0.2
6466
6870
72M
arks
Gra
de 1
0 (S
SC
)
< -0.2 -0.2 to -0.1 -0.1 to 0 0 to 0.1 0.1 to 0.2 > 0.2
Notes: Solid line indicates the cut-off, dashed lines indicate the sample “close” to the cut-off.
40

Figure 3: Perceived returns to higher vs. lower secondary education
0.2
.4.6
.81
Tre
atm
ent p
roba
bilit
y
-.4
-.2
0.2
.4R
esid
ual E
[w|H
E]-
E[w
|SS
C] i
n 1,
000
Rs.
< -0.2 -0.2 to -0.1 -0.1 to 0 0 to 0.1 0.1 to 0.2 > 0.2
Notes: Residual differences (controlling for observables) between perceived average returns tohigher (HE) and secondary education (SSC) as a function of the forcing variable. Dashed lineshows the treatment probability.
Figure 4: Comparing perceived returns to actual (Mincerian) returns
010
0020
0030
0040
00M
onth
ly in
com
e in
Rs.
E[y|HE]-E[y|SSC] E[y|HE]-E[y|HSC] E[y|HSC]-E[y|SSC]
NSS2004 Fellows
Non-recipients Networks of fellows and non-rec.
Notes: Comparing perceived returns to higher (HE) vs lower secondary education (SSC) withactual Mincerian returns from the Indian National Sample Survey 2004, adjusted for annualinflation between 2004-2008; broken down by perceived gains from higher secondary (HSC) vslower secondary (SSC) as well as perceived gains from higher (HE) vs higher secondary education(HSC). Figures represent unconditional means.
41

Figure 5: Fellowship award and standard deviation of perceived returns
0.2
.4.6
.81
Tre
atm
ent p
roba
bilit
y
-1-.
50
.5R
esid
ual S
D[w
|HE
]-S
D[w
|SS
C] i
n 1,
000
Rs.
< -0.2 -0.2 to -0.1 -0.1 to 0 0 to 0.1 0.1 to 0.2 > 0.2
Notes: Residual differences (controlling for observables) between the standard deviation inperceived returns to higher (HE) and secondary (SSC) education as a function of the forcingvariable. Dashed line shows the treatment probability.
Figure 6: Fellowship award and perceived probability of obtaining different entrysalaries after graduation
-6-4
-20
24
6D
iffer
ence
in p
roba
bilit
y H
E-S
SC
0-5000 5001-10000 10001-15000 15001-20000 20001+Rs. per month
-6-4
-20
24
6D
iffer
ence
pro
babi
lity
in H
E-S
SC
0-5000 5001-10000 10001-15000 15001-20000 20000+Rs. per month
Notes: Perceived increase in wage outcomes after completing higher (HE) versus lower sec-ondary education (SSC) for different income bands, after partialling out individual-level charac-teristics. Left panel corresponds to the direct effect on recipients and non-recipients; right panelshows the indirect effects.
42

Figure 7: McCrary Test for manipulation around the cut-off
01
23
4
-.6 -.4 -.2 0 .2 .4Forcing variable
Discontinuity estimate (log difference in height): 0.7296 (0.2555)
Uttarakhand - Pooled
01
23
4
-1 -.5 0 .5Forcing variable
Discontinuity estimate (log difference in height): 0.0336 (0.1234)
Orissa - Pooled
02
46
-.6 -.4 -.2 0 .2 .4Forcing variable
Discontinuity estimate (log difference in height): 0.5035 (0.4148)
Uttarakhand - Batch 1 and 2
01
23
45
-.6 -.4 -.2 0 .2Forcing variable
Discontinuity estimate (log difference in height): 0.9160 (0.3554)
Uttarakhand - Batch 3 only
Notes: McCrary Test (2008). Testing the null hypothesis of continuity in the density of theforcing variable at the discontinuity point (solid line) for Uttarakhand (top left) and Orissa (topright) studies. The bottom two tests split up the Uttarakhand sample by batch. Standard errorsin parentheses.
43

Table 1: Baseline characteristics of applicants (Uttarakhand)
Full sample Cut-off samplePooled Fellow Fellow - N Fellow Fellow - N
non-fellow non-fellowGrade 10 marks 67.21 1.76*** 523 65.53 -0.22 318Income month (Rs.) 2214.2 -594.5*** 497 2440.49 81.52 298Household size 5.62 0.07 520 5.59 -0.01 316Age at application 17.51 -0.15 523 16.395 -0.029 318Caste: OBC 0.209 -0.01 522 0.220 0.042 318Caste: ST 0.078 0.02 522 0.093 0.031 318Caste: SC 0.145 0.03 522 0.174 0.037 318Owns house 0.797 0.02 523 0.784 -0.037 318
Notes: Balance tests for fellows and non-recipients for the cut-off sample and the full sample.All three batches are pooled. Column Fellow shows the means for the fellows and the columnDifference shows the difference in means between fellows and non-recipients. N is the numberof observations. * p < 0.1, ** p < 0.05, *** p < 0.01.
Table 2: Direct impact of fellowship reward on perceived returns (Uttarakhand)
Dependent variable: Ei[y|HE]− Ei[y|SSC](1) (2) (3) (4) (5)
Mean dep. var. 3.424 3.424 3.424 3.424 3.424
cutoff 0.744***(0.24)
fellow 1.275*** 1.258*** 1.233*** 1.369***(0.44) (0.45) (0.45) (0.49)
Estimation Sharp Fuzzy Fuzzy Fuzzy FuzzyForcing variable Linear Linear Quadratic Cubic QuarticControls Yes Yes Yes Yes YesFirst stage F -statistic - 27.34 27.27 26.17 28.10Observations 512 512 512 512 512
Notes: The direct impact of the fellowship reward on perceived returns to education, as measuredby the expected gain in 1,000 Rs ($16) from completing higher education (HE) vis-a-vis secondaryschool (SSC). Column 1 shows the sharp regression discontinuity design estimate where cutoffis an indicator variable taking the value 1 if the student is above the cut-off and 0 otherwise.Column 2 reports the fuzzy regression discontinuity estimate, where the actual fellowship reward(fellow) is instrumented by cutoff. Columns 3-5 report the fuzzy estimates allowing for a flexiblefunctional form for the forcing variable. The controls are: age, household size and caste dummies(OBC, SC, ST) and stream dummies (Arts, Science and Commerce). The unit of observation isthe student. Robust standard errors in parentheses, clustered at the school-level. * p < 0.1, **p < 0.05, *** p < 0.01.
44

Table 3: Fellowship and standard deviation of perceived returns (Uttarakhand)
Dependent variable: SDi[y|HE]− SDi[y|SSC](1) (2) (3) (4) (5)
Mean dep. var. -0.169 -0.169 -0.169 -0.169 -0.169
cutoff -0.631***(0.17)
fellow -1.081*** -1.093*** -1.107*** -1.164***(0.23) (0.24) (0.25) (0.28)
Estimation Sharp Fuzzy Fuzzy Fuzzy FuzzyForcing variable Linear Linear Quadratic Cubic QuarticControls Yes Yes Yes Yes YesFirst stage F -statistic - 27.34 27.27 26.17 28.10Observations 512 512 512 512 512
Notes: The direct impact of the fellowship reward on the standard deviation (SD) of perceivedreturns, as measured by the expected change in standard deviation in 1,000 Rs. ($16) fromcompleting higher education (HE) vis-a-vis secondary school (SSC). Column 1 shows the sharpregression discontinuity design estimate where cutoff is an indicator variable taking the value 1if the student is above the cut-off and 0 otherwise. Column 2 report the fuzzy regression dis-continuity estimate, where actual fellowship reward (fellow) is instrumented by cutoff. Columns3-5 report the fuzzy estimates allowing for a flexible functional form for the forcing variable.The controls are: age, household size and caste dummies (OBC, SC, ST) and stream dummies(Arts, Science and Commerce). The unit of observation is the student. Robust standard errorsin parentheses, clustered at the school-level. * p < 0.1, ** p < 0.05, *** p < 0.01.
45

Table 4: Peer effects on perceived returns of those in the networks - Cutoff sample(Uttarakhand)
Panel A: Dep. var. (1) (2) (3) (4)Ei[y|HE]− Ei[y|SSC] Direct Indirect (Networks)
Applicants Pooled Friends ExogenousMean of dep. variable 3.501 2.419 2.417 2.422
fellow 0.942*** 0.274 0.352 0.210(0.29) (0.20) (0.24) (0.25)
Specification Fuzzy Fuzzy Fuzzy FuzzyForcing variable No No No NoControls Yes Yes Yes YesFirst stage F -statistic 97.81 268.7 281.8 219.9Observations 312 575 262 313
Panel B: Dep. var. (5) (6) (7) (8)SDi[y|HE]− SDi[y|SSC] Direct Indirect (Networks)
Applicants Pooled Friends ExogenousMean of dep. variable -0.250 1.090 1.117 1.067
fellow -0.902*** 0.235* 0.292* 0.182(0.17) (0.13) (0.16) (0.15)
Specification Fuzzy Fuzzy Fuzzy FuzzyForcing variable No No No NoControls Yes Yes Yes YesFirst stage F -statistic 97.81 268.7 281.8 219.9Observations 312 575 262 313
Notes: Peer effects of exposure to recipients vs. non-recipients on the perceived returns (meanand standard deviation (SD)) of those in the networks. For comparison, Column 1 and 5 reportfuzzy estimates of the direct impact of the fellowship on recipients vs. non-recipients (Table2 and Table 3) estimated around the cut-off. Panel A: Pooled effect on perceived returns ofthose in the networks of fellows around the cut-off, as measured by the expected gain in 1,000Rs ($16) from completing HE vis-a-vis SSC. Column 2-4 repeat the estimation for the indirecteffect around the cut-off for all peers (Column 2), friends (Column 3) and siblings and neighbours(Column 4). Panel B: Pooled effects on the standard deviation (SD) of perceived returns of thosein the networks of fellows around the cut-off, as measured by the expected change in standarddeviation in 1,000 Rs. ($16) from completing higher education (HE) vis-a-vis secondary school(SSC). Column 6-8 repeat the estimation for the indirect effects on the standard deviation aroundthe cut-off. Column 7 confines the sample to only friends and Column 8 restricts the sampleto exogenously determined peers, which are siblings and neighbors. The control variables are:age, household size and caste dummies (OBC, SC, ST) and stream dummies (Arts, Science andCommerce). Robust standard errors in parentheses, clustered at the role model level (fellow/non-recipients). *** p < 0.01. p < 0.1, ** p < 0.05, *** p < 0.01.
46

Table 5: Peer effects on factual knowledge about fellowship and intention to applyin the networks - Cutoff sample (Uttarakhand)
Dep. var. (1) (2) (3)Knowledge and Indirect (Networks)
intention to apply Knowledge Knows Plans tofellowship funding apply
Mean of dep. variable 0.195 0.273 0.492
fellow 0.045* 0.092** 0.128**(0.02) (0.05) (0.06)
Specification Fuzzy Fuzzy FuzzyForcing variable No No NoControls Yes Yes YesFirst stage F -statistic 268.8 268.7 268.7Observations 575 575 575
Notes: Peer effects of exposure to recipients vs. non-recipient on measures of knowledge aboutthe fellowship and intention to apply. Knowledge about the fellowship is measured by a compositescore between 0 (lowest) and 1 (highest) and estimated around the cut-off (Column 1). Column(2) estimates the effect on whether the peer knows at least one alternative source of funding(other than the fellowship under study). Column (3) reports the effect on the intention to applyto the fellowship. The control variables are: age, household size and caste dummies (OBC, SC,ST) and stream dummies (Arts, Science and Commerce). Robust standard errors in parentheses,clustered at the role model level (fellow/non-recipient). *** p < 0.01. p < 0.1, ** p < 0.05, ***p < 0.01.
47

Table 6: External validity - Direct results across both study sites
Panel A (1) (2) (3)Dependent var. Uttarakhand OrissaEi[y|HE]− Ei[y|SSC] Girls Pooled GirlsMean dep. var. 3.424 5.373 5.216
fellow 1.369*** 1.690** 2.173**(0.49) (0.80) (1.08)
Specification Fuzzy Fuzzy FuzzyForcing Quartic Quartic QuarticControls Yes Yes YesFirst stage F -statistic 28.10 58.58 34.75Observations 512 550 265
Panel B (4) (5) (6)Dependent var. Uttarakhand OrissaSDi[y|HE]− SDi[y|SSC] Girls Pooled GirlsMean dep. var. -0.169 1.796 1.853
fellow -1.164*** -0.151 -0.690(0.28) (0.47) (0.60)
Specification Fuzzy Fuzzy FuzzyForcing Quartic Quartic QuarticControls Yes Yes YesFirst stage F -statistic 28.10 58.58 34.75Observations 512 550 265
Notes: Comparing the effect of the fellowship on perceived returns to education (mean andstandard deviation (SD)) across Uttarakhand and Orissa study sites. The program effect isestimated using the same empirical strategy and specification (See Section 4.1 and 4.2). PanelA shows the effect of the fellowship on expected returns from completing higher education (HE)vis-a-vis lower secondary school (SSC). Panel B shows the standard deviation of the expectedreturns. fellow is a dummy variable that indicates whether the student is above or below thecut-off (sharp regression design) or the actual treatment instrumented by the cut-off (fuzzyregression design). All specifications use quartic polynomials to flexibly control for the forcingvariable. The control variables are: age, household size and caste dummies (OBC, SC, ST) andstream dummies (Arts, Science and Commerce). The unit of observation is the student. Robuststandard errors in parentheses, clustered at the school-level. In 1,000 Rs ($16). * p < 0.1, **p < 0.05, *** p < 0.01.
48

Table 7: External validity - Peer effects on perceived returns of those in the networks
Panel A (1) (2) (3)Dep. var. Uttarakhand OrissaEi[y|HE]− Ei[y|SSC] Girls Pooled GirlsMean of dep. variable 2.419 5.282 5.255
fellow 0.274 0.194 -0.247(0.20) (0.67) (0.69)
Specification Fuzzy Fuzzy FuzzyForcing variable No Quartic QuarticControls Yes Yes YesFirst stage F -statistic 268.7 48.38 27.49Observations 575 886 416
Panel B (4) (5) (6)Dep. var. Uttarakhand OrissaSDi[y|HE]− SDi[y|SSC] Girls Pooled GirlsMean of dep. variable 1.090 1.980 1.929
fellow 0.235* 0.014 0.095(0.13) (0.31) (0.42)
Specification Fuzzy Fuzzy FuzzyForcing variable No Quartic QuarticControls Yes Yes YesFirst stage F -statistic 268.7 48.38 27.49Observations 575 886 416
Notes: Comparing the peer effects on perceived returns to education (mean and standard devi-ation) across Uttarakhand Site and Orissa Site. The program effect is estimated using the sameempirical strategy and specification. Panel A reports the peer effects of exposure to recipientsvs. non-recipient on perceived returns of fellows around the cut-off, as measured by the expectedgain in 1,000 Rs ($16) from completing HE vis-a-vis SSC. Panel B repeats the estimation usingthe expected change in the standard deviation in perceived returns. fellow is a dummy variablethat indicates whether the student is above or below the cut-off (sharp regression design) orthe actual treatment instrumented by the cut-off (fuzzy regression design). For Uttarakhand,the sample is confined to students around the cut-off. Orissa includes the full sample and usesquartic polynomials to flexibly control for the forcing variable. The control variables are: age,household size and caste dummies (OBC, SC, ST) and stream dummies (Arts, Science and Com-merce). The unit of observation is the student. Robust standard errors in parentheses, clusteredat the school-level. In 1,000 Rs ($16). * p < 0.1, ** p < 0.05, *** p < 0.01.
49
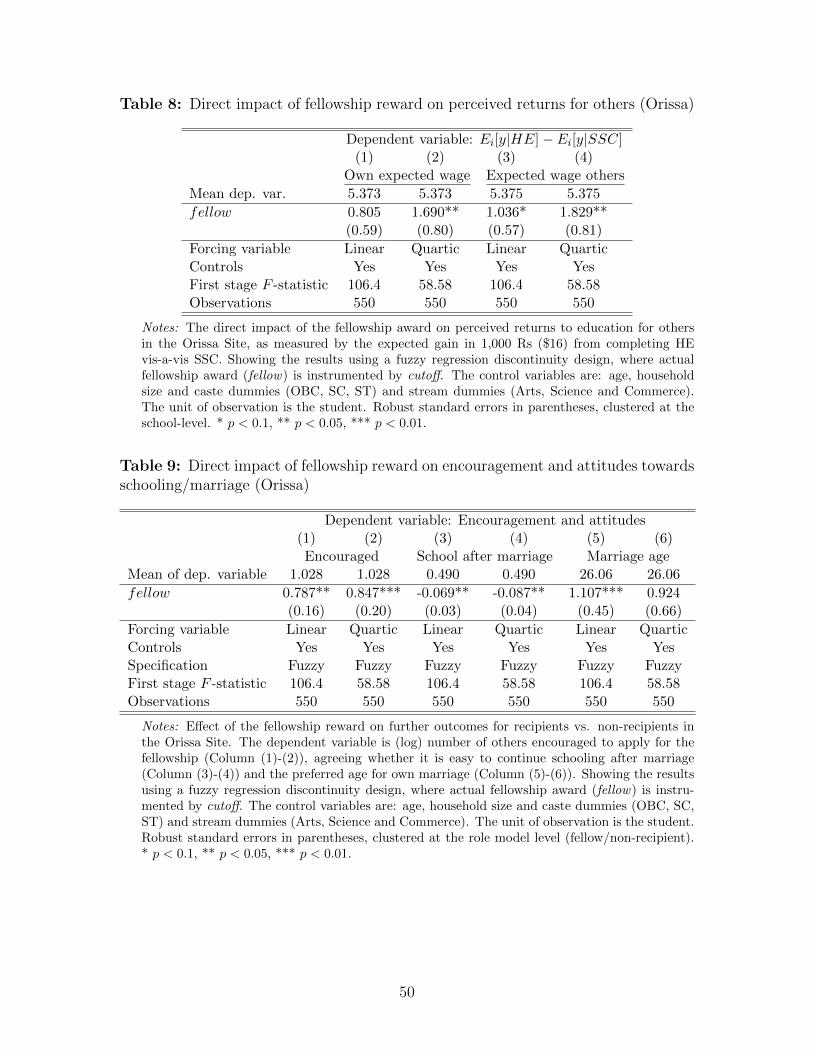
Table 8: Direct impact of fellowship reward on perceived returns for others (Orissa)
Dependent variable: Ei[y|HE]− Ei[y|SSC](1) (2) (3) (4)
Own expected wage Expected wage others
Mean dep. var. 5.373 5.373 5.375 5.375
fellow 0.805 1.690** 1.036* 1.829**(0.59) (0.80) (0.57) (0.81)
Forcing variable Linear Quartic Linear QuarticControls Yes Yes Yes YesFirst stage F -statistic 106.4 58.58 106.4 58.58Observations 550 550 550 550
Notes: The direct impact of the fellowship award on perceived returns to education for othersin the Orissa Site, as measured by the expected gain in 1,000 Rs ($16) from completing HEvis-a-vis SSC. Showing the results using a fuzzy regression discontinuity design, where actualfellowship award (fellow) is instrumented by cutoff. The control variables are: age, householdsize and caste dummies (OBC, SC, ST) and stream dummies (Arts, Science and Commerce).The unit of observation is the student. Robust standard errors in parentheses, clustered at theschool-level. * p < 0.1, ** p < 0.05, *** p < 0.01.
Table 9: Direct impact of fellowship reward on encouragement and attitudes towardsschooling/marriage (Orissa)
Dependent variable: Encouragement and attitudes(1) (2) (3) (4) (5) (6)Encouraged School after marriage Marriage age
Mean of dep. variable 1.028 1.028 0.490 0.490 26.06 26.06
fellow 0.787** 0.847*** -0.069** -0.087** 1.107*** 0.924(0.16) (0.20) (0.03) (0.04) (0.45) (0.66)
Forcing variable Linear Quartic Linear Quartic Linear QuarticControls Yes Yes Yes Yes Yes YesSpecification Fuzzy Fuzzy Fuzzy Fuzzy Fuzzy FuzzyFirst stage F -statistic 106.4 58.58 106.4 58.58 106.4 58.58Observations 550 550 550 550 550 550
Notes: Effect of the fellowship reward on further outcomes for recipients vs. non-recipients inthe Orissa Site. The dependent variable is (log) number of others encouraged to apply for thefellowship (Column (1)-(2)), agreeing whether it is easy to continue schooling after marriage(Column (3)-(4)) and the preferred age for own marriage (Column (5)-(6)). Showing the resultsusing a fuzzy regression discontinuity design, where actual fellowship award (fellow) is instru-mented by cutoff. The control variables are: age, household size and caste dummies (OBC, SC,ST) and stream dummies (Arts, Science and Commerce). The unit of observation is the student.Robust standard errors in parentheses, clustered at the role model level (fellow/non-recipient).* p < 0.1, ** p < 0.05, *** p < 0.01.
50

Table 10: Spill-overs on perceived returns (mean and SD) for parents (Orissa)
Panel A (1) (2) (3) (4)Parental perceived returns Ei[y|HE]− Ei[y|SSC] SDi[y|HE]− SDi[y|SSC]
Own Other Own OtherMean of dep. variable 4.881 4.881 1.888 1.914
fellow 1.255*** 2.026*** 0.931** 0.826**(0.83) (1.04) (0.48) (0.43)
Forcing variable Quartic Quartic Quartic QuarticControls Yes Yes Yes YesSpecification Fuzzy Fuzzy Fuzzy FuzzyFirst stage F -statistic 43.48 46.10 43.48 46.10Observations 423 443 423 443
Panel B (5) (6) (7) (8)Parental attitudes Education for all Role model Delay marriage
Mean of dep. variable 0.734 0.734 0.645 0.586
fellow 0.184** 0.285** 0.150** 0.061(0.09) (0.13) (0.07) (0.07)
Forcing variable Linear Quartic Quartic QuarticControls Yes Yes Yes YesSpecification Fuzzy Fuzzy Fuzzy FuzzyFirst stage F -statistic 90.67 46.10 46.10 46.10Observations 443 443 443 443
Notes: The indirect impact of the fellowship award on perceived returns of parents in the OrissaSite for own children and children of others, as measured in change in mean and standarddeviation in 1,000 Rs (Panel A). Panel B: Effect of the fellowship reward on attitudes of parentsof recipients vs. non-recipients. The dependent variable is “All my children should follow thehighest education possible” (0: disagree, 1: agree) in Column (5), “If the oldest child is successfulin school, the younger children should follow” (Column 7) and “My children should postponemarriage until they have completed their education” (Column 8). All specifications use a fuzzyregression discontinuity design, where the actual fellowship award is instrumented using thecut-off. The control variables are: age, household size and caste dummies (OBC, SC, ST) andstream dummies (Arts, Science and Commerce). The unit of observation is the student. Robuststandard errors in parentheses, clustered at the school level. * p < 0.1, ** p < 0.05, *** p < 0.01.
51

Online appendix: Robustness checks - Not for publication
Table A1: Summary statistics of baseline student characteristics
PercentileMean SD 25% Median 75 % N
Grade 10 marks 66.404 5.546 62 65 70 523Income per month (Rs.) 2478.64 1613.395 1500 2000 3000 497Household size 5.588 1.451 5 5 6 520Age at application 16.411 0.867 16 16 17 523Caste: OBC 0.501 0.500 0 1 1 522Caste: ST 0.068 0.253 0 0 0 522Caste: SC 0.130 0.336 0 0 0 522Owns house 0.787 0.409 1 1 1 523
Notes: Descriptive statistics (mean, standard deviation (SD) and percentiles) for baselinestudent characteristics. Castes are grouped into Other Backward Castes (OBC), ScheduledTribes (ST), Scheduled Caste (SC).
Table A2: Baseline characteristics of planned and realized sample
Panel A: Pooled Uttarakhand Planned sample (1) Actual Sample (2) Diff (1)-(2)
Grade 10 marks 66.03 66.42 -0.38(N=1095) (0.22) (0.24) (0.33)Income month 2473.22 2477.96 -4.74(N=1043) (68.20) (72.24) (99.35)Household size 5.63 5.58 0.04(N=1090) (0.06) (0.06) (0.08)
Panel B: Pooled Orissa
Grade 10 marks 73.35 71.71 1.64***(N=1593) (0.40) (0.29) (0.50)Income month 3310.56 3178.54 132.01(N=1609) (77.28) (74.92) (107.64)
Notes: Testing for non-response bias in the recipients/non-recipients sample for both study sites.Showing differences in baseline characteristics between planned and realized sample: pooled andbroken down by batches. * p < 0.1, ** p < 0.05, *** p < 0.01.
52

Table A3: Baseline characteristics of those in their networks (Uttarakhand)
Full samplePooled Fellow Fellow-Non fellow NLast year marks 61.446 0.099 523Household size 5.94 0.17 575Age 14.403 0.079 581Caste: OBC 0.196 -0.036 581Caste: ST 0.053 0.005 581Caste: SC 0.149 -0.016 581Owns house 0.79 -0.04 575
Notes: Balance test for those in the networks of fellows and non-recipients (applicants) for thecut-off sample. Column Fellows shows the means for the fellows and the column Difference showsthe difference in means between fellows and non-recipients. N is the number of observations. *p < 0.1, ** p < 0.05, *** p < 0.01.
Table A4: Testing equality of distributions in baseline variables (p-values)
Testing for equality of distributionsPanel A: Pooled Uttarakhand Cut-off (1) Full sample (2)
Grade 10 marks 0.735 0.007***(N=523)Income month 0.146 0.016**(N=497)Household size 0.998 0.979(N=520)
Panel B: Pooled Orissa
Grade 10 marks 0.902 0.000***(N=544)Income month 0.347 0.329(N=548)
Notes: Kolmogorov-Smirnov Test for equality of distributions in the baseline variables betweenrecipients and non-recipients; the test is conducted for the restricted sample around the cut-off(1) and for the full sample of all respondents (2), broken down by batches and pooled acrossall three years. p-values of the tests reported. Samples drawn from the same distribution. *p < 0.1, ** p < 0.05, *** p < 0.01.
53

Table A5: Perceived returns - Alternative measure of dispersion I
[Pr(ymax|HE)− Pr(ymin|HE)]− [Pr(ymax|SSC)− Pr(ymin|SSC)]Panel A: Uttarakhand (1) (2) (3) (4)Mean of dep. var. 29.198 29.198 29.198 29.198
fellow 10.388*** 10.253*** 10.255*** 11.544***(3.34) (3.33) (3.32) (3.66)
Estimation Fuzzy Fuzzy Fuzzy FuzzyForcing Linear Quadratic Cubic QuarticControls Yes Yes Yes YesFirst stage F -statistics 27.34 27.27 26.17 28.10Observations 512 512 512 512
Panel B: Orissa (5) (6) (7) (8)Mean of dep. var. 51.403 51.403 51.403 51.403
fellow -1.371 4.753 4.214 2.976(4.89) (6.47) (6.53) (6.80)
Estimation Fuzzy Fuzzy Fuzzy FuzzyForcing Linear Quadratic Cubic QuarticControls Yes Yes Yes YesFirst stage F -statistics 106.38 78.60 64.89 58.58Observations 550 550 550 550
Notes: Impact of the fellowship award on the dispersion of perceived returns to education,using the range between the probability of earnings falling in the highest income band and theprobability of earnings falling in the lowest income band for higher education, higher secondaryand lower secondary education. Percentage points (100 is 100%). The treatment variable isfellows, instrumented by cutoff (Fuzzy RD). * p < 0.1, ** p < 0.05, *** p < 0.01.
54

Table A6: Perceived returns - Alternative measure of dispersion II
Signal to Noise Ratio E[y|HE]/SD[y|HE]− E[y|SSC]/SD[y|SSC]Panel A: Uttarakhand (1) (2) (3) (4)Mean of dep. var. 0.080 0.080 0.080 0.080
fellow 0.063*** 0.062*** 0.063*** 0.069***(0.01) (0.01) (0.01) (0.01)
Estimation Fuzzy Fuzzy Fuzzy FuzzyForcing Linear Quadratic Cubic QuarticControls Yes Yes Yes YesFirst stage F -statistics 27.34 27.27 26.17 28.10Observations 512 512 512 512
Panel B: Orissa (5) (6) (7) (8)Mean of dep. var. 1.089 1.089 1.089 1.089
fellow -0.020 0.258 0.251 0.210(0.16) (0.21) (0.22) (0.23)
Estimation Fuzzy Fuzzy Fuzzy FuzzyForcing Linear Quadratic Cubic QuarticControls Yes Yes Yes YesFirst stage F -statistics 97.95 77.85 64.37 59.13Observations 530 530 530 530
Notes: Impact of the fellowship award on the variance of perceived returns to education, usingsignal-to-noise ratio (mean over standard deviation of perceived returns). Robust standard errorsin parentheses, clustered at the school-level. Percentage points (100 is 100%). Depending on thespecification, the treatment variable is either cutoff (OLS, and Cut-off) or fellow, instrumentedby cutoff (IV). * p < 0.1, ** p < 0.05, *** p < 0.01.
55

Table A7: First-stage: Fellowship award and cut-off (Uttarakhand)
Dep. var. Fellowship award(1) (2) (3) (4)
Mean of dep. var. 0.535 0.535 0.535 0.535Cutoff 0.583*** 0.589*** 0.573*** 0.554***
(0.11) (0.11) (0.11) (0.10)Forcing variable Linear Quadratic Cubic QuarticControls Yes Yes Yes YesFirst stage F -statistic 27.34 27.27 26.17 28.10Observations 512 512 512 512
First-stage of the fuzzy regression discontinuity design (which instruments theactual fellowship award with the cutoff). Using the same specification as in themain specifications of the paper. *** p<0.01, ** p<0.05, * p<0.1
56

Table A8: Perceived returns (mean), monotone only
Ei[y|HE]− Ei[y|SSC]: Monotone onlyPanel A: Uttarakhand (1) (2) (3) (4)Mean dep. var. 3.357 3.357 3.357 3.357
fellow 1.080*** 1.031*** 0.960* 1.059***(0.49) (0.49) (0.50) (0.53)
Estimation Fuzzy Fuzzy Fuzzy FuzzyForcing variable Linear Quadratic Cubic QuarticControls Yes Yes Yes YesFirst stage F -statistics 26.228 26.220 26.342 28.781Observations 396 396 396 396
Panel B: Orissa (7) (8) (9) (10)Mean dep. var. 5.368 5.368 5.368 5.368
fellow 0.243 1.059 1.097 0.910(0.57) (0.69) (0.71) (0.74)
Estimation Fuzzy Fuzzy Fuzzy FuzzyForcing variable Linear Quadratic Cubic QuarticControls Yes Yes Yes YesFirst stage F -statistics 87.89 65.68 54.65 50.10Observations 486 486 486 486
Notes: Excluding respondents who failed to recognize the principle of monotonicity whentested on basic probabilities. The direct impact of the fellowship award on perceived returns toeducation, as measured by the expected gain in 1,000 Rs ($16) from completing HE vis-a-visSSC, Ei[y|HE]−Ei[y|SSC]. The unit of observation is the student. Robust standard errors inparentheses, clustered at the school-level. * p < 0.1, ** p < 0.05, *** p < 0.01.
57

Table A9: Perceived returns (SD), monotone only
SDi[y|HE]− SDi[y|SSC]: Monotone onlyPanel A: Uttarakhand (1) (2) (3) (4)Mean dep. var. -0.148 -0.148 -0.148 -0.148
fellow -0.967*** -0.970*** -0.988*** -1.009***(0.28) (0.28) (0.30) (0.32)
Estimation Fuzzy Fuzzy Fuzzy FuzzyForcing variable Linear Quadratic Cubic QuarticControls Yes Yes Yes YesFirst stage F -statistics 26.228 26.220 26.342 28.781Observations 396 396 396 396
Panel B: Orissa (7) (8) (9) (10)Mean dep. var. 1.808 1.808 1.808 1.808
fellow -0.159 -0.259 -0.233 -0.200(0.32) (0.43) (0.44) (0.46)
Estimation Fuzzy Fuzzy Fuzzy FuzzyForcing variable Linear Quadratic Cubic QuarticControls Yes Yes Yes YesFirst stage F -statistics 87.89 65.68 54.65 50.10Observations 486 486 486 486
Notes: Excluding respondents who failed to recognize the principle of monotonicity when testedon basic probabilities. The direct impact of the fellowship award on the standard deviation ofexpected wage, as measured by the difference between SDi[y|HE] and SDi[y|SSC] in 1,000 Rs($16). The unit of observation is the student. Robust standard errors in parentheses, clusteredat the school-level. * p < 0.1, ** p < 0.05, *** p < 0.01.
58

Table A10: Alternative construction of perceived returns
Ei[y|HE]− Ei[y|SSC] alternative constructionPanel A: Uttarakhand (1) (2) (3)
Lower Upper MiddleMean of dep. Variable 3.423 3.423 3.423
fellow 1.369*** 1.379*** 1.374***(0.49) (0.49) (0.49)
Estimation Fuzzy Fuzzy FuzzyForcing Quartic Quartic QuarticControls Yes Yes YesFirst stage F -statistic 28.10 28.10 28.10Observations 512 512 512
Panel B: Orissa Lower Upper MiddleMean of dep. Variable 5.372 5.371 5.370
fellow 1.690** 1.698** 1.706**(0.80) (0.49) (0.81)
Estimation Fuzzy Fuzzy FuzzyForcing Quartic Quartic QuarticControls Yes Yes YesFirst stage F -statistic 58.58 58.58 58.58Observations 550 550 550
Notes: Alternative construction of perceived returns to education based on the lower, middleand upper bin of each income category (using 25, 000 Rs for the last bin in which > 20, 000 Rs).The unit of observation is the student. Robust standard errors in parentheses, clustered at theschool-level. * p < 0.1, ** p < 0.05, *** p < 0.01.
59

Table A11: Perceived returns (Mean), excluding batch 3 (Uttarakhand)
Ei[y|HE]− Ei[y|SSC]: Excluding batch 3(1) (2) (3) (4)
Mean dep. var. 3.379 3.375 3.375 3.375
fellow 1.332*** 1.327*** 1.463* 1.506***(0.44) (0.43) (0.50) (0.55)
Estimation Fuzzy Fuzzy Fuzzy FuzzyForcing variable Linear Quadratic Cubic QuarticControls Yes Yes Yes YesFirst stage F -statistic 48.18 51.80 31.79 32.52Observations 367 367 367 367
Notes: Robustness of our main results to the exclusion of batch 3, for which we reject theMcCrary test of the absence of endogenous sorting around the cut-off. We measure the directimpact of the fellowship award on perceived returns to education, as measured by the expectedgain in 1,000 Rs ($16) from completing HE vis-a-vis SSC, Ei[y|HE]− Ei[y|SSC]. Showing theresults using a fuzzy regression discontinuity design, where actual fellowship award (fellow) isinstrumented by cutoff with varying flexibility of the forcing function. The unit of observationis the student. Robust standard errors in parentheses, clustered at the school-level. * p < 0.1,** p < 0.05, *** p < 0.01.
Table A12: Perceived returns (SD), excluding batch 3 (Uttarakhand)
SDi[y|HE]− SDi[y|SSC]: Excluding batch 3(1) (2) (3) (4)
Mean dep. var. -0.083 -0.083 -0.083 -0.083
fellow -0.972*** -0.979*** -1.002*** -1.016***(0.21) (0.20) (0.23) (0.26)
Estimation Fuzzy Fuzzy Fuzzy FuzzyForcing variable Linear Quadratic Cubic QuarticControls Yes Yes Yes YesFirst stage F -statistic 48.18 51.80 31.79 32.52Observations 367 367 367 367
Notes: Excluding batch 3 given the evidence of manipulation around the cut-off. The directimpact of the fellowship award on the standard deviation of expected wage, as measured by thedifference between SD[HE] and SD[SSC] in 1,000 Rs ($16). Showing the results using a fuzzyregression discontinuity design, where actual fellowship award (fellow) is instrumented by cutoffand allowing the forcing variable to take a flexible functional form. The unit of observation isthe student. Robust standard errors in parentheses, clustered at the school-level. * p < 0.1, **p < 0.05, *** p < 0.01.
60

Table A13: Returns to education using point estimate (Orissa)
Dependent variable: Ei[y|HE]− Ei[y|SSC]Panel A (1) (2) (3) (4) (5) (6)Direct effect Own returns Others
Distribution Point estimate Distribution Point estimateOverall Overall Girls Overall Overall Girls
Mean dep. var. 5.372 7.395 6.854 5.375 7.197 6.703
fellow 1.690*** 3.391*** 2.491* 1.829*** 2.076* 2.716***(0.61) (1.15) (0.87) (0.65) (1.02) (0.42)
Forcing variable Quartic Quartic Quartic Quartic Quartic QuarticControls Yes Yes Yes Yes Yes YesFirst stage F -statistic 58.58 58.58 34.76 58.58 58.58 34.76Observations 550 550 265 550 550 265
Panel B (7) (8) (9) (10) (11) (12)On networks Distribution Point estimate Distribution Point estimate
Overall Overall Girls Overall Overall GirlsMean dep. var. 5.280 5.655 5.909 5.275 5.563 5.755
fellow 0.180 -1.006*** -0.247 -0.279 -0.496 0.197(0.00) (0.37) (0.68) (0.38) (0.62) (1.14)
Forcing variable Quartic Quartic Quartic Quartic Quartic QuarticControls Yes Yes Yes Yes Yes YesFirst stage F -statistic 48.37 48.37 27.49 48.37 48.37 27.49Observations 887 887 416 887 887 416
Panel C (13) (14) (15) (16) (17) (18)On parents Own returns Others
Distribution Point estimate Distribution Point estimateOverall Overall Girls Overall Overall Girls
Mean dep. var. 4.881 5.954 5.917 5.128 5.673 5.841
fellow 1.162*** 2.496** 1.541 1.951*** 2.745* 1.467(0.26) (1.15) (1.02) (0.64) (1.47) (1.58)
Forcing variable Quartic Quartic Quartic Quartic Quartic QuarticControls Yes Yes Yes Yes Yes YesFirst stage F -statistic 43.48 46.10 16.33 46.10 46.10 16.33Observations 423 443 217 443 443 217
Notes: Replicating main results of increased expected gain to completing HE vis-a-vis SSC usingpoint estimates instead of the expected value derived from the elicited probability distribution.All results are estimated using Fuzzy RD with full set of controls and flexible forcing variable.Panel A shows the results for the direct effect on fellowship recipients and non-recipients. PanelB shows the indirect impact on those in their networks. Panel C shows the effect on parents ofrecipients and non-recipients. As a comparison, Columns (1), (7) and (13) report the estimatesbased on the measure of expected gain derived from the elicited distribution. Robust standarderrors in parentheses, clustered at the cohort-level. * p < 0.1, ** p < 0.05, *** p < 0.01.
61

Table A14: Testing smoothness of covariates around cut-off - Seemingly UnrelatedRegression (SUR)
Baseline covariates(1) (2)
Cutoff SEMarks grade 10 -1.131 0.97Age at application -0.134 0.171Income (Rs.) 367.52 302.09Household Size 0.137 0.23Other backward caste 0.030 0.082Scheduled caste 0.078 0.068Scheduled tribe 0.027 0.052Owns house 0.015 0.079Observations: 494Quartic polynomial, Sharp RDDJoint significance H0: Cutoff= 0: p-value=0.484
Notes: Testing for the presence of a discontinuity in baseline covariates, as proposed by Leeand Lemieux (2010). Column 1 reports the point estimate for the cut-off dummy. Column2 reports the corresponding standard error. The p-value of the joint significance test for thecut-off dummy is reported at the bottom of the table. Robust standard errors clustered at theschool-level. *** p<0.01, ** p<0.05, * p<0.1
Table A15: Testing equality of sharp vs. fuzzy estimates of perceived returns
(1) (2) (3)Outcome variable Sharp Fuzzy Diff (1)-(2)E[y|HE]-E[y|SSC] 759.54*** 1,369.053*** -0.609**
(0.26) (0.49) (0.30)SD[y|HE]-SD[y|SSC] -645.55*** -1.163*** 0.518***
(0.18) (0.28) (0.18)
Notes: Comparing the RDD estimates using sharp and fuzzy regression discontinuity design.Column 3 tests whether the difference between both estimates is statistically significant. Robuststandard errors clustered at the school-level. *** p < 0.01, ** p < 0.05, * p < 0.1
62

Table A16: Earning probabilities by education and award status
(1) (2) (3) (4) (5)Income bins (in 1,000 Rs.) 0 to 5 5 to 10 10 to 15 15 to 20 ≥ 20SSC (Grade 10)Non-recipients 44.705 25.743 16.415 9.402 3.830
(0.64) (0.32) (0.27) (0.31) (0.40)Recipients - Non-recipients 0.051 -0.693 -0.591 0.282 0.883
(0.88) (0.44) (0.37) (0.42) (0.54)Observations 520 520 520 520 520
HSC (Grade 12)Non-recipients 33.237 24.734 19.199 14.017 8.929
(0.64) (0.32) (0.27) (0.31) (0.40)Recipients - Non-recipients -0.519 0.121 -0.844** -0.158 1.357**
(0.88) (0.44) (0.37) (0.42) (0.54)Observations 517 517 517 517 517
HE (Grade 12+)Non-recipients 27.552 23.664 20.050 16.357 12.465
(0.64) (0.32) (0.27) (0.31) (0.40)Recipients - Non-recipients -3.255*** -1.366*** -0.221 1.403*** 3.721***
(0.88) (0.44) (0.37) (0.42) (0.54)Observations 516 516 516 516 516
Notes: Descriptive statistics of elicited subjective probabilities of receiving an entry salaryin given income bin. Reporting mean for non-recipients and difference between recipients andnon-recipients. * p < 0.1, ** p < 0.05, *** p < 0.01.
63

Table A17: Breakdown of perceived returns (mean), level and difference
Dependent variable: Perceived returns (mean), level and difference(1) (2) (3) (4) (5) (6)
HE-SSC HE SSC HE-SSC HE SSCMean of dep. var 3.424 11.46 7.780 3.424 11.46 7.780cutoff 0.760*** 0.582** -0.253
(0.26) (0.27) (0.16)fellow 1.369*** 1.049** -0.453
(0.49) (0.48) (0.29)Observations 512 512 516 512 512 516Controls Yes Yes Yes Yes Yes YesForcing Quartic Quartic Quartic Quartic Quartic QuarticSpecification Sharp Sharp Sharp Fuzzy Fuzzy FuzzyFirst stage F -stat - - - 28.10 28.10 28.37
Notes: Robust standard errors clustered at the school-level. *** p<0.01, ** p<0.05, * p<0.1
Table A18: Breakdown of perceived returns (SD), level and difference
Dependent variable: Perceived returns (SD), level and difference(1) (2) (3) (4) (5) (6)
HE-SSC HE SSC HE-SSC HE SSCMean of dep. var -0.169 6.661 6.830 -0.169 6.661 6.830cutoff -0.646*** -0.135 0.511***
(0.19) (0.09) (0.16)fellow -1.164*** -0.243* 0.921***
(0.28) (0.14) (0.26)Observations 512 512 512 512 512 512Controls Yes Yes Yes Yes Yes YesForcing Quartic Quartic Quartic Quartic Quartic QuarticSpecification Sharp Sharp Sharp Fuzzy Fuzzy FuzzyFirst stage F -stat - - - 28.10 28.10 28.10
Notes: Robust standard errors clustered at the school-level. *** p<0.01, ** p<0.05, * p<0.1
64

Figure A1: McCrary Test for manipulation around the cut-off
01
23
4
-.6 -.4 -.2 0 .2 .4Forcing variable
Discontinuity estimate (log difference in height): 0.7296 (0.2555)
Uttarakhand - Pooled
01
23
4
-1 -.5 0 .5Forcing variable
Discontinuity estimate (log difference in height): 0.0336 (0.1234)
Orissa - Pooled
02
46
-.6 -.4 -.2 0 .2 .4Forcing variable
Discontinuity estimate (log difference in height): 0.5035 (0.4148)
Uttarakhand - Batch 1 and 2
01
23
45
-.6 -.4 -.2 0 .2Forcing variable
Discontinuity estimate (log difference in height): 0.9160 (0.3554)
Uttarakhand - Batch 3 only
Notes: McCrary Test (2008). Testing the null hypothesis of continuity in the density of theforcing variable at the discontinuity point (solid line) for Uttarakhand (top left) and Orissa (topright) studies. The bottom two tests split up the Uttarakhand sample by batch. Standard errorsin parentheses.
65

A Appendix A: Robustness Checks
A.1 Social Desirability, Preference Bias and Probabilities
One concern with our results is that our estimates are biased since respondents may
have tried to provide the socially desirable response to our survey questions on returns
to education.44 We argue that this is unlikely to be driving our results. First, our
survey was conducted by an independent market research team, unrelated to the NGO
that was distributing the awards. Moreover, the study was framed as being related to
trends in education in the region, as opposed to having any direct link to the specific
fellowship program students were participating in. More importantly, to eliminate
reporting biases we explicitly avoided direct questions regarding the desirability of
education and designed the survey to elicit the perceived returns indirectly through
the expected wage distributions conditional on different years of schooling.
A related concern is that students exhibit preference bias, which would lead them
to adjust their responses based on schooling decisions they have already made or
anticipate to make for other reasons. Our results, however, are based on a direct
comparison between students around an arbitrary cut-off so that past schooling efforts
are comparable by construction. Moreover, if fellowship recipients are making (or
anticipate to make) different schooling investments, this would still have been driven
by the fellowship program and its effect on their valuation of education. Again, given
the indirect elicitation of perceived returns to education, it seems less plausible that
a change in schooling preferences (for some other reason) has affected their beliefs
rather than the other way round.
44Note that the direction of this potential bias is unclear: those recognized for their performancemay feel the obligation to report a higher valuation of education but those who came close toreceiving the fellowship may think that responding positively to a survey could increase their chanceof receiving the fellowship in the future. In this case, our results would correspond to the lowerbound of the impact of the fellowship program on perceived returns to education.
66

A further concern with measurement error is that respondents may have a poor un-
derstanding of probabilities when computing expected returns. To gauge the respon-
dents’ understanding of probabilities, all surveys contained two hypothetical questions
where respondents were asked to evaluate the probabilities of drawing a grey and black
ball from a bag containing one grey ball and two black balls out of a total of five balls.
About 70% of the respondents were unable to consistently provide the correct answer.
Our results, however, remain unchanged even when we remove from our analysis the
respondents who did not at least recognize the principle of monotonicity, i.e., that
because there were more black balls in the bag than grey ones, the probability of
selecting a black ball would be higher (see Table A8).45 Moreover, we were also able
to replicate the main findings using reported point estimates for perceived returns
which does not demand any knowledge about probabilities (Table A13).
A.2 Manipulation of Scores
In section 3.2 we provide evidence on how potentially relevant factors besides the
intervention vary smoothly around the cut-off of assignment to treatment. In Figure
?? we also plot the number of observations in each bin against the midpoints of
the bins, to examine whether the distribution of the forcing variable itself is smooth
around the cut-off (McCrary, 2008). Even though the actual weights attributed to
each of the selection score components - written test, 10th grade marks, interview
and income - were unknown to applicants each year, we reject the hypothesis that the
density changes smoothly around the cut-off for Uttarakhand, which is suggestive of
potential manipulation of the scores around the cut-off.46 When examining each batch
separately, we find that this effect is mainly driven by the third batch of students.
45For Orissa (Panel B), the estimates are no longer significant but the point estimates remain ofthe same magnitude.
46McCrary (2008) proposes a formal test for manipulation around the cut-off by testing for adiscontinuity in the density of the forcing variable at the cut-off.
67

For the first two batches, the evidence does not suggest sorting or manipulation of
the forcing variable around the cut-off. When we exclude this third batch in which
manipulation around the cut-off may have taken place, our results become, however,
even stronger. (Tables A11. For Orissa, we find no evidence for manipulation around
the cut-off.
[Figure A1 here]
A.3 Identification of the Peer Network
While a commonly used method in the literature, relying on self-reported network
data (Conley and Udry, 2010; Bandiera and Rasul, 2006) raises some additional con-
cerns. In both our studies, the realized sample of peers was substantially smaller than
our initial targeted sample since many respondents were unable to name a close peer:
for example, it was possible to survey only 57 siblings in Uttarakhand as many fellows
and non-recipients did not have a sibling in the required age group. This could raise
concerns about the extent of systematic non-response bias across networks of fellows
and non-fellows, which could in turn bias our estimates. In Table A2, we directly test
for differences between fellows and non-fellows whose networks we were able to fully
sample. We find no evidence of sampling bias. A second concern is that networks
may be endogenously generated in response to the outcome of the fellowship process.
This would introduce the possibility of reverse causation when assessing the impact
of exposure to a fellow on the perceptions of their networks. To mitigate this concern,
we restricted the survey to networks that pre-dated the fellowship program.
68

B Appendix B: Project Implementation
B.1 Timeline of main data collection
Study Site I - Dehradun, Uttarakhand
Notes: Timeline for Study Site I (Dehradun, Uttarakhand) of application, treatment, academicprogression and data collection for the main survey in Dehradun district.
Study Site II - Sambalpur, Orissa
Notes: Timeline for Study Site II (Sambalpur, Orissa) of application, treatment, academicprogression and data collection for the main survey in Dehradun district.
B.2 Fellowship Programs
We study two fellowship programs: The first runs in Dehradun district, Uttarakhand,
and the second in Sambalpur district, Orissa. Both programs are funded by the same
donor and hence follow comparable guidelines.
The aim of both programs is to enable talented secondary students from disadvan-
taged backgrounds to progress to higher education by providing a financial recogni-
tion (7,000 Rs. p.a. in Uttarakhand and 12,000 Rs.) and non-monetary assistance
through the fellowship network. In Uttarakhand, additional workshops were pro-
vided to improve communication skills, spoken English, problem solving skills and
69

stress management during examinations. The speakers were drawn from the NGO
staff or volunteers. No explicit wage information was conveyed during these work-
shops. In Orissa, the non-monetary assistance was restricted to informal advising and
support. The workshops were typically held in the offices of the NGO.
Both programs were advertised by sending out leaflets and posters to secondary
schools across the district. While we are unable to determine the exact channel
of information transmission (e.g. recommendation, or publicly visible posters), the
interviews suggest that most of the first batch applicants have been informed by their
teachers. For subsequent batches, information also spread by word of mouth. Given
the wide targeting, the program was not concentrated in a few select schools. Overall,
applicants came from 126 (96) schools in Uttarakhand (Orissa).
The fellowships were awarded in a public ceremony with representatives from the
NGO and representatives of the local community. The payments were disbursed
quarterly at the NGO. In Uttarakhand, the payments coincided with the quarterly
workshops. Both programs are implemented by well-established local NGOs.
B.3 Construction of the forcing variable
The forcing variable was generated by the NGO to rank and select the fellowship
recipients. The selection process is divided into three stages:
In the first stage, non-eligible students are rejected (about 30 students on average per
intake) and eligible students are assigned marks based on the information provided
in the application form. The form asks for information about academic performance
(marks), family background (household size, composition, employment and income)
and a teacher assessment. Higher scores are assigned to students with better marks
and teacher assessment, larger families and lower income. Marks, household size and
70

income are then normalized and equally weighted. The total score in the first stage
ranges from 0 (lowest) to 100 (highest). 65% of the score is formula-based and 35%
is based on discretion.
In the second stage, applicants are given a written test to measure their analytical
and essay writing skills. The students are asked to write a personal statement about
their ambitions and their reasons for applying to the fellowship. The total score in
the second stage ranges from 0 (lowest) to 100 (highest). The graders, recruited from
the NGO staff and volunteer teachers, assign marks for the use of language (spelling
and grammar), the structure of the essay and the originality of the content.
In the final stage, prospective fellows are interviewed with their parents and a home
visit is scheduled. The interview serves to verify the motivation of the applicant,
and the purpose of the home visit is to check the information (e.g. about family
background and income) given in the application. A score of up to 100 points is given
for the interview, broken down by four dimensions: genuine motivation (10), desire to
excel in life (30), family involvement (30) and social sensitivity and awareness (30).
Another score of up to 50 points is given for the home visit where statements about
the family background are verified based on observable proxies of income (e.g. quality
of housing, number of rooms). The interviewers and field officers were recruited from
the NGO and volunteer teachers.
The final index is the sum of the scores in all three stages, ranging between 0 to 350.
The fellowship is then given to the highest scoring students, with a threshold that
is exogenously determined by the financial resources available to the NGO. In our
analysis, we normalize the score to lie between 0 (lowest) and 1 (highest).
71

B.4 Measurement of perceived returns
To measure perceived returns to education, we elicit the subjective probability re-
spondents assign to receiving an entry salary of 0-5,000 Rs., 5,001-10,000 Rs., 10,001-
15,000 Rs., 15,001-20,000 Rs. and above 20,000 Rs. We use showcards to illustrate
the breakdown in a table (see below). The exact phrasing of the question is:
”Once you graduate from school, how do you think the probability of obtaining the
following monthly incomes would change depending on completion of SSC, HSC and
higher education, for the first 5 years of your career?”
Income group per month Probability withSSC HSC Higher Education
Rs. 0-5,000Rs. 5,001-10,000Rs. 10,001-15,000Rs. 15,001-20,000Rs. 20,001 and higher
Note: Columns must sum up to 100%
B.5 Description and sampling of Orissa (validation) study
We confirm our main results by examining the impact of the fellowship program
implemented in Sambalpur (Orissa). The fellowship is funded by the same donor and
nearly identical to the main study area in Dehradun (Uttarakhand), with the added
advantage that it includes both boys and girls. The table below summarizes the main
differences between both study sites.
72

Uttarakhand (Site I) Orissa (Site II)
Monetary award 7,000 Rs. p.a. 12,000 Rs. p.a.Regular workshops Yes NoTarget group Girls Boys & girlsIncome threshold Below 96,000 Rs. p.a. Below 75,000 Rs. p.a.Marks threshold Above 60% SSC Above 70% SSCIntake Grade 10 Grade 10Intake studied 2008-2010 2009-2012Beneficiaries 370 400
District literacy rate (Census ’11) 77% 67%
B.6 Sampling and data collection
We conducted three cross-sectional surveys. The main survey targeted a random
sample of students drawn from a sample of all 1,595 students who applied to the
fellowship program between 2009 and 2012. Anticipating challenges in tracking ap-
plicants from the earlier batches, we oversampled to ensure the resulting dataset is
balanced. In order to implement the RDD, the sample was stratified according to
students around the cut-off and in the remainder group. We sampled all 289 students
around the cut-off and prioritized the cut-off sample during the data collection. The
remaining 762 students were drawn from the remainder sample, yielding a planned
total sample size of 1,051.
Since the implementing NGO did not keep updated records of the addresses of unsuc-
cessful applicants, tracking down previous applicants was a major challenge during
data collection. To alleviate concerns of systematic non-response and allow the ap-
plication of the RDD, the main effort during data collection has been focused on
obtaining a balanced cut-off sample: Out of the 289 students around the cut-off,
230 students were covered (79%), but logistical constraints limited a similar tracking
exercise for the remainder sample, where only 333 students were covered (43%).
Given the low coverage of the remainder sample, the main concern is one of systematic
non-response bias. Even though the average annual household income is statistically
73

indistinguishable between the actual and planned sample, students in the realized
sample have, on average, slightly higher grade 10 marks than the average students
from the planned sample. Once limiting the balance checks to the cut-off sample,
however, there is no evidence of a systematic non-response bias. Given the potential
sampling bias, subsequent analysis was conducted both using the full sample and the
cut-off sample only.
For each of the applicants covered, we conducted a second survey targeting their
parents to capture potential indirect impacts of the fellowship. The survey aimed to
capture attitudes of parents towards investments in education, as well as collect a wide
range of information on their social-economic background, time use and networks.
From the 563 applicants covered, survey data was collected from 453 parents. Non-
responses from the remaining parents were commonly attributed to refusal due to
time constraints, but conditional on the applicant response there is no evidence of a
systematic non-response bias among the parents.
We also conducted a third survey targeting those in the social and family networks
of applicants. Respondents to the main survey were asked to name, in descending
order, three of their closest neighbors, friends and siblings who were in grades 7-
9, thus still eligible to apply for the fellowship and still in the process of deciding
whether to invest in higher secondary education. We then captured the frequency
with which our respondents interacted with these networks, with a particular focus
on the interactions leading to exchanges of information about schooling, jobs and
career choices. The final peer sample (896) was restricted by the fact that applicants
were often unable to name a close peer: it was only possible to survey 91 siblings as
many applicants did not have a sibling in grades 7-9. This constraint, however, does
not vary differentially across networks of recipients and non-recipients.
74