samvardhana motherson automotive systems group bv · 2019-07-23 · smrp bv group benefits from a...
TRANSCRIPT

ANNUAL REPORT 2018-19 (April 1, 2018 to March 31, 2019)
Samvardhana Motherson
Automotive Systems Group BV
Annual Report 2018-19
2
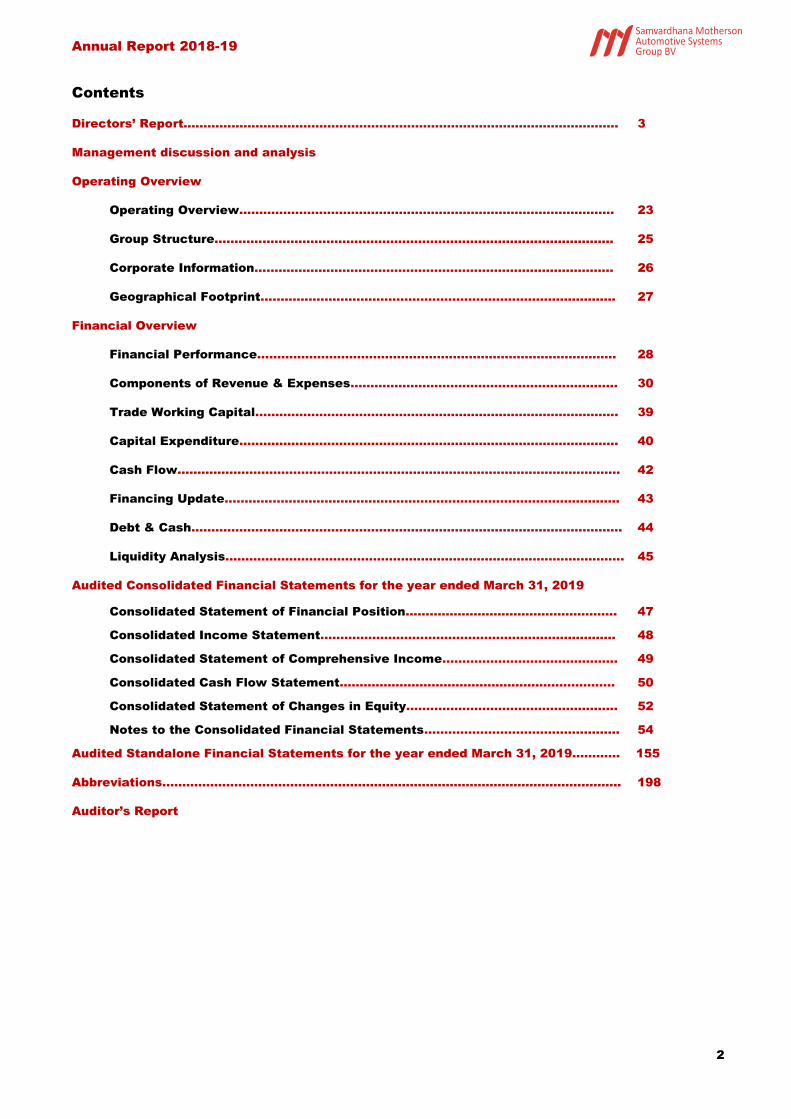
Contents
Directors’ Report…………………………………………………………………………………………….… 3
Management discussion and analysis
Operating Overview
Operating Overview…….…………………………………………………………..................... 23
Group Structure……………………………………………………………………..……………….. 25
Corporate Information……………………………………………………………………………... 26
Geographical Footprint………………………………………………………………………........ 27
Financial Overview
Financial Performance…………………..…………………………………………………………. 28
Components of Revenue & Expenses.……………………………………………..…………. 30
Trade Working Capital………………………………………………………………………………. 39
Capital Expenditure………………………………………………………………………………….. 40
Cash Flow………………………………………………………………………………………………… 42
Financing Update…………………………...………………………………………………………… 43
Debt & Cash……………………………………………………………………………………………… 44
Liquidity Analysis………………………………………………………………………………………. 45
Audited Consolidated Financial Statements for the year ended March 31, 2019
Consolidated Statement of Financial Position……….……………………………………. 47
Consolidated Income Statement…..…………………………………………………………… 48
Consolidated Statement of Comprehensive Income..……………………………….….. 49
Consolidated Cash Flow Statement..…………………………………………………………. 50
Consolidated Statement of Changes in Equity….……...……………………………….... 52
Notes to the Consolidated Financial Statements………………………….……………... 54
Audited Standalone Financial Statements for the year ended March 31, 2019………... 155
Abbreviations………………………………………………………………………………………………….… 198
Auditor’s Report
Annual Report 2018-19
Directors’ report
3
DIRECTORS’ REPORT
To the members, Your Directors have the pleasure of presenting the annual report together with the audited accounts of the Company for the financial year ended March 31, 2019.
A.1. BUSINESS BACKGROUND
Samvardhana Motherson Automotive Systems Group BV, together with its subsidiaries (hereinafter referred as “SMRP BV Group” or “the Group”), is a leading global Tier 1 supplier of rear view vision systems and interior and exterior modules (including door panels, instrument panels and bumpers) to automotive original equipment manufacturers (“OEMs”). We are also a member of the Samvardhana Motherson Group (“SMG”), one of the global Tier 1 automotive supplier. SMRP BV is a private company with limited liability, incorporated under the laws of the
Netherlands on October 07, 2011 (Commercial Register No. 53709713). Its registered office
and principal place of business is situated at Hoogoorddreef 15, 1101 BA Amsterdam, The
Netherlands.
SMRP BV business consists of Samvardhana Motherson Reflectec Group referred to as SMR Group and Samvardhana Motherson Peguform Group together referred to as SMP Group. SMR Group produces a wide range of rear-view vision systems primarily for light vehicles. SMR is a leading global supplier of exterior mirrors having its headquarters in Stuttgart, Germany. SMR operated 21 manufacturing facilities and 2 module centres with presence in 16 countries. SMP Group produce various polymer-based interior and exterior products for automotive industry. SMP’s product portfolio is primarily comprised of complete modules, including door panels, instrument panels and bumpers as well as other plastic components and systems, such as centre consoles, decorative interior trims and plastic body parts. SMP Group operated 47 manufacturing facilities and 14 module centres in 20 countries. SMP division also includes Reydel Automotive Group which was acquired on August 02, 2018 by SMRP BV by purchasing 100% stake in Reydel Automotive Holdings B.V. and Reydel Automotive Management B.V. (subsequently renamed as Samvardhana Motherson Reydel Companies” or “SMRC”). SMRC manufactures interior components and modules for global automotive customers and further strengthens the SMRP BV’s offerings in the automotive interiors space along with existing SMP group. SMRC is a leading global developer and supplier of interior components to the global automotive manufacturers. SMRC’s Interiors Product Portfolio includes Instrument Panels, Door Panels, Console Modules, Decorative Parts and Cockpit Modules.

Annual Report 2018-19
Directors’ report
4
A.2. MANAGEMENT TEAM & EMPLOYEES
SMRP BV Group benefits from a strong professional management team, with average automotive industry experience among senior managers of over 25 years. In addition, the group has experienced and stable senior managers at the regional levels with significant experience and understanding of their respective markets and regions. As on March 31, 2019, SMRP BV Group had a total of 32,542 employees (March 31, 2018 : 26,211) comprising of 10,655 employees (March 31, 2018 : 10,604) at SMR group and 21,887 (March 31, 2018 : 15,607) employees at SMP Group.
A.3. EMPLOYEE INVOLVEMENT
It is Group’s policy for the management of its subsidiaries to meet at regular intervals with representatives of various sections of employees at which relevant information and developments are discussed. It is also Group’s policy to ensure that any local legislative requirements for employee representation or participation are fully adhered to. Information on the Group is provided through internal newsletters, intranet portal and notices. Regular meetings are held with the employees to discuss operations, sales and the financial progress of the business. Leadership assessment programs as well as succession planning is also practiced to identify & develop potential leaders. An induction plan is in place for all new joiners of the Group. Differently abled employees The Group gives equal consideration to all applicants for employment irrespective of any disability. If a person becomes disabled while employed by the Group, every endeavour is made to protect that person's position. Differently abled persons have the same opportunities for training and career development as other employees with similar skills and abilities. Health & Safety Employee health and safety is of great importance to us. We take a decentralized and localized approach to implementing and managing our health and safety processes. These health and safety processes are implemented locally by plant management, and the results are reviewed by the local health and safety officer and local health and safety committee on a periodic basis. Focus on Employees SMRPBV is not just about products, processes, technology and intellectual property: it’s about people. The most valuable asset of SMRPBV is its employees. Their involvement, sense of ownership, belongingness, passion to improve and excel every day are one of the SMRPBV’s core differentiations. Any plans to move our business forward and to bring innovation start with our people. As a global organization SMRP BV has employees from over 24 countries, who speak different languages, come from different cultures but belong to one family. There are limitless possibilities and types of events that SMRPBV holds throughout the year. One of the global annual events which has long history within the Group is the Global Quality Circle Convention.

Annual Report 2018-19
Directors’ report
5
The quality circle movement was started in SMG around 1983. The goal of quality circle is to involve all employees in continual improvement in every process. SMRPBV Group continuously participate in these quality circle conventions, which helps to empower its employees through involvement in these quality circles. These Quality Circles bring different teams from various continents to learn from each other, witness best practices and make new friends.
A.4. MANAGEMENT
The Company has in place a two-tiered board structure consisting of separate management and supervisory boards. Management Board The management board of the Company (Board’s) consists of four managing directors and is responsible for managing the business & its related risks in accordance with applicable laws, constitutional documents and resolutions of the shareholders. The principal functions of the management board are to carry out the day-to-day business of the Company and to legally represent the Company in its dealings with third parties, while maintaining high standards of corporate governance and corporate responsibility Supervisory Board The supervisory board of the Company consists of six supervisory directors. The duties of the supervisory board are to supervise the Board’s policy and course of action and to supervise the general conduct of the affairs of the company and any business it may be affiliated with. The supervisory board assists the Board in an advisory capacity. The supervisory directors have to carry out their duties in the interest of the company and any business it may be affiliated with. The supervisory board is furthermore charged with all the duties entrusted to it by Dutch law and by the constitutional documents of the Issuer.
A.5. FINANCIAL RESULTS
The consolidated financial statements have been prepared in accordance with International Financial Reporting Standards (“IFRS”) as adopted by the European Union (“IFRS EU”). These financial statements of the Company have been prepared for the financial year beginning April 01, 2018 and ending on March 31, 2019. During the year ended March 31, 2019, IFRS 15 – Revenue from Contracts with Customers became applicable on the Group. The management has conducted detailed analysis on the implications of implementation of new standard on the revenue. The Group builds all customized products for its customers. In certain contracts, the Group is undertaking higher level assemblies of modules such as Instrument Panels, Cockpits etc. wherein whole/ substantial components are procured from suppliers nominated by customer without taking over any risks on the Company itself. Such a situation has been defined in standard as the Group acting as an agent, and requires recognition of revenues excluding the value of such components. In view of implementation of new standard, only service fees involved in such contracts where the company has limited risks has been recognized as revenue by netting the cost of such

Annual Report 2018-19
Directors’ report
6
components from raw material consumption as well as from sales as against earlier practice of full value to be included in Revenue. The new standard has been applied from April 01, 2018. The Group has adopted modified retrospective approach and hence comparative figures have not been reinstated. Therefore, certain line items like revenue, cost of materials etc. are not comparable with the corresponding previous year. This change in presentation resulted in decrease in revenue by € 519 Million for the year ended March 31, 2019. This change does not impact profits before and after tax. The summarised consolidated financial results for the year ended March 31, 2019 and for the previous year ended March 31, 2018 are as follows:
Following are the summary financials for the quarter and fiscal year ended March 31, 2019 excluding Greenfields and SMRC:
* SMRPBV Group includes results of segment ‘Others’, which represents activities carried out by Motherson Innovations (Group’s R&D and new technologies development arm) and results of certain corporate and shareholder support functions not allocable to a particular segment on a reasonable basis. For details refer Note A.6.6.4 ‘Operating Segment Information’ in consolidated financial statements for the period ended March 31, 2019.
For fiscal year ended March 31, 2019 SMRP BV Group’s revenue increased to € 5,312 million, however excluding the impact of change in accounting policy due to application of IFRS 15, the revenues for fiscal year ended March 31, 2019 increased to € 5,831 million which are higher than the revenue for the last year ending March 31, 2018 at € 5,024 million. This represents growth of approximately 16% over previous Year. EBITDA for the fiscal year ended March 31, 2019 was € 335 million representing 5.7% to gross reported revenue, which is lower than EBITDA for the corresponding previous fiscal year ended March 31, 2018 at € 378 million, representing 7.5% to gross reported revenue. During fiscal year ended March 31, 2019, EBITDA has been influenced by significant costs associated with the ramp-up of the Greenfield plants at Tuscaloosa, USA and Kecskemet,
Income Statement
€ millionsSMRPBV
Group*SMP SMR
SMRPBV
Group*SMP SMR
Revenue - Reported 5,024 3,452 1,575 5,312 3,704 1,611
Revenue - Gross 5,024 3,452 1,575 5,831 4,223 1,611
EBITDA (excl.gain on bargain purchase) 378 205 189 335 159 188
% to Revenue (Gross) 7.5% 5.9% 12.0% 5.7% 3.8% 11.7%
Year ended Mar 31, 2018 Year ended Mar 31, 2019
Income Statement
€ millionsSMRPBV
Group*SMP SMR
SMRPBV
Group*SMP SMR
Revenue - Reported 4,905 3,332 1,575 4,372 2,764 1,611
Revenue - Gross 4,905 3,332 1,575 4,891 3,283 1,611
EBITDA (excl.gain on bargain purchase) 440 268 189 440 264 188
% to Revenue (Gross) 9.0% 8.0% 12.0% 9.0% 8.0% 11.7%
Year ended Mar 31, 2018 Year ended Mar 31, 2019

Annual Report 2018-19
Directors’ report
7
Hungary and includes EBITDA post acquisition of SMRC. Excluding the impact of such ramp-up costs and contribution from SMRC from results of fiscal year ended March 31, 2019 EBIDTA margins are stable despite flat volumes from OEMs in European market in FY 2018-19. Excluding Greenfields and post-acquisition results of SMRC, EBITDA for the fiscal year ended March 31, 2019 was € 440 million representing 9.0% to gross reported revenue, vis-a-vis EBITDA for the corresponding previous fiscal year ended March 31, 2018 at € 440 million, representing 9.0% to gross reported revenue. The financial performance of the company has been comprehensively covered in the financial overview section which forms an integral part of the directors’ report.
A.6. CAPITAL EXPENDITURE
SMRP BV Group’s growth strategy includes expanding operations in line with customers’ growth and sales order book. The company is one of the few suppliers in its product segment with a global engineering & manufacturing footprint and this strong geographical diversification enables the company to capitalise on global growth opportunities while mitigating the impact of any regional demand fluctuations. The company continuously assess the need for setting up Greenfield plants or expand capacity in existing plants to cater to new platforms with existing/new customers. Significant capital expenditures are incurred with expanding our footprint and enhancing our existing capacities. Capital expenditure in SMR division primarily comprised of expansion of existing facilities in Hungary, Korea, China and India. Capital expenditure in SMP division primarily related to set up of two new plants in Tuscaloosa, U.S. and Kecskemét in Hungary. Capital expenditure incurred for the fiscal years ended March 31, 2019 and 2018 were €255 million and €283 million, respectively.
A.2. STRATEGY
The Group has adopted the vision of SMG, which is to be a globally preferred solutions provider in the automotive industry. We aim to achieve this by pursuing our strategic actions that we have established based on the philosophy of SMG, which includes focusing on consistent outstanding performance, strengthening customer relationships built on trust, pursuing greater client engagement, increasing the content per vehicle that we supply and developing long-term sustainable value creation.
A.3. RESEARCH AND DEVELOPMENT
SMRP BV Group is committed to technological leadership and the development of innovative and high-quality products in order to meet both the growing demands of OEM customers with regard to product functionality & feature content as well as increasingly stringent environmental goals and regulatory requirements. Many of the products utilize increasingly environmentally sustainable & lightweight materials and are manufactured using state-of-the-art technologies. The company is maintaining a strong portfolio of over 1,100 patents. Design and research centres are interconnected and share innovations & technological advancements across a global network, which enables the leverage of best practice in product quality and delivery of value-added solutions on a global scale in a cost-efficient manner.

Annual Report 2018-19
Directors’ report
8
SMRP BV Group’s global research & development capabilities have historically enabled the company to develop a diversified and comprehensive product portfolio across rear view mirrors, door panels, instrument panels, bumpers and other interior & exterior components. With the ability to offer a full range of system solutions resulting from the vertical integration of company’s operations, including significant in-house sourcing capabilities, there are continuous opportunities to increase feature content per vehicle across each of OEM customers’ model ranges. The Group intends continue to its focus on research and development capabilities aligned to the needs of our customers and the major industry trends of, Connectivity, Electrification, Autonomous driving and Shared mobility. For SMRP BV this centre on four key areas:
• Safety and driver assistance: Developing intelligent features to enhance passenger and pedestrian safety, such as integrated sensors, intelligent camera-based object detection solutions, lane departure warning systems, mirror-integrated blind spot warning lights and mirror replacement camera monitoring systems.
• Sustainability: Using environmentally-friendly and recyclable materials and reducing component size and weight to minimize material and energy consumption, such as through the application of lightweight natural fibres in interior systems.
• Performance & efficiency: Optimizing usability and customisation through modularity, the use of new materials and the integration of attractive, value-added content such as vehicle occupant interface and comfort features.
• Design & Aesthetics: Improving the aesthetic features of passenger cars through the introduction of new styling solutions, such as high gloss finishes and decorative metallized surfaces and integrated lighting solutions.
The proven track record and reputation of technological leadership has positioned SMRP BV Group as a preferred partner for collaborative development with leading OEMs. The Group intends to continue to pursue collaboration opportunities with existing customers, offering them a full suite of development capabilities and jointly developing innovative solutions to cater to their needs. Through focus on technological leadership and the design & production of innovative products, the company aims to further strengthen its position as the partner of choice in providing solutions which meet the changing consumer needs. Motherson Innovations referred to as MI, was established as a networking partner and collaborator for the group with the purpose to understand the consumer and customer needs of the future and the associated technological trends. MI is working closely with the group companies, connecting with external technology partners and innovative start-ups to deliver new solutions and value to the OEM customers for the future. SMRP BV Group’s dedication to technological leadership has enabled the company to maintain a long track record of introducing market-first products, including Blind Spot Detection and warning Systems, power Telescopic Trailer Tow mirrors, interior door panels manufactured using innovative lightweight and recyclable natural fibre materials & camera vision-based sensor technology. During the fiscal year ended March 31, 2019 the Group incurred expenditures of € 144 million as compared to € 111 million for the fiscal year ended March 31, 2018, towards its research and development activities which are expensed in the income statement.

Annual Report 2018-19
Directors’ report
9
A.4. DEVELOPMENT & OUTLOOK
Automotive industry landscape
The global automotive industry designs, develops, manufactures, sells and services light vehicles and heavy commercial vehicles. The light vehicle segment consists of passenger cars, vans and light trucks weighing less than six tons, while the heavy vehicle segment is generally defined as the market for vehicles weighing in excess of six tons. The automotive production value chain comprises OEMs, such as Volkswagen, Daimler, Ford, Hyundai, Toyota and Renault-Nissan, and automotive parts and modules suppliers. The automotive supplier industry is further segmented into three tiers. Tier 1 suppliers sell their products directly to OEMs. Typically, these products are larger modules or systems which integrate multiple components, sometimes sourced from Tier 2 automotive suppliers. Tier 2 suppliers sell individual components, component groups or sub systems to Tier 1 suppliers, which in turn typically integrate individual parts or materials produced by and purchased from Tier 3 suppliers. Automotive suppliers are typically further divided into sub-segments based on their product or systems function within the car. A typical classification of automotive supplier by vehicle function could include the following sub-segments: powertrain, body & structural, exterior, interior, and electronics systems. SMRP BV Group’s revenues are primarily derived from sales of automotive components to global OEM customers operating in the light vehicle industry and, as a result, SMRP BV Group operations are affected by general trends in the automotive industry and global light vehicle production volume and the content per vehicle for the components and systems produced by such suppliers. Suppliers typically have contracts that cover the full life of a vehicle platform or model range, which usually have an average life of five to seven years. Certain components, such as bumpers and exterior lighting, may be updated part-way through the vehicle model lifecycle in what is referred to as a “mid-cycle refresh” action. Factors that can influence automotive production include general economic conditions, changing demographics (e.g. population growth, aging and urbanization), evolving consumer preferences and mobility needs, regulatory and legislative changes and sociological trends. Globalization of platforms
OEMs are continuing to increase the number of vehicles built on a single platform in an effort to reduce the time and resources spent on the development of new platforms. Vehicle platform-sharing allows OEMs to build a greater variety of vehicles from one basic set of engineered components, lowering overall costs by spreading development expenses over a greater number of units produced. By implementing “platform-sharing” globally, OEMs are able to realize significant economies of scale. To support this strategy, OEMs require suppliers to match the size, scale and geographic footprints of these platforms. SMRP BV Group with a global footprint, broad product offering and the requisite manufacturing expertise is well-positioned to benefit from such platform-sharing because there is no restriction by the high barriers to entry associated with the global supply of a broad product portfolio and is able to efficiently respond to customers' local needs. In addition, higher production volumes across

Annual Report 2018-19
Directors’ report
10
fewer platforms are expected to result in cost savings for suppliers, as they further standardize and optimize their operations. Localization of production in emerging markets
Increasing disposable income and low existing vehicle production, as well as the development of efficient road infrastructure, are also driving the demand for light vehicles in emerging markets. As a result of increasing local demand combined with low manufacturing costs and lack of import duties for locally manufactured products, global OEMs are increasingly expanding their production and sales networks in emerging markets. This has been a particularly significant trend in the premium segment, which has been the most rapidly growing light vehicle segment in recent years. As sales in these markets are projected to continue their rapid growth, most major global premium car makers are expanding their production footprints. SMRP BV Group is well positioned to realize growth opportunities in emerging markets by following their customers due to strong OEM relationships.
Increased outsourcing leading to a high OEM dependency on external suppliers
As OEMs focus their resources on automobile final assembly, OEMs are increasingly looking to external suppliers for content they have historically produced in-house. This trend is underpinned by OEMs’ growth outside their home markets, consumer expectations with regard to product complexity and feature integration and an increased focus on safety and the environment. Suppliers can benefit from economies of scale derived from serving various customers on a global scale, while OEM customers may find more difficulty in achieving similar cost and quality levels in-house. The outsourcing trend has led to an increase in OEM dependency on suppliers capable of managing complex projects while maintaining high quality standards across multiple geographies. Furthermore, while know-how is still being developed by suppliers and product design is still largely controlled by OEMs, there is an increasing collaboration between OEMs and Tier 1 suppliers from a vehicle program’s initial stages. These research and development partnerships between OEMs and suppliers seek to achieve long-term strategic cooperation in line with the OEMs’ cost reduction initiatives. Consolidation of supplier base
In order to take advantage of the operational economies of scale, OEMs are encouraging consolidation of their supplier base with an increased focus on large, technically and financially strong global suppliers capable of producing consistent and high-quality products across multiple production regions. The OEMs use a number of factors to determine their preferred suppliers including, among other things, product quality, service (including location, service interruptions and on-time delivery), in-house research & development and technological capabilities, overall track record and quality of relationship with the OEM, production capacity, financial stability and product price. Connectivity, Electrification, Autonomous driving and Shared Mobility.
Intelligent connectivity and digitization, both inside and outside the vehicle, will play an ever more important role in the future. Connectivity is the name given to communication between one vehicle and another (V2V), between a vehicle and the infrastructure (V2X), and the vehicle occupant’s access to the outside world.

Annual Report 2018-19
Directors’ report
11
Electrification of mobility is a fast-developing trend driven by a number of factors including environmental, regulatory objectives and changing consumer attitudes. While predominantly having a transformational effect on vehicle power train systems and the associated supply chain, other technologies and value content are being brought to market in association with electric mobility, such as driver/vehicle user interface solutions. Automated driving refers to the capability of a vehicle to drive itself at various levels of independence from the vehicle occupants to a destination in real world traffic, using on-board sensors, and software intelligence, combined with navigation systems and V2X connectivity so that it can recognize its surroundings. Shared Mobility refers to the increasing trend towards alternative mobility solutions required as a result of changing demographics, consumer attitudes towards vehicle ownership and urbanisation. SMRP BV Group believe that automotive suppliers with strong OEM relationships have the potential to play a significant role in these new trends and the associated technologies. It could present new business models and generates opportunities for further growth potential within the automotive industry.
A.10. RISK MANAGEMENT
During the year, the Group, its business and products were exposed to various risks. In its capacity as an internationally Tier 1 supplier for the automobile industry the Group is exposed to various risks with each of its business segments and products. The risks and uncertainties described below are not the exhaustive list of risk the Group may face. Additional risks and uncertainties of which the Group may not be aware or that we currently believe are immaterial may also adversely affect our business, prospects, financial condition and results of operations. If any of the possible events described below were to occur, our business, prospects, financial condition and results of operations may be affected. The identified risk are divided into four categories:
1. Strategic Risks 2. Operational Risks 3. Financial Risks 4. Compliance Risks
A.10.1 STRATEGIC RISKS
The Group may get affected by economic trends and adverse developments in the global economy and in countries where we operate. Our business is affected by general economic conditions, in particular levels of industrial and manufacturing output in the industries and markets that we serve and is susceptible to downturns in economies around the world, including major economic centres such as the European Union and the United States, as well as emerging markets such as China, Mexico and Brazil. General economic conditions and macroeconomic trends and potential trade disputes can affect overall demand for our products and the markets in which we operate.

Annual Report 2018-19
Directors’ report
12
The Group’s revenue is derived from OEMs who could be significantly impacted by adverse economic developments globally. During periods of slow economic activity, consumers may forego or delay vehicle purchases, or purchase lower-priced models with fewer premium features, resulting in reduced demand by our OEM customers for our products. If the economic environment in any of the markets from which we derive substantial revenue declines, unfavourable economic conditions may impact a significant number of our customers and, consequently, the demand for our product lines, and our business, financial condition and results of operations could be materially adversely affected. SMRP BV is continuously improving its geographical footprint to diversify its operations to mitigate the impact of any such economic downturn in any specific geography. Greenfield plants at Hungary & USA along with acquisition of SMRC which added 5 new geographies will support to enhance the global footprint. Market Risks
Cyclicality and reduced demand in the automotive industry in which the Group operates could affect our business. Substantially, all of our business is directly related to vehicle sales and production of our customers, who consist primarily of large automotive OEMs, and demand for our products is largely dependent on the industrial output of the automotive industry. The Group’s operations and performance are directly related to levels of global vehicle production, particularly the light vehicle market, and are therefore affected by factors that generally affect the automotive industry. Furthermore, in some geographies automotive production and demand are subject to seasonal cyclicality, which may influence the demand for our products. For example, European OEMs generally scale back or halt vehicle production during summer holidays and Christmas holidays in Europe and the Americas can impact demand during December. The automotive industry is sensitive to factors such as consumer demand, consumer confidence, sociological trends, disposable income levels, employment levels, fuel prices, regulatory changes and general economic conditions. Any significant reduction in vehicle sales and production by our customers may have a material adverse effect on our business, financial condition and results of operations. Customer portfolio of SMRP BV has significantly diversified with execution of new orders and our current order book is also well diversified which is reducing our dependence on single OEM. Competition Risks
SMRP BV Group face global competition in its business. Competition is based on many factors, including product quality and reliability, breadth of product range, product design and innovation, manufacturing capabilities, distribution channels, scope and quality and reliability of service, price, customer loyalty and brand recognition. The Group also encounter competition from similar and alternative products, many of which are produced and marketed by major multinational or national companies, which may have an adverse effect on our business, financial condition and results of operations. Additionally, as we further expand our presence in emerging markets, we face competitive price pressures from low-cost producers in jurisdictions such as China, and we expect such price pressures to increase as our customers continue to expand their manufacturing

Annual Report 2018-19
Directors’ report
13
footprints in these markets, thereby providing opportunities for local manufacturers to compete. SMRP BV Group’s ability to support OEMs in every phase of the product development process differentiates us from many of our competitors and, given the substantial investment and time that would be required to replicate our global operations, strengthens our status as a preferred partner to the leading OEMs in the automotive industry. This combined with our close proximity to our customers, our technological leadership and our demonstrated reliability, have enabled us to maintain a strong track record of repeat orders and provide us the competitive edge. A.10.2 OPERATIONAL RISKS
Procurement Risks
The Group depends on its suppliers for the supply of raw materials and components that are critical to our manufacturing processes. SMRP BV Group sources its raw materials from a diversified group of global, national and local suppliers, but is still subject to supplier concentration with respect to certain of its key inputs. Certain products use components that are only available from a limited number of suppliers. Furthermore, some of the Group’s suppliers are directed by our customers, and it is likely that we will continue to source components from such suppliers. In some cases, we purchase parts for specific feature content sub-assemblies or modules from OEM-directed sources. Prices of certain raw materials and pre-constructed components we rely on, such as resins (ABS and polypropylene) and metal parts (mainly aluminium and zinc), are linked to commodity markets and thus subject to fluctuation. Certain of our customer contracts, which typically factor in supply cost at the time at which the contract is entered into and subsequently when it is extended or renewed, allow for the pass-through of materials cost increases. For instance, certain of our supplier sources are directed by our OEM customers. In cases where a supplier is directed by the OEM, our contracts typically include provisions allowing for the pass-through of raw materials price increases to the customer. Large portion of our components are OEM nominated which insulates any price risk. Moreover, our contracts sometimes include a mechanism whereby we can pass through increases in the costs of raw materials to our OEM customers, helping to reduce the effect on our margins relating to volatility in the prices of our raw materials Personnel Risks
Dependence on skilled and qualified personnel
The Group depends on its senior management, executive officers, key employees and skilled personnel, and if the Group is unable to recruit and retain skilled management personnel, its business and ability to operate or grow the business may be adversely affected. The Group can be affected by the loss of any of these executive officers and other key employees. The market for such qualified professionals is competitive and we may not continue to be successful in our efforts to attract and retain qualified people. In some of our markets, the specialized skills we require are difficult and time-consuming to acquire and, as a result, are in short supply. Its success depends to a large extent upon the continued services of its senior management, executive officers, key employees and other skilled personnel.

Annual Report 2018-19
Directors’ report
14
SMRPBV continuously work on structured succession planning giving opportunities to employees to take leadership positions which ensure the seamless continuation of management of our business. Increasing labor cost
The Group operates in countries such as India, China, Brazil, Hungary and Mexico, the increasing labor cost in these countries may impact our profit margins and compromise our price competitiveness. The Group undertakes various incentive programs to improve the productivity of its employees, as well as low-cost automation initiatives designed to reduce labor costs. However, if these measures are insufficient to offset increases in overhead costs, or if Group would be unable to effectively manage these increases in the future, our business, financial condition and results of operations may be adversely affected. Intellectual Property Infringement Risks
The success of SMRPBV’s newly designed products and other innovations depends in part on its ability to obtain, protect and leverage intellectual property rights to their designs. We believe we have significant level of protected proprietary technology which gives us competitive advantage in marketing our products and services. SMRPBV therefore try to obtain and protect certain intellectual property rights to their newly designed products and other innovations. While it is also SMRPBV’s policy to enter into confidentiality agreements with its key employees to protect intellectual property, however there may be a possibility that these confidentiality agreements may be breached. We cannot be certain that the measures that we employ will result in the protection of our intellectual property rights or will result in the prevention of unauthorized use of our proprietary technology. We also rely upon unpatented proprietary know-how and continuing technological innovations and other trade secrets to develop and maintain our competitive position. In addition, there can be no assurance that other companies will not obtain knowledge of these trade secrets through independent development or other legal means of access. Any failure to protect our proprietary rights relating to our designs, processes, components, technology, trade secrets or proprietary know-how could have a material adverse effect on our business, financial condition and results of operations. Also, the competitors of the Group may initiate suit against the Group alleging their IPR infringements. There upon, three claim remains pending till final disposal by the Court of competent jurisdiction or settlement of the matter by the Company.”
Stabilization of New Manufacturing Facilities
We have invested in new manufacturing facilities to enable us to expand our global footprint further in line with our customers’ expansion. For instance, we incurred capital expenditures towards our new plants in the U.S. and Hungary as well as towards the expansion of facilities in the Mexico, Hungary, India and China. The establishment period for new manufacturing facilities typically ranges between 12 and 24 months. Once the construction of a manufacturing facility is completed, the output of that facility generally increases over time, with the aim of keeping pace with customer’s production ramp-up schedules. The increase in output to keep pace with customers schedule involves significant ramp-up costs and its success depends to a large extent on availability of skilled

Annual Report 2018-19
Directors’ report
15
personnel as well as know-how of the concerned market, especially while expanding in new geographies. A.10.3. FINANCIAL RISKS
Financial risks
The Group is exposed to various financial risks due to its activities as an international production company. These financial risks include the credit risk which is the risk of financial loss to the Group if a customer or counterparty to a financial instrument fails to meet its contractual obligations towards the Group and arises principally from the Group’s receivables from customers and deposits with banking institutions. Due to ongoing monitoring of the compliance with agreed terms of payment for all customers, risks of bad debt losses are minimised. Monitoring of credit ratings of suppliers/non-OEM customer takes place from time to time. The liquidity risk encompasses any risk that the Group cannot fully meet its financial obligations. To manage the liquidity risk, cash flow forecasting is performed in the operating entities of the group and aggregated by Group finance. Group finance monitors rolling forecasts of the Group’s liquidity requirements to ensure it has sufficient cash to meet operational needs while maintaining sufficient headroom on its undrawn committed borrowing facilities at all times so that the Group does not breach borrowing limits or covenants (where applicable) on any of its borrowing facilities. Forex Risk
The majority of our costs and incomes are denominated in local currencies, providing a “natural hedge” against currency exchange fluctuations, and some of our contracts with OEMs allow for price adjustments in the event of unfavourable currency exchange rate developments. Nevertheless, our global footprint exposes us to certain currency exchange risks, arising primarily from the import of raw materials for certain of our operations and our non-euro-denominated borrowings. SMRP BV group do selective hedging to hedge these currency risks. Financial instrument Risk
The Group makes use of financial instruments like forward contracts and fixed to fixed cross currency swap contracts for economic hedging purposes only, in order to protect against exchange rate movements. The forward contracts are used to hedge highly probable forecast transactions expected to occur over short to medium term period based on underlying business exposures. The Group also makes use of fixed to fixed cross currency interest rate swaps in order to protect against exchange movement on its USD denominated senior secured notes. By entering into aforesaid financial instruments, the Group is exposed to potential credit risk of the counter party however the group’s treasury maintains a close watch on credit standing of the counter parties and transactions are only entered into with banks and financial institutions of good credit standing and independently rated in order to eliminate or keep the potential credit risk to the minimum.

Annual Report 2018-19
Directors’ report
16
A.10.4. COMPLIANCE RISKS
Legal Risk
Significant changes in laws & regulations
The legal, regulatory and industry-standard environment in our principal markets is complex and dynamic, and future changes to the laws, regulations and market practice with regard to emissions and safety, could have an adverse effect on the products we produce and on our profitability. The regulatory environment across all countries in the World is changing rapidly and frequent regulatory changes by the Government of any Country in which Group operates, may impact the profitability or growth perspectives. Additionally, we could be adversely affected by changes in tax or other laws that impose additional costs on automobile manufacturers or consumers, or more stringent fuel economy and emissions requirements on manufacturers of sport-utility vehicles, light trucks and other vehicles from which we derive some of our sales. Changes in legislation or policies related to tax applicable to us could adversely affect our
results of operations.
The Group is subject to complex tax laws in each of the jurisdictions in which it operates. Changes in tax laws could adversely affect the tax position, including effective tax rate or tax payments. In addition, European tax laws and regulations are extremely complex and are subject to varying interpretations. On December 22, 2017, the US introduced changes to the US tax system which will impact businesses significantly from January 1, 2018. These changes are also called the US Tax Cuts and Jobs Act (2017), have been the most significant tax policy reforms in more than 30 years. The changes bring about a reduction in US corporate tax rates from a base rate of 35% to 21%, greater limitations on deductibility of interest, transition to a largely territorial regime to prevent base erosion of the US tax base and a number of other business tax reform proposals. These changes are complex and can create additional tax complexities. In addition, particularly in emerging markets such as China and Brazil, tax laws may be interpreted inconsistently. The application and interpretation of laws by governmental authorities may therefore be uncertain and difficult to predict. Certain territories in which we operate also have transfer pricing regulations that require transactions involving associated companies to be effected on arm’s length terms. Furthermore, the focus of OECD and the G20 countries on implementation of Base erosion and profit shifting (BEPS) measures also continues with many countries making changes through national legislations and multilateral instruments It is our policy, therefore, that any pricing of arrangements between related parties, such as the intra-group provision of services, is carried out on an arm’s length basis and in accordance with all applicable regulations. The Group relies on generally available interpretations of tax laws and regulations in the jurisdictions in which it operates. We cannot be certain that the relevant tax authorities are in

Annual Report 2018-19
Directors’ report
17
agreement with our interpretation of these laws. If our tax positions are challenged by relevant tax authorities, this may have an adverse effect on our business, financial condition and results of operations.
Legal or regulatory claims or investigations against us could have a material adverse effect
on our financial position.
From time to time, the Group may become involved in legal or regulatory proceedings, claims or investigations, including by governmental bodies, anti-trust regulatory authorities, customers, suppliers, former employees, class action plaintiffs and others. On an on-going basis, we attempt to assess the likelihood of any adverse judgments or outcomes to these proceedings or claims, although it is difficult to predict final outcomes with any degree of certainty. Risk Appetite Assessment
The Group operates in markets with growth potential which are subject to volatility and competition. We will pursue our growth targets with clear focus on Return On Capital Employed (ROCE) and de-risking policy. SMRP BV risk appetite varies depending upon type of risk. RISK CATEGORY RISK APPETITE
Strategic Risks Moderate
Operational Risks Moderate
Financial Risks Low
Compliance Risk Low
Risk Management System
The global presence and decentralised management structure with the main activities in the plants make an organised risk management system necessary. The Group has formed the collective risk management system through regulations, instructions, implementation rules and, in particular, the regular communication throughout the tightly controlled management process consisting of planning, controlling and monitoring which is used to define, record and minimise operating, financial and strategic risks. The Group manages its risk by operating its business under well placed two tiered board structure, consisting of separate management and supervisory boards. There are well structured senior management committees comprised of members of the Board as well as senior management personnel from each of SMR, SMP and SMG. The successful management of opportunities and risks is part of operating a business and is the primary task of all management personnel. During the regular management meetings at all management levels, opportunities, risks and optimisation measures are subjected to systematic treatment. Rapid, open and unhindered communication between all levels of management on the risks

Annual Report 2018-19
Directors’ report
18
and imminent exceptional situations ensure that potential risks can be identified at an early stage and their effects can be limited. Risk awareness and the integration of risk management into management personnel’s on-going duties at an organisational level enable the Group to identify risks immediately and to eliminate them or to minimise their effects on the net asset, financial and income position. The Group averse the risks by operating under the uniform code of conduct. SMG maintains a uniform code of conduct which is implemented throughout SMG and which binds all officers, directors and employees. The above risk management system provides the control measures to reduce/eliminate the risks. An overview of the main risks and the risk control (framework) can be found in paragraph A.6.6.3 of the Notes to the consolidated financial statements.
A.11. CODE OF CONDUCT
Subject to the legal requirements, SMG maintains a uniform code of conduct which is implemented throughout SMG and which binds all officers, directors and employees. The Group is committed to conduct its business under this code of conduct with states highest standards of business ethics. This code is intended to provide guidance and help in recognizing and dealing with ethical issues, provide mechanisms to report unethical conduct and to help foster a culture of honesty and accountability. The matters covered in this Code are of the utmost importance to the Company, our shareholders and our business partners. Further, these are essential so that we can conduct our business in accordance with our stated values. Our Group is committed to conduct its business affairs in accordance with the economic development, objectives of the Government and foreign policies of our country and in the countries in which we operate.
A.12. FINANCIAL OUTLOOK & GOING CONCERN
These financial statements are prepared under the assumption that the Group is a going concern. The directors of the Group believe that, on the basis of the future business plans & cash flows and the ability to raise funds as required, they have a reasonable expectation that the Group will continue as a going concern. SMRP BV has strong mid-term revenue and cash flow visibility on the back of robust Order Book of €18.2 billion as of March 31, 2019. This Order Book reflects Group’s focus on growth across diversified geographies and customers. SMRPBV has incurred significant amount of capex for capacity expansion and modernization leading to Global foot print expansion and nearshoring to support its strong order book. SMRP BV Group’s liquidity requirements arise principally from operating activities, capital expenditure for new facilities, maintenance & expansion capital expenditure, short term investments in engineering projects for customer new product launches, repayment of borrowings and debt service obligations. Principal source of funding includes cash from operations, committed credit lines, short-term loans and overdraft facilities at some of the operating entities.

Annual Report 2018-19
Directors’ report
19
As at March 31, 2019 SMRP BV Group had available liquidity of € 765 million (subject to restrictions under net leverage ratio) under committed revolver credit facilities and cash & cash equivalent. Cash generated from operating subsidiaries is utilised to finance growth within the operations of such subsidiary or is transferred to holding companies through the payment of dividends or inter-company loans. In most cases there are no significant obstacles or barriers for such transfer of funds but these are always subject to local jurisdictions at respective country. As at March 31, 2019 SMRP BV group had net leverage ratio of 1.98x as per the definitions under its finance documents which excludes shareholder loan of € 150 million from the calculation of debt; including the shareholder debt the net leverage ratio was 2.40x. This clearly depicts that Group has significant headroom available for generating additional liquidity through borrowings for any growth opportunities and business contingencies.
A.13. SIGNIFICANT FINANCING TRANSACTIONS
Term Loan During the year, the Group entered into a term loan facility agreement for US$ 60 mn for a period of 59 months maturing August 2023. The term loan is senior secured obligation and rank ‘pari passu’ in right of payment with all the existing and future senior obligations of SMRP BV, including the obligations under the Revolving Credit Facility and the Notes and carry the same security structure as existing Notes and Revolving Credit Facility Revolving Credit Facilities During the period, the Group enhanced its liquidity access by increasing RCF size by €75 million to €575 million via adding 3 new lender banks to the RCF agreement. Shareholder Loan During the period, the Group also received support from its shareholders in the form of subordinated long-term loan € 150 million to demonstrate SMPR BV’s commitment to adherence of its financial policy. An overview of the significant financing transactions can be found in paragraph A.6.3.10 of the Notes to the consolidated financial statements.
A.14. CREDIT RATING
Directors are pleased to inform that the company continues to enjoy long term corporate credit rating of BB+ by Standard and Poors as well as Fitch Ratings. The current rating status of the company as on date of report is as follows:

Annual Report 2018-19
Directors’ report
20
A.15. ENVIRONMENTAL AND SOCIAL POLICIES
SMRP BV recognises its corporate responsibility to carry out its operations whilst minimising the impact on the environment. It also aims to comply with all applicable environmental legislation to prevent pollution and to minimise environmental damage occurring as a result of its activities. Most of our primary production facilities are certified to ISO 9001 and/or 14001. We have established environmental policies with respect to the handling of chemicals, gases, emissions and waste disposals from our manufacturing operations and have not been party to any material environmental claims in the past. We have undertaken several corporate social responsibility programs, including aiding underprivileged children and promoting the education of girls. Such programs are associated with several non-governmental organizations and institutions dedicated to primary education and development of underprivileged girls. They also provide support to organizations that care for children without adequate parental care and those in difficult circumstances, and to a non-governmental organization that is run for the benefit of special children. They provide need-based scholarships to underprivileged children and support orphanages and old-age homes.
A.16. DIRECTORS’ RESPONSIBILITY
The directors are responsible for preparing the financial statements in accordance with applicable law and International Financial Reporting Standards (“IFRS”) as adopted by the European Union. In preparing these financial statements the directors should:
• select suitable accounting policies and then apply them consistently;
• make judgements and estimates that are reasonable and prudent;
• prepare the financial statements on the going concern basis unless it is inappropriate to presume that the Group will continue the business; and
• state whether applicable accounting standards have been followed, subject to any material departures disclosed and explained in the financial statements.
The directors confirm they have complied with all the above requirements in preparing the financial statements. So far as the directors are aware, there is no relevant audit information of which the Company's auditors are unaware, and each director has taken all the steps that he ought to have taken as a director in order to make himself aware of any relevant audit information and to establish that the Company's auditors are aware of that information. As of April 13, 2017, a new Dutch law requirement was installed. The purpose of this is to attain a balance (at least 30% of each gender) between men & women in the board of directors and the supervisory board of large entities. With effect from April 01, 2019 the Company has appointed Ms. Geeta Mathur as a director on the supervisory board. The Company will further take these requirements into consideration for future decision with respect to the composition of the management & supervisory board at appropriate time.

Annual Report 2018-19
Directors’ report
21
The Company has well diversified composition of existing Management & Supervisory board in terms of age, experience, educational and professional background. The brief resume of our directors outlining their nature of expertise in functional areas, educational and professional background is as follows: Mr. Laksh Vaaman Sehgal is a managing director and Chief Executive Officer of the Company, and has been a director since June 2014 and is responsible for strategic planning and decision making for the Group. Prior to his appointment as chief executive officer, he served as the chief executive officer of SMR following its acquisition in 2009 until 2013. He is also a director of MSSL and SAMIL. In his capacity as Chief Executive Officer of the Issuer, he is actively involved in the Group’s investment decisions and its strategic decision-making process, and helps to define and manage the Group’s overall control policies. Mr. Vaaman Sehgal holds a Bachelor of Business Administration from Boston University and a Masters in Finance from Columbia University. Mr. Andreas Heuser is a managing director of the Company and Head of Chairman’s Office Europe & Americas of SMG, and has been a director of Issuer since October 2011. He joined SMG in 2005, as the Head of its European corporate office, Mr. Heuser also currently serves as a director of SMR, SMP and in multiple SMG companies. Mr. Jacob Meint Buit is an independent local resident managing director of the Company, and has been a director since the Issuer’s incorporation in 2011. After studying economics and tax law in Amsterdam, Mr. Buit joined the tax law firm of Loyens & Loeff in 1974, where his practice focused on international corporate matters. Mr. Buit practiced at Loyens & Loeff for a total of 28 years, including 18 years as a partner and an additional 2 years as counsel, until leaving the firm in 2001. Mr. Buit is a member of various non-profit, supervisory and corporate boards. Mr. Randolph M. Th. de Cuba is an independent local resident managing director of the Company and has been a director since June 2015. After studying law and economics in Rotterdam Mr. de Cuba joined PwC in 1980 as a tax professional, where his practice focused on international corporate tax matters. Mr. de Cuba’s tenure at PwC was 32 years, including 26 years as a partner. Mr. de Cuba is an independent consultant and holds directorships on various corporate boards. Mr. Bimal Dhar is a supervisory director of the Company, and has been a supervisory director since June 2014. He has over 40 years of experience in the automotive industry, serving in a variety of engineering and management roles. Mr. Dhar also holds directorships in multiple SMG companies. Mr. Vivek Chaand Sehgal is a supervisory director of the Company and has been a supervisory director since June 2014. Mr. Sehgal established Motherson in 1975 and Motherson Sehgal Cables in 1977. In 1983, he entered into a technical collaboration with Tokai Electric Co. (now Sumitomo Wiring Systems Limited (“SWS”)) and in 1986 entered into a joint venture with SWS to form MSSL. He is a director and chairman of MSSL and holds directorships in multiple SMG companies.

Annual Report 2018-19
Directors’ report
22
Mr. Gaya Nand Gauba is a supervisory director of the Company and has been a supervisory director since June 2014. He also currently serves as Chief Financial Officer of MSSL. Mr. Gauba joined MSSL in 1997, and has accumulated over 38 years of experience in finance, accounting and taxation working at various companies in India. He also holds directorships in various SMG companies. Mr. Gauba is an Associate Member of the Institute of Cost and Works Accountants of India and an Associate Member of the Institute of Company Secretaries of India. Mr. Gauba holds a Bachelor of Commerce (Honours) and a Master of Commerce from the University of Delhi. Mr. Kunal Malani is a supervisory director of the Company and head of the Strategic Team of SMG, and has been a supervisory director since October 2014. Mr. Malani has 15 years of experience in banking and consulting roles, including positions with Merrill Lynch and India Infoline prior to joining SMG in 2013. Mr. Malani received a Bachelor’s of Commerce with honors from Calcutta University and completed a postgraduate program in Management at the Indian School of Business. He is a member of the Institute of Chartered Accountants of India. Mr. Cezary Zawadzinski is a supervisory director of the Company and Chief Operating Officer of SMR, and has been a supervisory director since June 2014. He has been with SMR for 13 years and has 23 years of experience in the automotive industry. He holds a Bachelor of Engineering (Metallurgy) from Akademia Gorniczo Hutnicza, Poland and a Bachelor of Administration from Wyzsza Szkola Zarzadzania, Poland.
Ms. Geeta Mathur is a supervisory director of the Company since April 2019. She is a graduate in Commerce (Hons.) from Sri Ram College of Commerce, Delhi University, India and a qualified Chartered Accountant with a meritorious educational background. She has over 25 years of rich experience in the field of project, corporate and structured finance, treasury, business development, investor relations, strategic planning and team building in diverse industries like finance, real estate, chemicals and plastic compounds and also in NGOs. Ms. Mathur is an Independent Director on the Board of various Indian Companies including Motherson Sumi Systems Limited.
A.17. ACKNOWLEDGEMENT
Your Board of Directors would like to place on record their sincere appreciation for the wholehearted support and contributions made by all the employees of the Company as well as customers, suppliers, bankers, auditors and other authorities. Approved by the Board of Directors and signed on behalf of the Board. Date: May 21, 2019

Annual Report 2018-19
Management discussion and analysis
23
MANAGEMENT DISCUSSION AND ANALYSIS
BUSINESS OVERVIEW
Samvardhana Motherson Automotive Systems Group BV together with its subsidiaries (hereinafter referred as “SMRP BV Group” or “the Group”) are a leading global Tier 1 supplier of rear view vision systems and interior and exterior modules (including door panels, instrument panels and bumpers) to automotive original equipment manufacturers (“OEMs”) primarily for use in the production of light vehicles. We are also a member of the Samvardhana Motherson Group (“SMG”), one of the global Tier 1 automotive supplier. We have long-term relationships with global OEMs by production volume and our OEM customers collectively represented over 90% of global automotive production. In addition, we currently hold leading market positions in our key product segments and geographies, particularly in the premium segment (which includes brands such as Audi, Daimler, VW, BMW, Renault/Nissan, PSA, Porsche, Ford, Hyundai and others), on which we are especially focused. We are active across the phases of our products’ lifecycles, from product conception, design, styling, prototyping and validation to the manufacture, assembly and subsequent delivery of fully-engineered assembled products. SMRP BV Group has presence in each major global automotive production region, with 68 production facilities spread across 24 countries and strategically located in close proximity to the manufacturing plants of the OEM customers. SMRP BV Group operate business through following main divisions:
Rear view vision systems: SMR division produces a wide range of rear-view vision systems primarily for light vehicles and is a leading global supplier of exterior mirrors. Rear view mirrors play an important role in automotive safety and design, and are becoming increasingly sophisticated. SMR’s mirrors are engineered to optimize aerodynamics and integrate technologically advanced features that enhance safety, comfort and aesthetics. SMR is active in every phase of the product development cycle, and its product portfolio covers a wide spectrum of vehicle and price segments, from low-cost mirrors to highly complex premium mirrors incorporating a variety of electronic features. SMR’s focus on research & development and customer collaboration has resulted in various first-to-market innovations and a variety of full system solutions tailored to the needs of OEMs and end consumers, including Blind Spot Detection Systems (BSDS) and Telescopic Trailer Tow (TTT) mirrors.
From its division headquarters in Stuttgart, Germany, SMR operated 21 manufacturing facilities with presence in 16 countries and employed 10,655 people as of March 31, 2019.

Annual Report 2018-19
Management discussion and analysis
24
Interior and exterior modules: SMP division produce various polymer-based interior and exterior products for light vehicles. SMP’s product portfolio is primarily comprised of complete modules, including door panels, instrument panels and bumpers as well as other plastic components and systems, such as centre consoles, decorative interior trims and plastic body parts. These products involve a complex manufacturing and assembly processes, require significant systems integration expertise and represent key comfort and aesthetic features of the vehicles in which they are integrated.
SMP focuses on the premium segment, and is a leading global supplier of door panels, instrument panels and bumpers. SMP’s facilities are strategically located in close proximity to the plants of its OEM customers, allowing for minimal lead times and transport costs and efficient inventory management through “just-in-time” and “just-in-sequence” deliveries to customers. SMP’s research and development team are focussed on meeting and exceeding the steadily increasing requirements of its customers and focuses on key areas including lightweight constructions, renewable raw materials, occupant protection and pedestrian protection. The engineering team works with OEM to develop cost-efficient innovative products along with adding new functionalities and continually improving SMP’s existing product range. SMP division includes business of SMIA which was acquired in January 2015, SMIA with its headquarters in Michelau (Germany) is an internationally renowned specialist in plastic technologies since it’s foundation in 1967. SMP division also includes Kobek Siebdruck GmbH & Co. KG (hereinafter ‘Kobek’), renamed as Motherson Innovations Lights Gmbh & Co KG (“MIL”) acquired in January 2017. MIL is a specialist in lightning solutions and has been a supplier to the SMP subsidiaries.

Annual Report 2018-19
Management discussion and analysis
25
SMP division also includes Reydel Automotive Group which was acquired on August 02, 2018 by SMRP BV by purchasing 100% stake in Reydel Automotive Holdings B.V. and Reydel Automotive Management B.V. (subsequently renamed as Samvardhana Motherson Reydel Companies” or “SMRC”).
SMRC manufactures interior components and modules for global automotive customers and further strengthens the SMRP BV’s offerings in the automotive interiors space along with existing SMP group. SMRC is a leading global developer and supplier of interior components to the global automotive manufacturers. SMRC’s Interiors Product Portfolio includes Instrument Panels, Door Panels, Console Modules, Decorative Parts and Cockpit Modules. SMP (including SMIA & SMRC) operated 47 manufacturing facilities in 20 countries and employed 21,887 people as of March 31, 2019. GROUP STRUCTURE
The following diagram represents the Corporate Structure of SMRP BV Group along with details of its principal shareholders:
Corporate Structure as at March 31, 2019 and is not a legal structure.
Samvardhana Motherson Polymers
Ltd.
(India)
Samvardhana Motherson Global
Holdings Ltd.
(Cyprus)
49%
51%
49%
51%
69% 31%
100% 100% 100% 98.5%Samvardhana Motherson Automotive
Systems Group B.V. (SMRP BV)
SMP Automotive Technology
Iberica S.L.
(Spain)
Samvardhana Motherson
Peguform GmbH
(Germany)
Samvardhana Motherson Reflectec
Group Holdings
Limited (Jersey)
SMP Automotive Interiors
(Beijing) Co. Ltd
100% 100% 100%94.8%
SMP Automotive Exterior
GmbH
(Schierling, Germany)
SMP Deutschland GmbH
(Germany)
Samvardhana Motherson
Innovative Autosystems
B.V. & Co. KG
Motherson
Innovations Lights
GmbH & Co. KG
Subsidiaries & Joint Ventures Subsidiaries & Joint VenturesSubsidiaries, Joint Ventures
& Associates
100%
Samvardhana
Motherson
Reydel Companies
Subsidiaries & Joint
Ventures

Annual Report 2018-19
Management discussion and analysis
26
CORPORATE INFORMATION
MANAGEMENT BOARD :
The Management Board of the company is responsible for managing day to day business and to legally represent the company in its dealing with third parties while maintaining high standards of corporate governance and corporate responsibility. Management Board consists of following members:
1. Laksh Vaaman Sehgal Managing Director (Chairman and Chief Executive Officer) 2. Andreas Heuser Managing Director 3. Jacob Meint Buit Resident Managing Director 4. Randolph de Cuba Resident Managing Director
SUPERVISORY BOARD :
The Supervisory Board of the company is responsible for supervising the management board’s policy and course of action and to supervise the general conduct of the affairs of the company and any business it may be affiliated with. The supervisory board assists the management board in an advisory capacity and have to carry out their duties in the interest of the company. Supervisory Board consists of following members:
1. Vivek Chaand Sehgal Director and Chairman SMG 2. Bimal Dhar Director and Chief Executive Officer-SMP 3. Cezary Zawadzinski Director and Chief Operating Officer-SMR 4. G.N. Gauba Director 5. Kunal Malani Director 6. Geeta Mathur Director (w.e.f. April 01, 2019)
The above composition of Management & Supervisory Board is as on date. REGISTERED OFFICE :
The registered office of the company is under : Hoogoorddreef 15, 1101 BA Amsterdam The Netherlands AUDITORS: The statutory auditors of the company are: Ernst & Young Accountants LLP Boompjes 258, 3011 XZ, Rotterdam, The Netherlands

Annual Report 2018-19
Management discussion and analysis
27
GEOGRAPHICAL FOOTPRINT SMRP BV Group now operates 68 manufacturing facilities across 24 countries. Out of 68 manufacturing plants, SMR operates 21 manufacturing plants, SMP (including SMIA & SMRC) operates 47 manufacturing plants. With SMRC acquisition, SMRPBV has got footprint expansion into five new geographies which are Croatia, Indonesia, Philippines, Morocco and Argentina. SMRP BV Group’s global footprint enables strategic presence of manufacturing facilities with close proximity to the plants of OEM customers. This enhances the ability to supply to in a timely and cost-efficient manner, particularly with respect to the majority of interior & exterior modules, including door panels, instrument panels and bumpers, which cannot typically be transported efficiently. In addition, consumer demand for vehicle personalisation in the premium segment has increased the complexities of interior and exterior modules, some of which could have hundreds of potential permutations and combinations. To overcome these challenges, SMRP BV assemble products in close proximity to the plants of OEM customers, and deliver them on “just-in-time” and “just-in-sequence” basis directly to customers’ production lines with minimal lead times. SMRP BV Group intends to continue to expand global footprint in line with the international expansion of main OEM customer’s production footprint, particularly in emerging markets in Americas & Asia Pacific region. Following chart provides an overview of SMRP BV Group’s global footprint:
Above information is as at March 31, 2019
* Include full time, part time, temporary & contract employees
32,500+Workforce*.
Countries. 24
68Plants.

Annual Report 2018-19
Management discussion and analysis
28
FINANCIAL PERFORMANCE FOR THE QUARTER AND YEAR ENDED MARCH 31, 2019
Samvardhana Motherson Automotive Systems Group BV’s Board has approved its consolidated financial statements for the fiscal year ended March 31, 2019. The Consolidated financial statements have been prepared in accordance with the International Financial Reporting Standards (IFRS) as adopted by the European Union (EU) and also comply with the financial reporting requirements included in Part 9 of Book 2 of the Dutch Civil Code, as far as applicable. SMRP BV acquired SMRC on 2nd August 2018 and therefore the results for the financial year and quarter ended March 31, 2019 includes the results of SMRC post acquisition. CHANGE IN ACCOUNTING STANDARD IFRS 15
During the period ended March 31, 2019, IFRS 15 – Revenue from Contracts with Customers became applicable on the Group. The management has conducted detailed analysis on the implications of implementation of new standard on the revenue. The Group builds all customized products for its customers. In certain contracts, the Group is undertaking higher level assemblies of modules such as Instrument Panels, Cockpits etc. wherein whole/ substantial components are procured from suppliers nominated by customer without taking over any risks on the Company itself. Such a situation has been defined in standard as the Group acting as an agent, and requires recognition of revenues excluding the value of such components. In view of implementation of new standard, only service fees involved in such contracts where the company has limited risks has been recognized as revenue by netting the cost of such components from raw material consumption as well as from sales as against earlier practice of full value to be included in Revenue. The new standard has been applied from April 01, 2018. The Group has adopted modified retrospective approach and hence comparative figures have not been reinstated. Therefore, certain line items like revenue, cost of materials etc. are not comparable with the corresponding previous interim period. This change in presentation resulted in decrease in revenue by k€ 518,736 for the fiscal year ended March 31, 2019. This change does not impact profits before and after tax. COMPARATIVE DISCLOSURE
During fiscal year ended March 31, 2019 SMRPBV witnessed commencement of commercial production from its greenfields at Kesckemet (Hungary) & Tuscaloosa (USA). Also, on August 2, 2018 SMRP BV acquired SMRC. Financial performance of current fiscal year was influenced by these factors, therefore to facilitate comparison we have presented key financial information excluding impact of greenfields and SMRC. Further due to change in accounting standard IFRS 15 as explained in previous paragraph, certain items like revenue, cost of material etc for the quarter and fiscal year ended March 31, 2019 are not comparable to the corresponding previous periods therefore we have adjusted the impact of IFRS 15 from the reported revenue to derive gross revenue for the quarter and twelve months ended March 31, 2019. All key profitability ratios have been expressed accordingly.

Annual Report 2018-19
Management discussion and analysis
29
FINANCIAL HIGHLIGHTS The company’s financial highlights for the fiscal year ended March 31, 2019 are summarized as follows:
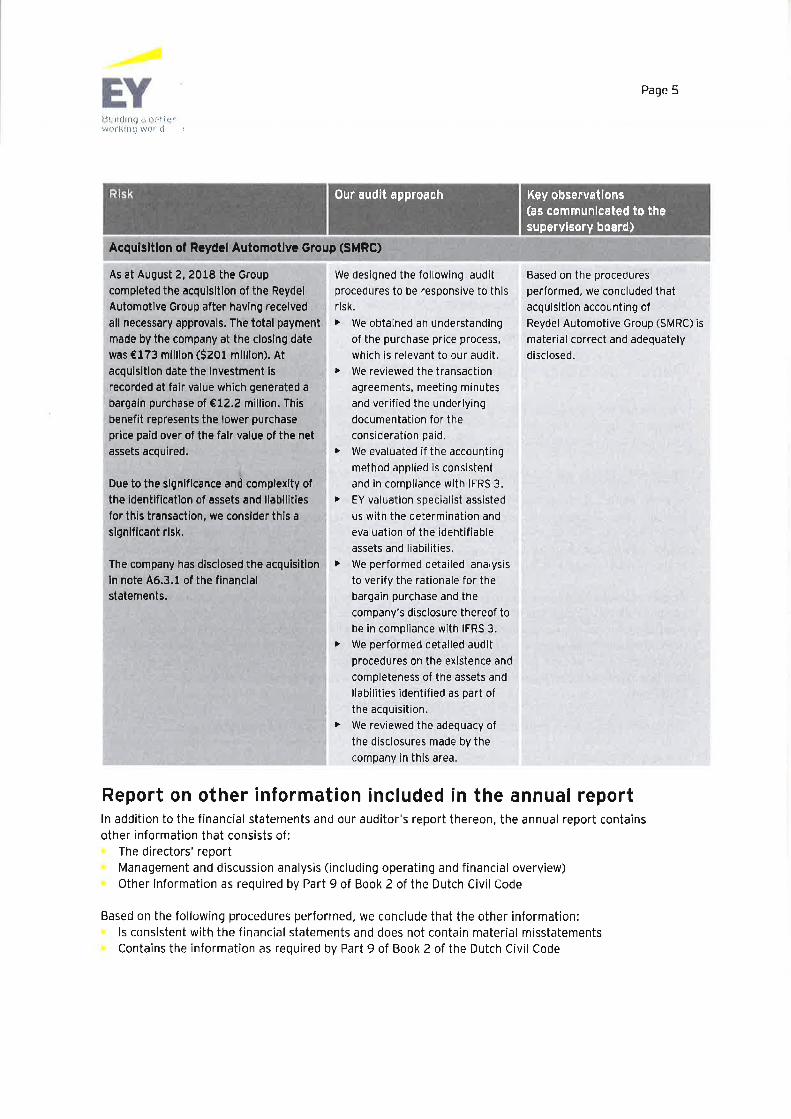
• Successfully completed acquisition of Reydel Automotive Group (renamed as SMRC) on 2nd August 2018. The purchase consideration paid was USD 200.4 million.
• Recorded revenue of €5.8 Billion in FY 18-19 which represents growth of 16% (on gross basis excluding impact of IFRS 15) over corresponding previous year.
• Recorded EBITDA of €335 Millions in FY 18-19. This excludes bargain gain on fair valuation.
• Stable Net Leverage < 2.0x – March 31, 2019 at 1.98x. Even after including subordinated shareholder loan Net Leverage <2.5x – March 31, 2019 at 2.40x
• Steady Order Book as on March 31, 2019 for € 18.2 bn
• Standard & Poor’s has reaffirmed corporate credit rating of BB+ with stable outlook.
• Fitch Ratings also reaffirmed corporate rating of BB+ with Positive outlook.
• SMP Greenfield plants at Kecskemet (Hungary) and Tuscaloosa (USA) commenced commercial production during FY 2018-19.
REVIEW OF CONSOLIDATED FINANCIALS Following are the summary financials for the quarter and fiscal year ended March 31, 2019:
Following are the summary financials for the quarter and fiscal year ended March 31, 2019 excluding greenfields Tuscaloosa (USA) & Kesckemet (Hungary) and SMRC:
Income Statement
€ millionsSMRPBV
Group*SMP SMR
SMRPBV
Group*SMP SMR
Revenue - Reported 1,301 895 407 1,489 1,060 429
Revenue - Gross 1,301 895 407 1,639 1,210 429
EBITDA (excl.gain on bargain purchase) 108 60 55 68 20 52
% to Revenue (Gross) 8.3% 6.7% 13.5% 4.1% 1.7% 12.1%
3M ended Mar 31, 2018 3M ended Mar 31, 2019
Income Statement
€ millionsSMRPBV
Group*SMP SMR
SMRPBV
Group*SMP SMR
Revenue - Reported 5,024 3,452 1,575 5,312 3,704 1,611
Revenue - Gross 5,024 3,452 1,575 5,831 4,223 1,611
EBITDA (excl.gain on bargain purchase) 378 205 189 335 159 188
% to Revenue (Gross) 7.5% 5.9% 12.0% 5.7% 3.8% 11.7%
Year ended Mar 31, 2018 Year ended Mar 31, 2019
Income Statement
€ millionsSMRPBV
Group*SMP SMR
SMRPBV
Group*SMP SMR
Revenue - Reported 1,269 863 407 1,112 683 429
Revenue - Gross 1,269 863 407 1,262 833 429
EBITDA (excl.gain on bargain purchase) 128 80 55 119 71 52
% to Revenue (Gross) 10.1% 9.3% 13.5% 9.4% 8.5% 12.1%
3M ended Mar 31, 2018 3M ended Mar 31, 2019
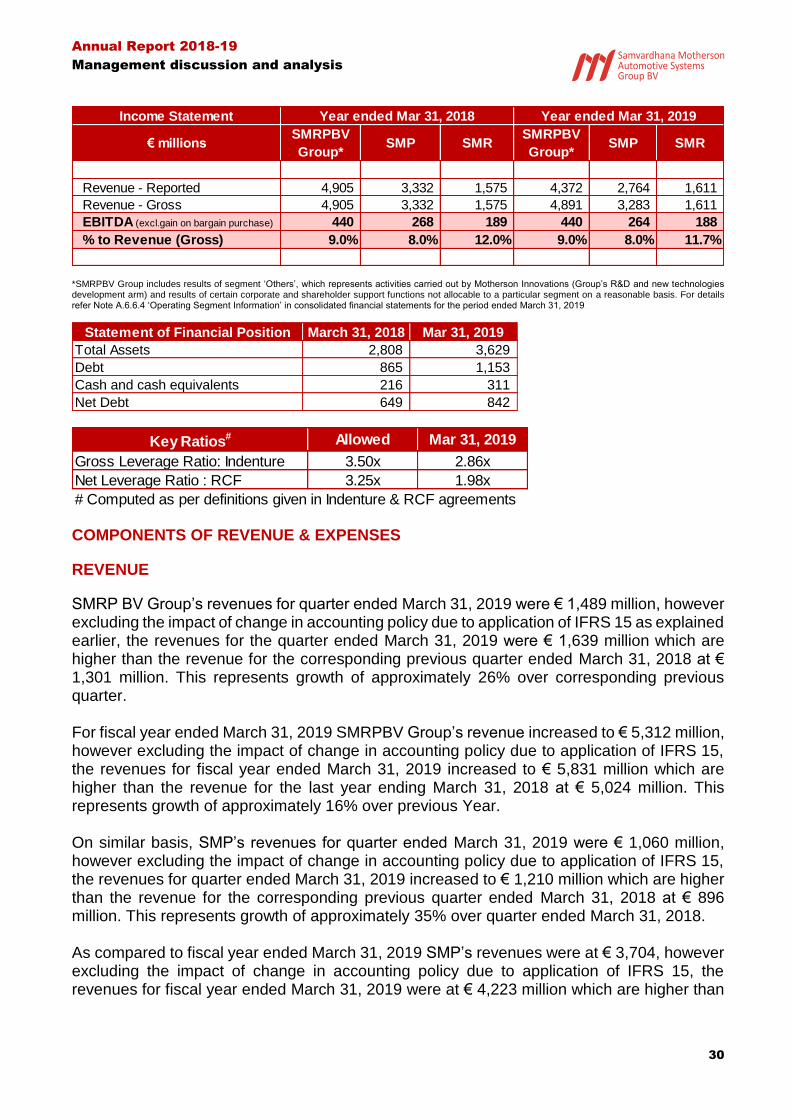
Annual Report 2018-19
Management discussion and analysis
30
*SMRPBV Group includes results of segment ‘Others’, which represents activities carried out by Motherson Innovations (Group’s R&D and new technologies development arm) and results of certain corporate and shareholder support functions not allocable to a particular segment on a reasonable basis. For details refer Note A.6.6.4 ‘Operating Segment Information’ in consolidated financial statements for the period ended March 31, 2019.
COMPONENTS OF REVENUE & EXPENSES
REVENUE
SMRP BV Group’s revenues for quarter ended March 31, 2019 were € 1,489 million, however excluding the impact of change in accounting policy due to application of IFRS 15 as explained earlier, the revenues for the quarter ended March 31, 2019 were € 1,639 million which are higher than the revenue for the corresponding previous quarter ended March 31, 2018 at € 1,301 million. This represents growth of approximately 26% over corresponding previous quarter. For fiscal year ended March 31, 2019 SMRPBV Group’s revenue increased to € 5,312 million, however excluding the impact of change in accounting policy due to application of IFRS 15, the revenues for fiscal year ended March 31, 2019 increased to € 5,831 million which are higher than the revenue for the last year ending March 31, 2018 at € 5,024 million. This represents growth of approximately 16% over previous Year. On similar basis, SMP’s revenues for quarter ended March 31, 2019 were € 1,060 million, however excluding the impact of change in accounting policy due to application of IFRS 15, the revenues for quarter ended March 31, 2019 increased to € 1,210 million which are higher than the revenue for the corresponding previous quarter ended March 31, 2018 at € 896 million. This represents growth of approximately 35% over quarter ended March 31, 2018. As compared to fiscal year ended March 31, 2019 SMP’s revenues were at € 3,704, however excluding the impact of change in accounting policy due to application of IFRS 15, the revenues for fiscal year ended March 31, 2019 were at € 4,223 million which are higher than
Income Statement
€ millionsSMRPBV
Group*SMP SMR
SMRPBV
Group*SMP SMR
Revenue - Reported 4,905 3,332 1,575 4,372 2,764 1,611
Revenue - Gross 4,905 3,332 1,575 4,891 3,283 1,611
EBITDA (excl.gain on bargain purchase) 440 268 189 440 264 188
% to Revenue (Gross) 9.0% 8.0% 12.0% 9.0% 8.0% 11.7%
Year ended Mar 31, 2018 Year ended Mar 31, 2019
Statement of Financial Position March 31, 2018 Mar 31, 2019
Total Assets 2,808 3,629
Debt 865 1,153
Cash and cash equivalents 216 311
Net Debt 649 842
Key Ratios# Allowed Mar 31, 2019
Gross Leverage Ratio: Indenture 3.50x 2.86x
Net Leverage Ratio : RCF 3.25x 1.98x
# Computed as per definitions given in Indenture & RCF agreements

Annual Report 2018-19
Management discussion and analysis
31
the revenue for the last year ending March 31, 2018 at € 3,452 million. This represents growth of approximately 22% over previous Year. As explained earlier, the revenues of SMP for quarter and fiscal year ended March 31, 2019 are influenced by start of commercial production at Greenfield Plants viz. Tuscaloosa (USA) and Kecskemet (Hungary) and integration of SMRC’s results post acquisition on August 02, 2019. Excluding the impact of Greenfields and revenue contribution of SMRC, SMP’s revenues for quarter ended March 31, 2019 were € 834 million (excluding IFRS 15 impact) which are marginally lower with revenue for the corresponding previous quarter ended March 31, 2018 at € 863 million. Similarly, SMP’s revenues for fiscal year ended March 31, 2019 were € 3,282 million (excluding IFRS 15 impact) which are consistent with revenue for the corresponding previous year ended March 31, 2018 at € 3,332 million. The decline in revenue for quarter and fiscal year ended March 31, 2019 is due to flat volumes from OEMs in European market. SMR’s revenues for quarter ended March 31, 2019 were € 429 million as compared to revenue of corresponding previous quarter ended March 31, 2018 at € 407 million. This represents growth of approximately 5% over quarter ended March 31, 2018. SMR’s revenue were at € 1,611 million for the fiscal year ended March 31, 2019 as compared to € 1,575 million for the fiscal year ended March 31, 2018. This represents growth of approximately 2% over previous Year. Geographical Spread of Revenues During the fiscal year ended March 31, 2019, 63% of the revenues were contributed by European region, APAC region contributed 17% and Americas contributed 20% to the overall group revenues. The company had achieved the healthy revenue growth across various geographies on consolidated basis. While Germany continues to be the biggest market but with growth in Hungary from 9% to 12%, France from 2% to 8% and USA from 8% to 10% in current fiscal year ended March 31, 2019 over corresponding previous year geographical footprint is getting much more balanced. The geographical spread of revenues is getting more balanced with ramp-up of commercial production from Greenfields at USA & Hungary and revenue from SMRC locations. The following chart shows the geographical spread of reported revenue for fiscal year ended March 31, 2019 (outer pie) and corresponding previous fiscal year ended March 31, 2018 (inner pie):

Annual Report 2018-19
Management discussion and analysis
32
Diversified Customer Portfolio SMRP BV Group is a trusted partner and strategic Tier I supplier to leading global OEMs and have well established strategic relationships with several OEMs across the globe. The ability to support OEMs in every phase of product development process differentiates the company from many of the competitors and given the substantial investment & time that would be required to replicate company’s global footprint, strengthens the status of SMRP BV Group as a preferred partner to most of the leading OEMs in the automotive industry. The company is able to engage with customers during the early stages of collaborative development projects which regularly enables the company to introduce company’s products into vehicle’s designs phase. This collaboration when combined with close proximity to customer, technological leadership, demonstrated reliability and financial stability results into maintaining strong track record by not only winning repeat orders but new global upcoming platforms. The following chart shows the change in revenue spread by customers for fiscal year ended March 31, 2019 (outer pie) and corresponding previous fiscal year ended March 31, 2018 (inner pie):
33%
9%
8%
19%
2%
7%
7%
5%
3%3%2%
1%1%
Germany 28%
Hungary 12%
USA 10%
Spain 9%
France 8%
China 8%
Mexico 7%
Korea 6%
Brazil 3%
UK 3%
India 2%
Portugal 2% Others
2%

Annual Report 2018-19
Management discussion and analysis
33
The group constantly monitors its vision of 3CX15. During the current fiscal year ended March 31, 2019 there is consistent growth in all customers leading to a diversified customer portfolio. As depicted by above chart, as percentage of share of total reported revenue while Audi continues to be largest customer but with share of Daimler, Renault/Nissan and PSA growing steadily, it is leading to more balanced customer profile. With SMRC acquisition and launch & ramp-up of new orders from Kecskemet & Tuscaloosa, customer profile is getting more balanced going forward.
24%
14%
10%5%
3%
7%
5%
5%
4%
3%
9%
2%
2% 7%
Audi 19%
Daimler 16%
VW 13%
Renault /Nissan 7%
PSA 7%
BMW 7%
Porsche 5%
Ford 4%
Hyundai 4%
GM 4%
Seat 2%
Kia 2%
JLR 2%
Others 8%

Annual Report 2018-19
Management discussion and analysis
34
ORDER BOOK
SMRP BV benefit from mid-term revenue visibility, with an estimated Order Book of €18.2 billion as of March 31, 2019, this includes Order book from SMRC for € 2.3 billion appx. Lifetime value of new orders won during fiscal year ended March 31, 2019 was € 5.6 billion and orders worth € 6.8 billion were put into commercial production during this period and hence taken out from Order book.
Order book represents the gross sales that we expect to record over the life time of the orders under contracts for vehicle programs that we have been awarded by OEMs but which are not yet in production and is comprised of both incremental and repeat business. The Order book is based on the nomination of the contract and later during the development phase the exact performance requirements will materialize. EBITDA
The consolidated EBITDA after excluding gain on bargain purchase of SMRC, was € 68 million for the quarter ended March 31, 2019 representing 4.1% to gross reported revenue, which is lower than EBITDA for the corresponding previous quarter ended March 31, 2018 at € 108 million representing 8.3% of reported revenue. On similar basis, EBITDA for the fiscal year ended March 31, 2019 was € 335 million representing 5.7% to gross reported revenue, which is lower than EBITDA for the corresponding previous fiscal year ended March 31, 2018 at € 378 million, representing 7.5% to gross reported revenue. EBITDA for the quarter and fiscal year ended March 31, 2019 was influenced by significant start up and ramp up cost during stabilization period of both SMP Greenfields at Kecskemet and Tuscaloosa. These plants started commercial production during fiscal year ended March 31, 2019. Further during fiscal year ended March 31, 2019 SMRC contributed to SMRPBV’s EBITDA for 8 months since its acquisition on 2nd August 2018.
7.7
10.8
13.5 12.9
17.2 18.2
As on
31.03.2014
As on
31.03.2015
As on
31.03.2016
As on
31.03.2017
As on
31.03.2018
As on
31.03.2019
€ B
illi
ons

Annual Report 2018-19
Management discussion and analysis
35
Excluding Greenfields and post-acquisition results of SMRC, EBITDA for the fiscal year ended March 31, 2019 was € 440 million representing 9.0% to gross reported revenue, vis-a-vis EBITDA for the corresponding previous fiscal year ended March 31, 2018 at € 440 million, representing 9.0% to gross reported revenue. For the quarter ended March 31, 2019, SMP’s EBITDA was € 20 million representing 1.7% to gross revenue lower than € 60 million representing 6.7% to gross revenue for the quarter ended March 31, 2018. For the fiscal year ended March 31, 2019 SMP’s EBITDA was € 159 million representing 3.8% to gross revenue lower than € 205 million representing 5.9% to gross revenue for the fiscal year ended March 31, 2018. As explained earlier, excluding Greenfields and post-acquisition results of SMRC, SMP’s EBITDA for the fiscal year ended March 31, 2019 was € 264 million representing 8.0 % to gross revenue, vis-a-vis EBITDA for the corresponding previous fiscal year ended March 31, 2018 at € 268 million, representing 8.0% to gross revenue. SMR’s EBITDA for quarter ended March 31, 2019 was € 52 million representing 12.1% to revenue vis-à-vis EBITDA of corresponding previous quarter ended March 31, 2018 at € 55 million representing 13.5% of revenue. SMR’s EBITDA margins are consistent for the fiscal year ended March 31, 2019 at €188 million representing 11.7% as compared to €189 million representing 12.0% for corresponding fiscal year ended March 31, 2018. COST OF MATERIALS
Cost of materials includes purchases of raw materials, purchases of goods and tools for resale, discounts for prompt payment, purchase returns and similar transactions, volume discounts, changes to inventories, consumption of other supplies and purchase of pre-constructed components. These are primarily variable in nature based on the product mix sold during the period. Cost of material was at € 911 million for the quarter ended March 31, 2019, however excluding the impact of change in accounting standard as explained earlier, the cost of material was at €1,061 million as compared to €814 million for the corresponding previous quarter ended March 31, 2018. For the fiscal year ended March 31, 2019 cost of material was €3,727 million on a gross basis as compared to €3,216 million for the fiscal year ended March 31, 2018. As a % to gross revenue, cost of material was 63.9% for the fiscal year ended March 31, 2019 as compared to 64.0% for the previous year ended March 31, 2018. The absolute increases in cost of materials is primarily due to increased production volume and higher engineering projects due to launch of new programmes for our OEMs as well as inclusion of SMRC in the current period. The total cost of material is improving as percentage of revenue.
Annual Report 2018-19
Management discussion and analysis
36
PERSONNEL COSTS
Personnel expenses include wages, salaries, paid labour rendered by third parties, employer’s social security contributions and other welfare expenses. Personnel expenses are primarily driven by the size of our operations, our geographical reach and customer requirements. Personnel expenses were at € 349 million which accounted for 21.3% of gross revenues for the quarter ended March 31, 2019. This is higher as compared to € 256 million which accounted for 19.7% of gross revenues for the corresponding previous quarter ended March 31, 2018. For the fiscal year ended March 31, 2019 personnel expenses were € 1,205 million higher than €975 million for the previous year ended March 31, 2018 representing 20.7% of gross revenues for March 31, 2019 and 19.4% of gross revenues for March 31, 2018. These increases were primarily due to increased capacity and production level, ramp up of production at new Greenfield plants in Hungary and USA. OTHER OPERATING EXPENSES
Other operating expenses primarily consists of general administrative expenses, energy costs, repair & maintenance costs, rental & lease costs, freight & forwarding costs, auditors’ remuneration, net foreign exchange loss and legal & professional fees. Other operating expenses were at € 178 million which accounted for 10.9% of gross revenues for the quarter ended March 31, 2019. This is higher in absolute terms as compared to € 135 million which accounted for 10.4% of gross revenues for the corresponding previous quarter ended March 31, 2018. For the fiscal year ended March 31, 2019 Other Operating Expenses represented 10.6% of gross revenues at €616 million as compared to 9.9% of gross revenues at €495 million for the previous year ended March 31, 2018. Increase in operating expenses is attributed primarily due to increase in variable cost of operations due to increased capacity & production levels and start-up costs for the new plants expensed to income statement as conservative accounting practice. OTHER OPERATING INCOME
Other operating income primarily consists of income from development work & other recoveries from customers, rental income, royalty income and subsidies or grants. Other operating income excluding gain on bargain purchase of SMRC for the quarter ended March 31, 2019 were at € 7 million as compared to € 13 million for the quarter ended March 31, 2018. For the fiscal year ended March 31, 2019 Other Operating Income was €40 million as compared to €40 million for the previous year ended March 31, 2018.

Annual Report 2018-19
Management discussion and analysis
37
DEPRECIATION & AMORTISATION
Depreciation & Amortisation refers to the amount recognized in the income statement reflecting the amortized value of the tangible and intangible assets on a straight-line basis over the estimated useful life of the asset. Depreciation & Amortisation for the quarter ended March 31, 2019 were at € 50 million and € 34 million for the quarter ended March 31, 2018. For the fiscal year ended March 31, 2019, Depreciation and Amortisation expenses were €168 million higher than € 123 million for the fiscal year ended March 31, 2018. The increase in absolute values reflect impact of depreciation on new facilities which have commenced commercial production as well as inclusion of SMRC post acquisition from August 2018 onwards. FINANCE COSTS/(INCOME)
Finance cost consists primarily of interest expense on borrowings, finance leases and defined benefit obligations as well as foreign exchange losses on long-term loans. Finance income consists of interest income, return on plan assets under defined benefit obligations and foreign exchange gain. The following table depicts the net finance cost and adjusted net finance cost for the quarter and fiscal year ended March 31, 2019 and March 31, 2018. Adjusted net finance cost represents finance cost as adjusted for amortisation of bond issuance cost & upfront fees paid on credit facilities and foreign exchange gain/(loss) included in finance cost:
1) During the previous year ended March 31, 2018 the Company recorded € 21 million towards one time/exceptional costs amounting to € 11 million on early redemption of € 500 million notes and € 10 million on write-off of unamortised transaction costs.
2) Represents pro-rata amortisation of bond issuance cost and upfront fees paid on credit facilities
3) Foreign exchange gain/loss on reinstatement of foreign currency loans and related items included in net finance cost
Net Finance Cost - € millions Q4 FY 17-18 Q4 FY 18-19 Inc(+)/Dec(-)
Net Finance Cost 9 12 3
Add / (Less)
Amortisation charge2 (0) (1) (1)
Foreign Exchange Gain / (Loss) (Net)3 (1) 1 2
Adjusted net finance cost 8 12 4
Net Finance Cost - € millions FY 17-18 FY 18-19 Inc(+)/Dec(-)
Net Finance Cost 60 38 (22)
Add / (Less)
Exceptional costs1 (21) - 21
Amortisation charge2 (2) (2) (0)
Foreign Exchange Gain / (Loss) (Net)3 (3) 7 10
Adjusted net finance cost 34 43 9
Annual Report 2018-19
Management discussion and analysis
38
As evident from above table, after excluding impact of items as explained above, net finance cost for the quarter ended March 31, 2019 was at € 12 million as compared to € 8 million for the corresponding previous quarter ended March 31, 2018. For the fiscal year ended March 31, 2019 adjusted net finance cost increased to €43 million as compared to €34 million for the fiscal year ended March 31, 2018. The increases are due to higher level of borrowings to support the increased working capital requirements due to increase plant capacities, new plant commencements, capital expenditure incurred in setting up of new facilities and payment of purchase consideration for SMRC acquisition. INCOME TAXES
Income tax represents the sum of tax currently payable and deferred tax under the laws of each jurisdiction in which the business is conducted. Tax is calculated at domestic tax rates applicable in the respective countries. Income tax expenses for the quarter ended March 31, 2019 were € 8 million as compared to € 18 million for the quarter ended March 31, 2018 and € 45 million for the fiscal year ended March 31, 2019 as compared to €71 million for the previous year ended March 31, 2018. The variations in absolute numbers are due to variation in profitability at various entities.
This space has been intentionally left blank

Annual Report 2018-19
Management discussion and analysis
39
TRADE WORKING CAPITAL
Net trade working capital as at March 31, 2019 was at € 284 million and as at March 31, 2018
was at € 246 million. Net trade working capital represents 16 days for March 31, 2019 which
is lower than 18 days of working capital as at March 31, 2018.
* Receivables - Engineering WIP represents in-progress engineering inventory recognized as receivables under percentage of completion method
Days on hand are calculated based on 360 days basis
Analysis on each of these elements are described below:
Receivables
Receivables represents the amount to be received from customers for which goods have already been sold and delivered to the customers or title of the property in goods have been transferred to customers. Trade receivable are recognised initially at fair value and carried at amortised cost. These are net of impairment due to delay or defaults which become likely in specific cases. This also include amounts in respect of in-progress engineering inventory recognized as unbilled receivables (refer note A.6.3.6 of the consolidated financial statements). The Company uses the ‘percentage of completion method’ to determine the appropriate amount to recognise in a given period. When the outcome of a construction contract can be estimated reliably and it is probable that the contract will be profitable, contract revenue is recognised over the period of the contract by reference to the stage of completion. If it is not possible to determine the level of completion reliably, revenue is recognised only to the extent of contract costs incurred that is probable will be recoverable. The receivables in respect of this revenue is recognised as unbilled receivables in the financial statements.
The Company had net receivables for € 395 million and € 321 million as at March 31, 2019 and March 31, 2018 respectively. These represent days on hand for 23 days and 23 days respectively.
Mar 18 Mar 19*
Trade liabilities (59) (61)
Receivables - Amortisation 11 12
Receivables - Unbilled Revenue 28 27
Receivables 23 23
Inventory 15 15
NWC 18 16
18 16
€ Millions. No of Days.
Mar 18 Mar 19
Trade liabilities (823) (1,042)
Receivables - Amortisation 151 197
Receivables - Unbilled Revenue 394 471
Receivables 321 395
Inventory 203 263
NWC 246 284
246
284

Annual Report 2018-19
Management discussion and analysis
40
The unbilled receivables in respect of in-progress engineering inventory (included in net receivables above) stood at € 471 million and € 394 million as at March 31, 2019 and March 31, 2018 respectively. These represent days on hand for 27 days and 28 days respectively. The above receivables are net of advances received from customers for which performance obligation is yet to be fulfilled and estimated liabilities towards open commercial topics. In some cases, engineering receivables are paid by our OEMs during program life through piece price amortisation and hence related receivables form parts of our long-term receivables. The company had such amortisation receivables for € 197 million and € 151 million as at March 31, 2019 and March 31, 2018 respectively. These represent days on hand for 12 days and 11 days respectively. This increase in amortisation receivables is due to new launches at various locations including our Greenfields. Inventories Inventories represent the amount of raw material, work-in-progress and finished goods held by the company in normal course of business. Inventories are carried at the lower of the cost or net realisable value at the reporting date. These are net of impairment due to reduced market visibility or obsolescence. The Company had inventory for € 263 million and € 203 million as at March 31, 2019 and March 31, 2018 respectively. The inventories represented days on hand for 15 days as at March 31, 2019 and 15 days as at March 31, 2018. The inventory levels are consistent to the production levels. Payables Payables comprise of trade payables and payables for capital goods. Trade Payables represents obligations to pay for goods or services that have been acquired in the ordinary course of business from the suppliers. Payable towards capital creditors represent current obligation to pay for machinery and other such items in the nature of capital expenditure and also payables for work done by third parties in relation to assets under construction. Payables are carried at their fair value. The above payables include accruals for which supplier invoices are yet to be received and are net of advances paid to suppliers for which performance obligation is yet to be fulfilled. The Company had net payables for € 1,046 million and € 823 million as at March 31, 2019 and March 31, 2018 respectively. These represent days on hand for 61 days and 59 days respectively. CAPITAL EXPENDITURE SMRP BV Group’s growth strategy includes expanding operations in line with customers’ growth and sales order book. The company is one of the few suppliers in its product segment with a global engineering & manufacturing footprint and this strong geographical diversification enables the company to capitalise on global growth opportunities while mitigating the impact of any regional demand fluctuations. The company continuously assess the need for setting up Greenfield plants or expand capacities in existing plants to cater to new platforms with existing/new customers. SMRP BV Group is also focussed on improving the cost base by enhancing the vertical integration of the manufacturing operations. Capital expenditure is also incurred to upgrade or replace key machineries utilised in manufacturing & assembly process to increase production efficiencies. Such capital expenditure primarily relates to the building of new

Annual Report 2018-19
Management discussion and analysis
41
manufacturing plants or increasing the capacities in existing plants in response to new orders from our customers. Substantial capex has been incurred in last 6 years to enhance the capabilities of the plants in both SMR & SMP. The Group has incurred about €1.4 billion in past six years for capacity expansion and modernisation leading to global footprint expansion & increased vertical integration at its plants at Germany, Hungary, USA, Mexico, Spain, Korea, China & India. Capex (Euro in Millions)
Capital expenditure incurred during fiscal year ended March 31, 2019 was €255 million as depicted per below chart:
CASH FLOW
The following summarises cash flow information for the fiscal year ended March 31, 2019:
124
218 231
319
283 255
2013-14 2014-15 2015-16 2016-17 2017-18 2018-19
Germany 23%
USA18%
Spain14%
China12%
Hungary7%
India6%
Mexico6%
Brazil4%
Korea4%
Others6%
€ 255 Millions

Annual Report 2018-19
Management discussion and analysis
42
Operating Activities Cash generated from operations before changes in working capital & income tax for the fiscal year ended March 31, 2019 was € 340 million and cash generated from working capital during same period was € 17 million. This is partially off-setted by income tax payments of € 69 million made during the fiscal year, resulting into net cash from operating activities of € 288 million during the fiscal year ended March 31, 2019. Investing Activities Net cash flow utilised in investing activities during the fiscal year ended March 31, 2019 was € 336 million. This was primarily contributed by amount paid for purchase of property, plant & equipment (including advances) for € 250 million. This was primarily incurred for setting up of two new plants in Tuscaloosa, U.S. and Kecskemét in Hungary as well as for the expansion of existing facilities in Germany, Spain, Mexico, Hungary, India and China. Further, there was a cash outflow of €173 million towards payment of purchase consideration for SMRC netted off by cash & cash equivalents of €82 million taken over at the acquisition date.
Statement of Cash Flows (€ millions)April 1, 2017 to
Mar 31, 2018
April 1, 2018 to
Mar 31, 2019
Cash flow from operating activities before changes in
working capital and income tax
388 340
Changes in working capital (59) 17
Income tax paid (73) (69)
Cash flow from operating activities 256 288
Purchase of property, plant and equipment
(including Pre-Payments)
(345) (250)
Payment for acquistion of SMRC (net of cash acquired) - (91)
Others (15) 5
Cash flow from investing activities (360) (336)
Proceeds from issue of bond 292 -
Repayment of bond (500) -
Net Proceeds from borrowings
(including finance leases)
95 198
Interest Paid (50) (45)
Others (17) (17)
Cash flow from financing activities (180) 136
Net increase in cash and cash equivalents (284) 88
Cash and cash equivalents at the beginning of the period 506 216
Variation in cash and cash equivalents from translation in
foreign currencies
(6) 7
Cash and cash equivalents at the end of the period 216 311

Annual Report 2018-19
Management discussion and analysis
43
Financing Activities Net cash flow generated from financing activities for the fiscal year ended March 31, 2019 was € 136 million. This is mainly due to proceeds from various working capital facilities and term loan utilised during the period. During the fiscal year ended March 31, 2019, interest payment on financial liabilities was € 45 million and € 17 million dividend were paid to non-controlling interest holders.
FINANCING UPDATE
Term Loan During the year, the Group entered into a term loan facility agreement for US$ 60 mn for a period of 59 months maturing August 2023. The term loan is senior secured obligation and rank ‘pari passu’ in right of payment with all the existing and future senior obligations of SMRP BV, including the obligations under the Revolving Credit Facility and the Notes and carry the same security structure as existing Notes and Revolving Credit Facility Revolving Credit Facilities During the period, the Group enhanced its liquidity access by increasing RCF size by €75 million to €575 million via adding 3 new lender banks to the RCF agreement. Shareholder Loan During the period, the Group also received support from its shareholders in the form of subordinated long-term loan € 150 million to demonstrate SMPR BV’s commitment to adherence of its financial policy. DEBT & CASH Gross Debt Gross Debt as at March 31, 2019 was € 1,153 million against € 865 million as at March 31, 2018. Gross debt increased due to utilisation from RCF facilities and a new term loan of US$ 60 million availed during the period. These borrowings are utilised primarily to support the capital expenditure incurred in setting up of new facilities and payment of purchase consideration for SMRC acquisition. Break-up of Gross Debt into various facilities is as under:
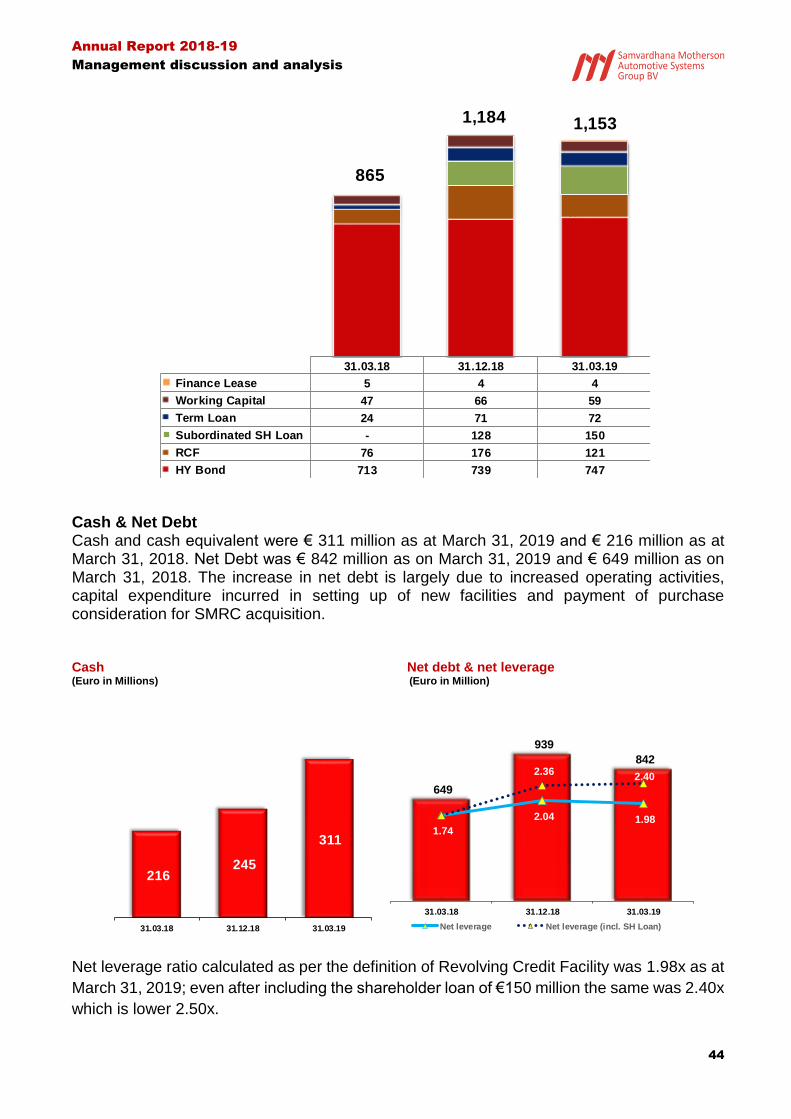
Annual Report 2018-19
Management discussion and analysis
44
Cash & Net Debt Cash and cash equivalent were € 311 million as at March 31, 2019 and € 216 million as at March 31, 2018. Net Debt was € 842 million as on March 31, 2019 and € 649 million as on March 31, 2018. The increase in net debt is largely due to increased operating activities, capital expenditure incurred in setting up of new facilities and payment of purchase consideration for SMRC acquisition. Cash Net debt & net leverage (Euro in Millions) (Euro in Million)
Net leverage ratio calculated as per the definition of Revolving Credit Facility was 1.98x as at
March 31, 2019; even after including the shareholder loan of €150 million the same was 2.40x
which is lower 2.50x.
31.03.18 31.12.18 31.03.19
Finance Lease 5 4 4
Working Capital 47 66 59
Term Loan 24 71 72
Subordinated SH Loan - 128 150
RCF 76 176 121
HY Bond 713 739 747
865
1,184 1,153
216 245
311
31.03.18 31.12.18 31.03.19
649
939
842
1.74
2.04 1.98
2.36 2.40
31.03.18 31.12.18 31.03.19
Net leverage Net leverage (incl. SH Loan)

Annual Report 2018-19
Management discussion and analysis
45
LIQUIDITY ANALYSIS
SMRP BV Group’s liquidity requirements arise principally from operating activities, capital expenditure for new facilities, maintenance & expansion capital expenditure, short term investments in engineering projects for customer new product launches, repayment of borrowings and debt service obligations. Principal source of funding includes cash from operations, committed credit lines, short-term loans and overdraft facilities at some of the operating entities. Cash generated from operating subsidiaries is utilised to finance growth within the operations of such subsidiary or is transferred to holding companies through the payment of dividends or inter-company loans. In most cases there are no significant obstacles or barriers for such transfer of funds but these are always subject to local jurisdictions at respective country. As at March 31, 2019 SMRP BV Group had significant liquidity as per below table:
* Available liquidity subject to headroom under leverage ratios
Status of leverage ratio as at March 31, 2019:
SMRP BV Group’s debt maturity profile as at March 31, 2019:
As can be seen from above maturity profile, there are no significant maturity in the next 2 years.
€ in MillionsSanctioned
Limit
Utilised as at
Mar 31, 2019
Liquidity
Available
RCF (including ancillary facilities) 575 121 454
Cash and Cash Equivalents 311
Total Liquidity Available 765
Key Ratios# Allowed Mar 31, 2019
Gross Leverage Ratio: Indenture 3.50x 2.86x
Net Leverage Ratio : RCF 3.25x 1.98x
# Computed as per definitions given in Indenture & RCF agreements
US$ 400 Million HY Bond
due FY 21-22RCF €121 Million due
June 2021
65 9
478
2 54
545
1 year 1 to 2 years 2 to 3 years 3 to 4 years 4 to 5 years > 5 years
Gross Debt € Million

Annual Report 2018-19
46
Consolidated Financial Statements
For the year ended March 31, 2019

Annual Report 2018-19
Consolidated Financial Statements
All amounts in Euro’000, unless otherwise stated
47
A.1 Consolidated Statement of Financial Position Note March 31, 2019 March 31, 2018
ASSETS
Property, plant and equipment A.6.3.2 1,506,339 1,226,709
Intangible assets A.6.3.3 45,433 26,672
Investment properties A.6.3.4 11,403 11,728
Investments accounted for using the equity method A.6.3.5 33,534 28,243
Trade receivables A.6.3.6 149,943 117,880
Other receivables and assets A.6.3.6 126,282 38,603
Investments in other entities 27,558 27,698
Other financial instruments A.6.3.7 2,087 -
Deferred tax assets A.6.5 53,392 41,559
Total non-current assets
1,955,971 1,519,092
Inventories A.6.3.8 262,693 203,192
Trade receivables A.6.3.6 460,250 358,675
Other receivables and assets A.6.3.6 612,647 497,193
Current tax assets 20,231 12,068
Other financial instruments A.6.3.7 4,902 2,048
Cash and cash equivalents A.6.3.9 310,851 215,640
Total current assets
1,671,574 1,288,816
Total assets
3,627,545 2,807,908
EQUITY AND LIABILITIES
Shareholder’s equity A.5 657,319 548,059
Non-controlling interests A.5 130,498 106,375
Total equity
787,817 654,434
Borrowings A.6.3.10 967,241 729,441
Employee benefit obligations A.6.3.11 28,659 12,611
Provisions A.6.3.12 14,003 3,965
Other financial instruments A.6.3.7 5,422 28,065
Other liabilities A.6.3.13 81,545 59,583
Deferred tax liabilities A.6.5 58,316 57,662
Total non-current liabilities
1,155,185 891,327
Trade payables 1,049,504 828,603
Provisions A.6.3.12 22,970 16,953
Borrowings A.6.3.10 185,700 134,625
Liabilities to related parties
27,239 27,579
Other financial instruments A.6.3.7 140 88
Current tax liabilities
40,250 19,462
Other liabilities A.6.3.13 358,739 234,837
Total current liabilities
1,684,543 1,262,147
Total liabilities
2,839,728 2,153,474
Total equity and liabilities
3,627,545 2,807,908
The notes on pages 54 to 153 are an integral part of these consolidated financial statements.

Annual Report 2018-19
Consolidated Financial Statements
All amounts in Euro’000, unless otherwise stated
48
A.2 Consolidated Income Statement Notes
Year ended March 31, 2019
Year ended March 31, 2018
Revenue A.6.4.1 5,312,146 5,024,428
Changes in inventories A.6.4.2 5,929 4,813
Other operating income A.6.4.3 51,875 40,262
Cost of materials
(3,202,027) (3,220,681)
Personnel expenses A.6.4.4 (1,204,574) (975,283)
Depreciation and amortization A.6.4.5 (168,309) (122,829)
Other operating expenses A.6.4.6 (616,352) (495,309)
Result from operating activities
178,688 255,401
Finance income A.6.4.7 10,226 2,286
Finance costs A.6.4.7 (48,328) (61,785)
Earnings before taxes and share of net profit/(loss) of associates and joint ventures
140,586 195,902
Share of net profit of associates and joint ventures accounted for under the equity method
A.6.4.8 7,076 13,083
Earnings before taxes (EBT)
147,662 208,985
Income tax expense A.6.5 (44,983) (70,620)
Profit for the year
102,679 138,365
Profit is attributable to:
Equity holders of the group
78,365 108,643
Non-controlling interests
24,314 29,722
Profit for the year
102,679 138,365
The notes on pages 54 to 153 are an integral part of these consolidated financial statements.

Annual Report 2018-19
Consolidated Financial Statements
All amounts in Euro’000, unless otherwise stated
49
A.3 Consolidated Statement of Comprehensive Income
Year ended
March 31, 2019 Year ended
March 31, 2018
Profit for the year: 102,679 138,365 Other comprehensive income: 31,411 (50,654) Items that will not be reclassified to income statement Remeasurements of post-employment benefit obligations (452) 25 Changes in the fair value of equity investments at fair value through other comprehensive income
(201) -
Income tax relating to these items (92) 8
Items that may be subsequently classified to income statement Cash flow hedges 6,186 (3,595) Changes in the fair value of available for sale financial assets - (370) Exchange differences on translation of foreign operations 25,970 (46,722) Total comprehensive income for the year 134,090 87,111 Total comprehensive income is attributable to: Equity holders of the group 107,000 63,565 Non-controlling interests 27,090 24,146 134,090 87,711
The notes on pages 54 to 153 are an integral part of these consolidated financial statements.
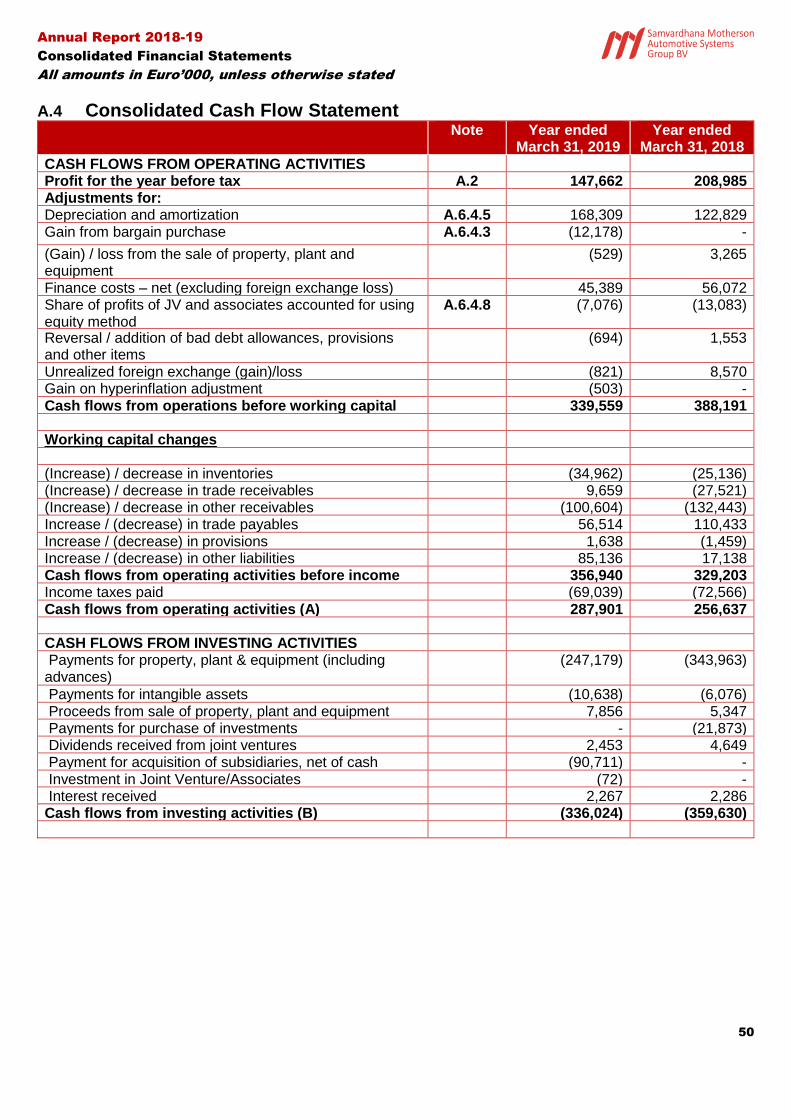
Annual Report 2018-19
Consolidated Financial Statements
All amounts in Euro’000, unless otherwise stated
50
A.4 Consolidated Cash Flow Statement Note Year ended
March 31, 2019 Year ended
March 31, 2018
CASH FLOWS FROM OPERATING ACTIVITIES
Profit for the year before tax A.2 147,662
208,985 Adjustments for:
Depreciation and amortization A.6.4.5 168,309 122,829 Gain from bargain purchase A.6.4.3 (12,178) -
(Gain) / loss from the sale of property, plant and equipment
(529) 3,265
Finance costs – net (excluding foreign exchange loss)
45,389 56,072 Share of profits of JV and associates accounted for using equity method
A.6.4.8 (7,076) (13,083)
Reversal / addition of bad debt allowances, provisions and other items
(694) 1,553
Unrealized foreign exchange (gain)/loss
(821) 8,570 Gain on hyperinflation adjustment (503) - Cash flows from operations before working capital changes
339,559 388,191
Working capital changes
(Increase) / decrease in inventories
(34,962) (25,136)
(Increase) / decrease in trade receivables
9,659 (27,521) (Increase) / decrease in other receivables
(100,604) (132,443)
Increase / (decrease) in trade payables
56,514 110,433 Increase / (decrease) in provisions 1,638 (1,459) Increase / (decrease) in other liabilities
85,136 17,138
Cash flows from operating activities before income tax
356,940 329,203
Income taxes paid
(69,039) (72,566) Cash flows from operating activities (A)
287,901 256,637
CASH FLOWS FROM INVESTING ACTIVITIES
Payments for property, plant & equipment (including advances)
(247,179) (343,963)
Payments for intangible assets
(10,638) (6,076) Proceeds from sale of property, plant and equipment
7,856 5,347
Payments for purchase of investments - (21,873) Dividends received from joint ventures
2,453 4,649
Payment for acquisition of subsidiaries, net of cash acquired
(90,711) -
Investment in Joint Venture/Associates (72)
- Interest received
2,267 2,286
Cash flows from investing activities (B)
(336,024)
(359,630)

Annual Report 2018-19
Consolidated Financial Statements
All amounts in Euro’000, unless otherwise stated
51
Note Year ended March 31, 2019
Year ended March 31, 2018
CASH FLOWS FROM FINANCING ACTIVITIES
Dividends paid to non-controlling interest in subsidiaries
(17,150) (17,383)
Finance lease payments A.6.3.10 (2,744) (2,934)
Proceeds from borrowings A.6.3.10 58,807 299,501
Repayment of borrowings (net) A.6.3.10 (7,573) (410,114)
Proceeds/(Repayment) of loans from other related Parties A.6.3.10 150,000 -
Interest paid
(45,027) (50,168)
Cash flows from financing activities (C)
136,313 (181,098)
Net increase (decrease) in cash and cash equivalents (A+B+C)
88,190 (284,091)
Cash and cash equivalents at beginning of the financial year
215,640 506,048 Effects of exchange rate changes on cash and cash equivalents
7,021 (6,317)
Cash and cash equivalents at the end of year A.6.3.9 310,851 215,640
The notes on pages 54 to 153 are an integral part of these consolidated financial statements.

Annual Report 2018-19
Consolidated Financial Statements
All amounts in Euro’000, unless otherwise stated
52
A.5 Consolidated Statement of Changes in Equity Attributable to owners of the parent Non-
controlling interest
Total equity
Subscribed capital
Share premium
Currency translation
reserve
Retained earnings
Other reserves
Merger reserve
Total
As at April 01, 2017 66 900,910 26,796 282,279 (2,658) (722,686) 484,707 99,869 584,576
Total comprehensive income
Profit for the year - - - 108,643 - - 108,643 29,722 138,365
Other comprehensive income
Items that may be subsequently classified to income statement
Cash flow hedges (refer A.6.3.14) - - - - (3,605) - (3,605) 10 (3,595)
Exchange differences on translation of foreign operations
- - (41,155) - - - (41,155) (5,567) (46,722)
Changes in the fair value of available-for-sale financial assets
- - - - (364) - (364) (6) (370)
Items that will not be reclassified to income statement
Remeasurements of post-employment benefit obligations
- - - 45 - - 45 (20) 25
Income tax relating to these items - - - 1 - - 1 7 8
Total other comprehensive income - - (41,155) 46 (3,969) - (45,078) (5,576) (50,654)
Total comprehensive income - - (41,155) 108,689 (3,969) - 63,565 24,146 87,711
Transactions with owners
Others - - - (344) 131 - (213) (257) (470)
Dividend distribution to non-controlling interests
- - - - - - - (17,383) (17,383)
Total transactions with owners - - - (344) 131 - (213) (17,640) (17,853)
As at March 31, 2018 66 900,910 (14,359) 390,624 (6,496) (722,686) 548,059 106,375 654,434

Annual Report 2018-19
Consolidated Financial Statements
All amounts in Euro’000, unless otherwise stated
53
Attributable to owners of the parent Non-controlling
interest
Total equity
Subscribed capital
Share premium
Currency translation
reserve
Retained earnings
Other reserves
Merger reserve
Total
As at April 01, 2018 66 900,910 (14,359) 390,624 (6,496) (722,686) 548,059 106,375 654,434
Total comprehensive income
Profit for the year - - - 78,365 - - 78,365 24,314 102,679
Other comprehensive income
Items that may be subsequently classified to income statement
Cash flow hedges (refer A.6.3.14) - - - - 6,173 - 6,173 13 6,186
Exchange differences on translation of foreign operations
- - 23,264 - - - 23,264 2,706 25,970
Changes in the fair value of available-for-sale financial assets
- - - - (198) - (198) (3) (201)
Items that will not be reclassified to income statement
Remeasurements of post-employment benefit obligations
- - - (526) - - (526) 74 (452)
Income tax relating to these items - - - (80) - - (80) (12) (92)
Total other comprehensive income - - 23,264 (606) 5,975 - 28,633 2,778 31,411
Total comprehensive income - - 23,264 77,759 5,975 - 106,998 27,092 134,090
Transactions with owners
Others - - - 2,262 - - 2,262 - 2,262
Dividend distribution to non-controlling interests
- - - - - - - (17,150) (17,150)
Acquired in business combination - - - - - - - 14,181 14,181
Total transactions with owners - - - 2,262 - - 2,262 (2,969) (707)
As at March 31, 2019 66 900,910 8,905 470,645 (521) (722,686) 657,319 130,498 787,817
For description on various components of the equity, please refer to note A.6.3.14.
The notes on pages 54 to 153 are an integral part of these consolidated financial statements.

Annual Report 2018-19
Consolidated Financial Statements
All amounts in Euro’000, unless otherwise stated
54
A.6. Notes to the Consolidated Financial Statements
A.6.1 General information and description of the business These consolidated financial statements comprise of Samvardhana Motherson Automotive Systems Group BV (SMRP BV) and its subsidiaries (hereinafter referred to as “SMRP BV Group” or “the Group”) for the year ended March 31, 2019. A list of subsidiaries consolidated is in Note A.6.2.3. Motherson Sumi Systems Limited (“MSSL”) is the ultimate parent of SMRP BV Group. Samvardhana Motherson Automotive Systems Group BV (hereafter referred as "Company" or "SMRP BV") is a private company with limited liability, incorporated under the laws of the Netherlands on 7 October 2011, having its corporate seat at Amsterdam (KvK number 53709713), with office at Hoogoorddreef 15, 1101 BA Amsterdam, The Netherlands.
These consolidated financial statements have been authorised for issuance by SMRP BV’s management and supervisory board on May 21, 2019. The shareholders have the power to amend and reissue the financial statements. SMR Group On March 6, 2009 Samvardhana Motherson Reflectec Group Holdings Limited acquired the Visiocorp Group. SMR Group produces a wide range of rear view vision systems primarily for light vehicles. It has production facilities and engineering centres in 16 countries across the globe. SMP Group SMRP BV acquired the Peguform Group on November 23, 2011 which was subsequently renamed
as Samvardhana Motherson Peguform (“SMP”).
SMP division includes business of SMIA which was acquired in January 2015, SMIA with its headquarters in Michelau (Germany) is an internationally renowned specialist in plastic technologies since it’s foundation in 1967. SMP division also includes Kobek Siebdruck GmbH & Co. KG (hereinafter ‘Kobek’), renamed as Motherson Innovations Lights Gmbh & Co KG (“MIL”) acquired in January 2017. MIL is a specialist in lightning solutions and has been a supplier to the SMP subsidiaries. SMP includes Samvardhana Motherson Reydel Companies (earlier known as Reydel Automotive Group) which was acquired on August 2nd, 2018. SMP Group produce various polymer-based interior and exterior products for light vehicles. SMP’s product portfolio is primarily comprised of complete modules, including door panels, instrument panels and bumpers as well as other plastic components and systems, such as centre consoles, decorative interior trims and plastic body parts. It has production facilities and engineering centres in 20 countries across the globe.

Annual Report 2018-19
Consolidated Financial Statements
All amounts in Euro’000, unless otherwise stated
55
A.6.2 Summary of Significant Accounting Policies
A.6.2.1 Basis of preparation
The consolidated financial statements of the Group have been prepared for the financial year beginning April 01, 2018 and ended on March 31, 2019. The Consolidated financial statements have been prepared in accordance with the International Financial Reporting Standards (IFRS) as adopted by the European Union (EU) and also comply with the financial reporting requirements included in Part 9 of Book 2 of the Dutch Civil Code, as far as applicable. The consolidated financial statements have been prepared under the historical cost convention except for certain financial assets and financial liabilities (including derivative instruments) at fair value through profit or loss (refer Note A.6.2.8). The financial statements have been adjusted for the effects of inflation where entities operate in hyperinflationary economies (refer Note A.6.2.3).
The consolidated financial statements are presented in euros and all values are rounded to the nearest thousand (€000), except when otherwise indicated. Previous year figures have been regrouped or reclassified at some places to ensure consistency with current year classifications.
A.6.2.2 Currency translation
A.6.2.2.1 Transactions in foreign currencies
All transactions are recorded in the functional currency of the principal operating environment in which each Group company operates. The Consolidated financial statements are presented in ‘euro’, which is also the parent company’s functional currency. Foreign currency transactions are translated into the functional currency using the exchange rates prevailing at the dates of the transactions. Monetary assets and liabilities denominated in foreign currencies at the reporting date are translated into the functional currency at the rate prevailing on this date. Differences from foreign currency transactions and foreign currency monetary assets and liabilities are reported in the income statement as finance income or finance cost if they relate to borrowings, interest thereon and cash, differences from other foreign currency transactions are reported as either other income or other expenses as the case may be. Non-monetary assets and liabilities that are measured at historical cost in foreign currencies at the reporting date are translated into the functional currency at the rate prevailing on the day of the transaction. Non-monetary assets and liabilities that are measured at fair value in foreign currencies at the reporting date are translated into the functional currency at the rate prevailing on the date on which the fair value was determined.
A.6.2.2.2 Annual financial statements of foreign operations
The results and financial position of all the group entities that have a functional currency different from the presentation currency are translated into the presentation currency as follows:

Annual Report 2018-19
Consolidated Financial Statements
All amounts in Euro’000, unless otherwise stated
56
(a) assets and liabilities for each balance sheet presented are translated at the closing rate at the date of that balance sheet; (b) income and expenses for each income statement are translated at average exchange rates (unless this average is not a reasonable approximation of the cumulative effect of the rates prevailing on the transaction dates, in which case income and expenses are translated at the rate on the dates of the transactions); and all resulting exchange differences are recognised in other comprehensive income.
Goodwill and fair value adjustments arising on the acquisition of a foreign entity are treated as assets and liabilities of the foreign entity and translated at the closing rate. Exchange differences arising are recognised in other comprehensive income. When a foreign operation is sold or any borrowings forming part of the net investment are repaid, the associated exchange differences are reclassified to profit or loss, as part of the gain or loss on sale. The exchange rates of major currencies of non-Euro zone countries used for the consolidated financial statements are listed below (expressed in foreign currency units per Euro): Closing rates Average rates
March 31, 2019 March 31, 2018 March 31, 2019 March 31, 2018
Brazilian Real BRL 4.40 4.07 4.38 3.77
Mexican Peso MXN 21.79 22.36 22.39 21.67
Chinese Yuan CNY 7.53 7.73 7.76 7.74
US Dollar USD 1.12 1.23 1.16 1.17
Great British Pound GBP 0.86 0.88 0.88 0.88
Korean Won KRW 1,274.36 1,306.33 1,287.61 1,297.77
Indian Rupee INR 77.57 80.30 80.91 75.45
Thai Bhat THB 35.58 38.40 37.41 38.61
Hungarian Forint HUF 320.91 312.35 320.21 309.50
Japanese Yen JPY 124.33 130.92 128.36 129.65
Australian Dollar AUD 1.58 1.60 1.59 1.51
In case of companies acquired during the year, average foreign exchange rates from the date of acquisition till financial year end are considered for translation.

Annual Report 2018-19
Consolidated Financial Statements
All amounts in Euro’000, unless otherwise stated
57
A.6.2.3 Principles of consolidation
Subsidiaries
Subsidiaries are all entities over which the Group has control. Control is achieved when the Group
is exposed, or has rights, to variable returns from its involvement with the investee and has the
ability to affect those returns through its power over the investee. Specifically, the Group controls
an investee if and only if the Group has:
• Power over the investee (i.e. existing rights that give it the current ability to direct the relevant activities of the investee)
• Exposure, or rights, to variable returns from its involvement with the investee, and
• The ability to use its power over the investee to affect its returns
The Group re-assesses whether or not it controls an investee if facts and circumstances indicate that there are changes to one or more of the three elements of control. Subsidiaries are fully consolidated from the date on which control is transferred to the Group. They are deconsolidated from the date that control ceases. The group combines the financial statements of the parent and its subsidiaries line by line adding together like item of assets, liabilities, equity, income expense and cashflows. Intercompany transactions, balances and unrealised gains on transactions between group companies are eliminated. Unrealised losses are also eliminated unless the transaction provides evidence of an impairment of the transferred asset. Business combinations policy explains how to account for any related goodwill Consolidated financial statements are prepared using uniform accounting policies for like transactions and other events in similar circumstances. If a subsidiary uses accounting policies other than those adopted in the consolidated financial statements for like transactions and events in similar circumstances, appropriate adjustments are made to that subsidiary’s financial statements in preparing the consolidated financial statements to ensure conformity with the group’s accounting policies. The financial statements of all entities used for the purpose of consolidation are drawn up to same reporting date as that of the parent company, i.e., year ended on March 31. When the end of the reporting period of the parent is different from that of a subsidiary, the subsidiary prepares, for consolidation purposes, additional financial information as of the same date as the financial statements of the parent to enable the parent to consolidate the financial information of the subsidiary, unless it is impracticable to do so. Profit or loss and each component of other comprehensive income (OCI) are attributed to the equity holders of the parent of the group and to the non-controlling interests, even if this results in the non-controlling interests having a deficit balance. When necessary, adjustments are made to the financial statements of subsidiaries to bring their accounting policies into line with the group’s accounting policies.

Annual Report 2018-19
Consolidated Financial Statements
All amounts in Euro’000, unless otherwise stated
58
Changes in ownership interests
The group treats transactions with non-controlling interests that do not result in a loss of control as transactions with equity owners of the group. A change in ownership interest results in an adjustment between the carrying amounts of the controlling and non-controlling interests to reflect their relative interests in the subsidiary. Any difference between the amount of the adjustment to non-controlling interests and any consideration paid or received is recognised within equity attributable to owners. When the group ceases to consolidate or equity account for an investment because of a loss of control, joint control or significant influence, any retained interest in the entity is re measured to its fair value with the change in carrying amount recognised in profit or loss. This fair value becomes the initial carrying amount for the purposes of subsequently accounting for the retained interest as an associate, joint venture or financial asset. In addition, any amounts previously recognised in other comprehensive income in respect of that entity are accounted for as if the group had directly disposed of the related assets or liabilities. This may mean that amounts previously recognised in other comprehensive income are reclassified to profit or loss. If the ownership interest in a joint venture or an associate is reduced but joint control or significant influence is retained, only a proportionate share of the amounts previously recognised in other comprehensive income are reclassified to profit or loss where appropriate. Joint ventures A joint venture is a type of joint arrangement whereby the parties that have joint control of the
arrangement have rights to the net assets of the joint venture. Joint control is the contractually
agreed sharing of control of an arrangement, which exists only when decisions about the relevant
activities require unanimous consent of the parties sharing control.
The group applies IFRS 11 to all joint arrangements. Under IFRS 11 investments in joint arrangements are classified as either joint operations or joint ventures depending on the contractual rights and obligations of each investor. The group has assessed the nature of its joint arrangements and determined them to be joint ventures. Joint ventures are accounted for using the equity method. Interest in associates Associates are all entities over which the group has significant influence but not control or joint control, generally accompanying a shareholding of 20% to 50% of the voting rights. Significant influence is the power to participate in the financial and operating policy decisions of the investee, but is not control or joint control over those policies. Investments in associate are accounted for using the equity method of accounting. Under the equity method, the investment is initially recognized at cost, and the carrying amount is increased or decreased to recognize the investor’s share of profit or loss of the investee after the date of acquisition. The Group’s investment in associates includes goodwill identified on acquisition. The financial statements of the associate is prepared for the same reporting period as the Group. When necessary, adjustments are made to bring the accounting policies in line with those of the Group.

Annual Report 2018-19
Consolidated Financial Statements
All amounts in Euro’000, unless otherwise stated
59
If the ownership interest in an associate is reduced but significant influence is retained, only a proportionate share of the amounts previously recognised in other comprehensive income is reclassified to profit or loss where appropriate. Equity Method The Group’s share of post-acquisition profit or loss is recognised in the income statement, and its share of post-acquisition movements in other comprehensive income is recognized in other comprehensive income with a corresponding adjustment to the carrying amount of the investment. In addition, when there has been a change recognised directly in the equity of the associate or joint venture, the Group recognises its share of any changes, when applicable, in the statement of changes in equity. Dividends received or receivable from associates and joint ventures are recognised as a reduction in the carrying amount of the investment. Goodwill relating to the associate or joint venture is included in the carrying amount of the investment and is not tested for impairment individually. When the Group’s share of losses in the associate/joint venture equals or exceeds its interest in the associate/joint venture, including any other long-term receivables, the Group does not recognise further losses, unless it has incurred legal or constructive obligations or made payments on behalf of the associate/joint venture. The Group determines at each reporting date whether there is any objective evidence that the investment in the associate/joint ventures is impaired. If this is the case, the Group calculates the amount of impairment as the difference between the recoverable amount of the associate/joint ventures and its carrying value and recognizes the amount of impairment adjacent to share of profit/(loss) of an associate/joint ventures in the income statement. Accounting policies of the associates/joint ventures have been changed where necessary to ensure consistency with the policies adopted by the Group. Dilution gains and losses arising in investments in associates/joint ventures are recognized in the income statement. Elimination of business transactions in the course of consolidation The group combines the financial statements of the parent and its subsidiaries line by line adding together like item of assets, liabilities, equity, income and expense. Intercompany transactions, balances and unrealised gains on transactions between group companies are eliminated. Unrealised losses are also eliminated unless the transaction provides evidence of an impairment of the transferred asset. All intra-group assets and liabilities, equity, income, expenses and cash flows relating to transactions between members of the Group are eliminated in full on consolidation.

Annual Report 2018-19
Consolidated Financial Statements
All amounts in Euro’000, unless otherwise stated
60
Business combinations The acquisition method of accounting is used to account for all business combinations, regardless of whether equity instruments or other assets are acquired. The consideration transferred in a business combination is measured at fair value and comprises the:
• fair values of the assets transferred
• liabilities incurred to the former owners of the acquired business
• equity interests issued by the group
• fair value of any asset or liability resulting from a contingent consideration arrangement, and
• fair value of any pre-existing equity interest in the subsidiary. Identifiable assets acquired and liabilities and contingent liabilities assumed in a business combination are, with limited exceptions, measured initially at their fair values at the acquisition date. The group recognises any non-controlling interest in the acquired entity on an acquisition-by-acquisition basis either at fair value or at the non-controlling interest’s proportionate share of the acquired entity’s net identifiable assets. Acquisition-related costs are expensed as incurred. The excess of the
• consideration transferred,
• amount of any non-controlling interest in the acquired entity, and
• acquisition-date fair value of any previous equity interest in the acquired entity over the fair value of the net identifiable assets acquired is recorded as goodwill. If those amounts are less than the fair value of the net identifiable assets of the business acquired, the difference is recognised directly in income statement as a gain on bargain purchase. The Group reassesses, before recognising a gain on bargain purchase, whether it has correctly identified all of the assets acquired and all of the liabilities assumed and shall recognise any additional assets or liabilities that are identified in that review. Where settlement of any part of cash consideration is deferred, the amounts payable in the future are discounted to their present value as at the date of acquisition. The discount rate used is the entity’s incremental borrowing rate, being the rate at which a similar borrowing could be obtained from an independent financier under comparable terms and conditions. Contingent consideration, resulting from business combinations, is valued at fair value at the acquisition date. Contingent consideration classified as equity is not remeasured and its subsequent settlement is accounted for within equity. Contingent consideration classified as an asset or liability that is a financial instrument and within the scope of IFRS 9 Financial Instruments, is measured at fair value with the changes in fair value recognised in the income statement in accordance with IFRS 9. Other contingent consideration that is not within the scope of IFRS 9 is measured at fair value at each reporting date with changes in fair value recognised in income statement. If the business combination is achieved in stages, the acquisition date carrying value of the acquirer’s previously held equity interest in the acquire is remeasured to fair value at the acquisition date. Any gains or losses arising from such remeasurement are recognised in income statement or other comprehensive income, as appropriate.

Annual Report 2018-19
Consolidated Financial Statements
All amounts in Euro’000, unless otherwise stated
61
The Group recognises any non-controlling interest in the acquiree on an acquisition-by-acquisition basis, either at fair value or at the non-controlling interest’s proportionate share of the recognised amounts of acquiree’s identifiable net assets. Goodwill is initially measured at cost, being the excess of the aggregate of the consideration transferred and the amount recognised for non-controlling interests, and any previous interest held, over the net identifiable assets acquired and liabilities assumed. If the fair value of the net assets acquired is in excess of the aggregate consideration transferred, the Group re-assesses whether it has correctly identified all of the assets acquired and all of the liabilities assumed and reviews the procedures used to measure the amounts to be recognised at the acquisition date. If the reassessment still results in an excess of the fair value of net assets acquired over the aggregate consideration transferred, then the gain is recognised in the income statement as gain on bargain purchase. After initial recognition, goodwill is measured at cost less any accumulated impairment losses. For the purpose of impairment testing, goodwill acquired in a business combination is, from the acquisition date, allocated to each of the Group’s cash-generating units that are expected to benefit from the combination, irrespective of whether other assets or liabilities of the acquiree are assigned to those units.
A cash generating unit to which goodwill has been allocated is tested for impairment annually, or more frequently when there is an indication that the unit may be impaired. If the recoverable amount of the cash generating unit is less than its carrying amount, the impairment loss is allocated first to reduce the carrying amount of any goodwill allocated to the unit and then to the other assets of the unit pro rata based on the carrying amount of each asset in the unit. Any impairment loss for goodwill is recognised in profit or loss. An impairment loss recognised for goodwill is not reversed in subsequent periods.
Where goodwill has been allocated to a cash-generating unit and part of the operation within that unit is disposed of, the goodwill associated with the disposed operation is included in the carrying amount of the operation when determining the gain or loss on disposal. Goodwill disposed in these circumstances is measured based on the relative values of the disposed operation and the portion of the cash-generating unit retained.
If the initial accounting for a business combination is incomplete by the end of the reporting period in which the combination occurs, the Group reports provisional amounts for the items for which the accounting is incomplete. Those provisional amounts are adjusted through goodwill during the measurement period, or additional assets or liabilities are recognised, to reflect new information obtained about facts and circumstances that existed at the acquisition date that, if known, would have affected the amounts recognized at that date. These adjustments are called as measurement period adjustments. The measurement period does not exceed one year from the acquisition date.
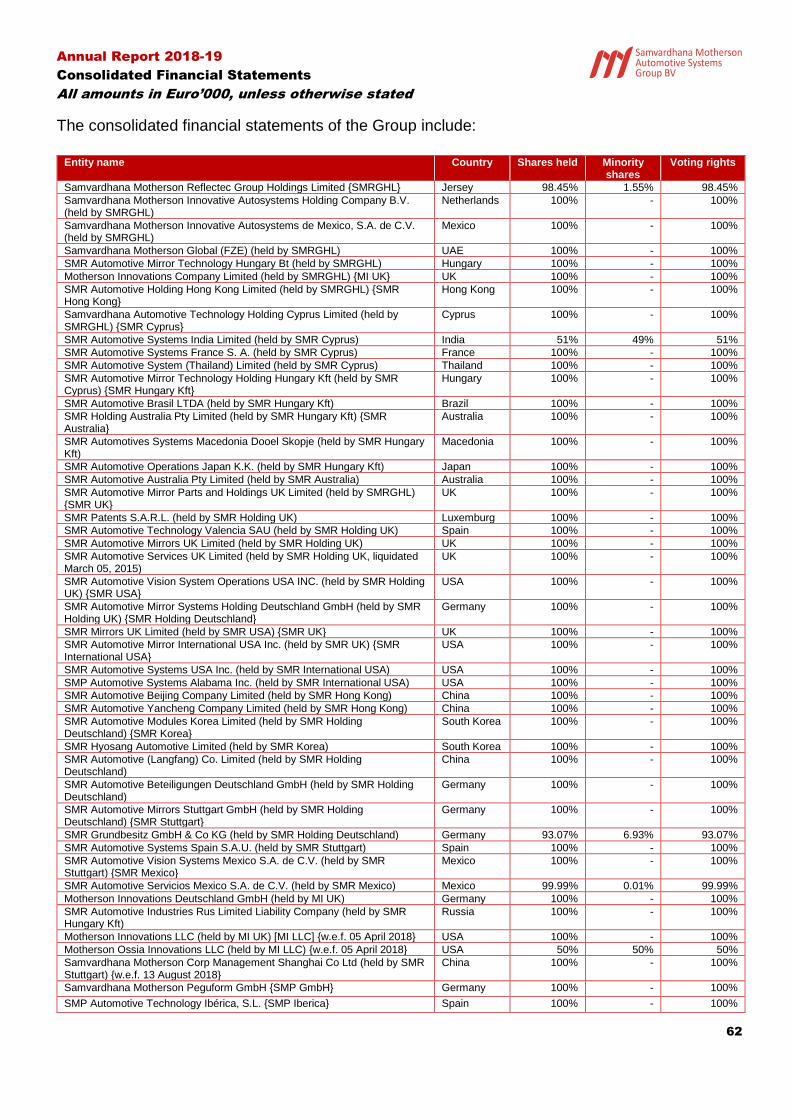
Annual Report 2018-19
Consolidated Financial Statements
All amounts in Euro’000, unless otherwise stated
62
The consolidated financial statements of the Group include:
Entity name Country Shares held Minority shares
Voting rights
Samvardhana Motherson Reflectec Group Holdings Limited SMRGHL Jersey 98.45% 1.55% 98.45%
Samvardhana Motherson Innovative Autosystems Holding Company B.V. (held by SMRGHL)
Netherlands 100% - 100%
Samvardhana Motherson Innovative Autosystems de Mexico, S.A. de C.V. (held by SMRGHL)
Mexico 100% - 100%
Samvardhana Motherson Global (FZE) (held by SMRGHL) UAE 100% - 100%
SMR Automotive Mirror Technology Hungary Bt (held by SMRGHL) Hungary 100% - 100%
Motherson Innovations Company Limited (held by SMRGHL) MI UK UK 100% - 100%
SMR Automotive Holding Hong Kong Limited (held by SMRGHL) SMR Hong Kong
Hong Kong 100% - 100%
Samvardhana Automotive Technology Holding Cyprus Limited (held by SMRGHL) SMR Cyprus
Cyprus 100% - 100%
SMR Automotive Systems India Limited (held by SMR Cyprus) India 51% 49% 51%
SMR Automotive Systems France S. A. (held by SMR Cyprus) France 100% - 100%
SMR Automotive System (Thailand) Limited (held by SMR Cyprus) Thailand 100% - 100%
SMR Automotive Mirror Technology Holding Hungary Kft (held by SMR Cyprus) SMR Hungary Kft
Hungary 100% - 100%
SMR Automotive Brasil LTDA (held by SMR Hungary Kft) Brazil 100% - 100%
SMR Holding Australia Pty Limited (held by SMR Hungary Kft) SMR Australia
Australia 100% - 100%
SMR Automotives Systems Macedonia Dooel Skopje (held by SMR Hungary Kft)
Macedonia 100% - 100%
SMR Automotive Operations Japan K.K. (held by SMR Hungary Kft) Japan 100% - 100%
SMR Automotive Australia Pty Limited (held by SMR Australia) Australia 100% - 100%
SMR Automotive Mirror Parts and Holdings UK Limited (held by SMRGHL) SMR UK
UK 100% - 100%
SMR Patents S.A.R.L. (held by SMR Holding UK) Luxemburg 100% - 100%
SMR Automotive Technology Valencia SAU (held by SMR Holding UK) Spain 100% - 100%
SMR Automotive Mirrors UK Limited (held by SMR Holding UK) UK 100% - 100%
SMR Automotive Services UK Limited (held by SMR Holding UK, liquidated March 05, 2015)
UK 100% - 100%
SMR Automotive Vision System Operations USA INC. (held by SMR Holding UK) SMR USA
USA 100% - 100%
SMR Automotive Mirror Systems Holding Deutschland GmbH (held by SMR Holding UK) SMR Holding Deutschland
Germany 100% - 100%
SMR Mirrors UK Limited (held by SMR USA) SMR UK UK 100% - 100%
SMR Automotive Mirror International USA Inc. (held by SMR UK) SMR International USA
USA 100% - 100%
SMR Automotive Systems USA Inc. (held by SMR International USA) USA 100% - 100%
SMP Automotive Systems Alabama Inc. (held by SMR International USA) USA 100% - 100%
SMR Automotive Beijing Company Limited (held by SMR Hong Kong) China 100% - 100%
SMR Automotive Yancheng Company Limited (held by SMR Hong Kong) China 100% - 100%
SMR Automotive Modules Korea Limited (held by SMR Holding Deutschland) SMR Korea
South Korea 100% - 100%
SMR Hyosang Automotive Limited (held by SMR Korea) South Korea 100% - 100%
SMR Automotive (Langfang) Co. Limited (held by SMR Holding Deutschland)
China 100% - 100%
SMR Automotive Beteiligungen Deutschland GmbH (held by SMR Holding Deutschland)
Germany 100% - 100%
SMR Automotive Mirrors Stuttgart GmbH (held by SMR Holding Deutschland) SMR Stuttgart
Germany 100% - 100%
SMR Grundbesitz GmbH & Co KG (held by SMR Holding Deutschland) Germany 93.07% 6.93% 93.07%
SMR Automotive Systems Spain S.A.U. (held by SMR Stuttgart) Spain 100% - 100%
SMR Automotive Vision Systems Mexico S.A. de C.V. (held by SMR Stuttgart) SMR Mexico
Mexico 100% - 100%
SMR Automotive Servicios Mexico S.A. de C.V. (held by SMR Mexico) Mexico 99.99% 0.01% 99.99%
Motherson Innovations Deutschland GmbH (held by MI UK) Germany 100% - 100%
SMR Automotive Industries Rus Limited Liability Company (held by SMR Hungary Kft)
Russia 100% - 100%
Motherson Innovations LLC (held by MI UK) [MI LLC] w.e.f. 05 April 2018 USA 100% - 100%
Motherson Ossia Innovations LLC (held by MI LLC) w.e.f. 05 April 2018 USA 50% 50% 50%
Samvardhana Motherson Corp Management Shanghai Co Ltd (held by SMR Stuttgart) w.e.f. 13 August 2018
China 100% - 100%
Samvardhana Motherson Peguform GmbH SMP GmbH Germany 100% - 100%
SMP Automotive Technology Ibérica, S.L. SMP Iberica Spain 100% - 100%

Annual Report 2018-19
Consolidated Financial Statements
All amounts in Euro’000, unless otherwise stated
63
SMP Automotive Interiors (Beijing) Co. Ltd China 100% - 100%
SMP Automotive Exterior GmbH (held by SMP GmbH) SMP AE Germany 100% - 100%
SMP Deutschland GmbH (held by SMP GmbH) SMP Deutschland Germany 94.80% 5.20% 94.80%
Samvardhana Motherson Innovative Autosystems B.V. & Co. KG (held by SMP GmbH)
Germany 100% - 100%
SMP Logistik Service GmbH (held by SMP Deutschland) Germany 100% - 100%
SMP Automotive Solutions Slovakia s.r.o. (held by SMP Deutschland) Slovakia 100% - 100%
Changchun Peguform Automotive Plastics Technology Ltd. (held by SMP Deutschland) CPAT
China 50% 50% 50%+1*
SMP Automotive Technology Management Services (Changchun) Co. Ltd. (held by SMP Deutschland)
China 100% - 100%
Foshan Peguform Automotive Plastics Technology Co. Ltd. (held by CPAT) China 100% - 100%
Shenyang SMP Automotive Plastic Components Co. Ltd. (held by CPAT) w.e.f. 22 August 2017
China 100% - 100%
Tianjin SMP Automotive Components Co. Ltd. (held by CPAT) w.e.f. 06 March 2018
China 100% - 100%
Samvardhana Motherson Peguform Automotive Technology Portugal, S.A. (held by SMP Iberica)
Portugal 100% - 100%
SMP Automotive Technologies Teruel, S.L. (held by SMP Iberica) SMP Teruel
Spain 100% - 100%
Samvardhana Motherson Peguform Barcelona, S.L.U. (held by SMP Iberica) SMP Barcelona
Spain 100% - 100%
SMP Automotive Produtos Automotivos do Brasil Ltda (held by SMP Teruel) Brazil 100% - 100%-1
SMP Automotive Systems México, S. A. de C. V. (held by SMP Barcelona) Mexico 100% - 100%-1
SM Real Estate GmbH (held by SMP AE) Germany 94.80% 5.20% 94.80%
Celulosa Fabril (Cefa) S.A. (held by SMP Iberica) CEFA Spain 50% 50% 50%
Modulos Ribera Alto S.LU. (held by CEFA) MRA Spain 100% - 100%
Motherson Innovations Lights GmbH & Co. KG (held by SMP GmbH) MIL Germany 100% - 100%
Motherson Innovations Lights Verwaltungs GmbH (held by MIL) Germany 100% - 100%
SMRC Automotive Holdings B.V. (held by SMRP BV) [SMRC BV] Netherlands 85.26%** 14.74%*** 85.26%**
SMRC Automotive Interiors Management B.V. (held by SMRP BV) [SMRC M BV]
Netherlands 100% - 100%
SMRC Automotives Techno Minority Holdings B.V. (held by SMRC H BV) [SMRC MH BV]
Netherlands 100% - 100%
SMRC Automotive Holdings Netherlands B.V. (held by SMRC BV) [SMRC H BV]
Netherlands 100% - 100%
SMRC Automotive Modules France SAS (held by SMRC H BV) [SMRC France]
France 100% - 100%
Reydel Automotive Holdings Spain, S.L.U. (held by SMRC H BV) [SMRC Spain Holdings]
Spain 100% - 100%
SMRC Automotive Interiors Spain S.L.U. (held by SMRC Spain Holdings) [SMRC Spain]
Spain 100% - 100%
SMRC Smart Interior Systems Germany GmbH (held by SMRC H BV) [SMRC Germany]
Germany 100% - 100%
SMRC Automotive Solutions Slovakia s.r.o. (held by SMRC H BV) [SMCR Slovakia]
Slovakia 100% - 100%
Reydel Automotive Croatia d.o.o. (held by SMRC H BV) [SMRC Croatia] Croatia 100% - 100%
Reydel Automotive Poland S.A. (held by SMRC H BV) [SMRC Poland] Poland 100% - 100%
SMRC Automotive Modules Russia LLC (held by SMRC H BV) [SMRC Russia]
Russia 100% - 100%
Samvardhana Motherson Reydel Automotive Morocco SAS (held by SMRC H BV) [SMRC Morocco]
Morocco 100% - 100%
SMRC Fabricação e Comércio de Produtos Automotivos do Brasil Ltda. (held by SMRC SA BV) [SMRC Brazil]
Brazil 100% - 100%
Reydel Automotive Argentina S.A. (held by SMRC SA BV) [SMRC Argentina] Argentina 100% - 100%
SMRC Automotive Interiors Japan Ltd. (held by SMRC H BV) [SMRC Japan] Japan 100% - 100%
SMRC Automotive Products India Private Ltd. (held by SMRC H BV) [SMRC India]
India 100% - 100%
PT SMRC Automotive Technology Indonesia (held by SMRC H BV) [SMRC Indonesia]
Indonesia 100% - 100%
Yujin-SMRC Automotive Modules Corp. (held by SMRC H BV) [SMRC Korea]
S. Korea 50.9% 49.1% 50.9%
SMRC Automotive Smart Interior Tech Thailand Ltd. (held by SMRC H BV) [SMRC Thailand]
Thailand 100% - 100%
Shanghai Reydel Automotive Technology Consulting Co., Ltd (held by SMRC H BV) [SMRC Shanghai]
China 100% - 100%

Annual Report 2018-19
Consolidated Financial Statements
All amounts in Euro’000, unless otherwise stated
64
SMRC Smart Automotive Interior Technologies USA, LLC (held by SMRC H BV) [SMRC USA]
USA 100% - 100%
SMRC Automotive Holding South America B.V. (held by SMRC H BV) [SMRC SA BV]
Netherlands 100% - 100%
SMRC Automotive Modules South America Minority Holdings B.V. (held by SMRC H BV) [SMRC SAM BV]
Netherlands 100% - 100%
Reydel Automotive Phils Inc. (held by SMRC H BV) [SMRC Philippines] Philippines 100% - 100%
*SMP Deutschland GmbH has 50% of the voting rights plus one additional vote.
** Shareholding % based on total shares issued excluding shares owned by company itself
*** Held by SMRC M BV which is 100% subsidiary of SMRP BV
Joint ventures and Associates are as below: Entity Name Nature Country Shares held
Eissmann SMP Automotive Interieur Slovensko s.r.o. Joint venture Slovakia 49%
Ningbo SMR Huaxiang Automotive Mirrors Co. Limited Joint venture China 50%
Chongqing SMR Huaxiang Automotive Products Limited Joint Venture China 50%
Tianjin SMR Huaxiang Automotive Parts Co., Ltd. Joint Venture China 50%
Re-Time Pty Limited Associate Australia 35%
Capital shares mentioned represent shareholding by the immediate parent of the entity and does not represent
effective shareholding by the Group.

Annual Report 2018-19
Consolidated Financial Statements
All amounts in Euro’000, unless otherwise stated
65
Hyperinflation The financial statements (including comparative amounts, if applicable) of the group entities whose functional currencies are the currencies of hyperinflationary economies are adjusted in terms of the measuring unit current at the end of the reporting period. As the presentation currency of the group is that of a non-hyperinflationary economy, comparative amounts are not adjusted for changes in the price level or exchange rates in the current year. Differences between these comparative amounts and current year hyperinflation adjusted equity balances are recognised in other comprehensive income. With the effect from July 1, 2018, the Argentine economy was considered to be hyperinflationary in accordance with the criteria in IAS 29 “Financial Reporting in Hyperinflationary Economies” (“IAS 29”). This standard requires that the entity or components financial information whose functional currency is that of an economy considered hyperinflationary be restated using a general price index that reflects changes in general purchasing power. The inflation index used in Argentina was a synthetic index with the following characteristics: i) The Internal Wholesale Price Index (IPIM) until December 2016 and ii) after that date, the National Consumer Price Index (IPC). Additionally, due to the lack of national index on November and December 2015, Consumer Price Index of City of Buenos Aires (IPC CABA) was used. The results and financial position of Argentine subsidiary SMRC Automotive Tech Argentina S.A., whose functional currency is the currency of a hyperinflationary economy, are first restated in accordance with IAS 29 and are then translated into the presentation currency. All balance sheet items of Argentine subsidiary have been segregated into monetary and non-monetary items. Monetary items are units of currency held, and assets and liabilities to be received or paid, in fixed or determinable number of units of currency. These monetary items are not restated because they are already expressed in terms of the current monetary unit. In a period of inflation, an entity holding an excess of monetary assets over monetary liabilities loses purchasing power, and an entity with an excess of monetary liabilities over monetary assets gains purchasing power, to the extent the assets and liabilities are not linked to a price level. The gain or loss on the net monetary position is included in profit or loss. The effect of inflation on the net monetary position of the Argentine subsidiary for the year ended March 31, 2019 has been a gain of k€ 503. Non-monetary assets and liabilities (items which are not already expressed in terms of the monetary unit) are restated by applying the relevant index. After the IAS 29 restatement of non-monetary assets, it is necessary to consider whether the restated amount of the asset might exceed its recoverable amount. Additionally, the application of IAS 29 results in the creation of temporary differences because while the book value of non-monetary assets is adjusted for inflation but not equivalent adjustment is made for tax purpose; the effect of such a temporary difference is a deferred tax liability.

Annual Report 2018-19
Consolidated Financial Statements
All amounts in Euro’000, unless otherwise stated
66
A.6.2.4 Intangible assets
Intangible assets acquired separately are measured on initial recognition at cost. The cost of
intangible assets acquired in a business combination is the fair value as at the date of acquisition.
Following initial recognition, intangible assets with a finite useful life are carried at cost less
accumulated amortisation and any accumulated impairment losses.
Intangible assets with finite lives are amortised over the useful economic life and assessed for
impairment whenever there is an indication that the intangible asset may be impaired. The
amortisation period and the amortisation method for an intangible asset with a finite useful life are
reviewed at least at each financial year end. Changes in the expected useful life or the expected
pattern of consumption of future economic benefits embodied in the asset are accounted for by
changing the amortisation period or method, as appropriate, and are treated as changes in
accounting estimates. The amortisation expense on intangible assets with finite lives is recognised
in the income statement.
Goodwill is measured as described in note A.6.2.3. Goodwill on acquisitions of subsidiaries is included in intangible assets. Goodwill is not amortised but it is tested for impairment annually, or more frequently if events or changes in circumstances indicate that it might be impaired and is carried at cost less accumulated impairment losses. Gains and losses on the disposal of an entity include the carrying amount of goodwill relating to the entity sold. Goodwill is allocated to cash-generating units for the purpose of impairment testing. The allocation is made to those cash-generating units or groups of cash-generating units that are expected to benefit from the business combination in which the goodwill arose. The units or groups of units are identified at the lowest level at which goodwill is monitored for internal management purposes, being the operating segments. Business, commercial rights and other rights Separately acquired trademarks and licences are shown at historical cost. Trademarks, licenses and customer contracts acquired in a business combination are recognised at fair value at the acquisition date. They have a finite useful life and are subsequently carried at cost less accumulated amortisation and impairment losses. Customer relationships Customer relationships acquired in a business combination are recognised at fair value at the acquisition date. They have a finite useful life and are subsequently carried at cost less accumulated amortisation and impairment losses.
Research and development costs
Research costs are expensed as incurred. Development expenditure on an individual project is
capitalised if it meets the definition of an intangible asset as well as the requirements for recognition
as laid down in IAS 38. Costs not eligible for capitalisation are expensed off in the income
statement.

Annual Report 2018-19
Consolidated Financial Statements
All amounts in Euro’000, unless otherwise stated
67
The intangible assets are amortised on a straight-line basis over their useful lives, beginning at the
time the asset is first used and ending after a length of time usual for the asset in operation. The
uniform useful lives applied within the Group are as follows:
Description Useful life (in years)
Concessions, intellectual property, software and similar rights 1-3
Contracts with customers 3-11 Patents & Technologies 5-13
The useful life of customer contracts, engineering contracts as well as technology is the result of the analyses and average useful life of the contracts. The amortisation methods, the usual useful lives and the residual values are reviewed annually.
A.6.2.5 Property, plant and equipment
A.6.2.5.1 Own assets
Property, plant and equipment are stated at cost less accumulated depreciation and impairment losses. Cost comprises the aggregate amount paid and the fair value of any other consideration given to acquire the asset and includes costs directly attributable to making the asset capable of operating as intended. When a major replacement is made, its cost is recognised in the carrying amount of the plant and equipment if the recognition criteria are satisfied. All other repair and maintenance costs are recognised in income statement as incurred. Subsequent costs are included in the asset’s carrying amount or recognised as a separate asset, as appropriate, only when it is probable that future economic benefits associated with the item will flow to the Group and the cost of the item can be measured reliably. The carrying amount of the replaced part is derecognised. General and specific borrowing costs directly attributable to the acquisition, construction or production of qualifying assets, which are assets that necessarily take a substantial period of time to get ready for their intended use or sale, are added to the cost of those assets, until such time as the assets are substantially ready for their intended use or sale.
A.6.2.5.2 Leased assets
Leasing agreements in which the Group has essentially assumed all risks and rewards incidental to ownership are classified as finance leases. A property acquired under finance lease needs to be capitalized at the lower of its fair value or the present value of the minimum lease payments at the beginning of the lease period. Asset acquired under finance lease is depreciated over shorter of its useful life and lease term (provided that there is no transfer of the assets at the end of the lease term) or the estimated useful life (see A.6.2.5.3). Impairments are performed as necessary (see A.6.2.7).
If, from an economic perspective, not all risks and rewards have been transferred, leasing agreements are classified as operating leases. Payments made under operating leases are charged to income statement on a straight-line basis over the period of the lease.

Annual Report 2018-19
Consolidated Financial Statements
All amounts in Euro’000, unless otherwise stated
68
A.6.2.5.3 Depreciation
Depreciation is calculated on a straight-line basis over the estimated useful lives of the assets, as follows:
Description Useful life (in years)
Buildings 40 – 50 Machinery and other technical facilities 10 -15 Tooling 1-7 Other plant and office equipment 5 – 15
The residual values, useful lives and methods of depreciation of property, plant and equipment are reviewed at each financial year end and adjusted prospectively, if appropriate. No depreciation is charged on land as well as assets under construction.
A.6.2.6 Investment Properties
Investment properties are stated at cost less accumulated depreciation and impairment. Transaction costs are included on initial measurement. The residual values, useful lives and methods of depreciation of Investment properties are reviewed at each financial year end and adjusted prospectively, if appropriate. The fair values of investment properties are disclosed in the notes. These are assessed using internationally accepted valuation methods. The fair values are calculated based on the income method and are supported by the results of the sales comparison method which compares a subject property’s characteristics with those of comparable properties which have recently sold in similar transactions and uses multiples to calculate the fair value. Comparable characteristics that are used for the multiples are the construction level and the specific rent level. Depreciation is provided on investment property other than land, on a straight-line basis over the expected useful life which is 30 years. Investment properties are derecognized when either they have been disposed of or when the investment property is permanently withdrawn from use and no future economic benefit is expected from its disposal. The difference between the net disposal proceeds and the carrying amount of the asset is recognised in the income statement in the period of derecognition.
A.6.2.7 Impairment of non-financial assets
The group assesses, at each reporting date, whether there is an indication that an asset may be
impaired. If any indication exists, or when annual impairment testing for an asset is required, the
group estimates the asset’s recoverable amount. An asset’s recoverable amount is the higher of
an asset’s or cash-generating unit’s (CGU) fair value less costs of disposal and its value in use.
Recoverable amount is determined for an individual asset, unless the asset does not generate
cash inflows that are largely independent of those from other assets or groups of assets. When
the carrying amount of an asset or CGU exceeds its recoverable amount, the asset is considered
impaired and is written down to its recoverable amount.
In assessing value in use, the estimated future cash flows are discounted to their present value
using a pre-tax discount rate that reflects current market assessments of the time value of money
and the risks specific to the asset. In determining fair value less costs of disposal, recent market

Annual Report 2018-19
Consolidated Financial Statements
All amounts in Euro’000, unless otherwise stated
69
transactions are taken into account. If no such transactions can be identified, an appropriate
valuation model is used. These calculations are corroborated by valuation multiples, quoted share
prices for publicly traded companies or other available fair value indicators.
The group bases its impairment calculation on detailed budgets and forecast calculations, which
are prepared separately for each of the group’s CGUs to which the individual assets are allocated.
These budgets and forecast calculations generally cover a period of five years. For longer periods,
a long-term growth rate is calculated and applied to project future cash flows after the fifth year.
To estimate cash flow projections beyond periods covered by the most recent budgets/forecasts,
the group extrapolates cash flow projections in the budget using a steady or declining growth rate
for subsequent years, unless an increasing rate can be justified. In any case, this growth rate does
not exceed the long-term average growth rate for the products, industries, or country or countries
in which the entity operates, or for the market in which the asset is used.
For assets excluding goodwill, an assessment is made at each reporting date to determine whether
there is an indication that previously recognised impairment losses no longer exist or have
decreased. If such indication exists, the group estimates the asset’s or CGU’s recoverable amount.
A previously recognised impairment loss is reversed only if there has been a change in the
assumptions used to determine the asset’s recoverable amount since the last impairment loss was
recognised. The reversal is limited so that the carrying amount of the asset does not exceed its
recoverable amount, nor exceed the carrying amount that would have been determined, net of
depreciation, had no impairment loss been recognised for the asset in prior years. Such reversal
is recognised in the statement of profit or loss.
Goodwill is tested for impairment annually as March 31 and when circumstances indicate that the
carrying value may be impaired.
Impairment is determined for goodwill by assessing the recoverable amount of each CGU (or group
of CGUs) to which the goodwill relates. When the recoverable amount of the CGU is less than its
carrying amount, an impairment loss is recognised. Impairment losses relating to goodwill cannot
be reversed in future periods.
Intangible assets with indefinite useful lives are tested for impairment annually at the CGU level,
as appropriate, and when circumstances indicate that the carrying value may be impaired.
A.6.2.8 Financial instruments
A financial instrument is any contract that gives rise to a financial asset of one entity and a financial liability or equity instrument of another entity. Financial assets Initial recognition and measurement

Annual Report 2018-19
Consolidated Financial Statements
All amounts in Euro’000, unless otherwise stated
70
Financial assets are classified, at initial recognition, as subsequently measured at amortised cost, fair value through other comprehensive income (OCI), and fair value through profit or loss. The classification of financial assets at initial recognition depends on the financial asset’s contractual cash flow characteristics and the Group’s business model for managing them. With the exception of trade receivables that do not contain a significant financing component, the Group initially measures a financial asset at its fair value plus, in the case of a financial asset not at fair value through profit or loss, transaction costs. Trade receivables that do not contain a significant financing component are measured at the transaction price determined under IFRS 15. In order for a financial asset to be classified and measured at amortised cost or fair value through OCI, it needs to give rise to cash flows that are ‘solely payments of principal and interest (SPPI)’ on the principal amount outstanding. This assessment is referred to as the SPPI test and is performed at an instrument level. The Group’s business model for managing financial assets refers to how it manages its financial assets in order to generate cash flows. The business model determines whether cash flows will result from collecting contractual cash flows, selling the financial assets, or both. Purchases or sales of financial assets that require delivery of assets within a time frame established by regulation or convention in the market place (regular way trades) are recognised on the trade date, i.e., the date that the Group commits to purchase or sell the asset. Subsequent measurement For purposes of subsequent measurement, financial assets are classified in three categories:
• Financial assets at amortised cost (debt instruments)
• Financial assets designated at fair value through OCI
• Financial assets designated at fair value through OCI with no recycling of cumulative gains and losses upon derecognition (equity instruments)
• Financial assets at fair value through profit or loss Financial assets at amortised cost (debt instruments) This category is the most relevant to the Group. The Group measures financial assets at amortised cost if both of the following conditions are met:
• The financial asset is held within a business model with the objective to hold financial assets in order to collect contractual cash flows And
• The contractual terms of the financial asset give rise on specified dates to cash flows that are solely payments of principal and interest on the principal amount outstanding.
Financial assets at amortised cost are subsequently measured using the effective interest (EIR) method and are subject to impairment. Gains and losses are recognised in profit or loss when the asset is derecognised, modified or impaired. The Group’s financial assets at amortised cost includes trade receivables. Financial assets designated at fair value through OCI (debt instruments) A financial asset is classified as at the FVTOCI if both of the following criteria are met:

Annual Report 2018-19
Consolidated Financial Statements
All amounts in Euro’000, unless otherwise stated
71
a. The objective of the business model is achieved both by collecting contractual cash flows and selling the financial assets, and
b. The asset’s contractual cash flows represent SPPI.
Financial assets included within the FVTOCI category are measured initially as well as at each
reporting date at fair value. Fair value movements are recognized in the other comprehensive
income (OCI). However, the group recognizes interest income, impairment losses & reversals and
foreign exchange gain or loss in the statement of profit and loss. On derecognition of the asset,
cumulative gain or loss previously recognised in OCI is reclassified from the equity to statement of
profit and loss. Interest earned whilst holding FVTOCI financial asset is reported as interest income
in statement of profit and loss using the EIR method.
Financial assets designated at fair value through OCI (equity instruments) Upon initial recognition, the Group can elect to classify irrevocably its equity investments as equity instruments designated at fair value through OCI when they meet the definition of equity under IAS 32 Financial Instruments: Presentation and are not held for trading. The classification is determined on an instrument-by instrument basis. Gains and losses on these financial assets are never recycled to profit or loss. Dividends are recognised as other income in the income statement when the right of payment has been established, except when the Group benefits from such proceeds as a recovery of part of the cost of the financial asset, in which case, such gains are recorded in OCI. Equity instruments designated at fair value through OCI are not subject to impairment assessment. The Group elected to classify irrevocably its non-listed equity investments under this category. Financial assets at fair value through profit or loss Financial assets at fair value through profit or loss include financial assets held for trading, financial assets designated upon initial recognition at fair value through profit or loss, or financial assets mandatorily required to be measured at fair value. Financial assets are classified as held for trading if they are acquired for the purpose of selling or repurchasing in the near term. Derivatives, including separated embedded derivatives, are also classified as held for trading unless they are designated as effective hedging instruments. Financial assets with cash flows that are not solely payments of principal and interest are classified and measured at fair value through profit or loss, irrespective of the business model. Notwithstanding the criteria for debt instruments to be classified at amortised cost, as described above, debt instruments may be designated at fair value through profit or loss on initial recognition if doing so eliminates, or significantly reduces, an accounting mismatch. Financial assets at fair value through profit or loss are carried in the statement of financial position at fair value with net changes in fair value recognised in the income statement. This category includes derivative instruments. Derecognition A financial asset (or, where applicable, a part of a financial asset or part of a group of similar financial assets) is primarily derecognised (i.e., removed from the Group’s consolidated statement of financial position) when:
• The rights to receive cash flows from the asset have expired Or

Annual Report 2018-19
Consolidated Financial Statements
All amounts in Euro’000, unless otherwise stated
72
• The Group has transferred its rights to receive cash flows from the asset or has assumed an obligation to pay the received cash flows in full without material delay to a third party under a ‘pass-through’ arrangement; and either (a) the Group has transferred substantially all the risks and rewards of the asset, or (b) the Group has neither transferred nor retained substantially all the risks and rewards of the asset, but has transferred control of the asset
When the Group has transferred its rights to receive cash flows from an asset or has entered into a passthrough arrangement, it evaluates if, and to what extent, it has retained the risks and rewards of ownership. When it has neither transferred nor retained substantially all of the risks and rewards of the asset, nor transferred control of the asset, the Group continues to recognise the transferred asset to the extent of its continuing involvement. In that case, the Group also recognises an associated liability. The transferred asset and the associated liability are measured on a basis that reflects the rights and obligations that the Group has retained. Continuing involvement that takes the form of a guarantee over the transferred asset is measured at the lower of the original carrying amount of the asset and the maximum amount of consideration that the Group could be required to repay. As at March 31, 2019, the Group had an amount of € 521 million (March 31, 2018: € 329 million) of receivables derecognised from its balance sheet as the Group had substantially transferred all risks and rewards of ownership of these receivables to various financial institutions. Impairment
For trade receivables and contract assets, the Group applies a simplified approach in calculating Expected Credit Losses (ECLs). Therefore, the Group does not track changes in credit risk, but instead recognises a loss allowance based on lifetime ECLs at each reporting date. The Group has established a provision matrix that is based on its historical credit loss experience, adjusted for any forward-looking factors specific to the debtors and the economic environment. In accordance with IFRS 9, the Group applies expected credit loss (ECL) model for measurement and recognition of impairment loss on the following financial assets and credit risk exposure: a. Financial assets that are debt instruments, and are measured at amortised cost e.g., loans,
debt securities, deposits, trade receivables and bank balance b. Financial assets that are debt instruments and are measured as at FVTOCI c. Lease receivables under IAS 17 d. Trade receivables or any contractual right to receive cash or another financial asset that result
from transactions that are within the scope of IFRS15 e. Loan commitments which are not measured as at FVTPL f. Financial guarantee contracts which are not measured as at FVTPL The group follows ‘simplified approach’ for recognition of impairment loss allowance on:
• Trade receivables or contract revenue receivables; and
• All lease receivables resulting from transactions within the scope of IAS 17 The application of simplified approach does not require the group to track changes in credit risk. Rather, it recognises impairment loss allowance based on lifetime ECLs at each reporting date, right from its initial recognition.

Annual Report 2018-19
Consolidated Financial Statements
All amounts in Euro’000, unless otherwise stated
73
For recognition of impairment loss on other financial assets and risk exposure, the group determines that whether there has been a significant increase in the credit risk since initial recognition. If credit risk has not increased significantly, 12-month ECL is used to provide for impairment loss. However, if credit risk has increased significantly, lifetime ECL is used. If, in a subsequent period, credit quality of the instrument improves such that there is no longer a significant increase in credit risk since initial recognition, then the entity reverts to recognising impairment loss allowance based on 12-month ECL. Lifetime ECL are the expected credit losses resulting from all possible default events over the expected life of a financial instrument. The 12-month ECL is a portion of the lifetime ECL which results from default events that are possible within 12 months after the reporting date. ECL is the difference between all contractual cash flows that are due to the group in accordance with the contract and all the cash flows that the entity expects to receive (i.e., all cash shortfalls), discounted at the original EIR. ECL impairment loss allowance (or reversal) recognized during the period is recognized as income/ expense in the statement of profit and loss (P&L). This amount is reflected under the head ‘other expenses’ in the P&L. The balance sheet presentation for various financial instruments is described below:
• Financial assets measured as at amortised cost, contractual revenue receivables and lease receivables: ECL is presented as an allowance, i.e., as an integral part of the measurement of those assets in the balance sheet. The allowance reduces the net carrying amount. Until the asset meets write-off criteria, the group does not reduce impairment allowance from the gross carrying amount.
• Loan commitments and financial guarantee contracts: ECL is presented as a provision in the balance sheet, i.e. as a liability. Debt instruments measured at FVTOCI: For debt instruments measured at FVOCI, the expected credit losses do not reduce the carrying amount in the balance sheet, which remains at fair value. Instead, an amount equal to the allowance that would arise if the asset was measured at amortised cost is recognised in other comprehensive income as the ‘accumulated impairment amount”
For assessing increase in credit risk and impairment loss, the group combines financial instruments on the basis of shared credit risk characteristics with the objective of facilitating an analysis that is designed to enable significant increases in credit risk to be identified on a timely basis. The Group does not have any purchased or originated credit-impaired (POCI) financial assets, i.e., financial assets which are credit impaired on purchase/ origination. Financial liabilities Initial recognition and measurement Financial liabilities are classified, at initial recognition, as financial liabilities at fair value through profit or loss, loans and borrowings, payables, or as derivatives designated as hedging instruments in an effective hedge, as appropriate.

Annual Report 2018-19
Consolidated Financial Statements
All amounts in Euro’000, unless otherwise stated
74
All financial liabilities are recognised initially at fair value and, in the case of loans and borrowings and payables, net of directly attributable transaction costs. The Group’s financial liabilities include trade and other payables, loans and borrowings including derivative financial instruments. Subsequent measurement The measurement of financial liabilities depends on their classification, as described below: Financial liabilities at fair value through profit or loss Financial liabilities at fair value through profit or loss include financial liabilities held for trading and financial liabilities designated upon initial recognition as at fair value through profit or loss. Financial liabilities are classified as held for trading if they are incurred for the purpose of repurchasing in the near term. This category also includes derivative financial instruments entered into by the Group that are not designated as hedging instruments in hedge relationships as defined by IFRS 9. Gains or losses on liabilities held for trading are recognised in the income statement. Financial liabilities designated upon initial recognition at fair value through profit or loss are designated at the initial date of recognition, and only if the criteria in IFRS 9 are satisfied. The Group has not designated any financial liability as at fair value through profit or loss. Loans and borrowings This is the category most relevant to the Group. After initial recognition, interest-bearing loans and borrowings are subsequently measured at amortised cost using the EIR method. Gains and losses are recognised in profit or loss when the liabilities are derecognised as well as through the EIR amortisation process. Amortised cost is calculated by taking into account any discount or premium on acquisition and fees or costs that are an integral part of the EIR. The EIR amortisation is included as finance costs in the income statement. This category generally applies to interest-bearing loans and borrowings. Derecognition A financial liability is derecognised when the obligation under the liability is discharged or cancelled or expires. When an existing financial liability is replaced by another from the same lender on substantially different terms, or the terms of an existing liability are substantially modified, such an exchange or modification is treated as the derecognition of the original liability and the recognition of a new liability. The difference in the respective carrying amounts is recognised in the income statement. Offsetting of financial instruments Financial assets and financial liabilities are offset and the net amount is reported in the consolidated statement of financial position if there is a currently enforceable legal right to offset the recognised amounts and there is an intention to settle on a net basis, to realise the assets and settle the liabilities simultaneously.

Annual Report 2018-19
Consolidated Financial Statements
All amounts in Euro’000, unless otherwise stated
75
A.6.2.8.1 Derivative financial instruments
The Group enters into derivative financial instruments to manage its exposure of foreign exchange, viz. foreign exchange forward contracts and cross currency swaps. Derivatives are initially recognised at fair value on the date a derivative contract is entered into and are subsequently remeasured to their fair value at the end of each reporting period. The accounting for subsequent changes in fair value depends on whether the derivative is designated as a hedging instrument, and if so, the nature of the item being hedged. The group designates certain derivatives as either:
• hedges of the fair value of recognised assets or liabilities or a firm commitment (fair value hedges)
• hedges of a particular risk associated with the cash flows of recognised assets and liabilities and highly probable forecast transactions (cash flow hedges), or
• hedges of a net investment in a foreign operation (net investment hedges). At inception of the hedge relationship, the group documents the economic relationship between hedging instruments and hedged items including whether changes in the cash flows of the hedging instruments are expected to offset changes in the cash flows of hedged items. The group documents its risk management objective and strategy for undertaking its hedge transactions. The fair values of derivative financial instruments designated in hedge relationships are disclosed in note A.6.6.3. Movements in the hedging reserve in shareholders’ equity are shown in A.6.3.14. The full fair value of a hedging derivative is classified as a non-current asset or liability when the remaining maturity of the hedged item is more than 12 months; it is classified as a current asset or liability when the remaining maturity of the hedged item is less than 12 months. Trading derivatives are classified as a current asset or liability if these are expected to be settled within 12 months of the reporting date, else these are classified as non-current. Cash flow hedges that qualify for hedge accounting The effective portion of changes in the fair value of derivatives that are designated and qualify as cash flow hedges is recognised in the cash flow hedge reserve within equity. The gain or loss relating to the ineffective portion is recognised immediately in profit or loss, within other gains/(losses). When forward contracts are used to hedge forecast transactions, the group generally designates the full change in fair value of the forward contract (including forward points) as the hedging instrument. In such cases, the gains or losses relating to the effective portion of the change in fair value of the entire forward contract are recognised in the cash flow hedge reserve within equity. Amounts accumulated in equity are reclassified in the periods when the hedged item affects profit or loss, as follows:
• Where the hedged item subsequently results in the recognition of a non-financial asset (such as inventory), both the deferred hedging gains and losses, are included within the initial cost of the asset. The deferred amounts are ultimately recognised in profit or loss as the hedged item affects profit or loss (for example through cost of sales).

Annual Report 2018-19
Consolidated Financial Statements
All amounts in Euro’000, unless otherwise stated
76
• The gain or loss relating to the effective portion of the cross currency interest rate swaps hedging foreign currency borrowings is recognised in profit or loss within finance cost at the same time as the interest expense on the hedged borrowings.
When a hedging instrument expires, or is sold or terminated, or when a hedge no longer meets the criteria for hedge accounting, any cumulative deferred gain or loss in equity at that time remains in equity until the forecast transaction occurs, resulting in the recognition of a non-financial asset such as inventory. When the forecast transaction is no longer expected to occur, the cumulative gain or loss that were reported in equity are immediately reclassified to profit or loss. Derivatives that do not qualify for hedge accounting Certain derivative instruments do not qualify for hedge accounting. Changes in the fair value of any derivative instrument that does not qualify for hedge accounting are recognised immediately in profit or loss and are included in other gains/(losses). Accounting policies applied until March 31, 2018 The group has applied IFRS 9 prospectively and has elected not to restate comparative information. As a result, the comparative information provided continues to be accounted for in accordance with the group’s previous accounting policy.
Until March 31, 2018, the group classified its financial assets in the following categories:
• financial assets at fair value through profit or loss,
• loans and receivables,
• held-to-maturity investments, and
• available-for-sale financial assets. a. Financial assets carried at fair value through profit or losses are initially recognised at fair value, and transaction costs are expensed in the income statement. Changes in the fair value of financial assets measured at fair value – either because they have been designated as such upon initial recognition or are held for trading – are recognised directly in the income statement. They are also reported as current assets if they are being held for trading or it can be reasonably expected that they will be converted within twelve months from the reporting date. b. Loans and receivables are initially recognised at fair value plus transaction costs. Loans and receivables that have fixed or determinable payments and are not listed on an active market are measured at amortised cost using the effective interest method less any necessary write-downs arising from impairments. They are reported in the statement of financial position under other receivables and other assets unless they are trade receivables and are recorded as non-current or current depending on their maturity period. c. Financial assets held to maturity are initially recognised at fair value plus transaction costs. Financial assets held to maturity which exhibit fixed or determinable payments and a fixed maturity period, and which the Group wishes and is able to hold until maturity are measured at amortised cost and reported depending on their maturity period as non-current or current assets. The amortisation and losses arising from impairments are recognised in the statement of profit or loss.

Annual Report 2018-19
Consolidated Financial Statements
All amounts in Euro’000, unless otherwise stated
77
d. Available-for-sale financial assets that have been classified as such upon initial recognition are measured at fair value plus transaction costs, provided that this can be determined, and then reported as non-current or current assets, depending on the expected time of sale. Gains and losses from changes in fair value are recorded net, i.e. after tax, and taken directly to equity (“Other comprehensive income”) until the financial asset has been derecognised.
A security is considered to be impaired if there has been a significant or prolonged decline in the fair value below its cost. To determine if an available-for-sale financial asset is impaired, the group evaluates the duration and extent to which the fair value of the asset is less than its cost, and the financial health of and short-term business outlook for the investee (including factors such as industry and sector performance, changes in technology and operational and financing cash flows).
In the event that an asset is impaired permanently, however, the loss must be recorded directly in the income statement. If it is not possible to determine the fair value, for example with holdings in non-consolidated affiliated companies or other investments in companies, these assets are measured at cost.
Impairment of financial assets
(a) Assets carried at amortised cost The group assesses at the end of each reporting period whether there is objective evidence that a financial asset or group of financial assets is impaired. A financial asset or a group of financial assets is impaired and impairment losses are incurred only if there is objective evidence of impairment as a result of one or more events that occurred after the initial recognition of the asset (a ‘loss event’) and that loss event (or events) has an impact on the estimated future cash flows of the financial asset or group of financial assets that can be reliably estimated. Evidence of impairment may include indications that the debtors or a group of debtors are experiencing significant financial difficulty, default or delinquency in interest or principal payments, the probability that they will enter bankruptcy or other financial reorganisation, and where observable data indicates that there is a measurable decrease in the estimated future cash flows, such as changes in arrears or economic conditions that correlate with defaults. For the loans and receivables category, the amount of the loss is measured as the difference between the asset’s carrying amount and the present value of estimated future cash flows (excluding future credit losses that have not been incurred) discounted at the financial asset’s original effective interest rate. The carrying amount of the asset is reduced and the amount of the loss is recognised in the consolidated income statement. If a loan or held-to-maturity investment has a variable interest rate, the discount rate for measuring any impairment loss is the current effective interest rate determined under the contract. As a practical expedient, the group may measure impairment on the basis of an instrument’s fair value using an observable market price. If, in a subsequent period, the amount of the impairment loss decreases and the decrease can be related objectively to an event occurring after the impairment was recognised (such as an improvement in the debtor’s credit rating), the reversal of the previously recognised impairment loss is recognised in the consolidated income statement.
Annual Report 2018-19
Consolidated Financial Statements
All amounts in Euro’000, unless otherwise stated
78
(b) Assets classified as available for sale The group assesses at the end of each reporting period whether there is objective evidence that a financial asset or a group of financial assets is impaired
Derivative financial instruments
Derivatives are initially recognised at fair value at the date the derivative contract is entered into, and are subsequently re-measured to their fair value at the end of each reporting period. The resulting gain or loss is recognised in profit or loss immediately unless the derivative is designated as a hedging instrument, in which event the timing of the recognition in profit or loss depends on the nature of the hedge relationship. The Group designates certain derivatives as hedges of highly probable forecast transactions or hedges of foreign currency risk of firm commitments as cash flow hedges. Derivative financial instruments that are not part of a hedging relationship are carried at fair value upon initial recognition, corresponding to the fair value of the consideration received or given in return. After initial recognition, derivative financial instruments are carried at fair value, which is based on the market value of the financial instrument. Any changes in fair value are recorded directly in profit or loss. Hedge accounting The Group designates fixed-to-fixed cross-currency interest-rate swaps as hedging instruments in cash flow hedges in respect of risk of variability, due to changes in foreign exchange rates, in EURO cash flows on financial assets and financial liabilities denominated in foreign currency. The Group also designates foreign currency forward contracts as hedging instruments in respect of risk of variability of cash flows due to cash flows in currencies denomination in other than the functional currency of the entity. Such hedges of foreign exchange risk on highly probable forecast cash flows are accounted for as cash flow hedges. At the inception of the hedge relationship, the entity documents the relationship between the hedging instrument and the hedged item, along with its risk management objectives and its strategy for undertaking various hedge transactions. Furthermore, at the inception of the hedge and on an ongoing basis, the Group documents whether the hedging instrument is highly effective in offsetting changes in fair values of the hedged item. Cash flow hedges The effective portion of changes in the fair value of derivatives that are designated and qualify as cash flow hedges is recognised in equity in ‘Cash Flow Hedge Reserve’. The gain or loss relating to the ineffective portion is recognised immediately in the income statement and is included in the line ‘Other Income or Other Operating Expenses’. Amounts previously recognised in ‘Cash Flow Hedge Reserve’ and accumulated in equity are reclassified to the income statement in the periods when the hedged item affects income statement. The gain or loss relating to the effective portion of cross-currency interest-rate swaps is recognised in profit or loss within ‘finance costs’. However, when the forecast transaction that is hedged results in the recognition of a non-financial asset (for example, inventory or fixed assets) the gains and losses previously deferred in equity are reclassified from equity and included in the initial measurement of the cost of the asset. The deferred amounts are ultimately recognised in

Annual Report 2018-19
Consolidated Financial Statements
All amounts in Euro’000, unless otherwise stated
79
profit or loss as cost of goods sold in the case of inventory, or as depreciation or impairment in the case of fixed assets. Discontinuation of hedge accounting Hedge accounting is discontinued when the Group revokes the hedging relationship, when the
hedging instrument expires or is sold, terminated, or exercised, or it no longer qualifies for hedge
accounting. Any gain or loss accumulated in equity is reclassified from equity to income statement
in the same period or periods during which the hedged forecast cash flows affect the income
statement. If the underlying hedge transaction is no longer expected to occur, the amounts
accumulated in equity are immediately reclassified in full to the income statement.
A.6.2.9 Inventories
Inventories are initially measured at cost, which comprises those costs directly attributable to the production process and an appropriate share of production overheads based on normal operating capacity. This includes write-downs related to production and a reasonable proportion of the administrative and social security costs. Financing costs are not included in the acquisition or production costs. Costs for raw materials and supplies are determined using the moving weighted average prices.
Inventories are carried at the lower of the cost or net realisable value at the reporting date. The net realisable value is the estimated selling price that could be achieved in the course of normal business less estimated costs of completion and estimated costs necessary to make the sale.
A.6.2.10 Revenue from contracts with customers
IFRS 15 - Revenue from Contracts with Customers as endorsed by the EU, is applied by SMRP BV Group as of April 01, 2018. The Group decided to apply the modified retrospective approach; whereby previous year’s consolidated financial statements are not restated. Revenue from contracts with customers is recognised when control of the goods or services are transferred to the customer at an amount that reflects the consideration to which the Group expects to be entitled in exchange for those goods or services. The Group has generally concluded that it is the principal in its revenue arrangements, except for the agency services below, because it typically controls the goods or services before transferring them to the customer. A. Revenue from sale of components Revenue from sale of components is recognised at the point in time when control of the asset is transferred to the customer, which is generally on delivery of the component. The Group considers whether there are other promises in the contract that are separate performance obligations to which a portion of the transaction price needs to be allocated. In determining the transaction price for the sale of equipment, the Group considers the effects of variable consideration, the existence of significant financing components, non-cash consideration, and consideration payable to the customer (if any).

Annual Report 2018-19
Consolidated Financial Statements
All amounts in Euro’000, unless otherwise stated
80
(i) Variable consideration If the consideration in a contract includes a variable amount, the Group estimates the amount of consideration to which it will be entitled in exchange for transferring the goods to the customer. The variable consideration is estimated at contract inception and constrained until it is highly probable that a significant revenue reversal in the amount of cumulative revenue recognised will not occur when the associated uncertainty with the variable consideration is subsequently resolved. Contracts for the sale of components provide customers with a customary right of return in case of defects, quality issues etc. The rights of return give rise to variable consideration. The Group uses the expected value method to estimate the goods that will not be returned because this method best predicts the amount of variable consideration to which the Group will be entitled. The requirements in IFRS 15 on constraining estimates of variable consideration are also applied in order to determine the amount of variable consideration that can be included in the transaction price. For goods that are expected to be returned, instead of revenue, the Group recognises a refund liability. A right of return asset (and corresponding adjustment to cost of sales) is also recognised for the right to recover products from a customer. Warranty obligations The Group typically provides warranties for general repairs of defects that existed at the time of sale, as required by law. These assurance-type warranties are accounted for under IAS 37 Provisions, Contingent Liabilities and Contingent Assets. B. Revenue from assembly of components The Group has contracts with customers to assemble, on their behalf, customised components from various parts procured from suppliers identified by the customer. The Group is acting as an agent in these arrangements. When another party is involved in providing goods or services to its customer, the Group determines whether it is a principal or an agent in these transactions by evaluating the nature of its promise to the customer. The Group is a principal and records revenue on a gross basis if it controls the promised goods or services before transferring them to the customer. However, if the Group’s role is only to arrange for another entity to provide the goods or services, then the Group is an agent and will need to record revenue at the net amount that it retains for its agency services. C. Revenue from development of tools The Group develops customised tooling for its customers and recognises its revenue over time using an input method to measure progress towards complete satisfaction of the tool development. The Group recognises revenue from development of tools over time if it can reasonably measure its progress towards complete satisfaction of the performance obligation. In cases, where the Group cannot reasonably measure the outcome of a performance obligation, but the Group expects to recover the costs incurred in satisfying the performance obligation. In those circumstances, the Group recognises revenue only to the extent of the costs incurred until such time that it can reasonably measure the outcome of the performance obligation.

Annual Report 2018-19
Consolidated Financial Statements
All amounts in Euro’000, unless otherwise stated
81
D. Costs to obtain a contract Such costs are recognised as an asset if there are future economic benefits associated with such costs. These are amortised systematically to match the benefits and such amortisation is netted off with revenue. Such assets are presented as Unamortised Expenditure in Note A.6.3.7 and classified as current and non-current based on the expected amortisation period. In cases where future economic benefits cannot be determined such costs are expensed off as incurred. Amounts unpaid towards such costs are recorded under other liabilities as “Amounts payable to obtain contracts” in Note A.6.3.13.
E. Judgments applied in determining amount and timing of revenue The Group applied the following judgements that significantly affect the determination of the amount and timing of revenue from contracts with customers: Determining the timing of satisfaction of tooling development The Group concluded that revenue for development of tooling is to be recognised over time because the Group’s performance does not create asset with an alternative use to the Group since the tools are customised for each customer and the Group has an enforceable right to payment for performance completed to date. The Group determined that the input method is the best method in measuring progress of the tooling development because there is a direct relationship between the Group’s effort (i.e., costs incurred) and the transfer of tooling to the customer. The Group recognises revenue on the basis of the total costs incurred relative to the total expected costs to complete the tool. Principal versus agent considerations The Group enters into contracts with its customers to assemble, on their behalf, customised components using various parts procured from suppliers identified by the customer. Under these contracts, the Group provides assembly services (i.e., coordinating the procurement of various parts from the identified suppliers and combining or assembling them into components as desired by the customer). The Group determined that it does not control the goods before they are transferred to customers, and it does not have the ability to direct the use of the component or obtain benefits from the component. The following factors indicate that the Group does not control the goods before they are being transferred to customers. Therefore, the Group determined that it is an agent in these contracts.
• The Group is not primarily responsible for fulfilling the promise to provide the specified equipment.
• The Group does not have inventory risk before or after the specified component has been transferred to the customer as it purchases various parts on just-in-time basis and only upon contract of the customer.
• The Group has no discretion in establishing the price for the specified component. The Group’s consideration in these contracts is only based on the difference between the maximum purchase price quoted by the customer and the cost of various parts purchased from the suppliers.
• In addition, the Group concluded that it transfers control over its services (i.e., assembling the component from various parts), at a point in time, upon receipt by the customer of the component, because this is when the customer benefits from the Group’s agency service.

Annual Report 2018-19
Consolidated Financial Statements
All amounts in Euro’000, unless otherwise stated
82
Consideration of significant financing component in a contract The Group develops customised tooling and secondary equipment’s for which the manufacturing lead time after signing the contract is usually more than one year. This type of contract includes two payment options for the customer, i.e., payment of the transaction price equal to the cash selling price upon delivery of the tooling, as adjusted by advance(s) received or payment of the transaction price as part of the component’s selling price. The Group concluded that there is a significant financing component for those contracts where the customer elects to pay along with the component’s selling price considering the length of time between the transfer of tooling and secondary equipment and the recovery of transaction price from the customer, as well as the prevailing interest rates in the market. In determining the interest to be applied to the amount of consideration, the Group concluded that the interest rate implicit in the contract (i.e., the interest rate that discounts the cash selling price of the equipment to the amount paid in advance) is appropriate because this is commensurate with the rate that would be reflected in a separate financing transaction between the entity and its customer at contract inception. Accounting policies applied until March 31, 2018 The group has applied IFRS 15 prospectively and has elected not to restate comparative information. As a result, the comparative information provided continues to be accounted for in accordance with the group’s previous accounting policy. Sale of goods: Measurement of revenue: Revenue is measured at the fair value of the consideration received or receivable. Sales are recognised when the significant risks and rewards of ownership are transferred to the buyer as per the terms of contract and are recognised. Amounts disclosed as revenue are net of returns, trade allowances, rebates and amounts collected on behalf of third parties, if any. Timing of recognition: The Company recognises revenue when the amount of revenue can be reliably measured, it is probable that future economic benefits will flow to the entity and specific criteria have been met for each of the Company’s activities. The Company bases its estimates on historical results, taking into consideration the type of customer, the type of transaction and the specifics of each arrangement. Tooling Revenue Timing of recognition: The Company develops tooling for its customers. The Company uses the ‘percentage of completion method’ to determine the appropriate amount to recognise in a given period. The Company determines the level of completion on the basis of milestones achieved to date. Measurement of revenue: When the outcome of a construction contract can be estimated reliably and it is probable that the contract will be profitable, contract revenue is recognised over the period of the contract by reference to the stage of completion. Contract costs are recognised as expenses by reference to the stage of completion of the contract activity at the end of the reporting period. When it is probable that total contract costs will exceed total contract revenue, the expected loss is recognised as an expense immediately. Revenue is recognised only to the extent of contract

Annual Report 2018-19
Consolidated Financial Statements
All amounts in Euro’000, unless otherwise stated
83
costs incurred that is probable will be recoverable. If it is not possible to determine the level of completion reliably, revenue is recognised only to the extent of contract costs incurred that is probable will be recoverable. The costs include all expenses incurred in direct relation to the specific projects and a proportion of the fixed and variable general costs incurred on the basis of normal capacity for the Company’s construction contracts. On the balance sheet, the Company reports the net contract position for each contract as either an asset or a liability. A contract represents an asset where costs incurred plus recognised profits (less recognised losses) exceed progress billings; a contract represents a liability where the opposite is the case. Customer acquisition costs: Customer acquisition costs are recognised as an asset if there are future economic benefits associated with such costs. Such assets are amortised systematically to match the benefits and such amortisation is netted off with revenue.
A.6.2.11 Contract Balances
Trade Receivables Trade receivables are amounts due from customers for goods sold or services performed in the ordinary course of business. They are generally due for settlement within one year or within the normal operating cycle and therefore are all classified as current. Where the settlement is due after one year or after the normal operating cycle, they are classified as non-current. Trade receivables are recognised initially at the amount of consideration that is unconditional unless they contain significant financing components, when they are recognised at fair value. The group holds the trade receivables with the objective to collect the contractual cash flows and therefore measures them subsequently at amortised cost using the effective interest method. Trade receivables are disclosed in Note A.6.3.6. For information about the impairment of trade receivables, refer Note A.6.2.7. Contract Assets A contract asset is the entity’s right to consideration in exchange for goods or services that the entity has transferred to the customer. A contract asset becomes a receivable when the entity’s right to consideration is unconditional, which is the case when only the passage of time is required before payment of the consideration is due. The impairment of contract assets is measured, presented and disclosed on the same basis as trade receivables. The Group’s contract assets are disclosed in Note A.6.3.6 as Unbilled Receivables. Contract Liabilities A contract liability is the obligation to transfer goods or services to a customer for which the Group has received consideration (or an amount of consideration is due) from the customer. If a customer pays consideration before the Group transfers goods or services to the customer, a contract liability is recognised when the payment is made or the payment is due (whichever is earlier). Contract liabilities are recognised as revenue when the Group performs under the contract. Contract Liabilities are disclosed in Note A.6.3.13 as Advances received from customers. Impairment An impairment is recognised to the extent that the carrying amount of a receivable or asset relating to contracts with customers:

Annual Report 2018-19
Consolidated Financial Statements
All amounts in Euro’000, unless otherwise stated
84
(a) the remaining amount of consideration that the Group expects to receive in exchange for the goods or services to which such asset relates; less (b) the costs that relate directly to providing those goods or services and that have not been recognised as expenses.
A.6.2.12 Cash and cash equivalents
Cash and cash equivalents consist of cash on hand and short-term deposits with an original maturity three months or less. Because of the short term nature of Cash and cash equivalent, the Group recognises these at its contractual par-amount. Similar to trade receivables, the Cash and cash equivalent involves one single cash flow which is the repayment of the principal. Therefore, the cash flows resulting from the receivables meet the Solely Payments of Principal and Interest (SPPI) test of payments of principal and interest despite the interest component being zero. The Group holds these balances in order to collect contractual cash flows. Cash and cash equivalent is therefore classified as measured at amortised cost. Cash and cash equivalents are also subject to the general approach. However, due to the fact that Cash and cash equivalent is repayable on demand, 12-month and lifetime expected losses are the same. The expected credit losses are considered insignificant.
A.6.2.13 Income taxes
The income tax expense or credit for the period is the tax payable on the current period’s taxable income based on the applicable income tax rate for each jurisdiction adjusted by changes in deferred tax assets and liabilities attributable to temporary differences and to unused tax losses. Current taxes are those taxes foreseeably payable on a year’s taxable income in accordance with the statutory tax rates or tax rates that had been substantially adopted as of the reporting date, as well as all adjustments to payable taxes in relation to previous reporting periods. Deferred income tax is provided in full, using the liability method, on temporary differences arising between the tax bases of assets and liabilities and their carrying amounts in the consolidated financial statements. Deferred tax assets and liabilities are recognised for all temporary differences between the carrying amount as per IFRS and the relevant tax assessment basis. Deferred tax liabilities are not recognised when the deferred tax liability arises from the initial recognition of goodwill or an asset or liability in a transaction that is not a business combination and, at the time of the transaction, affects neither the accounting profit nor taxable profit or loss. Deferred tax liabilities are not recognised for temporary differences (“outside-basis differences”) if the timing of the reversal of the temporary difference is controlled by the Group and it is probable that the temporary difference will not reverse in the foreseeable future. Deferred tax liabilities for dividends from subsidiaries will be recognised if the parent company determines that the profits of the respective subsidiary will be distributed in the foreseeable future. Deferred tax assets contain tax assets that are derived from the expected utilization of unused tax losses and unused tax credits, unless it is improbable that the future taxable profits will be available against which the temporary differences can be utilized. Deferred tax assets are not recognised for temporary differences between the carrying amount and tax bases of investments in subsidiaries and associates and interest in joint arrangements where it is not probable that the differences will

Annual Report 2018-19
Consolidated Financial Statements
All amounts in Euro’000, unless otherwise stated
85
reverse in the foreseeable future and taxable profit will not be available against which the temporary difference can be utilised. Deferred taxes are calculated on the basis of the tax rates that are expected to apply to the period when the asset is realized and the liability is settled, based on the tax rates that have been enacted or substantively enacted by the end of the reporting period in the respective country. The carrying amount of deferred tax assets is reviewed at each reporting date and reduced to the extent that it is no longer probable that sufficient taxable profit will be available to allow all or part of the deferred tax asset to be utilised. Unrecognised deferred tax assets are re-assessed at each reporting date and are recognised to the extent that it has become probable that future taxable profits will allow the deferred tax asset to be recovered. Deferred tax assets and liabilities are offset when there is a legally enforceable right to offset current tax assets and liabilities and when the deferred tax balances relate to the same taxation authority. Current tax assets and tax liabilities are offset where the entity has a legally enforceable right to offset and intends either to settle on a net basis, or to realise the asset and settle the liability simultaneously. Income taxes for the annual result reported in the income statement comprise current taxes and deferred taxes. Income taxes are recorded in the income statement unless they relate to items recognised directly in equity or in other comprehensive income. In this case, the income taxes incurred are also recognised directly in equity or in other comprehensive income.
A.6.2.14 Provisions
A.6.2.14.1 Employee benefits
(i) Short-term obligations Liabilities for wages and salaries, including non-monetary benefits, annual leave and accumulating sick leave that are expected to be settled wholly within 12 months after the end of the period in which the employees render the related service are recognised in respect of employees’ services up to the end of the reporting period and are measured at the amounts expected to be paid when the liabilities are settled. The liabilities are presented as current employee benefit obligations in the balance sheet. (ii) Other long-term employee benefit obligations In some countries, the group also has liabilities for long service leave and annual leave that are not expected to be settled wholly within 12 months after the end of the period in which the employees render the related service. These obligations are therefore measured as the present value of expected future payments to be made in respect of services provided by employees up to the end of the reporting period using the projected unit credit method. Consideration is given to expected future wage and salary levels, experience of employee departures and periods of service. Expected future payments are discounted using market yields at the end of the reporting period of high-quality corporate bonds with terms and currencies that match, as closely as possible, the estimated future cash outflows. Remeasurements as a result of experience adjustments and changes in actuarial assumptions are recognised in profit or loss.

Annual Report 2018-19
Consolidated Financial Statements
All amounts in Euro’000, unless otherwise stated
86
The obligations are presented as current liabilities in the balance sheet if the entity does not have an unconditional right to defer settlement for at least twelve months after the reporting period, regardless of when the actual settlement is expected to occur. (iii) Post-employment obligations
Pension obligations
Companies within the Group operate various pension schemes. The schemes are generally funded through payments to insurance companies or trustee-administered funds. The Group has both defined benefit and defined contribution plans. The liability recognised in the balance sheet in respect of defined benefit pension plans is the present value of the defined benefit obligation at the end of the reporting period less the fair value of plan assets. The defined benefit obligation is calculated annually by independent actuaries using the projected unit credit method. The present value of the defined benefit obligation is determined by discounting the estimated future cash outflows using interest rates of high-quality corporate bonds that are denominated in the currency in which the benefits will be paid, and that have terms to maturity approximating to the terms of the related pension obligation. In countries where there is no deep market in such bonds, the market rates on government bonds are used. The net interest cost is calculated by applying the discount rate to the net balance of the defined benefit obligation and the fair value of plan assets. This cost is included in finance costs in the income statement. Remeasurement gains and losses arising from experience adjustments and changes in actuarial assumptions are recognised in the period in which they occur, directly in other comprehensive income. They are included in retained earnings in the statement of changes in equity and in the balance sheet. When a settlement or a curtailment occurs, the obligation and related plan assets are re-measured using current actuarial assumptions and the resultant gain or loss is recognised in the income statement during the period in which the settlement or curtailment occurs. Changes in the present value of the defined benefit obligation resulting from plan amendments or curtailments are recognised immediately in profit or loss as past service costs. The value of a net pension benefit asset is restricted to the present value of any amount the Group expects to recover by way of refunds from the plan or reductions in the future contributions after considering any legal or contractual minimum funding requirements. The minimum funding requirements stipulate a minimum amount or level of contributions that must be made to a plan over a given period and may limit the ability of the entity to reduce future contributions and considered respectively in determining the economic benefit from the plan.
For defined contribution plans, the Group pays contributions to publicly or privately administered
plans on a mandatory, contractual or voluntary basis. The Group has no further payment

Annual Report 2018-19
Consolidated Financial Statements
All amounts in Euro’000, unless otherwise stated
87
obligations once the contributions have been paid. The contributions are recognised as employee
benefit expense when they are due. Prepaid contributions are recognised as an asset to the extent
that a cash refund or a reduction in the future payments is available.
A defined contribution plan is a pension plan under which the Group pays fixed contributions into
a separate entity. The Group has no legal or constructive obligations to pay further contributions if
the fund does not hold sufficient assets to pay all employees the benefits relating to employee
service in the current and prior periods.
A.6.2.14.2 Warranties
A provision is recognised for expected warranty claims on products sold during the year, based on past experience of the level of repairs and returns although it is expected that most of these costs will be paid out in the next financial year. Assumptions used to calculate the provision for warranties were based on current sales levels and current information available about returns based on the warranty period for all products sold. A.6.2.14.3 Provision for onerous contracts An onerous contract is a contract in which the unavoidable costs of meeting the obligations under the contract exceed the economic benefits expected to be received under it. The Group at the end of every reporting period conducts the onerous contract test per the provisions of IAS 37 by comparing the remaining costs to be incurred under the contract with the related revenue of the contract. Where the costs of a contract increase the related revenue of the contract, the Group makes a provision for the difference.
A.6.2.14.4 Other provisions
Provisions are recognised to accommodate the possibility that current legal or constructive obligations against third parties resulting from a past event exist, and that it is probable that an outflow of economic benefits will be required to settle the obligation, and that the amount of these obligations can be estimated reliably. Long-term provisions are determined by discounting the expected future cash flows at a pre-tax rate that reflects current market assessments of the time value of money. Short term provisions are carried at their redemption value and are not offset against receivables from reimbursements.
A.6.2.15 Government Grants and grants from public institutions
Government grants are recognised when it is reasonable to expect that the grants will be received and that all related conditions will be met, usually on submission of a valid claim for payment. Government grants in respect of capital expenditure are credited to the acquisition costs of the respective fixed asset and thus are released as income over the expected useful lives of the relevant assets. Grants of a revenue nature are credited to income so as to match them with the expenditure to which they relate as the conditions attached to the grants are met.
Annual Report 2018-19
Consolidated Financial Statements
All amounts in Euro’000, unless otherwise stated
88
Grants from public institutions are accounted for in a manner similar to the accounting for government grants, if the grants are comparable to government grants in their nature and the conditions related to these grants are satisfied.
A.6.2.16 Liabilities from finance lease
Liabilities from finance lease are initially carried at equal to the fair value of leased property, or if lower, the present value of minimum lease payments. The lease payments are then separated into financing costs and the redemption of the remaining liability.
A.6.2.17 Borrowings and borrowing costs
Borrowings are recognised initially at fair value, net of transaction costs incurred. Borrowings are subsequently carried at amortized cost; any difference between the proceeds (net of transaction costs) and the redemption value is recognised in the income statement over the period of the borrowings using the effective interest method. Fees paid on the establishment of loan facilities are recognised as transaction costs of the loan to the extent that it is probable that some or all of the facility will be drawn down. In this case, the fee is deferred until the draw-down occurs. To the extent there is no evidence that it is probable that some or all of the facility will be drawn down, the fee is capitalized as a pre-payment for liquidity services and amortized over the period of the facility to which it relates. Borrowings are classified as current liabilities based on the contractual maturity unless the group expects and has an unconditional right to defer settlement of the liability for at least 12 months after the reporting period. General and specific borrowing costs directly attributable to the acquisition, construction or production of qualifying assets, which are assets that necessarily take a substantial period of time to get ready for their intended use or sale, are added to the cost of those assets, until such time as the assets are substantially ready for their intended use or sale. Investment income earned on the temporary investment of specific borrowings pending their expenditure on qualifying assets is deducted from the borrowing costs eligible for capitalization.
A.6.2.18 Recognition of income and expenses
Operating expenses are recognised when goods or services are used or when the expense is incurred. Interest is recognised using the effective interest method as an expense or income for the period in which it occurs. Interest payments for finance leases are calculated by breaking down the minimum lease payments into financing costs and redemption payments for the remainder of the liability and spreading the financing costs over the periods covered by the term of the leasing agreement. This allows a constant, periodic interest rate for the remainder of the liability to be calculated. Payments from operating leases are recognised over the term of the leasing agreement using a straight-line distribution in the income statement. Rental income arising from investment properties given under operating leases is accounted for on a straight-line basis over the lease terms and is included in revenue in the statement of profit and loss.

Annual Report 2018-19
Consolidated Financial Statements
All amounts in Euro’000, unless otherwise stated
89
Rental income is recognised over the period for which the investment property is given on rent. Dividend income is recognised when the right to receive payment is established. Royalty income is recognized in Other operating income on an accrual basis in accordance with the substance of the relevant agreements.
A.6.2.19 Segment information
Operating segments are reported in a manner consistent with the internal reporting provided to the chief operating decision-maker. The management and supervisory board of The Group assesses financial performance and position of the Group and makes strategic decisions. The management and supervisory board which consists of chief executive officer, chief operating officer and head of strategy has been identified as chief operating decision maker.
A.6.2.20 Current versus non-current classification
The group presents assets and liabilities in the balance sheet based on current/ non-current classification. An asset is treated as current when it is:
• Expected to be realised or intended to be sold or consumed in normal operating cycle
• Held primarily for the purpose of trading
• Expected to be realised within twelve months after the reporting period, or
• Cash or cash equivalent unless restricted from being exchanged or used to settle a liability for at least twelve months after the reporting period
All other assets are classified as non-current. A liability is current when:
• It is expected to be settled in normal operating cycle
• It is held primarily for the purpose of trading
• It is due to be settled within twelve months after the reporting period, or
• There is no unconditional right to defer the settlement of the liability for at least twelve months after the reporting period
The group classifies all other liabilities as non-current. Deferred tax assets and liabilities are classified as non-current assets and liabilities. The operating cycle is the time between the acquisition of assets for processing and their realisation in cash and cash equivalents. The group has identified twelve months as its operating cycle.
A.6.2.21 Changes in accounting policies and disclosures
The IASB has adopted the following changes to existing IFRS and adopted new IFRS standards, which have also already been adopted by the European Commission, thereby making their application mandatory as for Financial Year 2018-19 to the extent relevant for the Group.
Annual Report 2018-19
Consolidated Financial Statements
All amounts in Euro’000, unless otherwise stated
90
New standards and interpretations
During the financial year ended March 31, 2019, below mentioned amendments to IFRS became applicable to the Group, however these did not have significant impact on the net asset, financial or income position of the Group
• IFRS 9 Financial Instruments
• IFRS 15 Revenue from Contracts with Customers
• Annual Improvements 2014-2016 cycle
• Interpretation 22 Foreign Currency Transactions and Advance Consideration
The Group has changed its accounting policies pursuant to the adoption of IFRS 9 and IFRS 15
as disclosed below. Most of the other amendments listed above did not have any impact on the
amounts recognised in prior periods and are not expected to significantly affect the current or future
periods.
IFRS 9 Financial Instruments
IFRS 9 replaces the provisions of IAS 39 that relate to the recognition, classification and measurement of financial assets and financial liabilities, derecognition of financial instruments, impairment of financial assets and hedge accounting.
The adoption of IFRS 9 Financial Instruments from April 01, 2018 resulted in changes in accounting policies. However there are no significant adjustments to the amounts recognised in the financial statements. The new accounting policies are set out in note A.6.2.8 above. In accordance with the transitional provisions in IFRS 9(7.2.15) and (7.2.26), comparative figures have not been restated. The group has assessed which business models apply to the financial assets and liabilities held by the group and has classified its financial instruments into the appropriate IFRS 9 categories.

Annual Report 2018-19
Consolidated Financial Statements
All amounts in Euro’000, unless otherwise stated
91
The main affects resulting from this assessment are as below :
Measurement Category Carrying Amount
IAS 39 IFRS 9 IAS 39 March 31, 2018
IFRS 9 April 01, 2018
FINANCIAL ASSETS
Trade receivables Amortised cost Amortised cost 476,555 476,555
Other receivables Amortised cost Amortised cost 425,248 425,248
Cash and cash equivalents Amortised cost Amortised cost 215,640 215,640
Other investments Available for sale
FVOCI 27,698 27,698
Derivative financial instruments FVPL FVPL 2,048 2,048
FINANCIAL LIABILITIES
Borrowings
Notes Amortised cost Amortised cost 713,367 713,367
Liabilities to banks and others Amortised cost Amortised cost 145,292 145,292
Finance lease liabilities Amortised cost Amortised cost 5,407 5,407
Trade payables Amortised cost Amortised cost 828,603 828,603
Liabilities to joint ventures and related parties
Amortised cost Amortised cost 27,579 27,579
Other liabilities Amortised cost Amortised cost 141,740 141,740
Derivative financial instruments FVPL FVPL 28,153 28,153
The foreign currency forwards and cross currency swaps in place as at March 31, 2018 qualified as cash flow hedges under IFRS 9. The group’s risk management strategies and hedge documentation are aligned with the requirements of IFRS 9 and these relationships are therefore treated as continuing hedges. IFRS 15 Revenue from Contracts with Customers IFRS 15 replaces the existing standards on recognition of revenue and provides new principles for recognition of revenue. The new standard is based on the principle that revenue is recognised when control of a good or service transfers to a customer. The standard permits either a full retrospective or a modified retrospective approach for the adoption. The Group has adopted modified retrospective approach whereby comparative information has not been restated. The Group builds all customized products for its customers. In certain contracts, the Group is undertaking higher level assemblies of modules such as Instrument Panels, Cockpits etc. wherein whole/ substantial components are procured from suppliers nominated by customer without taking over any risks on the Company itself. Such a situation has been defined in standard as the Group acting as an agent, and requires recognition of revenues excluding the value of such components. In view of implementation of IFRS 15, the Group assessed that it is assuming limited risks in certain contracts, and in such cases only the Service fees involved in such contracts is recognized as Revenue by netting the cost of such components from raw material consumption as well as from sales as against earlier practice of full value to be included in Revenue. Therefore, certain line items like revenue, cost of materials etc. are not comparable with the
previous year presented. This change in presentation resulted in decrease in revenue by k€

Annual Report 2018-19
Consolidated Financial Statements
All amounts in Euro’000, unless otherwise stated
92
518,736 as compared to recognition of revenue under IAS 18. This change does not have impact
on profits before and after tax, retained earnings and statement of financial position.
New standards and interpretations not yet adopted
Certain new accounting standards and interpretations have been published that are not mandatory for March 31, 2019 reporting periods and have not been early adopted by the group. The group’s assessment of the impact of these new standards and interpretations is set out below.
(i) IFRS 16 Leases
With effect from April 01, 2019, IFRS 16 will replace the existing leases standard, IAS 17 Leases. IFRS 16 sets out the principles for the recognition, measurement, presentation and disclosure of leases for both lessees and lessors. It introduces a single, on-balance sheet lessee accounting model for lessees. A lessee recognises right-of-use asset representing its right to use the underlying asset and a lease liability representing its obligation to make lease payments. The standard also contains enhanced disclosure requirements for lessees. IFRS 16 substantially carries forward the lessor accounting requirements in IAS 17. The Group will adopt IFRS 16 effective annual reporting period beginning April 1, 2019. The Group will apply the standard to its leases, prospectively using the modified retrospective method as mandated by Para C5(b) and Para C8(c)(ii) of IFRS 16. Accordingly, the Group will not restate comparative information and there will no cumulative effect of initially applying this Standard to be recognised as an adjustment to the opening balance of retained earnings as on April 1, 2019. On that date, the Group will recognise a lease liability measured at the present value of the remaining lease payments. The right-of-use asset is recognised at an amount equal to the lease liability adjusted by the amount of any prepaid or accrued lease payments relating to that lease recognized in the balance sheet immediately before the date of initial application. The lease liability and right-of-use asset is discounted using the lessee’s incremental borrowing rate as at April 1, 2019. In accordance with the standard, the Group will elect not to apply the requirements of IFRS 16 to short-term leases and leases for which the underlying asset is of low value. On transition, the Group will be using the practical expedient provided by the standard and therefore, will not reassess whether a contract, is or contains a lease, at the date of initial application. The Group is in the process of finalising changes to systems and processes to meet the accounting and the reporting requirements of the standard in conjunction with review of lease agreements. The Group is also in the process of quantifying the impact of the standard on its balance sheet on the date of initial application. The Group will recognise with effect from April 1, 2019 new assets and liabilities for its operating leases of premises and other assets. The nature of expenses related to those leases will change from lease rent in previous periods to a) amortisation charge for the right- to use asset , and b) interest accrued on lease liability. Previously, the Group recognised operating lease expense on a straight-line basis over the term of the lease, and recognised assets and liabilities only to the extent that there was a timing difference between actual lease payments and the expense recognised.
Annual Report 2018-19
Consolidated Financial Statements
All amounts in Euro’000, unless otherwise stated
93
As a lessor, sublease shall be classified an operating lease if the head lease is classified as a short term lease. In all other cases the sublease shall be classified as a finance lease. (ii) IFRIC Interpretation 23 Uncertainty over Income Tax Treatment The Interpretation addresses the accounting for income taxes when tax treatments involve uncertainty that affects the application of IAS 12 and does not apply to taxes or levies outside the scope of IAS 12, nor does it specifically include requirements relating to interest and penalties associated with uncertain tax treatments. The Interpretation specifically addresses the following: • Whether an entity considers uncertain tax treatments separately • The assumptions an entity makes about the examination of tax treatments by taxation authorities • How an entity determines taxable profit (tax loss), tax bases, unused tax losses, unused tax credits and tax rates • How an entity considers changes in facts and circumstances An entity must determine whether to consider each uncertain tax treatment separately or together with one or more other uncertain tax treatments. The approach that better predicts the resolution of the uncertainty should be followed. The interpretation is effective for annual reporting periods beginning on or after 1 January 2019, but certain transition reliefs are available. The Group will apply interpretation from its effective date. Since the Group operates in a complex multinational tax environment, applying the Interpretation may affect its consolidated financial statements and the required disclosures. In addition, the Group may need to establish processes and procedures to obtain information that is necessary to apply the Interpretation on a timely basis.

Annual Report 2018-19
Consolidated Financial Statements
All amounts in Euro’000, unless otherwise stated
94
A.6.3 Disclosures regarding the Consolidated Statement of Financial Position
A.6.3.1 Acquisition of Reydel Automotive Group On August 02, 2018 the Group acquired 100% stake in Reydel Automotive Holdings B.V. and Reydel Automotive Management B.V. (jointly Reydel Automotive Group). Reydel Automotive Group is a leading global developer and supplier of interior components to the global automotive manufacturers. Reydel’s Interiors Product Portfolio includes Instrument Panels, Door Panels, Console Modules, Decorative Parts and Cockpit Modules. Reydel Automotive Group has been subsequently renamed as “Samvardhana Motherson Reydel Companies”. (hereinafter referred to as “SMRC”). The acquisition enhances Group’s diversification across customer portfolio and geographical footprint. The following table summarises the recognised amounts of identifiable assets and liabilities assumed at the date of acquisition. Particulars Amount
(€000s)
Total consideration transferred in cash (USD 200.40 million) 173,019
Recognised amounts of identifiable assets acquired and liabilities assumed
Property, plant and equipment 155,659
Intangible assets 20,229
Other financial instruments (current and non-current) 769
Trade receivables and other assets 23,692
Deferred tax assets 6,127
Inventories 21,075
Trade receivables 139,612
Current tax assets 2,209
Other receivables 63,991
Cash and cash equivalents 82,308
Borrowings (current and non-current) (43,889)
Employee benefit obligations (15,656)
Provisions (current and non-current) (14,281)
Other financial instrument (7)
Other liabilities (current and non-current) (58,879)
Deferred tax liabilities (15,521)
Trade payables (160,584)
Current tax liabilities (7,476)
Total identifiable net assets 199,378
- thereof attributable to non-controlling interests at subsidiaries 14,181
Total identifiable net assets attributable to the Group 185,197
Excess of Group’s interest in the fair value of acquirer’s identifiable net assets 12,178
Total 173,019

Annual Report 2018-19
Consolidated Financial Statements
All amounts in Euro’000, unless otherwise stated
95
Other information –
(i) Revenue and profit contribution The acquired business contributed revenues of k€ 618,652 and net profit of k€ 9,597 to the group for the period since acquisition to March 31, 2019.
(ii) The Group recognised gain on bargain purchase of k€ 12,178 being excess of fair value of
identifiable net assets assumed on acquisition over the purchase consideration. The gain has been recognised in the income statement for the year under “Other Operating Income” (refer note A.6.4.3). Gain on bargain purchase resulted from combination of SMRP BV’s unique position to complement Reydel’s business portfolio, its potential ability to manage and grow the business through synergies and a limited number of potential buyers which gave us sufficient purchasing power to achieve a beneficial transaction.

Annual Report 2018-19
Consolidated Financial Statements
All amounts in Euro’000, unless otherwise stated
96
A.6.3.2 Property, plant and equipment Land and
buildings Machinery and
other technical facilities
Tooling Other plant and office equipment
Capital work-in progress (including
capital advances)
Total
Cost
At April 01, 2017 428,473 787,723 45,860 80,844 278,954 1,621,854
Additions 16,297 56,319 2,348 13,531 188,502 276,997
Acquisition through business combinations
- - - - - -
Disposals (3,308) (8,394) (1,982) (3,285) (2,585) (19,554)
Transfers 45,324 88,684 (892) 7,838 (143,399) (2,445)
Foreign currency translation
(17,667) (41,033) (4,266) (4,057) (23,875) (90,898)
At March 31, 2018 469,119 883,299 41,068 94,871 297,597 1,785,954
Depreciation and Impairment
At April 01, 2017 62,737 341,001 30,459 48,210 19 482,426
Depreciation charge for the period
16,142 77,914 5,020 14,327 - 113,403
Impairment - 350 - - - 350
Disposals (1,094) (5,887) (1,219) (2,692) - (10,892)
Transfers (456) 3,380 (3,167) (205) - (448)
Foreign currency translation
(2,330) (17,365) (3,202) (2,678) (19) (25,594)
At March 31, 2018 74,999 399,393 27,891 56,962 - 559,245
Net book values at March 31, 2018
394,120 483,906 13,177 37,909 297,597 1,226,709
Cost
At April 1, 2018 469,119 883,299 41,068 94,871 297,597 1,785,954
Additions 19,656 82,523 844 33,997 107,164 244,184
Acquisition through business combinations
42,474 94,776 544 5,350 12,516 155,660
Disposals (1,065) (23,356) (3,358) (3,729) (386) (31,894)
Hyperinflationary adjustment
1,128 1,757 26 70 116 3,097
Transfers 102,684 184,001 8,882 18,296 (315,353) (1,490)
Foreign currency translation
9,702 23,086 1,110 2,363 11,922 48,183
At March 31, 2019 643,698 1,246,086 49,116 151,218 113,576 2,203,694
Depreciation and Impairment
At April 1, 2018 74,999 399,393 27,891 56,962 - 559,245
Depreciation charge for the period
20,412 110,184 4,766 18,756 - 154,118
Acquisition through business combinations
- - - - - -
Disposals (281) (19,805) (901) (3,584) - (24,571)
Hyperinflationary adjustment
160 800 29 23 - 1,012
Transfers (178) (558) (116) 887 - 35
Foreign currency translation
181 5,917 784 741 (107) 7,516
At March 31, 2019 95,293 495,931 32,453 73,785 (107) 697,355
Net book values at March 31, 2019
548,405 750,155 16,663 77,433 113,683 1,506,339

Annual Report 2018-19
Consolidated Financial Statements
All amounts in Euro’000, unless otherwise stated
97
As at March 31, 2019, property, plant and equipment with a net book value of k€ 742,541 (March 31, 2018: k€ 673,617) were subject to security for borrowings. (see note A.6.3.10).
During the year, the Group has capitalised borrowing costs amounting to k€ 2,320 (March 31, 2018: k€ 5,809) on qualifying assets. Borrowing costs were capitalised at the weighted average rate of its general borrowings of 3.43% (March 31, 2018 : 2.98%).
For details on outstanding commitments related to purchase of property, plant and equipment,
kindly refer note A.6.6.2.
The following table presents the movement of the carrying amounts of the finance lease assets
reported in property, plant and equipment:
Land and
buildings Machinery &
other technical facilities
Other plant and office equipment
Total
Cost
At April 01, 2017 10,075 14,300 811 25,186
Additions - 1,180 96 1,276
Disposals - (101) - (101)
Transfers 1,383 (2,845) (261) (1,723)
Foreign currency translation (497) (768) (70) (1,335)
At March 31, 2018 10,961 11,766 576 23,303
Depreciation and Impairment
At April 01, 2017 2,129 5,716 384 8,229
Depreciation charge for the period 417 1,916 (16) 2,317
Disposals - (101) - (101)
Transfers - (2,101) - (2,101)
Foreign currency translation (118) (274) (34) (426)
At March 31, 2018 2,428 5,156 334 7,918
Net book values at March 31, 2018 8,533 6,610 242 15,385
Cost
At April 01, 2018 10,961 11,766 576 23,303
Additions - 665 123 788
Disposals - (255) - (255)
Transfers 582 (16) (137) 429
Foreign currency translation 293 230 18 541
At March 31, 2019 11,836 12,390 580 24,806
Depreciation and Impairment
At April 01, 2018 2,428 5,156 334 7,918
Depreciation charge for the period 317 1,871 101 2,289
Disposals - (174) - (174)
Transfers (576) (16) (137) (729)
Foreign currency translation 67 120 12 199
At March 31, 2019 2,236 6,957 310 9,503
Net book values at March 31, 2019 9,600 5,433 270 15,303
All leasing agreements have a defined minimum term of lease. Once the lease term ends, the
lessor has the right to sell the leased assets at the agreed residual value. The residual values are

Annual Report 2018-19
Consolidated Financial Statements
All amounts in Euro’000, unless otherwise stated
98
pre-financed, making the exercise of the put option a non-monetary transaction, which also does
not affect the income statement.
Lease liabilities are secured by finance lease assets as on March 31, 2019 of k€ 15,303 (March
31, 2018: k€ 15,385) (see note A.6.3.10).
A.6.3.3 Intangible assets
Concessions, Intellectual Property,
Software and Similar rights
Patents & Technology
Customer Contracts
Goodwill Advance payment
Total
Cost
At April 01, 2017 23,770 27,490 30,762 3,204 21 85,247
Additions 4,178 - - - 1,898 6,076
Disposals (14) - - - - (14)
Transfers 426 - - - (21) 405
Foreign currency translation
(210) - (457) - - (667)
At March 31, 2018 28,150 27,490 30,305 3,204 1,898 91,047
Amortisation
At April 01, 2017 17,378 22,030 16,733 - - 56,141
Amortisation charge 3,085 1,529 4,137 - - 8,751
Disposals (14) - - - - (14)
Transfers (5) - - - - (5)
Foreign currency translation
(120) - (378) - - (498)
At March 31, 2018 20,324 23,559 20,492 - - 64,375
Net book value March 31, 2018
7,826 3,931 9,813 3,204 1,898 26,672
Cost
At April 1, 2018 28,150 27,490 30,305 3,204 1,898 91,047
Additions 9,167 - - - 1,472 10,639
Acquisition through business combinations
20,229 - - - - 20,229
Disposals (1,321) - - - - (1,321)
Transfers 1,134 - 415 - (130) 1,419
Foreign currency translation
386 - 149 - - 535
At March 31, 2019 57,745 27,490 30,869 3,204 3,240 122,548
Amortisation
At April 1, 2018 20,324 23,559 20,492 - - 64,375
Amortisation charge 8,212 1,454 4,200 - - 13,866
Disposals (1,319) - - - - (1,319)
Transfers (50) - - - - (50)
Foreign currency translation
124 - 119 - - 243
At March 31, 2019 27,291 25,013 24,811 - - 77,115
Net book value March 31, 2019
30,454 2,477 6,058 3,204 3,240 45,433

Annual Report 2018-19
Consolidated Financial Statements
All amounts in Euro’000, unless otherwise stated
99
Research and development expenses amounting to k€ 144,220 (March 31, 2018: k€ 110,840) have been expensed off in the income statement.
As at March 31, 2019, intangible assets with a net book value of k€ 8,266 (March 31, 2018: k€ 4,327) were subject to security for bank borrowings.
Goodwill represents excess of fair value of business over carrying value of investment in CEFA recognised during the year ended March 31, 2017. For the purposes of impairment testing, this goodwill is part of CEFA which is considered as an independent cash generating unit.
The Group tests goodwill for impairment on an annual basis. The goodwill has been evaluated based on the cashflow forecasts of the related cash generating units (CGUs) and the recoverable amounts of these CGUs exceeded their carrying amounts. The estimated value in use of cash generating units (CGU) is based on the future cash flows using annual growth rate of upto 4% for periods subsequent to the forecast period of 5 years and weighted average cost of capital between 5% to 15%. An analysis of the sensitivity of the computation to a change in key parameters (operating margin, discount rates and long term average growth rate), based on reasonable probable assumptions, did not identify any probable scenario in which the recoverable amount of the CGU would decrease below its carrying amount. The discount rate was estimated based on past experience and company’s average weighted average cost of capital. The values assigned to the key assumptions represent the management’s assessment of future trends in the industry and based on both internal and external factors.
A.6.3.4 Investment properties March 31, 2019 March 31, 2018
Cost
At beginning of the year 14,678 12,637
Reclassifications from property, plant & equipment - 2,041
At end of the year 14,678 14,678
Depreciation and Impairment
At beginning of the year 2,950 2,171
Reclassifications from property, plant & equipment - 454
Depreciation charge 325 325
At end of the year 3,275 2,950
Net book value 11,403 11,728
The investment properties comprise a number of commercial properties that are leased to third parties. The leases contain an initial non-cancellable period of 5 years and subsequent renewals are negotiated with the lessee. No contingent rents are charged.
The Company did not perform the fair valuation of the investment property as at March 31, 2019
as there are no significant changes in the macro-economic factors applicable to the respective
jurisdictions.
The fair value of investment properties as on March 31, 2018 was k€ 14,662 which was determined
based on valuations performed by an accredited independent valuer and falls in the Level 3 of

Annual Report 2018-19
Consolidated Financial Statements
All amounts in Euro’000, unless otherwise stated
100
financial instruments valuation hierarchy. Since there are no significant changes in the economic
situation, the Company has considered the fair value as of March 31, 2019 to be same as last year.
At the year end, the future minimum lease payments under non-cancellable lease receivable are as follows:
March 31, 2019 March 31, 2018
Not later than one year 1,110 997
Later than one year and not later than five years 4,396 4,094
Total 5,506 5,091
During the year, following amounts were recognised in the income statement in respect of investment properties:
March 31, 2019 March 31, 2018
Rental income from rented properties, all leased under operating leases 1,079 819
Other operating income - -
Direct operating expenses (including repairs and maintenance) arising from investment property that generated rental income during the period
(646) (235)
Direct operating expenses (including repairs and maintenance) arising from investment property that did not generated rental income during the period
(7) (11)
Net rental income from rented properties 426 573

Annual Report 2018-19
Consolidated Financial Statements
All amounts in Euro’000, unless otherwise stated
101
A.6.3.5 Investments accounted for using the equity method
March 31, 2019 March 31, 2018
Joint ventures 33,448 28,200
Associates 86 43
Total 33,534 28,243
a) Joint ventures accounted for using the equity method The Group’s interest in following entities is accounted for using the equity method in the consolidated financial statements. There is no quoted market price for these investments.
Name of the entity March 31, 2019 March 31, 2018
Ningbo SMR Huaxiang Automotive Mirrors Co., Ltd (Ningbo) (including Chongqing SMR Huaxiang automotive Products Ltd)
28,184 22,821
Eissmann SMP Automotive Interieur Slovensko s.r.o. (Eissmann) 5,264 5,379
Total 33,448 28,200
Summarised financial information of the joint ventures, based on their IFRS financial statements, and reconciliation with the carrying amount of the investment in consolidated financial statements are set out below:
Joint Ventures
At April 01, 2017 17,781
Share of the profits1) 13,125
Acquisition of control 1,943
Dividends received (4,649)
At March 31, 2018 28,200
Share of the profits 7,047
Addition 72
Exchange differences 582
Dividends received (2,453)
At March 31, 2019 33,448
1) Includes k€ 2,864 towards reversal of impairment loss recognised in earlier years in respect of investment in Ningbo.

Annual Report 2018-19
Consolidated Financial Statements
All amounts in Euro’000, unless otherwise stated
102
Summarised financial information of joint ventures
Name of The Group March 31, 2019 March 31, 2018
Ningbo Eissmann Ningbo Eissmann
Percentage ownership interest 50% 49% 50% 49%
Balance Sheet
Non-current assets 33,515 11,298 26,620 10,516
Cash and cash equivalents 14,073 26 20,785 22
Current assets 63,504 7,803 76,872 5,640
Gross assets 111,092 19,127 124,277 16,178
Current financial liabilities (excluding trade payable and other provisions)
3,345 1,925 - 1,444
Other Current liabilities 51,340 6,486 78,758 3,544
Non-Current financial liabilities (excluding trade payable and other provisions)
- - - -
Other Non-current liabilities 42 118 222 211
Gross liabilities 54,727 8,529 78,980 5,199
Net assets 56,365 10,598 45,297 10,979
Reconciliation to carrying amounts:
Opening net assets 45,297 10,979 25,349 10,419
Profit for the period 14,468 (381) 25,702 560
Other comprehensive income - - - -
Exchange Differences 1,510 - 3,544 -
Dividends paid (4,907) - (9,298) -
Closing net assets 56,368 10,598 45,297 10,979
Group share in % 50% 49% 50% 49%
Group's share in Euro 000s 28,184 5,193 22,649 5,379
Other Adjustments - 71 172 -
Carrying amount 28,184 5,264 22,821 5,379
Summarised income statement
Results
Revenue 164,714 42,993 191,376 45,885
Interest income 153 - 85 -
Depreciation and amortisation (4,886) (1,842) (4,691) (1,731)
Interest expense 18 - (6) -
Income tax expense/ income (2,096) - (3,534) (896)
Other expenses (143,435) (41,532) (163,255) (42,699)
Profit for the period 14,468 (381) 19,975 559
Other Comprehensive Income - - - -
Total Comprehensive Income 14,468 (381) 19,975 559

Annual Report 2018-19
Consolidated Financial Statements
All amounts in Euro’000, unless otherwise stated
103
As the year end, the Group had no contractually fixed capital commitments in relation to its joint ventures and there are no restrictions on the ability of the joint ventures to transfer funds to the Group. Also, there are no contingent liabilities incurred relating to the Group’s interest in joint ventures.
b) Associates accounted for using the equity method
Re-Time Pty Ltd. Is a technology company which owns certain intellectual property rights through which it designed, developed and commercialised Re-Timer glasses, these glasses intend to reset internal body clock and help overcome jet lag without drug use.
Reconciliation of Group’s interest in Re-Time is as below –
March 31, 2019 March 31, 2018
Opening investment 43 135
Share of the profits 29 (42)
Exchange differences 14 (50)
Closing investment 86 43
This space has been intentionally left blank

Annual Report 2018-19
Consolidated Financial Statements
All amounts in Euro’000, unless otherwise stated
104
A.6.3.6 Receivables and other assets Non-current Trade receivables March 31, 2019 March 31, 2018
Trade receivables (i) 149,943 117,880
Total 149,943 117,880
Other receivables and assets March 31, 2019 March 31, 2018
Unamortised expenditure (ii) 83,360 32,798
Others 42,922 5,805
Total 126,282 38,603
Current
Trade receivables March 31, 2019 March 31, 2018
Trade receivables (iii) 460,250 358,675
Total 460,250 358,675
Other receivables and assets March 31, 2019 March 31, 2018
Unbilled receivables (iv) 470,855 393,600
Other tax receivables 63,139 17,910
Advanced payments 38,691 37,342
Prepaid expenses 12,711 10,752
Deposits 4,590 5,198
Supplier bonus 3,013 3,310
Receivables from related parties 793 1,739
Unamortised expenditure (ii) 4,702 5,685
Other 14,153 21,657
Total 612,647 497,193
(i) The carrying amount of the non-current trade receivables as at March 31, 2019 is calculated
using discount rates of 0.5%-3.5% (March 31, 2018: 0.5%-2.4%)
(ii) The table below represents movement in unamortised expenditure (current and non-current) :
March 31, 2019
Opening balance 38,483
Additions during the year 54,490
Amortised during the year (4,911)
Impairment losses -
Closing balance 88,062
(iii) Trade receivables as at March 31, 2019 were reported after deducting impairments amounting
to k€ 9,464 (March 31, 2018: k€ 8,603). The impairments are reported in the income statement
under the item “Other operating expenses”.

Annual Report 2018-19
Consolidated Financial Statements
All amounts in Euro’000, unless otherwise stated
105
(iv) The table below represents summary of contract assets and liabilities relating to contracts with
customers :
March 31, 2019 March 31, 2018
Receivables 610,193 476,555
Contract assets 470,855 393,600
Contract liabilities 6,028 5,323
Contract assets are initially recognised for revenue earned from development of tools and secondary equipment as receipt of consideration is conditional on successful completion and acceptance by the customer. Upon completion and acceptance by the customer, the amounts recognised as contract assets are reclassified to trade receivables. The expected credit loss on contract assets is considered very low and hence no provision for credit loss is recorded in respect of contract assets. (v) The carrying values approximately correspond to the fair values.
A.6.3.7 Other financial instruments
March 31, 2019 March 31, 2018
Assets Liabilities Assets Liabilities
Non-current
Forward contracts - - - -
Cross currency swaps 2,087 5,422 - 28,065
Total 2,087 5,422 - 28,065
Current
Forward contracts 4,163 140 2,048 88
Cross currency swaps 739 - - -
Total 4,902 140 2,048 88
The maximum exposure to the credit risk is carrying value of instruments. Please refer note A.6.6.3 for details on forward contracts and cross currency swaps.
A.6.3.8 Inventories Inventories comprise the following:
March 31, 2019 March 31, 2018
Raw materials and manufacturing supplies 174,807 133,155
Work in progress 36,983 28,914
Finished goods and goods for trading 50,903 41,123
Total 262,693 203,192
During the year, inventories of k€ 3,491 (March 31, 2018: k€ 9,666) were written down. The
amounts of the write-down are calculated based on an analysis of various factors. The most
important factors included in this analysis are: aging of inventories, current market conditions,
physical obsolescence and turnover of individual items. During the year, the Group recognised
reversal of write-down amounting to k€ 1,385 (March 31, 2018: k€ 8,112) as the related goods

Annual Report 2018-19
Consolidated Financial Statements
All amounts in Euro’000, unless otherwise stated
106
were sold during the year at prices equal to or above the cost. The amount of such write-down and
reversals of write-down are recognised as “Cost of materials” in the statement of profit and loss.
As at March 31, 2019, inventories amounting to k€ 121,696 (March 31, 2018: k€ 91,958) were
pledged as security for various bank borrowings. (see note A.6.3.10).
A.6.3.9 Cash and cash equivalents March 31, 2019 March 31, 2018
Cash at bank 310,754 215,521
Cash on hand 97 119
Total 310,851 215,640
As of March 31, 2019, cash and cash equivalents of k€ 183,513 (March 31, 2018: k€ 102,038) are charged as security in respect of borrowings, please refer note A.6.3.10 for further details.
This space has been intentionally left blank

Annual Report 2018-19
Consolidated Financial Statements
All amounts in Euro’000, unless otherwise stated
107
A.6.3.10 Borrowings March 31, 2019 March 31, 2018
Non-current
Notes 747,029 713,367
Bank loans 63,125 3,623
Finance lease liabilities 2,162 2,729
Loan from related parties 150,000 -
Other loans 4,925 9,722
Non-current borrowings 967,241 729,441
Current
Bank loans 183,438 130,124
Finance lease liabilities 1,354 2,678
Other loans 908 1,823
Current borrowings 185,700 134,625
(i) Secured liabilities and assets pledged as security
a) Notes The Notes are structured as senior secured obligations and rank ‘pari passu’ in right of payment with all the existing and future senior obligations of SMRP BV, including the obligations under the Revolving Credit Facility. The Notes are guaranteed on a senior secured basis by certain subsidiaries of SMRP BV and are secured by share pledge and security interests granted over certain property and assets of SMRP BV and certain of its subsidiaries. As of March 31, 2019, the Company has issued below mentioned notes which were outstanding on the date referred –
Principal amount Coupon rate (fixed) Maturity
€ 100 million 3.700% 18 June 2025 US$ 400 million 4.875% 16 December 2021 € 300 million 1.80% 06 July 2024
b) Bank Loans
During the year, the Group entered into a term loan facility agreement for US$ 60 million for a period of 59 months maturing August 2023. The term loan is senior secured obligation and rank ‘pari passu’ in right of payment with all the existing and future senior obligations of SMRP BV, including the obligations under the Revolving Credit Facility and the Notes and carry the same security structure as existing Notes and Revolving Credit Facility. This facility was fully utilised as of March 31, 2019. Other borrowings from banks also includes utilisations under the Revolving Credit Facility Agreement and are secured as mentioned above.
c) Finance lease liabilities
Finance lease liabilities are secured by the respective assets under lease. Refer note A.6.3.2

Annual Report 2018-19
Consolidated Financial Statements
All amounts in Euro’000, unless otherwise stated
108
d) Loan from related parties
Loans from related parties represents unsecured loan amounting to Euro 150 million obtained from Samvardhana Motherson Global Holdings Ltd., Cyprus (SMGHL), one of the company’s shareholders. The interest rate on the loan is 5.99% and it will mature on 19th July 2026.
Besides notes and term loans, secured loans from banks and others amount to k€ 166,662 (March 31, 2018 k€ 112,893). These borrowings are secured by pledge of various assets mainly comprising of inventories, trade receivables, cash and cash equivalents etc. of certain subsidiaries. Total unsecured borrowings as of March 31, 2019 were k€ 181,648 (March 31, 2018 : k€ 32,399). For contractual cash flows to bank and finance lease liabilities see note A.6.6.3. The Group has financial covenants requirements (see note A.6.6.3), which all have been met.
(ii) Fair value
Except for Notes, the fair values of other borrowings are not materially different to their carrying amounts, since the interest payable on those borrowings is either close to current borrowing rates or the borrowings are of a short-term nature. For Notes, fair values are as below –
March 31, 2019 March 31, 2018
Carrying amount Fair value Carrying amount Fair value
€ 100 million 98,473 92,504 98,260 103,975
US$ 400 million 354,685 357,356 322,322 328,178
€ 300 million 293,871 264,237 292,785 287,187
Fair values of the notes represent traded value on Irish Stock Exchange where these notes are listed and they are classified as below. Euro 100 million notes are held by a limited set of investors and are not very actively traded on the stock exchange, as a result the quoted prices may not reflect fair value under an active market and hence fall in Level 3 hierarchy.
As at March 31, 2019 Level 1 Level 2 Level 3
€ 100 million - - 92,504
US$ 400 million 357,356 - -
€ 300 million 264,237 - -
As at March 31, 2018 Level 1 Level 2 Level 3
€ 100 million - - 103,975
US$ 400 million 328,178 - -
€ 300 million 287,187 - -

Annual Report 2018-19
Consolidated Financial Statements
All amounts in Euro’000, unless otherwise stated
109
Net debt reconciliation This section sets out an analysis of net debt and the movements in net debt for each of the periods presented.
Note Year ended March 31, 2019
Year ended March 31, 2018
Cash and cash equivalents A.6.3.9 310,851 215,640
Borrowings – repayable within one year A.6.3.10 185,700 134,625
Borrowings – repayable after one year A.6.3.10 967,241 729,441
Net Debt
842,090 648,426
Cash and Cash equivalents
Finance leases
Other Borrowings
Total
Net Debt as at March 31, 2017 506,048 7,777 1,014,101 515,830
Cash flows (284,091) (2,934) (110,613) 170,544
Foreign exchange adjustments (6,317) (402) (56,090) (50,175)
Other non-cash movements - 966 11,261 12,227
Net Debt as at March 31, 2018 215,640 5,407 858,659 648,426
Cash flows 88,190 (2,744) 201,234 110,300
Acquired in business combination - - 43,889 43,889
Foreign exchange adjustments 7,021 65 43,640 36,684
Other non-cash movements - 788 2,003 2,791
Net Debt as at March 31, 2019 310,851 3,516 1,149,425 842,090
Other non-cash movements for finance leases represent finance lease liability recognised during the year in respect of new lease contracts. Other non-cash movements for other borrowings represent amortisation of issue costs related to Notes issued by the company.

Annual Report 2018-19
Consolidated Financial Statements
All amounts in Euro’000, unless otherwise stated
110
A.6.3.11 Employee benefit obligations Companies within the Group operate various pension schemes. The schemes are generally fully or partly funded through payments to insurance companies or trustee-administered funds. The Group has both defined benefit and defined contribution plans. Changes in the present value of the defined benefit pension obligations are analysed as follows:
March 31, 2019 March 31, 2018
As at beginning of the period 21,704 21,677
Acquired in Business combination 23,973 -
Current service cost 3,889 1,684
Interest expense 976 557
Benefits paid (2,062) (736)
Curtailment / settlement loss 122 -
Settlement benefit payment (734) -
Actuarial (gains) or losses 345 (159)
Foreign currency differences 843 (1,319)
Reclassifications 21 -
As at end of the period 49,077 21,704
March 31, 2019 March 31, 2018
Re-measurements:
–Return on plan assets, excluding amounts included in interest expense 107 134
–(Gain)/loss from change in demographic assumptions (59) 51
–(Gain)/loss from change in financial assumptions 974 (223)
–Experience (gains)/losses (570) 13
Total 452 (25)
The amounts recognised in the income statement are analysed as follows:
March 31, 2019 March 31, 2018
Recognised in the income statement
Current service cost 3,889 1,684
Running Costs 15 18
The effect of any curtailment of settlement 122 -
Net benefit expense 4,026 1,702
Other finance costs / Income
Interest income on scheme assets (465) (304)
Interest costs on scheme liabilities 976 557
Other finance costs (net) 511 253
The pension provisions correspond to each of the defined-benefit obligations at their present value. The expenses are reported under the item “Finance costs” (under “Interest expenses on defined benefit obligations”) and “Personnel expenses” (under “Pension costs from defined benefit plans”).

Annual Report 2018-19
Consolidated Financial Statements
All amounts in Euro’000, unless otherwise stated
111
The amounts taken to the Statement of Comprehensive Income are as follows: March 31, 2019 March 31, 2018
Actual return on plan assets 358 170
Expected return on plan assets (465) (304)
Actuarial gains and (losses) on plan assets (107) (134)
Actuarial gains and (losses) on defined benefit obligations (345) 159
Total (452) 25
Effects of the limitation of scheme assets - -
Actuarial gains and (losses) recognised in the consolidated Statement of Comprehensive Income
(452) 25
The assets and liabilities of the schemes are:
March 31, 2019 March 31, 2018
Scheme assets at fair value
Equities
- Quoted 561 -
- Unquoted 8,223 -
Bonds and gilts and others
- Quoted 10,514 8,116
- Unquoted 1,087 977
Fair value of scheme assets 20,385 9,093
Defined Benefit Obligation 49,077 21,704
Thereof funded 20,385 9,093
Thereof unfunded 28,692 12,611
Funding status - deficit / (surplus) 28,692 12,611
Current 33 -
Non-Current 28,659 12,611
Changes in the fair value of plan assets are analysed as follows:
March 31, 2019 March 31, 2018
As at beginning of the period 9,093 8,910 Acquired in Business combination 7,715 -
Return on plan assets 465 304
Contributions made by the Group 4,571 1,555
Benefits paid (1,328) (683)
Running Cost (15) (18)
Actuarial gains / (losses) on plan assets (107) (134)
Settlement benefit paid by Insurance Contract (551) -
Foreign currency differences 542 (841)
As at end of the period 20,385 9,093

Annual Report 2018-19
Consolidated Financial Statements
All amounts in Euro’000, unless otherwise stated
112
Pension provisions are calculated on the basis of assumptions. The most significant actuarial assumptions were as follows:
March 31, 2019 March 31, 2018 Actuarial assumptions
Rate of salary increases 2.00% - 8.00% 2.00% - 8.00% Rate of increase in pension 0% - 6% 1.50% - 2.00%
Mortality Table* - -
Discount rate 1.00% - 9.00% 1.70% - 7.90%
*Due to the use of different tables at different locations, this information is not disclosed.
The amounts recorded in the balance sheet as a provision for pensions are as follows: March 31, 2019 March 31, 2018
As at beginning of the period 12,611 12,767
Acquired in Business combination 16,258 -
Expense recorded in the period 4,538 1,955
Benefits paid (734) (53)
Contributions made by the Group (4,571) (1,555)
Amount recognised in Consolidated Statement of Comprehensive Income 451 (25)
Settlement (183) -
Foreign currency differences 302 (478)
Other (reclassification and net transfer out) 20 -
As at end of the period 28,692 12,611
Sensitivity Analysis The sensitivity of defined benefit obligation to changes in the weighted principal assumptions is :
Change in assumption Increase in assumption Decrease in assumption
March 31, 2019
March 31, 2018
March 31, 2019
March 31, 2018
March 31, 2019
March 31, 2018
Discount rate 0.50% 0.50% (2,645) (1,282) 2,858 1,375
Salary growth rate 0.50% 0.50% 2,128 896 (1,997) (860)
Pension growth rate 0.50% 0.50% 242 73 (207) (54)
Life expectancy 1 year 1 year 383 292 (383) (295)
Expected contributions to post-employment benefit plans for the year ending March 31, 2019 are k€ 1,192

Annual Report 2018-19
Consolidated Financial Statements
All amounts in Euro’000, unless otherwise stated
113
The above sensitivity analyses are based on a change in assumption while holding all the other assumptions constant. In practice, this is unlikely to occur, and change in some of the assumptions may be correlated. When calculating the sensitivity of the defined benefit obligation to significant actuarial assumptions the same method (present value of the defined benefit obligation calculated with the projected unit credit method at the end of the reporting period) has been applied as when calculating the defined benefit liability recognised in balance sheet. The method and type of assumptions used in preparing the sensitivity analysis did not change compared to the prior period. Defined contribution plans The group also contributes towards defined contribution plans which receive fixed contributions from group companies and employees. The group’s legal or constructive obligation for these plans is limited to the contributions. The expense recognised in the current period in relation to these contributions was k€ 27,655 (March 31, 2018: k€ 23,758). The expenses are included in income statement under Personnel expenses.
This space has been intentionally left blank

Annual Report 2018-19
Consolidated Financial Statements
All amounts in Euro’000, unless otherwise stated
114
A.6.3.12 Provisions Warranties Personnel
related Provision for contingencies
Total
At April 01, 2017 15,191 3,223 4,388 22,802
Arising during the year 7,306 172 408 7,886
Acquired in business combination - - - -
Utilised during the year (4,309) (720) (3,188) (8,217)
Reversal of unused amounts (238) (137) (70) (445)
Foreign currency differences (889) (165) (54) (1,108)
At March 31, 2018 17,061 2,373 1,484 20,918
-
Current 14,204 1,265 1,484 16,953
Non-current 2,857 1,108 - 3,965
17,061 2,373 1,484 20,918
At April 01, 2018 17,061 2,373 1,484 20,918
Arising during the year 3,021 2,832 9,312 15,165
Acquired in business combination 2,375 3,163 8,742 14,280
Utilised during the year (4,517) (933) (426) (5,876)
Reversal of unused amounts (970) (922) (5,813) (7,705)
Foreign currency differences 230 (51) 12 191
At March 31, 2019 17,200 6,462 13,311 36,973
Current 13,412 3,155 6,403 22,970
Non-current 3,788 3,307 6,908 14,003
17,200 6,462 13,311 36,973
Warranties
A provision is recognised for expected warranty claims on products previously, based on past experience of the level of repairs and returns. It is expected that most of these costs will be incurred in the next financial year. Assumptions used to calculate the provision for warranties were based on current sales levels and current information available about returns based on the warranty period for all products sold.
Personnel related
Personnel related provisions mostly comprise of restructuring and other severance costs.
Provision for contingencies
These are related to provision for litigations, site restoration expenses for removing the asset
and/or restoring the site and other miscellaneous items.

Annual Report 2018-19
Consolidated Financial Statements
All amounts in Euro’000, unless otherwise stated
115
A.6.3.13 Other liabilities March 31, 2019 March 31, 2018
Non-current
Accrued expenses 46,251 44,145
Deferred income 4,207 1,440
Liabilities towards employees 12,688 10,324
Interest accrue but not due on loan from related parties 2,385 -
Amounts payable to obtain contracts 4,459 1,800
Others 11,555 1,874
Total 81,545 59,583
Current
Advance received from customers (i) 6,028 5,323
Liabilities towards employees 110,846 77,727
Other tax liabilities (ii) 59,494 46,892
Social security 8,909 2,170
Deferred income 15,907 4,991
Accrued expenses 40,119 50,066
Interest accrued but not due on borrowings 11,255 10,997
Amounts payable to obtain contracts 46,662 20,598
Others 59,519 16,073
Total 358,739 234,837
(i) Advance received from customers fall under the definition of contract liabilities as per IFRS 15. (ii) Other tax liabilities mainly represent liability for VAT and other similar taxes in the ordinary
course of business.
This space has been intentionally left blank

Annual Report 2018-19
Consolidated Financial Statements
All amounts in Euro’000, unless otherwise stated
116
A.6.3.14 Shareholder’s equity
Share Capital The authorised share capital of the Company amounts to € 90,000, divided into 90,000 shares with a nominal value of € 1 each. The issued and paid in capital amounts to € 66,176, divided into 66,176 shares with a nominal value of € 1 each held by Samvardhana Motherson Global Holdings Limited (45,676 shares) and Samvardhana Motherson Polymers Limited (20,500 shares).
Number of equity shares (in No.s)
Share Capital (in €)
As at April 01, 2017 66,176 66,176
Add: Issued during the year - -
As at March 31, 2018 66,176 66,176
Add: Issued during the year - -
As at March 31, 2019 66,176 66,176
Share premium On June 13, 2014 The Group issued 45,676 shares of € 1 each to Samvardhana Motherson Group Holdings Limited, Cyprus in lieu of acquisition of 98.45% interest in Samvardhana Motherson Reflectec Group Holdings Limited, Jersey for a non-cash consideration of k€ 905,716 consisting of k€ 46 towards share capital and transfer of k€ 12,250 loan from MSSL Mideast (FZE), the remaining amount of k€ 893,420 was recognised as share premium. The Group also received share premium contributions amounting to k€7,490 in the earlier years from its shareholders. Currency translation reserve Currency translation reserve comprises of all foreign exchange differences arising on the translation of the results and financial position of subsidiaries whose functional currencies differ from the Group’s reporting currency. Retained earnings Retained earnings comprises accumulated profits/ (losses) of the Group and also include actuarial gains / losses arising on post-employment defined benefit plans and related tax impacts. Merger reserve The merger reserve represents the differences on consolidation arising on the adoption of predecessor accounting. On June 13, 2014, SMRP BV acquired 98.45% shareholding of Samvardhana Motherson Reflectec Group Holdings Limited (SMR Group) from Samvardhana Motherson Group Holdings Limited (SMGHL), Cyprus in share exchange deal wherein SMGHL transferred its entire shareholding to SMRP BV in exchange of 45,676 shares of a nominal value of € 1 each issued by SMRP BV and consequently SMRP BV has become subsidiary of SMGHL. Shareholders of SMRP BV approved allotment of shares to SMGHL in their meeting dated June 13, 2014. Prior to June 13, 2014, SMRP BV and SMR Group were jointly controlled by Motherson Sumi Systems Limited (MSSL India) and Samvardhana Motherson International Limited (SAMIL India) and after this transaction SMRP BV Group comprising SMR Group continue to be jointly controlled by MSSL India and SAMIL India. As this transaction is done under “common control” as defined by IFRS, the activities of SMR Group were included in the consolidated accounts for the year ended March 31, 2015 using the

Annual Report 2018-19
Consolidated Financial Statements
All amounts in Euro’000, unless otherwise stated
117
predecessor accounting method. This accounting treatment leads to differences on consolidation between consideration and fair value of the underlying net assets and this difference is included within equity as a merger reserve. Other reserves The following table shows a breakdown ‘other reserves’ and the movements in these reserves during the year. A description of the nature and purpose of each reserve is provided below the table.
Cash flow hedges
AfS financial assets
Financial assets at
FVOCI
Total other reserves
As at April 01, 2017 (A) (2,658) - - (2,658)
Revaluation – gross (29,250) (370) - (29,620)
Reclassification to profit or loss – gross 25,537 - - 25,537
Deferred hedging gains and losses transferred to the carrying value of property, plant & equipment purchased during the year
118 - - 118
Others 131 - - 131
Other comprehensive income for the year (B) (3,464) (370) - (3,834)
Non-Controlling Interest (C) 10 (6) - 4
As at March 31, 2018 (D=A+B-C) (6,132) (364) - (6,496)
Cash flow hedges
AfS financial assets
Financial assets at
FVOCI
Total other reserves
As at March 31, 2018 (6,132) (364) - (6,496)
Reclassification on IFRS 9 adoption - 364 (364) -
Revaluation – gross 31,881 - (198) 31,683
Reclassification to profit or loss – gross (25,685) - - (25,685)
Deferred hedging gains and losses transferred to the carrying value of property, plant & equipment purchased during the year
- - -
-
Others - - - -
Other comprehensive income for the year (E) 64 - (562) (498)
Non-Controlling Interest (F) 23 - - 23
As at March 31, 2019 (G=D+E-F) 41 - (562) (521)
Available-for-sale financial assets Changes in the fair value of investments that were classified as available-for-sale financial assets (e.g. equities), were recognised in other comprehensive income and accumulated in a separate reserve within equity. Amounts were reclassified to profit or loss when the associated assets were sold or impaired. Financial assets at FVOCI Upon transition to IFRS 9, the Group has elected to irrevocably classify its non-listed equity
investments as Fair Value through Other Comprehensive Income (FVOCI) which were earlier
classified as available-for-sale. Gains and losses on these financial assets are never recycled to
profit or loss. Dividends are recognised as other income in the income statement when the right of
payment has been established, except when the Group benefits from such proceeds as a recovery

Annual Report 2018-19
Consolidated Financial Statements
All amounts in Euro’000, unless otherwise stated
118
of part of the cost of the financial asset, in which case, such gains are recorded in OCI. Equity
instruments designated at fair value through OCI are not subject to impairment assessment
Cash flow hedges The Group uses two types of hedging instruments as part of its foreign currency risk associated with highly probable foreign currency forecast transaction and foreign currency borrowings. These include foreign currency forward contracts for highly probable forecast transactions and cross currency interest rate swap for borrowings. The hedging reserve is used to record gains or losses on such hedging instruments that are designated and qualify as cash flow hedges and that are recognised in other comprehensive income. The Group designates both spot and forward component of foreign currency forward contract as hedge relationship. Amounts associated with foreign currency forward contracts are reclassified to income statement when the associated hedged transaction affects income statement or added to the initial cost of the related balance sheet item if it results in recognition of a non-financial item. The foreign exchange gain or loss on the portion of borrowings hedged by swaps is reclassified from cash flow hedge reserve to income statement and recognised within ‘finance cost’. Amounts reclassified from cash flow hedge reserve to income statement during the year relates to hedged items that has affected income statement.

Annual Report 2018-19
Consolidated Financial Statements
All amounts in Euro’000, unless otherwise stated
119
A.6.3.15 Investment in subsidiaries All subsidiary undertakings are included in the consolidation. The proportion of the voting rights in the subsidiary undertakings held directly by the parent company do not differ from the proportion of ordinary shares held, except as disclosed. The parent company does not have any shareholdings in the preference shares, if any, of subsidiary undertakings included in the group. The following subsidiaries of the Group have non-controlling interests:
Entity name Country Capital share a)
Minority shares
Voting rights a)
Samvardhana Motherson Reflectec Group Holdings Limited
Jersey 98.45% 1.55% 98.45%
SMR Automotive Systems India Limited (held by SMR Cyprus) SMR India
India 51% 49% 51%
SMR Grundbesitz GmbH & Co KG (held by SMR Holding Deutschland)
Germany 93.07% 6.93% 93.07%
SMP Deutschland GmbH (held by SMP GmbH) Germany 94.80% 5.20% 94.80%
Changchun Peguform Automotive Plastics Technology Ltd. (held by SMP Deutschland) CPAT
China 50% 50% 50%+1b)
Foshan Peguform Automotive Plastics Technology Co. Ltd. (held by CPAT) FPAT
China 100% - 100%
Shenyang SMP Automotive Plastic Components Co. Ltd. (held by CPAT) w.e.f. 22 August 2017
China 100% - 100%
Tianjin SMP Automotive Components Co. Ltd. (held by CPAT) w.e.f. 06 March 2018
China 100% - 100%
SM Real Estate GmbH (held by SMP AE) Germany 94.80% 5.20% 94.80%
Celulosa Fabril (Cefa) S.A. (held by SMP Iberica)CEFA c)
Spain 50% 50% 50% d)
Modulos Ribera Alto S.LU. (held by CEFA) MRA Spain 100% - 100%
Yujin-SMRC Automotive Modules Corp. (held by SMRC H BV) [SMRC Korea]
S. Korea 50.9% 49.1% 50.9%
Motherson Ossia Innovations LLC (held by MI LLC) USA 50% 50% 50% a) Capital shares mentioned above represent shareholding by the immediate parent of the entity and does not represent effective
shareholding by the Group. b) SMP Deutschland GmbH has 50% of the voting rights plus one additional vote.
c) Subsidiary relation since 20 December 2016 d) Represents shareholder voting rights however majority control over the board of directors

Annual Report 2018-19
Consolidated Financial Statements
All amounts in Euro’000, unless otherwise stated
120
Transactions with non-controlling interests
• There were other adjustments for the year ended March 31, 2019 Nil (March 31, 2018: k€ 125) due to change in reserves of CPAT for statutory reporting.
Summarised financial information on subsidiaries with material non-controlling interests The non-controlling interest in respect of SMR Automotive Systems India Limited (SMR India), Celulosa Fabril (Cefa) S.A., Modulos Ribera Alto S.LU., Changchun Peguform Automotive Plastics Technology Ltd. (CPAT) and Foshan Peguform Automotive Plastics Technology Co. Ltd. (FPAT) is only considered to be material. Set out below are the summarised financial information for each subsidiary that has non-controlling interests that are material to the group.

Annual Report 2018-19
Consolidated Financial Statements
All amounts in Euro’000, unless otherwise stated
121
Summarised balance sheet and income statement
March 31, 2019 March 31, 2018
CEFA MRA CPAT FPAT SMR India
SMRC Korea
CEFA MRA CPAT FPAT SMR India
Balance Sheet
Non-current assets 25,366 26,840 58,843 12,733 32,292 1,519 22,972 14,145 35,792 6,310 18,299
Current assets 38,478 33,714 133,034 19,100 24,864 30,565 44,479 24,808 120,705 7,941 23,740
Gross assets 63,844 60,554 191,877 31,833 57,156 32,084 67,451 38,953 156,497 14,251 42,039
Current liabilities 17,858 27,400 85,213 28,250 21,874 24,099 32,169 11,962 59,848 11,564 13,584
Non-current liabilities 8,275 22 - - 1,710 955 7,427 105 - - 1,124
Gross liabilities 26,133 27,422 85,213 28,250 23,584 25,054 39,596 12,067 59,848 11,564 14,708
Net assets 37,711 33,132 106,664 3,583 33,572 7,030 27,855 26,886 96,649 2,687 27,331
Results
Revenue 69,734 45,761 236,018 22,634 75,555 75,418 91,651 43,641 218,654 8,715 76,714
Expense (60,665) (39,514) (202,806) (21,835) (69,782) (74,676) (81,974) (38,500) (181,513) (8,661) (69,882)
Profit for the period 9,069 6,247 33,212 799 5,773 742 9,677 5,141 37,141 54 6,832
Other Comprehensive Income - - - - (22) 855 - - - - -
Total Comprehensive Income 9,069 6,247 33,212 799 5,751 1,597 9,677 5,141 37,141 54 6,832
Dividends paid to non-controlling interest (2,500) - (13,034) - (642) (875)
- - - - (562)
Profit for the year attributable to non-controlling interest 4,535 3,124 16,606 400 2,807 107
4,838 2,571 18,570 27 3,623
Accumulated non-controlling interest 28,674 a) 5,241 a) 54,521 87 15,262 13,833 27,222 a) 2,538 a) 49,526 (360) 12,511
a) Includes the impact of purchase price allocation

Annual Report 2018-19
Consolidated Financial Statements
All amounts in Euro’000, unless otherwise stated
122
Summarised cash flows March 31, 2019 March 31, 2018
CEFA MRA CPAT FPAT SMR India
SMRC Korea
CEFA MRA CPAT FPAT SMR India
Cash flows from Operating Activities
Cash generated from operations 13,449 (840) 8,722 8,139 11,985 5,846 20,658 11,313 47,901 1,185 14,061
Interest paid 606 40 274 3 192 - 963 238 222 (2) 47
Income tax paid (3,011) (2,302) (4,872) (295) (3,129) (1,278) (2,715) (1,772) (5,496) - (4,116)
Net cash generated from operating activities
11,044 (3,102) 4,124 7,847 9,048 4,568 18,906 9,779 42,627 1,183 9,992
Net cash used in investing activities
(1,301) (15,137) (12,955) (5,716) (15,172) (2,126) (1,490) (3,963) (6,637) (948) (6,349)
Net cash used in financing activities
(27,738) 18,239 (17,318) - 3,228 (866) (4,508) (5,817) (30,450) - (1,195)
Net (decrease)/increase in cash and cash equivalents
(17,995) - (26,149) 2,131 (2,896) 1,576 12,908 (1) 5,539 234 2,449
Cash, cash equivalents and bank overdrafts at beginning of year
21,911 14 31,230 360 3,347 5,650 9,003 15 25,690 126 1,214
Exchange gains/(losses) on cash and cash equivalents
- - 135 66 108 248 - - - - (316)
Cash and cash equivalents at end of year
3,916 14 5,216 2,557 559 7,474 21,911 14 31,230 361 3,346
The information above is the amount before inter-company eliminations.

Annual Report 2018-19
Consolidated Financial Statements
All amounts in Euro’000, unless otherwise stated
123
A.6.4 Disclosures regarding the Consolidated Income Statement
A.6.4.1 Revenue
The Group derives following revenue from its contracts with customers :
Year ended
March 31, 2019 Year ended
March 31, 2018
Sale of components 4,642,524 4,417,390
Tool Development 642,913 607,038
Assembly of components 26,709 -
Total 5,312,146 5,024,428
The transaction price allocated to the remaining performance obligations related to tool development (unsatisfied or partially unsatisfied) are, as follows:
Year ended March 31, 2019
Within one year 386,704
More than one year 220,324
Total 607,028
As permitted under the transitional provisions in IFRS 15, the transaction price allocated to (partially) unsatisfied performance obligations as of March 31, 2018 is not disclosed. Table below provides information on revenue recognised from :
Year ended March 31, 2019
Amounts included in contract liabilities at the beginning of the year 3,133
Performance obligations partly satisfied in previous years 530,316
A.6.4.2 Changes in inventories
Year ended March 31, 2019
Year ended March 31, 2018
Opening stock of
finished goods (41,123) 39,919
work-in-progress (28,914) 27,619
Acquired in business combination (11,118) -
exchange differences (465) (2,294)
Closing stock of
finished goods 50,903 41,123
work-in-progress 36,983 28,914
exchange differences (337) 20
Increase/(Decrease) in inventories 5,929 4,813

Annual Report 2018-19
Consolidated Financial Statements
All amounts in Euro’000, unless otherwise stated
124
A.6.4.3 Other operating income
Year ended March 31, 2019
Year ended March 31, 2018
Subsidies /Income recognized from grants received 4,431 6,838
Other recoveries from customers 2,268 6,764
Rental income 1,119 841
Royalty income 2,067 3,069
Gain from the sale of property, plant and equipment and Intangible assets 1,394 147
Provisions written back/Gain on reversal of bad debt allowance 1,396 1,273
Gain on bargain purchase 12,178 -
Other Income 27,022 21,330
Total 51,875 40,262
A.6.4.4 Personnel expenses
Year ended March 31, 2019
Year ended March 31, 2018
Wages and salaries 818,307 663,002
Paid labour rendered by third parties 207,445 182,256
Social security costs 174,918 128,323
Pensions costs from defined benefit plans 3,904 1,702
1,204,574 975,283
A.6.4.5 Depreciation and amortization
Year ended March 31, 2019
Year ended March 31, 2018
Depreciation and impairment of property, plant and equipment 154,118 113,753
Depreciation on investment properties 325 325
Amortisation of intangible assets 13,866 8,751
Total 168,309 122,829
A.6.4.6 Other operating expenses
Year ended March 31, 2019
Year ended March 31, 2018
General administration expenses 214,045 165,615
Energy 87,964 72,816
Repairs and maintenance 110,549 98,247
Rent and lease 64,695 52,474
Freight and forwarding 68,609 48,784
Bad debts/advances written off 702 2,826
Auditors remuneration 6,146 7,143
Net foreign exchange loss 1,914 1,510
Legal and professional expenses 61,728 45,894
Total 616,352 495,309

Annual Report 2018-19
Consolidated Financial Statements
All amounts in Euro’000, unless otherwise stated
125
During the year ended March 31, 2019 and March 31, 2018, following amounts were recorded in respect of fee paid to auditor for various services:
March 31, 2019 Ernst & Young Accountants LLP
Other EY Network
Total EY Network
Other audit firm
Total
Audit of the financial statements
115 2,651 2,766 411 3,177
Other audit services - 125 125 200 325
Tax services - 129 129 1,000 1,129
Other non-audit services
- 84 84 607 691
Total 115 2,989 3,104 2,219 5,322
March 31, 2018 Ernst & Young Accountants LLP
Other EY Network
Total EY Network
Other audit firm
Total
Audit of the financial statements
84 2,010 2,094 1,025 3,119
Other audit services - 75 75 1,480 1,555
Tax services - 361 361 619 980
Other non-audit services
- 225 225 1,071 1,296
Total 84 2,671 2,755 4,195 6,950
The fees listed above relate to the procedures applied to the Company and its consolidated group entities by accounting firms and external auditors forming part of Ernst & Young network; as referred to in Section 1, subsection 1 of the Audit Firms Supervision Act (‘Wet toezicht accountantsorganisaties - Wta’) and audit firms other than those forming part of EY network.

Annual Report 2018-19
Consolidated Financial Statements
All amounts in Euro’000, unless otherwise stated
126
A.6.4.7 Finance income and costs
Year ended March 31, 2019
Year ended March 31, 2018
Interest Income
2,939 2,286 Net exchange losses on foreign currency borrowings 7,287 - Finance income
10,226 2,286 Interest expenses finance leases
102 260 Interest expense on borrowings
47,714 57,541 Interest expense on defined benefit obligations 512 557 Net exchange losses on foreign currency borrowings - 3,427 Finance costs 48,328 61,785
Foreign exchange loss contains amounts from the revaluation of foreign currency financial liabilities. On July 06, 2017 the Company issued € 300 million 1.8% Senior Secured Notes due 2024. The proceeds from these notes together with the cash available were utilised to prepay outstanding € 500 million 4.125% Senior Secured Notes due 2021. Accordingly, redemption premium and unamortised transaction costs amounting to k€ 21,153 were charged to the income statement for the year ended March 31, 2018 and recorded as interest expense on borrowings.
A.6.4.8 Share of net profit of associates and joint ventures accounted for using the equity method
Year ended March 31, 2019
Year ended March 31, 2018
Joint ventures 7,047 13,125
Associates 29 (42)
Total 7,076 13,083
Section A.6.3.5 contains further details related to the participation in joint ventures.

Annual Report 2018-19
Consolidated Financial Statements
All amounts in Euro’000, unless otherwise stated
127
A.6.5 Income taxes
Deferred income taxes are calculated using the balance-sheet based liability method. Deferred tax assets and liabilities are recognised for all temporary differences between the carrying amount of an asset or liability and the values used for taxation purposes. Deferred tax assets are also recognised for tax-loss carry forwards to the extent it is probable that future taxable profits will be available. For this reason, the recognition of all deferred tax assets based on tax losses is carried out with suitable consideration given to their realisation. Deferred taxes are determined on the basis of tax rates that have been enacted or substantially enacted by the end of the reporting period.
The income tax credit/expense for the year comprises the following:
Year ended March 31, 2019
Year ended March 31, 2018
Current tax on profits for the year 73,476 67,118 Adjustments for current tax of prior periods 4,270 1,218 Current tax expense 77,746 68,336
Development and reversal of temporary differences (14,168) 616 Prior year adjustments (443) 1,925 Effect of reported tax losses (17,235) (205) Others (917) (52) Deferred tax expense/(credit) (32,763) 2,284
Income tax expense 44,983 70,620
There is no significant change in corporate tax rates, in jurisdictions where group operates, having material impact on current charge and future adjustment to the carrying amounts of assets and liabilities.
This statement enables the expected tax expense to be reconciled with the effective tax expense reported.

Annual Report 2018-19
Consolidated Financial Statements
All amounts in Euro’000, unless otherwise stated
128
Reconciliation of the effective tax rate Year ended March 31, 2019
Year ended March 31, 2018
Earnings before income tax 147,662 208,985
Tax at rate of 25%a) 36,916 52,247
Difference in overseas tax rates 9,376 4,601
Tax effect of losses on which deferred tax assets not recognised 12,313 16,925
Utilisation of previously unrecognised tax losses (7,959) (14,556)
Adjustments for current and deferred tax of prior periods 3,828 3,143
Tax effect of amounts which are not deductible in calculating taxable income
(3,768) 12,658
Withholding taxes 1,794 2,918
Tax impact of US tax reforms (5,050) (1,741)
Effect of tax credits (3,522) (3,463)
Sundry items 1,055 (2,112)
Income tax expense 44,983 70,620
a) Tax rate is the general corporate tax rate applicable in the Netherlands, the country of domicile of SMRP BV and does not
consider the change in tax rate due to level of taxable income Tax is calculated at domestic tax rates applicable in the respective countries. The weighted average applicable tax rate was 31% for the year ended March 31, 2019 (March 31, 2018: 34%). The movement in weighted average tax rate is mainly on account of variation in profitability of the Group’s subsidiaries in the respective countries. There have been no significant changes in tax rates applicable to the Group’s subsidiaries during the year. Capitalised deferred tax assets and deferred tax liabilities have been allocated to individual items as per the following table:
Deferred tax assets Year ended March 31, 2019
Year ended March 31, 2018
Provisions 3,717 10,376
Property, plant and equipment 10,455 (3,469)
Receivable / Accruals 4,257 8,521
Inventories 1,065 1,955
Tax Value of Reported Loss carry forwards 28,257 23,992
Others 5,641 184
Total 53,392 41,559
Deferred tax liabilities Year ended March 31, 2019
Year ended March 31, 2018
Intangible assets 5,939 4,370
Property, plant and equipment (Including Finance Lease Liability) 43,600 40,057
Government grants 2,572 1,303
Pension (2,547) (2,003)
Others 8,752 13,935
Total 58,316 57,662

Annual Report 2018-19
Consolidated Financial Statements
All amounts in Euro’000, unless otherwise stated
129
The analysis of deferred tax assets and deferred tax liabilities is as follows:
Year ended March 31, 2019
Year ended March 31, 2018
Deferred tax assets:
- Deferred tax assets to be recovered after 12 months 37,517 23,834 - Deferred tax assets to be recovered within 12 months 15,875 17,725 53,392 41,559 Deferred tax liabilities:
- Deferred tax liabilities to be settled after 12 months 29,935 45,867 - Deferred tax liabilities to be settled within 12 months 28,381 11,795
58,316 57,662 Unrecognised temporary differences Temporary difference relating to investments in subsidiaries for which deferred tax liabilities have not been recognised:
Year ended March 31, 2019
Year ended March 31, 2018
Foreign currency translation 8,905 (14,359)
Undistributed earnings 675,189 449,895
Temporary differences of k€ (14,359) (March 31, 2018 : k€ 26,796) have arisen as a result of the translation of the financial statements of the group’s subsidiary in USA, Mexico, China, Brazil, South Korea, India, Australia and Thailand. However, a deferred tax liability has not been recognised as the liability will only crystallise in the event of disposal of the subsidiary, and no such disposal is expected in the foreseeable future. The Group has undistributed earnings of k€ 675,189 (March 31, 2018 k€ 449,895) which, if paid out as dividends, would be not be subject to tax in the hands of the recipient and hence no assessable temporary difference exists. Deferred income tax assets are recognised for tax loss carry-forwards to the extent that the realisation of the related tax benefit through future taxable profits is probable. The group did not recognise deferred income tax assets in respect of losses amounting to k€ 442,898 (March 31, 2018: k€ 330,383) that can be carried forward against future taxable income. These losses can be carried-forward as below –
Year of expiry Amount Year of expiry Amount
next 1 year 5,719 next 9 years -
next 2 years 5,207 next 10 years -
next 3 years 5,568 next 11 years -
next 4 years 14,103 next 12 years -
next 5 years 32,768 next 13 years -
next 6 years 175 next 14 years -
next 7 years - next 15 or more years 302,385
next 8 years - No expiry 67,837
Not usable 8,194
The movement in deferred income tax assets and liabilities during the year, is as follows:

Annual Report 2018-19
Consolidated Financial Statements
All amounts in Euro’000, unless otherwise stated
130
As at April 01,
2018 Charged/(credited) to the income
statement
Charged/(credited) to other
comprehensive income
Acquired in business
combination
Reclassification* Exchange differences
As at March 31, 2019
Deferred tax assets
Provisions 10,376 (1,756) (43) 435 (5,802) 507 3,717
Property, plant and equipment (3,469) 4,356 - 2,446 7,612 (404) 10,541
Receivable / Accruals 8,521 1,257 - - (5,688) 167 4,257
Inventories 1,955 (104) - (23) (823) 60 1,065
Assets under finance lease - - - - (86) - (86)
Tax Value of Reported Loss carryforwards
23,992 17,235 - 2,217 (15,233) 46 28,257
Others 184 1,561 80 1,052 1,447 1,317 5,641
Total deferred tax assets 41,559 22,549 37 6,127 (18,573) 1,693 53,392
Deferred tax liabilities
Intangible assets 4,370 (1,875) - 3,338 106 - 5,939
Property, plant and equipment (Including finance lease liability)
40,057 (10,915) - 6,522 7,285 651 43,600
Government grants 1,303 537 - - 692 40 2,572
Pension (2,003) (135) - - (396) (13) (2,547)
Others 13,935 2,174 129 5,661 (14,458) 1,311 8,752
Total deferred tax liabilities 57,662 (10,214) 129 15,521 (6,771) 1,989 58,316 * Reclassifications generally represents netting off between deferred tax assets and liabilities in respective jurisdictions, transfers out of deferred tax pursuant to change in tax positions in filed tax returns

Annual Report 2018-19
Consolidated Financial Statements
All amounts in Euro’000, unless otherwise stated
131
As at April 01,
2017 Charged/(credit
ed) to the income
statement
Charged/(credited) to other
comprehensive income
Reclassification Exchange differences
As at March 31, 2018
Deferred tax assets
Provisions 3,690 7,682 - (490) (506) 10,376
Property, plant and equipment 4,203 (1,438) - (6,545) 311 (3,469)
Receivable / Accruals 8,499 943 - (614) (307) 8,521
Inventories 1,101 (44) - 1,139 (241) 1,955
Tax Value of Reported Loss carryforwards
22,029 (1,075) - 5,657 (2,619) 23,992
Others (26) (2,263) 8 2,600 (135) 184
Total deferred tax assets 39,496 3,805 8 1,747 (3,497) 41,559
Deferred tax liabilities
Intangible assets 6,802 (2,432) - - - 4,370
Property, plant and equipment (Including Finance Lease Liability)
46,599 (2,764) - (2,187) (1,591) 40,057
Government grants 3,861 (2,209) - - (349) 1,303
Pension - (153) - (1,850) - (2,003)
Others (5,465) 13,647 - 5,784 (31) 13,935
Total deferred tax liabilities 51,797 6,089 - 1,747 (1,971) 57,662

Annual Report 2018-19
Consolidated Financial Statements
All amounts in Euro’000, unless otherwise stated
132
A.6.6 Other disclosures
A.6.6.1 Financial instruments
The following table shows the carrying amounts of the Group’s financial instruments
Financial instruments March 31, 2019 March 31, 2018
FINANCIAL ASSETS
Financial assets at amortised cost
Trade receivables 610,193 476,555
Other receivables 513,516 535,796
Cash and cash equivalents 310,851 215,640
Financial assets at fair value through other comprehensive income
Other investments 27,558 -
Available for sale financial assets
Other investments 27,698
Derivative financial instruments
Used for hedging 6,821 1,984
Held for trading at fair value through Profit and Loss 168 64
FINANCIAL LIABILITIES
Liabilities at amortised cost
Borrowings - -
Notes 747,029 713,367
Liabilities to banks and others 252,396 145,292
Loan from related parties 150,000 -
Finance lease liabilities 3,516 5,407
Trade payables 1,049,504 828,603
Liabilities to joint ventures and related parties 27,239 27,579
Other liabilities 344,212 294,420
Derivative financial instruments
Used for hedging 5,562 28,065
Held for trading at fair value through Profit and Loss - 88
Due to the short-term nature of cash and cash equivalents and the short-term maturities of trade receivables and liabilities and other current receivables and liabilities, their fair values are equal to their carrying amounts.
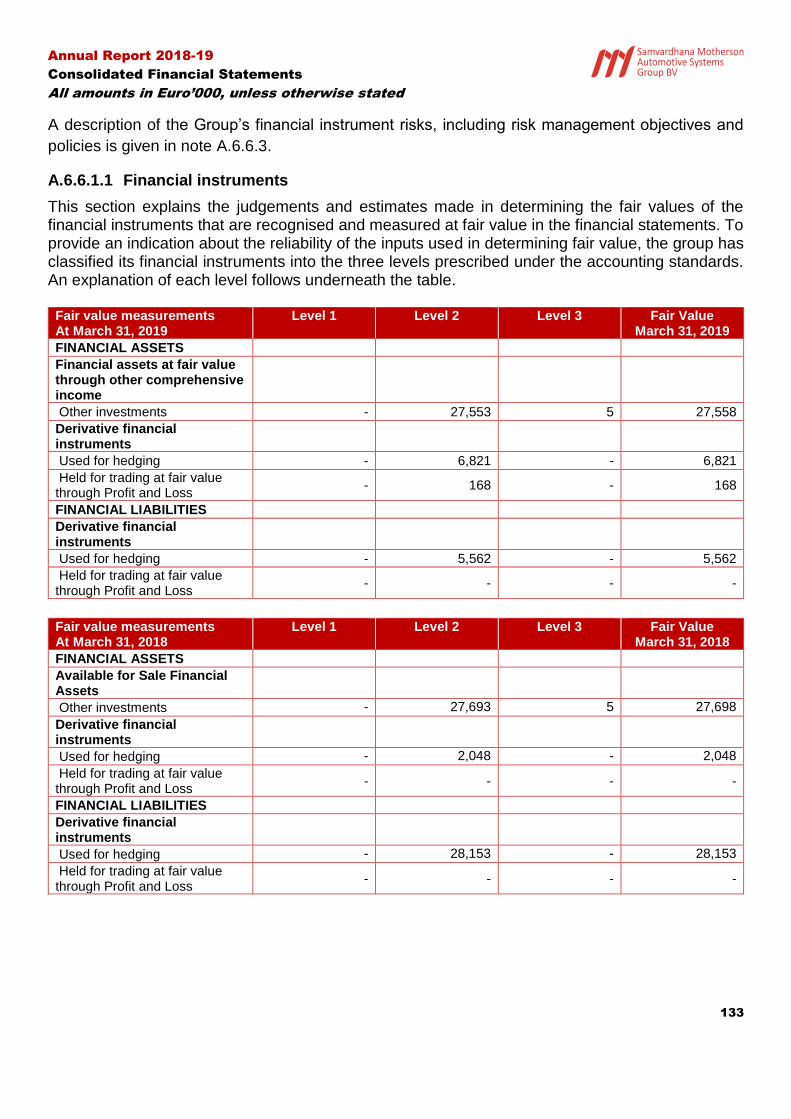
Annual Report 2018-19
Consolidated Financial Statements
All amounts in Euro’000, unless otherwise stated
133
A description of the Group’s financial instrument risks, including risk management objectives and
policies is given in note A.6.6.3.
A.6.6.1.1 Financial instruments
This section explains the judgements and estimates made in determining the fair values of the financial instruments that are recognised and measured at fair value in the financial statements. To provide an indication about the reliability of the inputs used in determining fair value, the group has classified its financial instruments into the three levels prescribed under the accounting standards. An explanation of each level follows underneath the table.
Fair value measurements At March 31, 2019
Level 1 Level 2 Level 3 Fair Value March 31, 2019
FINANCIAL ASSETS
Financial assets at fair value through other comprehensive income
Other investments - 27,553 5 27,558
Derivative financial instruments
Used for hedging - 6,821 - 6,821
Held for trading at fair value through Profit and Loss
- 168 - 168
FINANCIAL LIABILITIES
Derivative financial instruments
Used for hedging - 5,562 - 5,562
Held for trading at fair value through Profit and Loss
- - - -
Fair value measurements At March 31, 2018
Level 1 Level 2 Level 3 Fair Value March 31, 2018
FINANCIAL ASSETS
Available for Sale Financial Assets
Other investments - 27,693 5 27,698
Derivative financial instruments
Used for hedging - 2,048 - 2,048
Held for trading at fair value through Profit and Loss
- - - -
FINANCIAL LIABILITIES
Derivative financial instruments
Used for hedging - 28,153 - 28,153
Held for trading at fair value through Profit and Loss
- - - -
Annual Report 2018-19
Consolidated Financial Statements
All amounts in Euro’000, unless otherwise stated
134
Fair value hierarchy
(a) Financial instruments in Level 1
The fair value of financial instruments traded in active markets is based on quoted market prices at the balance sheet date. A market is regarded as active if quoted prices are readily and regularly available from an exchange, dealer, broker, industry group, pricing service, or regulatory agency, and those prices represent actual and regularly occurring market transactions on an arm’s length basis. The quoted market price used for financial assets held by the group is the current bid price. These instruments are included in Level 1. Instruments included in Level 1 comprise of equity instruments classified as available for sale. Quoted market prices are used to value Level 1 instruments.
(b) Financial instruments in Level 2
The fair value of financial instruments that are not traded in an active market (for example, over-the-counter derivatives) is determined by using valuation techniques. These valuation techniques maximise the use of observable market data where it is available and rely as little as possible on entity specific estimates. If all significant inputs required to fair value an instrument are observable, the instrument is included in level 2. Entity’s Level 2 instruments comprise of forward contracts relating to foreign currency and commodities, cross-currency interest rate swaps and equity instruments. The fair value of forward foreign contracts is determined using forward exchange rates at the balance sheet date. The fair value of interest rate swaps is calculated as the present value of the estimated future cash flows based on observable yield curves. The fair value of equity instruments is calculated using recent trading activity for similar instrument. (c) Financial instruments in Level 3
If one or more of the significant inputs is not based on observable market data, the instrument is included in level 3. Group’s Level 3 instruments represent investment in unlisted equity instruments and are valued using discounted cash flow analysis.

Annual Report 2018-19
Consolidated Financial Statements
All amounts in Euro’000, unless otherwise stated
135
A.6.6.1.2 Offsetting Financial Assets and Financial Liabilities:
The following table present the Group’s financial assets and liabilities that are subject to offsetting, enforceable master netting arrangements and similar agreements:
Trade receivables Gross amounts of recognised
financial assets
Gross amounts of recognised financial
liabilities set off in the Balance sheet
Net amounts of financial assets presented in the balance sheet
March 31, 2019 629,838 19,645 610,193
March 31, 2018 491,763 15,208 476,555
Unbilled receivables* Gross amounts of recognised
financial assets
Gross amounts of recognised financial
liabilities set off in the Balance sheet
Net amounts of financial assets presented in the balance sheet
March 31, 2019 628,538 157,683 470,855
March 31, 2018 478,172 84,572 393,600
*grouped under other receivables
A.6.6.2 Contingent Liabilities
In the ordinary course of business activities, the Group may be contingently liable for litigation and claims with customers, suppliers, former employees and other parties. In addition, the Group may be, or could become, liable to incur environmental remediation costs to bring environmental contamination levels back within acceptable legal limits. On an on-going basis, the Group assesses the likelihood of any adverse judgments or outcomes to these matters as well as potential ranges of probable costs and losses. A determination of the provision required, if any, for these contingencies is made after analysis of each individual issue. The required provision may change in the future due to new developments in each matter or changes in approach such as a change in settlement strategy in dealing with these matters. The tax position taken by the Group with respect to certain transactions and calculations may be challenged by tax authorities for reasons including transfer pricing, the availability of deductions for interest expense and other deductible items, the treatment of acquisition, refinancing and reorganization transactions, intercompany funding arrangements, the application and effect of tax “holidays” and the calculation of deferred tax assets and liabilities. The Group does not expect any significant cash outflow in respect of these contingencies. As at the year end, the Group has following contingent liabilities:
As at March 31, 2019 As at March 31, 2018
Indirect tax matters 9 95
Direct tax matters 709 1,472
Others (refer note below) 26,778 16,041
Total 27,496 17,608
The Group has acted as surety in respect of subsidy received by one of its subsidiary, which limits
the total liability of the Group to 1.2x of the amount of subsidy granted. As per the conditions of
subsidy received from the local government the subsidiary is required to incur certain level of capital

Annual Report 2018-19
Consolidated Financial Statements
All amounts in Euro’000, unless otherwise stated
136
expenditure along with maintaining the headcount at certain level for a period of 5 years. As of March
31, 2019, both the conditions have been fulfilled however headcount level needs to be sustained for
5 years therefore the Group may be contingently liable for k€ 26,778 (March 31, 2018: k€ 16,041)
in the event of non-compliance of subsidy conditions by the subsidiary in the future.
Capital expenditure commitments
The group has outstanding capital expenditure commitments which represents outstanding amount
of contracts for capital expenditure against which work is yet to be executed by the contractor or
supplies to be received. Capital expenditure contracted for at the end of the year but not yet incurred
is as follows:
As at March 31, 2019 As at March 31, 2018
Property, plant and equipment (net of advances) 66,306 73,410
A.6.6.3 Risk management with respect to financial risks
The Group in its capacity as an internationally active supplier for the automobile industry is exposed to various risks with each of its business segments and products. The global presence and decentralised management structure with the main activities in the plants make an organised risk management system necessary. The regulations, instructions, implementation rules and, in particular, the regular communication throughout the tightly controlled management process consisting of planning, controlling and monitoring collectively form the risk management system used to define, record and minimise operating, financial and strategic risks. The successful management of opportunities and risks is part of operating a business and is the primary task of all management personnel. During the regular management meetings at all management levels, opportunities, risks and optimisation measures are subjected to systematic treatment. Rapid, open and unhindered communication between all levels of management on the risks and imminent exceptional situations ensure that potential risks can be identified at an early stage and their effects can be limited. Risk awareness and the integration of risk management into management personnel’s on-going duties at an organisational level enable the Group to identify risks immediately and to eliminate them or to minimise their effects on the net asset, financial and income position. A detailed examination has revealed that the risks detailed below are manageable for the SMRP Group. The Group is exposed in particular to credit risks with regard to trade receivables, liquidity risks and market risks from changes in interest rates and exchange rates. The Group counters customer default risks by monitoring customers continuously and carrying out regular credit checks. Liquidity is secured by means of medium-term loans, pre-emptive liquidity planning and daily liquidity reporting. Interest and currency risks are monitored on a monthly basis centrally by the finance department and the Group’s Board of Management. The Group has developed guidelines on risk controlling and the use of financial instruments. These guidelines contain a clear allocation of duties. Risks are controlled and monitored by means of operational and financial measures. The risks listed below are not so material that they would result in extraordinary concentrations of risk.

Annual Report 2018-19
Consolidated Financial Statements
All amounts in Euro’000, unless otherwise stated
137
Credit risk Credit risk is the risk that a counterparty will not meet its obligations under a financial instrument or customer contract, leading to a financial loss. The Group is exposed to credit risk from its operating activities (primarily trade receivables) and from its financing activities, including deposits with banks and financial institutions, foreign exchange transactions and other financial instruments. The Group has guidelines for the management of credit risk from trade receivables. The Group’s primary customers are major global automobile manufacturers (OEMs) with good credit ratings. Non-OEM clients are very limited and subjected to credit assessments as a precautionary measure, and the adherence of all clients to payment due dates is monitored on an on-going basis, thereby practically eliminating the risk of default. An impairment analysis is performed at each reporting date using a provision matrix to measure expected credit losses. The provision rates are based on days past due for groupings of various customer segments with similar loss patterns (i.e., geographical region, product type, customer type and rating). The calculation reflects the probability-weighted outcome, the time value of money and reasonable and supportable information that is available at the reporting date about past events, current conditions and forecasts of future economic conditions. The provision matrix is initially based on the historical observed default rates. The Group will calibrate the matrix to adjust the historical credit loss experience with forward-looking information. For instance, if forecast economic conditions (i.e., gross domestic product) are expected to deteriorate over the next year which can lead to an increased number of defaults in the manufacturing sector, the historical default rates are adjusted. At every reporting date, the historical observed default rates are updated and changes in the forward looking estimates are analysed. The assessment of the correlation between historical observed default rates, forecast economic conditions and ECLs is a significant estimate. The amount of ECLs is sensitive to changes in circumstances and of forecast economic conditions. The Group’s historical credit loss experience and forecast of economic conditions may also not be representative of customer’s actual default in the future. The maximum amount of the credit exposure is equal to the carrying amounts of these receivables. The Group does not hold collateral as security or uses credit enhancements due to leading market positions of its customers. The Group has deposited liquid funds at various banking institutions. Primary banking institutions are major international banks. In long term credit ratings these banking institutions are considered to be investment grade. The movement in the allowance for impairment in respect of trade and other receivables during the year was as follows:
March 31, 2019 March 31, 2018
As at beginning of the year 8,603 6,150 Acquired in business combination 1,119 -
Allowance for impairment recognised 2,121 4,883 Amounts written off (2,123) (561)

Annual Report 2018-19
Consolidated Financial Statements
All amounts in Euro’000, unless otherwise stated
138
Unused amounts reversed (379) (1,660) Exchange fluctuation 123 (209) As at end of the year 9,464 8,603
Set out below is the information about the credit risk exposure on the Group’s trade receivables and other receivables:
Total Current Past due
< 30 days 30-90 days
90-180 days
180-360 days
>360 days
March 31, 2019
Trade receivables 610,193 475,552 108,704 10,154 10,866 4,458 459
Other receivables 533,729 511,097 5,264 9,264 3,781 1,690 2,633
March 31, 2018
Trade receivables 476,555 339,889 108,112 11,240 10,131 2,828 4,355
Other receivables 425,248 425,248 - - - - -
Liquidity risk The liquidity risk encompasses any risk that the Group cannot fully meet its financial obligations. To manage the liquidity risk, cash flow forecasting is performed in the operating entities of the group and aggregated by Group finance. Group finance monitors rolling forecasts of the Group’s liquidity requirements to ensure it has sufficient cash to meet operational needs while maintaining sufficient headroom on its undrawn committed borrowing facilities at all times so that the Group does not breach borrowing limits or covenants (where applicable) on any of its borrowing facilities. Such forecasting takes into consideration the Group’s debt financing plans, covenant compliance, compliance with internal balance sheet ratio targets and, if applicable external regulatory or legal requirements – for example, currency restrictions. Furthermore, in the case of an expected breach of covenants Group management evaluates early counteractions to prohibit negative impacts for the Group out of a breach of covenants. Please refer section on ‘Capital Management’ below. The following table shows the remaining contractual maturities of financial liabilities of the Group presented on a gross and undiscounted basis and include estimated interest payments and exclude the impact of netting arrangements:
March 31, 2019
Less Than 1 Year
1 to 5 years More than 5 years
Total
Non-derivative financial liabilities
Borrowings1) 206,290 501,847 412,146 1,120,283
Finance lease liabilities 1,460 2,272 42 3,774
Trade payables 1,046,089 3,415 - 1,049,504
Liabilities due to shareholders & related parties 27,239 - - 27,239
Other financial liabilities 360,243 9,296 3,721 373,260
Total
Derivative financial liabilities
Used for hedging1) 6,743 6,542 - 13,285
Total 6,743 6,542 - 13,285
1) Accrued interest as of March 31, 2019 is included in other financial liabilities
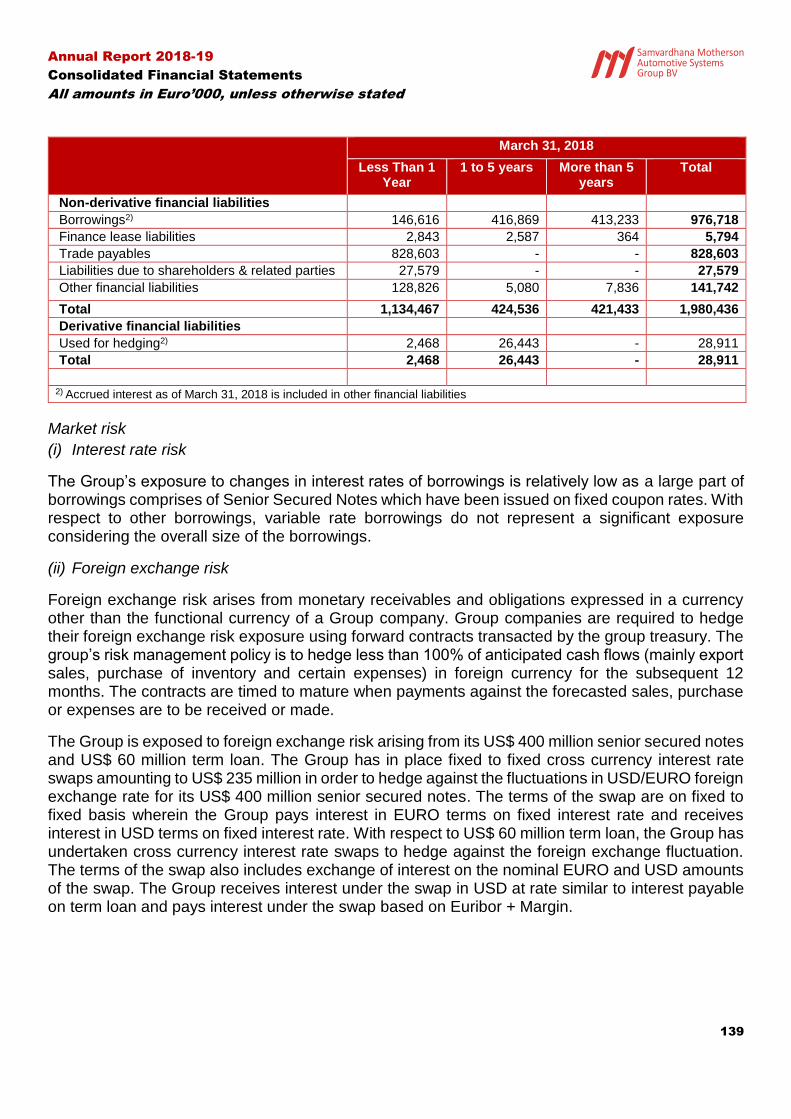
Annual Report 2018-19
Consolidated Financial Statements
All amounts in Euro’000, unless otherwise stated
139
March 31, 2018
Less Than 1 Year
1 to 5 years More than 5 years
Total
Non-derivative financial liabilities
Borrowings2) 146,616 416,869 413,233 976,718
Finance lease liabilities 2,843 2,587 364 5,794
Trade payables 828,603 - - 828,603
Liabilities due to shareholders & related parties 27,579 - - 27,579
Other financial liabilities 128,826 5,080 7,836 141,742
Total 1,134,467 424,536 421,433 1,980,436
Derivative financial liabilities
Used for hedging2) 2,468 26,443 - 28,911
Total 2,468 26,443 - 28,911
2) Accrued interest as of March 31, 2018 is included in other financial liabilities
Market risk
(i) Interest rate risk
The Group’s exposure to changes in interest rates of borrowings is relatively low as a large part of borrowings comprises of Senior Secured Notes which have been issued on fixed coupon rates. With respect to other borrowings, variable rate borrowings do not represent a significant exposure considering the overall size of the borrowings.
(ii) Foreign exchange risk
Foreign exchange risk arises from monetary receivables and obligations expressed in a currency other than the functional currency of a Group company. Group companies are required to hedge their foreign exchange risk exposure using forward contracts transacted by the group treasury. The group’s risk management policy is to hedge less than 100% of anticipated cash flows (mainly export sales, purchase of inventory and certain expenses) in foreign currency for the subsequent 12 months. The contracts are timed to mature when payments against the forecasted sales, purchase or expenses are to be received or made.
The Group is exposed to foreign exchange risk arising from its US$ 400 million senior secured notes and US$ 60 million term loan. The Group has in place fixed to fixed cross currency interest rate swaps amounting to US$ 235 million in order to hedge against the fluctuations in USD/EURO foreign exchange rate for its US$ 400 million senior secured notes. The terms of the swap are on fixed to fixed basis wherein the Group pays interest in EURO terms on fixed interest rate and receives interest in USD terms on fixed interest rate. With respect to US$ 60 million term loan, the Group has undertaken cross currency interest rate swaps to hedge against the foreign exchange fluctuation. The terms of the swap also includes exchange of interest on the nominal EURO and USD amounts of the swap. The Group receives interest under the swap in USD at rate similar to interest payable on term loan and pays interest under the swap based on Euribor + Margin.

Annual Report 2018-19
Consolidated Financial Statements
All amounts in Euro’000, unless otherwise stated
140
The group’s unhedged exposure to foreign currency risk (for major currencies) at the end of the reporting period was as follows
(Amounts in foreign currency 000s)
March 31, 2019 USD GBP CNY MXN HUF
Receivables 30,257 6,805 141 29,750 2,422,746
Borrowings 235,000 - - - -
Payables 30,601 2,796 38,262 29,991 1,448,107
March 31, 2018 USD GBP CNY MXN HUF
Receivables 260,533 9,911 1,126 58,807 1,147,164
Borrowings 201,000 - - - -
Payables 26,639 3,313 - 91,636 4,633,330
As shown in the table above, the group is primarily exposed to changes in USD/EURO exchange rates. The sensitivity of profit or loss to changes in the exchange rates arises mainly from US-dollar denominated financial instruments and the impact on other components of equity arises from foreign forward exchange contracts designated as cash flow hedges. The Group conducted sensitivity analyses at year-end to estimate the currency risk concerning movement in USD/EURO. If the Euro were to appreciate by 10% against the US dollar, receivables would decrease by k€ 2,452 as on March 31, 2019 (March 31, 2018 : k€ 19,223), while liabilities would decrease by k€ 21,526 as on March 31, 2019 (March 31, 2018 : k€ 16,796). Net impact on equity will be a loss of k€ 19,074 as on March 31, 2019 (March 31, 2018 : loss k€ 2,427). On the other hand, if the Euro were to depreciate by 10% against the US dollar, receivables would increase by k€ 2,997 as on March 31, 2019 (March 31, 2018 : k€ 23,495), while liabilities would increase by k€ 26,309 as on March 31, 2019 (March 31, 2018 : 20,529). Net impact on equity will be a gain of k€ 23,312 as on March 31, 2019 (March 31, 2018 : gain of 2,966).

Annual Report 2018-19
Consolidated Financial Statements
All amounts in Euro’000, unless otherwise stated
141
Derivative contracts
The Group had adopted hedge accounting in respect of following derivative contracts.
March 31, 2019
Type of
Hedge &
Risks
Nominal
Value
(Bought)
Carrying amount of Hedge
instrument Maturity date
Hedge
ratio
Weighted
average
strike price
Changes in fair
value of
hedging
instrument
Change in
the value of
hedged
item
Assets Liabilities
Forward covers
HUF:EUR HUF 9,856,225 632 - Apri'19 - Mar'20 1:1 328.54 632 (632)
CNY : EUR CNY 97,260 738 - Apri'19 - Jun'19 1:1 8.13 738 (738)
USD:AUD USD 9,250 51 51 Apri'19 - Nov'19 1:1 0.62 (3) 3
MXP:USD MXN 1,266,970 2,638 - Apr'19 - Sep'20 1:1 21.11 2,638 (2,638)
EUR:USD EUR 2,500 2 - Apr'19 1:1 0.89 2 (2)
EUR:CNY CNY 500,000 - 5 Apr'19 1:1 7.64 (5) 5
CNY : EUR EUR 4,901 - 0 May'19 1:1 8.19 (0) 0
MXP:USD USD 20,637,100 - 83 Mar'20 1:1 20.54 (83) 83
Total 4,061 139
Other forward covers not under hedge accounting
102 -
Total 4,163 139
Cross currency swaps EUR:USD EUR 157,983 - 5,422 15-Dec-21 1:1 1.11 (17,946) 17,680
EUR:USD EUR 52,657 673 - 14-Jun-19 1:1 1.14 (5,371) 5,371
EUR:USD EUR 51,386 2,087 - 29-Aug-23 1:1 1.17 2,087 (1,953)
Total 2,760 5,422 Other swaps not under hedge accounting
66 -
Total 2,826 5,422
March 31, 2018
Type of
Hedge &
Risks
Nominal
Value
(Bought)
Carrying amount of Hedge
instrument Maturity date
Hedge
ratio
Weighted
average
strike price
Changes in
fair value of
hedging
instrument
Change in
the value of
hedged item
Assets Liabilities
Forward covers
USD:MXN MXN 591,745 1,511 - September 2018 - March 2019
1:1 20.23 1,511 (1,511)
USD:EUR EUR 16,212 304 - April 2018 - September 2018
1:1 0.82 304 (304)
EUR:USD USD 3,000 9 - April 2018 1:1 1.24 9 (9)
EUR:CNY CNY 31,736 116 - April 2018 - May 2019
1:1 8.14 116 (116)
CNY:EUR EUR 18 - - April 2018 - May 2019
1:1 0.13 - -
EUR:HUF HUF 4,577,558
43 - April 2018 - August 2018
1:1 313.53 43 (43)
Total 1,983 -
Other forward covers not under hedge accounting
65 88
Total 2,048 88
Cross currency swaps
EUR:USD USD 175,000 - 23,368 15 December 2021 1:1 1.11 23,026 (23,368)
EUR:USD USD 60,000 - 4,697 14 June 2019 1:1 1.14 4,687 (4,697)
Total - 28,065

Annual Report 2018-19
Consolidated Financial Statements
All amounts in Euro’000, unless otherwise stated
142
During the year, hedge ineffectiveness of k€ 134 (March 31, 2018 : Nil) was recognised in the
income statement. The Group’s hedging policy only allows for effective hedge relationships to be
established. Hedge effectiveness is determined at the inception of the hedge relationship, and
through periodic prospective effectiveness assessments to ensure that an economic relationship
exists between the hedged item and hedging instrument. The Group enters into hedge relationships
where the critical terms of the hedging instrument match exactly with the terms of the hedged item,
and so a qualitative assessment of effectiveness is performed. If changes in circumstances affect
the terms of the hedged item such that the critical terms no longer match exactly with the critical
terms of the hedging instrument.
The Group uses the hypothetical derivative method to assess effectiveness. In the case of fixed to
fixed cross currency swaps, retrospective effectiveness testing is performed at each reporting date
using change in fair value of cash flows method (hypothetical derivative method) at each reporting
date during the period of hedging. The effectiveness is measured as the ratio of change in the fair
value of the hedging instrument and the hypothetical derivative during the period.
Capital management
The group’s objectives when managing capital are to safeguard their ability to continue as a going
concern and also their ability to fund inorganic growth, so that they can continue to provide returns
for shareholders and benefits for other stakeholders and maintain an optimal capital structure to
reduce the cost of capital.
Consistent with others in the industry, the group monitors Net Debt to EBITDA ratio: Net debt (total
borrowings net of cash and cash equivalents) divided by EBITDA (Profit before tax plus depreciation
and amortization expense plus finance costs plus exceptional expense).
The group’s strategy is to ensure that the Net Debt to EBITDA is managed at an optimal level
considering the above factors. The Net Debt to EBITDA ratios were as follows:
March 31, 2019 March 31, 2018
Borrowings - non-current 967,241 729,441
Borrowings – current 185,700 134,625
Total borrowings 1,152,941 864,066
Less: Cash and cash equivalents (310,851) (215,640)
Net Debt 842,090 648,426
Results from operating activities 178,688 255,401
Add: Depreciation and amortisation 168,309 122,829
EBITDA 346,997 378,230
Net Leverage Ratio* 1.98 1.74
*Calculated in accordance with the definitions of Net Debt and EBITDA as per Revolving Credit Facilities Agreement
The Group is not subject to any capital requirements on the basis of its Articles of Incorporation. Certain capital requirements were contractually imposed in loan agreements with the financial institutions. As per the terms of the Notes and Revolver Credit Facilities referred to in note A.6.3.10,

Annual Report 2018-19
Consolidated Financial Statements
All amounts in Euro’000, unless otherwise stated
143
the Group is required to maintain financial covenants of net leverage ratio not exceeding 3.25x and net interest cover ratio more than 3.0x calculated on the group’s consolidated financial statements. Upon the occurrence of any event of default under any of the Revolving Credit Facilities Agreements or the Notes, subject to applicable cure periods and other limitations on acceleration or enforcement, the relevant creditors/Trustee could elect to declare all amounts outstanding, together with accrued interest, immediately due and payable and cancel the availability of the facilities, as applicable. As at March 31, 2019 the Group had net leverage ratio of 1.98x (March 31, 2018 : 1.74x) and net interest cover ratio of 6.60x (March 31, 2018 : 5.60x) and therefore was in compliance with both these financial covenants. The Group continuously monitors these covenants and it is controlled by capital measures regarding both, shareholders equity as well as debt.
This space has been intentionally left blank

Annual Report 2018-19
Consolidated Financial Statements
All amounts in Euro’000, unless otherwise stated
144
A.6.6.4 Operating Segment Information The Company is primarily in the business of manufacture and sale of components to automotive original equipment manufacturers. The CODM examines the group’s performance from a product perspective and has identified two reportable segments of its business: SMR Represents Samvardhana Motherson Reflectec Group Holdings Limited including its subsidiaries excluding Samvardhana Motherson Innovative Autosystems Holding Company BV, Samvardhana Motherson Innovative Autosystems de Mexico, S.A. de C.V., SMP Automotive Systems Alabama Inc. and plant at Kecskemet of SMR Automotive Mirror Technology Hungry Bt. and is engaged in development, manufacture and supply of rear view mirrors and drive assistance systems. SMP Represents Samvardhana Motherson Peguform GmbH, SMP Automotive Technology Ibérica, S.L., SMP Automotive Interiors (Beijing) Co. Ltd and their subsidiaries and includes Samvardhana Motherson Innovative Autosystems Holding Company BV, Samvardhana Motherson Innovative Autosystems de Mexico, S.A. de C.V., SMP Automotive Systems Alabama Inc., plant at Kecskemet of SMR Automotive Mirror Technology Hungry Bt. as referred above and Samvardhana Motherson Reydel Companies. SMP supplies polymer based interior and exterior modules and parts for automotive industry. Others Represents activities carried out by Motherson Innovations (Group’s R&D and new technologies development arm) and results of certain corporate and shareholder support functions not allocable to a particular segment on a reasonable basis. Results of such support functions are not included in the business review reports provided to the management. The management reviews performance of SMR and SMP business separately from the results of Motherson Innovations and other support functions and therefore the Company decided to present performance and assets, liabilities of SMR and SMP segment separately from the results of Motherson Innovations and other support functions to provide a better view on operational performance of these segments.
Transfer prices for transactions between operating segments are on an arm’s length basis in a manner similar to transactions with third parties.

Annual Report 2018-19
Consolidated Financial Statements
All amounts in Euro’000, unless otherwise stated
145
March 31, 2019 March 31, 2018
SMP SMR Others Inter-segment
eliminations
Total SMP SMR Others Inter-segment
eliminations
Total
Revenues 3,703,627 1,611,405 891 (3,777) 5,312,146 3,451,502 1,574,855 - (1,929) 5,024,428
Earnings before interest, tax, deprication and amortisation (EBITDA)
154,076 188,011 (12,111) 17,019 346,996 205,318 189,334 (16,422) - 378,230
Depreciation & Amortisation
(117,296) (50,866) (147) - (168,309) (78,231) (44,518) (80) - (122,829)
Earnings before interest, tax and share of net profit/(loss) of associates and joint ventures
36,780 137,146 (12,258) 17,020 178,688 127,087 144,816 (16,502) - 255,401
Share of net profit of associates and joint ventures
(187) 7,263 - - 7,076 274 12,809 - - 13,083
Interest Income 10,226
2,286
Interest expense (48,327)
(61,785)
Profit before tax 147,663
208,985
Segment Assets 2,778,856 1,137,132 2,170,918 (2,460,089) 3,626,817 2,068,998 927,600 1,821,804 (2,010,494) 2,807,908
Segment Liabilities 1,687,025 503,509 1,063,178 (414,712) 2,839,000 1,195,681 428,945 829,164 (300,316) 2,153,474
Other disclosures:
Capital expenditure 185,369 69,195 260 - 254,824
204,308 78,702 61 - 283,071
Assets under Others primarily represent intercompany loans and investment in subsidiaries Liabilities under Others primarily represent borrowings in the form of Notes and Revolving Credit Facilities utilised at the holding company level

Annual Report 2018-19
Consolidated Financial Statements
All amounts in Euro’000, unless otherwise stated
146
Disaggregated revenue information
March 31, 2019
March 31, 2018
SMP SMR Others / Unallocated
Intersegment eliminations
Total SMP SMR Others / Unallocated
Intersegment eliminations
Total
Geographical markets Asia Pacific 487,706 395,944 891 (952) 883,589
301,844 406,851 - (46) 708,649
Europe 2,634,798 708,773 - (1,649) 3,341,922
2,714,008 689,576 - (1,882) 3,401,702
The Americas 581,123 506,688 - (1,176) 1,086,635
435,650 478,428 - (1) 914,077
Total revenue from contracts with customers
3,703,627 1,611,405 891 (3,777) 5,312,146
3,451,502 1,574,855 - (1,929) 5,024,428
Type of goods or service
Sale of components 3,081,002 1,564,407 891 (3,777) 4,642,523
* * * * *
Tool development 595,915 46,998 - - 642,913
* * * * *
Assembly of components
26,710 - - - 26,710
* * * * *
Total revenue from contracts with customers
3,703,627 1,611,405 891 (3,777) 5,312,146
* * * * *
Timing of revenue recognition
At a point in time 3,107,712 1,564,407 891 (3,777) 4,669,233
* * * * *
Over a period of time 595,915 46,998 642,913
* * * * *
Total revenue from contracts with customers
3,703,627 1,611,405 891 (3,777) 5,312,146
* * * * *
* The Group has applied IFRS 15 using modified retrospective approach and therefore comparative information has not been presented
Non-current assets by region (excluding deferred taxes, investments and financial instrument)
March 31, 2019
March 31, 2018
SMP SMR Others / Unallocated
Intersegment eliminations
Total
SMP SMR Others / Unallocated
Intersegment eliminations
Total
Asia Pacific 127,673 143,356 161 - 271,190
54,231 125,772 141 - 180,144
Europe 925,468 134,035 1,030 - 1,060,533
707,923 126,118 1,241 - 835,282
The Americas 405,633 102,045 - - 507,678
309,125 97,041 - - 406,166
Total 1,458,774 379,436 1,191 - 1,839,401
1,071,279 348,931 1,382 - 1,421,592
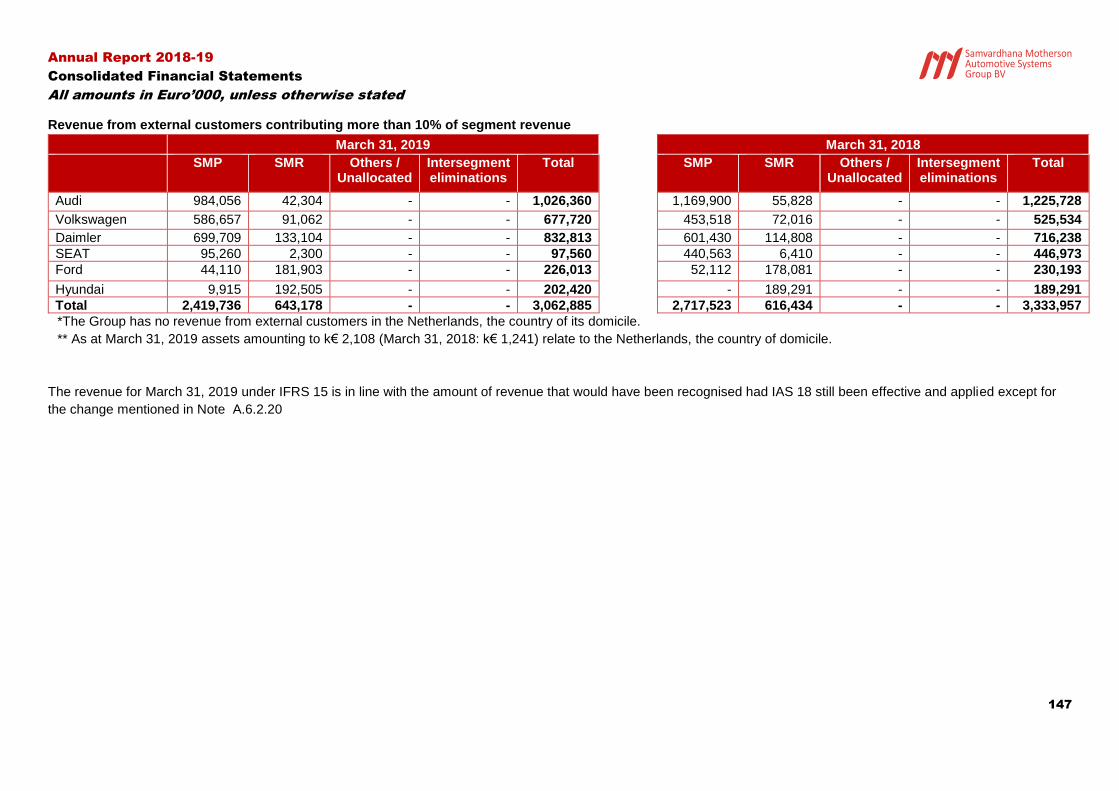
Annual Report 2018-19
Consolidated Financial Statements
All amounts in Euro’000, unless otherwise stated
147
Revenue from external customers contributing more than 10% of segment revenue
March 31, 2019
March 31, 2018
SMP SMR Others / Unallocated
Intersegment eliminations
Total
SMP SMR Others / Unallocated
Intersegment eliminations
Total
Audi 984,056 42,304 - - 1,026,360
1,169,900 55,828 - - 1,225,728
Volkswagen 586,657 91,062 - - 677,720
453,518 72,016 - - 525,534
Daimler 699,709 133,104 - - 832,813
601,430 114,808 - - 716,238
SEAT 95,260 2,300 - - 97,560
440,563 6,410 - - 446,973
Ford 44,110 181,903 - - 226,013
52,112 178,081 - - 230,193
Hyundai 9,915 192,505 - - 202,420
- 189,291 - - 189,291
Total 2,419,736 643,178 - - 3,062,885
2,717,523 616,434 - - 3,333,957
*The Group has no revenue from external customers in the Netherlands, the country of its domicile.
** As at March 31, 2019 assets amounting to k€ 2,108 (March 31, 2018: k€ 1,241) relate to the Netherlands, the country of domicile.
The revenue for March 31, 2019 under IFRS 15 is in line with the amount of revenue that would have been recognised had IAS 18 still been effective and applied except for
the change mentioned in Note A.6.2.20

Annual Report 2018-19
Consolidated Financial Statements
All amounts in Euro’000, unless otherwise stated
148
A.6.6.5 Other financial obligations
The following table shows the future financial obligations arising from long-term rental and leasing
contracts.
Operating leases – group as lessee
The group leases various properties, vehicles and machinery under non-cancellable operating lease
agreements. The lease terms are between 3 and 10 years, and the majority of lease agreements
are renewable at the end of the lease period at market rate. There are no restrictions placed upon
the lessee by entering into these leases.
The future aggregate minimum lease payments under non-cancellable operating leases are as
follows:
March 31, 2019 March 31, 2018
Not later than one year 30,897 32,389
After one year but not more than five years 71,365 49,401
More than five years 12,597 2,363
Total 114,859 84,153
During the year, k€ 64,695 (March 31, 2018: k€ 52,474) has been recognised in the income statement as lease rent expense towards operating leases. Finance leases – group as lessee
The group leases various buildings and machinery under non-cancellable finance lease agreements. The lease terms are between 3 and 10 years, and ownership of the assets lies within the group. Future Minimum Lease Payments under Finance Lease
March 31, 2019 March 31, 2018
Future minimum payments due:
Not later than 1 year 1,458 2,843
Later than 1 year but not more than 5 years 2,274 2,587
Later than 5 years 29 364
Total 3,761 5,794
Less finance charges allocated to future periods 229 387
Present value of future minimum lease payments 3,532 5,407
Thereof
Not later than 1 year 1,400 2,678
Later than 1 year but not more than 5 years 2,015 2,377
Later than 5 years 115 352
Total 3,530 5,407
Thereof
Current 1,350 2,678
Non-current 2,179 2,729
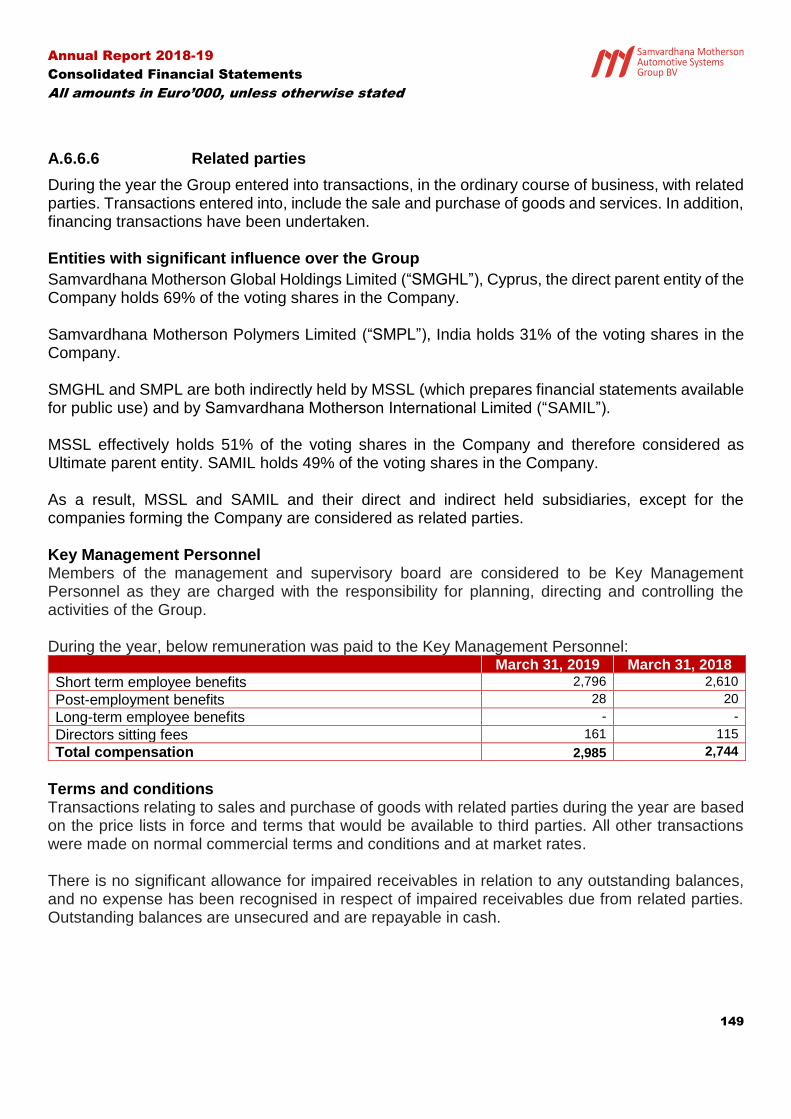
Annual Report 2018-19
Consolidated Financial Statements
All amounts in Euro’000, unless otherwise stated
149
A.6.6.6 Related parties
During the year the Group entered into transactions, in the ordinary course of business, with related parties. Transactions entered into, include the sale and purchase of goods and services. In addition, financing transactions have been undertaken. Entities with significant influence over the Group
Samvardhana Motherson Global Holdings Limited (“SMGHL”), Cyprus, the direct parent entity of the Company holds 69% of the voting shares in the Company. Samvardhana Motherson Polymers Limited (“SMPL”), India holds 31% of the voting shares in the Company. SMGHL and SMPL are both indirectly held by MSSL (which prepares financial statements available for public use) and by Samvardhana Motherson International Limited (“SAMIL”). MSSL effectively holds 51% of the voting shares in the Company and therefore considered as Ultimate parent entity. SAMIL holds 49% of the voting shares in the Company. As a result, MSSL and SAMIL and their direct and indirect held subsidiaries, except for the companies forming the Company are considered as related parties. Key Management Personnel Members of the management and supervisory board are considered to be Key Management Personnel as they are charged with the responsibility for planning, directing and controlling the activities of the Group. During the year, below remuneration was paid to the Key Management Personnel: March 31, 2019 March 31, 2018
Short term employee benefits 2,796 2,610
Post-employment benefits 28 20
Long-term employee benefits - -
Directors sitting fees 161 115
Total compensation 2,985 2,744
Terms and conditions Transactions relating to sales and purchase of goods with related parties during the year are based on the price lists in force and terms that would be available to third parties. All other transactions were made on normal commercial terms and conditions and at market rates. There is no significant allowance for impaired receivables in relation to any outstanding balances, and no expense has been recognised in respect of impaired receivables due from related parties. Outstanding balances are unsecured and are repayable in cash.

Annual Report 2018-19
Consolidated Financial Statements
All amounts in Euro’000, unless otherwise stated
150
Details of related party transactions
Year ended March 31, 2019
Ultimate Parent
Immediate Parent
Entities with significant influence
Fellow Subsidiaries
Joint ventures and associates
Key Management
Personnel
Other related parties
Total
Sales 3,153 - - 164 34,030 - - 37,347
Purchases 39,582 - - 64,189 34,913 - 245 138,929
Miscellaneous expenses 828 - 208 8,504 45 2,028 22,379 33,992
Loans given - - - - - - 26 26
Loans taken - 150,000 - 23 - - - 150,023
Rental income - - - 54 - - - 54
Interests and similar expenses - 2,385 - 13 - - - 2,398
Purchase of assets 69 - - - - - 8,870 8,939
Miscellaneous income 2,228 - 45 2,131 385 - 9 4,798
Details of related party balances
As at March 31, 2019 Ultimate Parent
Immediate Parent
Entities with significant influence
Fellow Subsidiaries
Joint ventures and associates
Key Management
Personnel
Other related parties
Total
Trade receivables 1,402 - 39 2,989 5,759 - 620 10,809
Other receivables - - - - - - 793 793
Trade and other payables 6,694 2,385 19 11,763 5,190 - 3,581 29,632
Loans payable - 150,000 - 319 - - 150,319

Annual Report 2018-19
Consolidated Financial Statements
All amounts in Euro’000, unless otherwise stated
151
Details of related party transactions
Year ended March 31, 2018
Ultimate Parent
Entities with significant influence
Fellow Subsidiaries
Joint ventures and associates
Key Management
Personnel
Other related parties
Total
Sales 965 - 2,785 38,539 - - 42,289
Purchases 35,657 - 60,026 39,061 - 135 134,879
Miscellaneous expenses 147 61 9,271 51 - 9,551 19,081
Loans given - - - - - 10 10
Loans taken - - 41 - - - 41
Rental Income - - 2 - - - 2 Purchase of assets 81 - - - - 3,728 3,809
Miscellaneous income 2,437 20 2,533 774 - 252 6,016
Details of related party balances
As at March 31, 2018 Ultimate Parent
Entities with significant influence
Fellow Subsidiaries
Joint ventures and associates
Key Management
Personnel
Other related parties
Total
Trade receivables 832 23 2,125 12,980 - 339 16,299
Other receivables - - - - 16 1,723 1,739
Trade and other payables 7,565 101 13,298 4,112 5 2,496 27,577
Loans payable - - 286 - - - 286

Annual Report 2018-19
Consolidated Financial Statements
All amounts in Euro’000, unless otherwise stated
152
A.6.7 Accounting estimates and evaluations
The Group makes estimates and assumptions concerning the future and makes significant judgements in the process of application of accounting policies. The resulting accounting estimates will, by definition, seldom equal the related actual results. The estimates and assumptions that have a significant risk of causing a material adjustment to the carrying amounts of assets and liabilities within the next financial year are addressed below:
• Determination of the useful life of intangible assets and property, plant and equipment (see A.6.3.2 and A.6.3.3).
• Determination of fair value of derivatives and investment in equity instruments measured at fair value through other comprehensive income (see A.6.2.8).
• Impairment of assets recognised for customer and engineering agreements as well as technology and property, plant and equipment, particularly with regard to their underlying cash flow forecasts and discount rates (see A.6.3.2 and A.6.3.3).
• Estimation of fair values of assets and liabilities acquired in a business combination.
• Determination of the level of completion, the contract revenues and contract costs of engineering contracts. The Group uses the percentage-of-completion method in accounting for its fixed price contracts to deliver engineering services. Use of the percentage-of-completion method requires the Group to estimate the services performed to date as a proportion of the total services to be performed. (see A.6.3.15).
• Valuation of recoverable income tax assets especially with respect to deferred tax assets on tax loss carry forwards. The Group is subject to income taxes in numerous jurisdictions. Significant judgement is required in determining the worldwide provision for income taxes. The Group recognises liabilities for anticipated tax audit issues based on estimates of whether additional taxes will be due. Where the final tax outcome of these matters is different from the amounts that were initially recorded, such differences will impact the current and deferred income tax assets and liabilities in the period in which such determination is made. (see A.6.5).
• Recognition and presentation of provisions and liabilities for pensions and other post-employment benefits. The present value of the pension obligations depends on a number of factors that are determined on an actuarial basis using a number of assumptions. The assumptions used in determining the net cost (income) for pensions include the discount rate. Any changes in these assumptions will impact the carrying amount of pension obligations. The Group determines the appropriate discount rate at the end of each year. This is the interest rate that should be used to determine the present value of estimated future cash outflows expected to be required to settle the pension obligations. In determining the appropriate discount rate, the Group considers the interest rates of high-quality corporate bonds that are denominated in the currency in which the benefits will be paid and that have terms to maturity approximating the terms of the related pension obligation. Other key assumptions for pension obligations are based in part on current market conditions. (see A.6.2.14.1 and A.6.3.11).
• Recognition and presentation of provisions and liabilities and to the probability of expenses arising from warranty claims and claims from legal disputes. (see A.6.2.14).
These estimates and assumptions are based on the latest information available at the time that the consolidated financial statements were prepared. The assumptions and estimates are checked and updated regularly to accommodate any actual developments that may arise.

Annual Report 2018-19
Consolidated Financial Statements
All amounts in Euro’000, unless otherwise stated
153
A.6.8 Subsequent events
The Company have not observed any subsequent event.
Signing of the financial statements
Mr. Jacob Meint Buit
Mr. Randolph Marie Thaddeus De Cuba (Managing Director)
(Managing Director)
Mr. Laksh Vaaman Sehgal
Mr. Andreas Heuser (Managing Director)
(Managing Director)
Mr. Cezary Zawadzinski Mr. Bimal Dhar (Member of Supervisory Board)
(Member of Supervisory Board)
Mr. Kunal Malani Mr. G.N. Gauba (Member of Supervisory Board)
(Member of Supervisory Board)
Mr. Vivek Chaand Sehgal Ms. Geeta Mathur
(Member of Supervisory Board) (Member of Supervisory Board)

Annual Report 2018-19
Standalone Financial Statements
All amounts in Euro’000, unless otherwise stated
154
Standalone Financial Statements
For the year ended March 31, 2019

Annual Report 2018-19
Standalone Financial Statements
All amounts in Euro’000, unless otherwise stated
155
B.1 Statement of Financial Position
Note March 31, 2019 March 31, 2018
ASSETS
Property, plant and equipment B.6.3.1 355 355
Investments in subsidiaries B.6.3.2 1,272,098 1,077,182
Loans to related parties B.6.3.3 756,742 669,288
Other financial instruments B.6.3.4 2,087 -
Other receivables and assets B.6.3.5 584 885
Total non-current assets
2,031,866 1,747,710
Receivables from related parties
945 1,062
Other financial instruments B.6.3.4 673 -
Other receivables and other assets B.6.3.5 15,362 14,917
Cash and cash equivalents B.6.3.6 99,240 39,008
Total current assets
116,220 54,987
Total assets
2,148,086 1,802,697
EQUITY AND LIABILITIES
Subscribed capital B.6.3.7 66 66
Share premium B.6.3.7 900,910 900,910
Cash flow hedge reserve B.5 (3,749) (8,157)
Retained earnings B.5 191,635 82,655
Total equity
1,088,862 975,474
Borrowings B.6.3.8 949,713 713,367
Other financial instruments B.6.3.4 5,422 28,065
Other liabilities B.6.3.9 2,385 -
Total non-current liabilities
957,520 741,432
Borrowings B.6.3.8 86,905 69,218
Other liabilities B.6.3.9 14,799 16,573
Total current liabilities 101,704 85,791
Total liabilities 1,059,224 827,223
Total equity and liabilities
2,148,086 1,802,697
The notes on pages 160 to 197 are an integral part of these financial statements.

Annual Report 2018-19
Standalone Financial Statements
All amounts in Euro, unless otherwise stated
156
B.2 Income Statement
Notes Year ended
March 31, 2019 Year ended
March 31, 2018
Service income B.6.4.1 837 1,344
Dividend income B.6.4.2 98,500 46,500
Personnel expenses B.6.4.3 (406) (521)
Other operating expenses B.6.4.4 (3,567) (6,784)
Result from operating activities
95,364 40,539
Finance income B.6.4.5 45,306 31,584
Finance costs B.6.4.5 (31,691) (55,119)
Finance costs – net
13,615 (23,535)
Earnings Before Taxes (EBT)
108,979 17,004
Income taxes B.6.4.6 - -
Profit for the year
108,979 17,004
The notes on pages 160 to 197 are an integral part of these financial statements.

Annual Report 2018-19
Standalone Financial Statements
All amounts in Euro, unless otherwise stated
157
B.3 Statement of Comprehensive Income
Year ended
March 31, 2019 Year ended
March 31, 2018
Profit for the year after tax: 108,979 17,004
Other comprehensive income / (loss): 4,408 (5,308)
- Items that may be subsequently classified to Profit & Loss
Cash flow hedges 4,408 (5,308)
Income tax relating to these items - -
Total comprehensive income for the year 113,387 11,696
The notes on pages 160 to 197 are an integral part of these financial statements.

Annual Report 2018-19
Standalone Financial Statements
All amounts in Euro, unless otherwise stated
158
B.4 Cash Flow Statement Note Year-ended
March 31, 2019 Year-ended
March 31, 2018
CASH FLOW FROM OPERATING ACTIVITIES
Earnings before taxes B.2 108,979 17,004
Finance costs – net (excluding foreign exchange loss) B.6.4.5 (6,752) 20,678
Dividend from subsidiaries (98,500) (46,500)
Foreign currency translation loss /(gain)
1,557 3,016
Net earnings before changes in working capital
5,284 (5,802)
Change in working capital
Decrease /(increase) in receivables from related parties
117 (373)
Decrease /(increase) in other receivables and assets
203 (168)
Increase/(decrease) in other liabilities
(1,999) (454)
Cash flow from operating activities before income tax
3,605 (6,797)
Income tax paid
- -
Cash flow from operating activities (A)
3,605 (6,797)
CASH FLOW FROM INVESTING ACTIVITIES
Investment in subsidiaries
(194,916) (21,900)
Dividend from subsidiaries 98,500 46,500
Purchase of property plant and equipment - (14)
Loans given to subsidiaries (546,006) (459,213)
Repayment of loan given to subsidiaries 478,630 290,033
Interest received 38,194 30,758
Cash flow from investing activities (B)
(125,598) (113,836)
CASH FLOW FROM FINANCING ACTIVITIES
Proceeds from long term borrowings
50,216 292,000
Repayment of short term borrowings (net of receipts)
163,213 (445,649)
Interest paid
(26,915) (40,119)
Cash flow from financing activities (C)
186,514 (193,768)
Changes in cash and cash equivalents (A+B+C)
64,521 (314,401)
Cash and cash equivalents at beginning of period
39,008 361,260
Variation in cash and cash equivalents from translation in foreign currencies
(4,289) (7,851)
Cash and cash equivalents at end of year B.6.3.6 99,240 39,008
The notes on pages 160 to 197 are an integral part of these financial statements.

Annual Report 2018-19
Standalone Financial Statements
All amounts in Euro’000, unless otherwise stated
159
B.5 Statement of Changes in Equity
Share capital Share
premium Cash flow
hedge reserve
Retained earnings
Total
As at April 01, 2017 66 900,910 (2,849) 65,651 963,778
Comprehensive income
Profit for the year - - - 17,004 17,004
Items that may be subsequently classified to Profit & Loss
Cash flow hedge reserve - - (5,308) - (5,308)
Total comprehensive income - - (5,308) 17,004 11,696
Transactions with owners
Shares issued during the year - - - - -
As at March 31, 2018 66 900,910 (8,157) 82,655 975,474
As at April 01, 2018 66 900,910 (8,157) 82,655 975,474
Comprehensive income
Profit for the year - - - 108,980 108,980
Items that may be subsequently classified to Profit & Loss
Cash flow hedge reserve - - 4,408 - 4,408
Total comprehensive income - - 4,408 108,980 113,388
Transactions with owners
Shares issued during the year - - - - -
As at March 31, 2019 66 900,910 (3,749) 191,635 1,088,862
The notes on pages 160 to 197 are an integral part of these financial statements.

Annual Report 2018-19
Standalone Financial Statements
All amounts in Euro’000, unless otherwise stated
160
B.6 Notes to the Financial Statements
B.6.1 General information and description of the business
Samvardhana Motherson Automotive Systems Group BV, Amsterdam (hereafter referred as "Company" or "SMRP BV") is a private company with limited liability, incorporated under the laws of the Netherlands on 7 October 2011, having its corporate seat at Amsterdam (KvK number 53709713), with office at Hoogoorddreef 15, 1101 BA Amsterdam, The Netherlands. The principal business activities of the Company are holding, financing and management activities.
B.6.2 Summary of Significant Accounting Policies
B.6.2.1 Basis of preparation The financial statements of the Company comprise the period April 01, 2018 to March 31, 2019. The financial statements have been prepared in accordance with International Financial Reporting Standards ("IFRS") as endorsed by the European Union, and comply with the financial reporting requirements in section 9 of Book 2 of the Netherlands Civil Code, as far as applicable. These correspond to the IFRS issued by the International Accounting Standards Board ("IASB") and interpretations issued by the International Financial Reporting Interpretations Committee ("IFRIC") and endorsed by the European Union. The financial statements have been prepared on a going concern basis and in accordance with the accrual basis of accounting. The financial statements have been prepared under the historical cost convention except for financial assets and financial liabilities (including derivative instruments) at fair value through profit or loss. In case no other policies are mentioned, refer to the accounting policies as described in the accounting policies in the consolidated financial statements of this Annual Report. For an appropriate interpretation, the parent financial statements of the Company should be read in conjunction with the consolidated financial statements.
The financial statements are presented in euros and all values are rounded to the nearest euro, except when otherwise indicated. These financial statements have been approved for issue by SMRP BV’s management and supervisory board on May 21, 2019.
B.6.2.2 Functional and presentation currency
The financial statements are presented in Euro (€), which is the Company's functional currency,
as it is the currency of the primary economic environment in which the Company operates.

Annual Report 2018-19
Standalone Financial Statements
All amounts in Euro’000, unless otherwise stated
161
B.6.2.3 Transactions in foreign currencies Foreign currency transactions are translated into the functional currency using the exchange rates prevailing at the dates of the transactions. Monetary assets and liabilities denominated in foreign currencies at the reporting date are translated into the functional currency at the rate prevailing on this date. Differences from foreign currency transactions are reported in the income statement. Non-monetary assets and liabilities that are measured at historical cost in foreign currencies at the reporting date are translated into the functional currency at the rate prevailing on the day of the transaction. Non-monetary assets and liabilities that are measured at fair value in foreign currencies at the reporting date are translated into the functional currency at the rate prevailing on the date on which the fair value was determined.
B.6.2.4 Investments in subsidiaries Subsidiaries are entities over which the Company has control. The Company controls an entity when the Company is exposed to, or has rights to, variable returns from its involvement with the entity and has the ability to affect those returns through its power over the entity. In line with IAS 27, the investments in subsidiaries have been valued at cost. Dividend will be recognised in the income statement when received or when the Company is legally entitled to the dividend. In general, the Company yearly performs reviews at the reporting date to determine whether there were indications that financial fixed assets or their cash-generating units have to be impaired. The amount of impairment is the difference between the asset´s carrying amount and the recoverable amount. The recoverable amount of a fixed asset or a cash-generating unit is the higher of fair value less costs to dispose and the value in use. Calculation of recoverable amount is based on estimated future cash flows, discounted at an appropriate interest rate. Impairments, if any, are reported in the income statement.
B.6.2.5 Financial assets and financial liabilities A financial instrument is any contract that gives rise to a financial asset of one entity and a financial liability or equity instrument of another entity. Initial recognition and measurement
Financial assets are classified, at initial recognition, as subsequently measured at amortised cost, fair value through other comprehensive income (OCI), and fair value through profit or loss. The classification of financial assets at initial recognition depends on the financial asset’s contractual cash flow characteristics and the Company’s business model for managing them. With the exception of trade receivables that do not contain a significant financing component, the Company initially measures a financial asset at its fair value plus, in the case of a financial asset not at fair value through profit or loss, transaction costs. Trade receivables that do not contain a significant financing component are measured at the transaction price determined under IFRS 15. In order for a financial asset to be classified and measured at amortised cost or fair value through OCI, it needs to give rise to cash flows that are ‘solely payments of principal and interest (SPPI)’

Annual Report 2018-19
Standalone Financial Statements
All amounts in Euro’000, unless otherwise stated
162
on the principal amount outstanding. This assessment is referred to as the SPPI test and is performed at an instrument level. The Company’s business model for managing financial assets refers to how it manages its financial assets in order to generate cash flows. The business model determines whether cash flows will result from collecting contractual cash flows, selling the financial assets, or both. Purchases or sales of financial assets that require delivery of assets within a time frame established by regulation or convention in the market place (regular way trades) are recognised on the trade date, i.e., the date that the Company commits to purchase or disposal of the asset. Subsequent measurement For purposes of subsequent measurement, financial assets are classified in three categories:
• Financial assets at amortised cost (debt instruments)
• Financial assets designated at fair value through OCI with no recycling of cumulative gains and losses upon derecognition (equity instruments)
• Financial assets at fair value through profit or loss Financial assets at amortised cost (debt instruments) This category is the most relevant to the Company. The Company measures financial assets at amortised cost if both of the following conditions are met:
• The financial asset is held within a business model with the objective to hold financial assets in order to collect contractual cash flows And
• The contractual terms of the financial asset give rise on specified dates to cash flows that are solely payments of principal and interest on the principal amount outstanding.
Financial assets at amortised cost are subsequently measured using the effective interest (EIR) method and are subject to impairment. Gains and losses are recognised in profit or loss when the asset is derecognised, modified or impaired. The Company’s financial assets at amortised cost includes trade receivables. Financial assets designated at fair value through OCI (equity instruments) Upon initial recognition, the Company can elect to classify irrevocably its equity investments as equity instruments designated at fair value through OCI when they meet the definition of equity under IAS 32 Financial Instruments: Presentation and are not held for trading. The classification is determined on an instrument-by instrument basis. Gains and losses on these financial assets are never recycled to profit or loss. Dividends are recognised as other income in the income statement when the right of payment has been established, except when the Company benefits from such proceeds as a recovery of part of the cost of the financial asset, in which case, such gains are recorded in OCI. Equity instruments designated at fair value through OCI are not subject to impairment assessment. The Company had no such instruments. Financial assets at fair value through profit or loss Financial assets at fair value through profit or loss include financial assets held for trading, financial assets designated upon initial recognition at fair value through profit or loss, or financial assets

Annual Report 2018-19
Standalone Financial Statements
All amounts in Euro’000, unless otherwise stated
163
mandatorily required to be measured at fair value. Financial assets are classified as held for trading if they are acquired for the purpose of selling or repurchasing in the near term. Derivatives, including separated embedded derivatives, are also classified as held for trading unless they are designated as effective hedging instruments. Financial assets with cash flows that are not solely payments of principal and interest are classified and measured at fair value through profit or loss, irrespective of the business model. Notwithstanding the criteria for debt instruments to be classified at amortised cost, as described above, debt instruments may be designated at fair value through profit or loss on initial recognition if doing so eliminates, or significantly reduces, an accounting mismatch. Financial assets at fair value through profit or loss are carried in the statement of financial position at fair value with net changes in fair value recognised in the income statement. This category includes derivative instruments. Derecognition A financial asset (or, where applicable, a part of a financial asset or part of a Company of similar financial assets) is primarily derecognised (i.e., removed from the Company’s consolidated statement of financial position) when:
• The rights to receive cash flows from the asset have expired Or
• The Company has transferred its rights to receive cash flows from the asset or has assumed an obligation to pay the received cash flows in full without material delay to a third party under a ‘pass-through’ arrangement; and either (a) the Company has transferred substantially all the risks and rewards of the asset, or (b) the Company has neither transferred nor retained substantially all the risks and rewards of the asset, but has transferred control of the asset
When the Company has transferred its rights to receive cash flows from an asset or has entered into a passthrough arrangement, it evaluates if, and to what extent, it has retained the risks and rewards of ownership. When it has neither transferred nor retained substantially all of the risks and rewards of the asset, nor transferred control of the asset, the Company continues to recognise the transferred asset to the extent of its continuing involvement. In that case, the Company also recognises an associated liability. The transferred asset and the associated liability are measured on a basis that reflects the rights and obligations that the Company has retained. Continuing involvement that takes the form of a guarantee over the transferred asset is measured at the lower of the original carrying amount of the asset and the maximum amount of consideration that the Company could be required to repay. Impairment
From April 01, 2018, the Company assesses on a forward looking basis the expected credit losses associated with its debt instruments carried at amortised cost and FVOCI. The impairment methodology applied depends on whether there has been a significant increase in credit risk. Financial liabilities Initial recognition and measurement Financial liabilities are classified, at initial recognition, as financial liabilities at fair value through profit or loss, loans and borrowings, payables, or as derivatives designated as hedging instruments in an effective hedge, as appropriate.
Annual Report 2018-19
Standalone Financial Statements
All amounts in Euro’000, unless otherwise stated
164
All financial liabilities are recognised initially at fair value and, in the case of loans and borrowings and payables, net of directly attributable transaction costs. The Company’s financial liabilities include trade and other payables, loans and borrowings including derivative financial instruments. Subsequent measurement The measurement of financial liabilities depends on their classification, as described below: Financial liabilities at fair value through profit or loss Financial liabilities at fair value through profit or loss include financial liabilities held for trading and financial liabilities designated upon initial recognition as at fair value through profit or loss. Financial liabilities are classified as held for trading if they are incurred for the purpose of repurchasing in the near term. This category also includes derivative financial instruments entered into by the Company that are not designated as hedging instruments in hedge relationships as defined by IFRS 9. Gains or losses on liabilities held for trading are recognised in the income statement. Financial liabilities designated upon initial recognition at fair value through profit or loss are designated at the initial date of recognition, and only if the criteria in IFRS 9 are satisfied. The Company has not designated any financial liability as at fair value through profit or loss. Loans and borrowings This is the category most relevant to the Company. After initial recognition, interest-bearing loans and borrowings are subsequently measured at amortised cost using the EIR method. Gains and losses are recognised in profit or loss when the liabilities are derecognised as well as through the EIR amortisation process. Amortised cost is calculated by taking into account any discount or premium on acquisition and fees or costs that are an integral part of the EIR. The EIR amortisation is included as finance costs in the income statement. This category generally applies to interest-bearing loans and borrowings. Fees paid on the establishment of loan facilities are recognised as transaction costs of the loan to the extent that it is probable that some or all of the facility will be drawn down. In this case, the fee is deferred until the draw-down occurs. To the extent there is no evidence that it is probable that some or all of the facility will be drawn down, the fee is capitalized as a pre-payment for liquidity services and amortized over the period of the facility to which it relates. General and specific borrowing costs directly attributable to the acquisition, construction or production of qualifying assets, which are assets that necessarily take a substantial period of time to get ready for their intended use or sale, are added to the cost of those assets, until such time as the assets are substantially ready for their intended use or sale. Investment income earned on the temporary investment of specific borrowings pending their expenditure on qualifying assets is deducted from the borrowing costs eligible for capitalization.

Annual Report 2018-19
Standalone Financial Statements
All amounts in Euro’000, unless otherwise stated
165
Derecognition A financial liability is derecognised when the obligation under the liability is discharged or cancelled or expires. When an existing financial liability is replaced by another from the same lender on substantially different terms, or the terms of an existing liability are substantially modified, such an exchange or modification is treated as the derecognition of the original liability and the recognition of a new liability. The difference in the respective carrying amounts is recognised in the income statement. Offsetting of financial instruments Financial assets and financial liabilities are offset and the net amount is reported in the consolidated statement of financial position if there is a currently enforceable legal right to offset the recognised amounts and there is an intention to settle on a net basis, to realise the assets and settle the liabilities simultaneously.
A.6.2.8.3 Derivative financial instruments
Derivatives are initially recognised at fair value on the date a derivative contract is entered into and are subsequently remeasured to their fair value at the end of each reporting period. The accounting for subsequent changes in fair value depends on whether the derivative is designated as a hedging instrument, and if so, the nature of the item being hedged. The Company designates certain derivatives as either:
• hedges of the fair value of recognised assets or liabilities or a firm commitment (fair value hedges)
• hedges of a particular risk associated with the cash flows of recognised assets and liabilities and highly probable forecast transactions (cash flow hedges), or
• hedges of a net investment in a foreign operation (net investment hedges). At inception of the hedge relationship, the Company documents the economic relationship between hedging instruments and hedged items including whether changes in the cash flows of the hedging instruments are expected to offset changes in the cash flows of hedged items. The Company documents its risk management objective and strategy for undertaking its hedge transactions. The fair values of derivative financial instruments designated in hedge relationships are disclosed in note B.6.5.3. Movements in the hedging reserve in shareholders’ equity are shown in note B.6.5.3. The full fair value of a hedging derivative is classified as a non-current asset or liability when the remaining maturity of the hedged item is more than 12 months; it is classified as a current asset or liability when the remaining maturity of the hedged item is less than 12 months. Trading derivatives are classified as a current asset or liability. Cash flow hedges that qualify for hedge accounting The effective portion of changes in the fair value of derivatives that are designated and qualify as cash flow hedges is recognised in the cash flow hedge reserve within equity. The gain or loss relating to the ineffective portion is recognised immediately in profit or loss, within other gains/(losses).

Annual Report 2018-19
Standalone Financial Statements
All amounts in Euro’000, unless otherwise stated
166
When forward contracts are used to hedge forecast transactions, the Company generally designates the full change in fair value of the forward contract (including forward points) as the hedging instrument. In such cases, the gains or losses relating to the effective portion of the change in fair value of the entire forward contract are recognised in the cash flow hedge reserve within equity. The gain or loss relating to the effective portion of the cross currency interest rate swaps hedging foreign currency borrowings is recognised in profit or loss within finance cost at the same time as the interest expense on the hedged borrowings. When a hedging instrument expires, or is sold or terminated, or when a hedge no longer meets the criteria for hedge accounting, any cumulative deferred gain or loss in equity at that time remains in equity until the forecast transaction occurs, resulting in the recognition of a non-financial asset such as inventory. When the forecast transaction is no longer expected to occur, the cumulative gain or loss that were reported in equity are immediately reclassified to profit or loss. Derivatives that do not qualify for hedge accounting Certain derivative instruments do not qualify for hedge accounting. Changes in the fair value of any derivative instrument that does not qualify for hedge accounting are recognised immediately in profit or loss and are included in other gains/(losses). Accounting policies applied until March 31, 2018 The Company has applied IFRS 9 prospectively and has elected not to restate comparative information. As a result, the comparative information provided continues to be accounted for in accordance with the Company’s previous accounting policy.
Until March 31, 2018, the Company classified its financial assets in the following categories:
• financial assets at fair value through profit or loss,
• loans and receivables,
• held-to-maturity investments, and
• available-for-sale financial assets. a. Financial assets carried at fair value through profit or losses are initially recognised at fair value, and transaction costs are expensed in the income statement. Changes in the fair value of financial assets measured at fair value – either because they have been designated as such upon initial recognition or are held for trading – are recognised directly in the income statement. They are also reported as current assets if they are being held for trading or it can be reasonably expected that they will be converted within twelve months from the reporting date. b. Loans and receivables are initially recognised at fair value plus transaction costs. Loans and receivables that have fixed or determinable payments and are not listed on an active market are measured at amortised cost using the effective interest method less any necessary write-downs arising from impairments. They are reported in the statement of financial position under other receivables and other assets unless they are trade receivables and are recorded as non-current or current depending on their maturity period.

Annual Report 2018-19
Standalone Financial Statements
All amounts in Euro’000, unless otherwise stated
167
c. Financial assets held to maturity are initially recognised at fair value plus transaction costs. Financial assets held to maturity which exhibit fixed or determinable payments and a fixed maturity period, and which the Company wishes and is able to hold until maturity are measured at amortised cost and reported depending on their maturity period as non-current or current assets. The amortisation and losses arising from impairments are recognised in the statement of profit or loss.
d. Available-for-sale financial assets that have been classified as such upon initial recognition are measured at fair value plus transaction costs, provided that this can be determined, and then reported as non-current or current assets, depending on the expected time of sale. Gains and losses from changes in fair value are recorded net, i.e. after tax, and taken directly to equity (“Other comprehensive income”) until the financial asset has been derecognised.
A security is considered to be impaired if there has been a significant or prolonged decline in the fair value below its cost. To determine if an available-for-sale financial asset is impaired, the Company evaluates the duration and extent to which the fair value of the asset is less than its cost, and the financial health of and short-term business outlook for the investee (including factors such as industry and sector performance, changes in technology and operational and financing cash flows).
In the event that an asset is impaired permanently, however, the loss must be recorded directly in the income statement. If it is not possible to determine the fair value, for example with holdings in non-consolidated affiliated companies or other investments in companies, these assets are measured at cost.
Impairment of financial assets
(a) Assets carried at amortised cost The Company assesses at the end of each reporting period whether there is objective evidence that a financial asset or Company of financial assets is impaired. A financial asset or a Company of financial assets is impaired and impairment losses are incurred only if there is objective evidence of impairment as a result of one or more events that occurred after the initial recognition of the asset (a ‘loss event’) and that loss event (or events) has an impact on the estimated future cash flows of the financial asset or Company of financial assets that can be reliably estimated. Evidence of impairment may include indications that the debtors or a Company of debtors are experiencing significant financial difficulty, default or delinquency in interest or principal payments, the probability that they will enter bankruptcy or other financial reorganisation, and where observable data indicates that there is a measurable decrease in the estimated future cash flows, such as changes in arrears or economic conditions that correlate with defaults. For the loans and receivables category, the amount of the loss is measured as the difference between the asset’s carrying amount and the present value of estimated future cash flows (excluding future credit losses that have not been incurred) discounted at the financial asset’s original effective interest rate. The carrying amount of the asset is reduced and the amount of the loss is recognised in the consolidated income statement. If a loan or held-to-maturity investment has a variable interest rate, the discount rate for measuring any impairment loss is the current effective interest rate determined under the contract. As a practical expedient, the Company may measure impairment on the basis of an instrument’s fair value using an observable market price.

Annual Report 2018-19
Standalone Financial Statements
All amounts in Euro’000, unless otherwise stated
168
If, in a subsequent period, the amount of the impairment loss decreases and the decrease can be related objectively to an event occurring after the impairment was recognised (such as an improvement in the debtor’s credit rating), the reversal of the previously recognised impairment loss is recognised in the consolidated income statement. (b) Assets classified as available for sale The Company assesses at the end of each reporting period whether there is objective evidence that a financial asset or a Company of financial assets is impaired
Derivative financial instruments
Derivatives are initially recognised at fair value at the date the derivative contract is entered into, and are subsequently re-measured to their fair value at the end of each reporting period. The resulting gain or loss is recognised in profit or loss immediately unless the derivative is designated as a hedging instrument, in which event the timing of the recognition in profit or loss depends on the nature of the hedge relationship. The Company designates certain derivatives as hedges of highly probable forecast transactions or hedges of foreign currency risk of firm commitments as cash flow hedges. Derivative financial instruments that are not part of a hedging relationship are carried at fair value upon initial recognition, corresponding to the fair value of the consideration received or given in return. After initial recognition, derivative financial instruments are carried at fair value, which is based on the market value of the financial instrument. Any changes in fair value are recorded directly in profit or loss. Hedge accounting The Company designates fixed-to-fixed cross-currency interest-rate swaps as hedging instruments in cash flow hedges in respect of risk of variability, due to changes in foreign exchange rates, in EURO cash flows on financial assets and financial liabilities denominated in foreign currency. The Company also designates foreign currency forward contracts as hedging instruments in respect of risk of variability of cash flows due to cash flows in currencies denomination in other than the functional currency of the entity. Such hedges of foreign exchange risk on highly probable forecast cash flows are accounted for as cash flow hedges. At the inception of the hedge relationship, the entity documents the relationship between the hedging instrument and the hedged item, along with its risk management objectives and its strategy for undertaking various hedge transactions. Furthermore, at the inception of the hedge and on an ongoing basis, the Company documents whether the hedging instrument is highly effective in offsetting changes in fair values of the hedged item. Cash flow hedges The effective portion of changes in the fair value of derivatives that are designated and qualify as cash flow hedges is recognised in equity in ‘Cash Flow Hedge Reserve’. The gain or loss relating to the ineffective portion is recognised immediately in the income statement and is included in the line ‘Other Income or Other Operating Expenses’.

Annual Report 2018-19
Standalone Financial Statements
All amounts in Euro’000, unless otherwise stated
169
Amounts previously recognised in ‘Cash Flow Hedge Reserve’ and accumulated in equity are reclassified to the income statement in the periods when the hedged item affects income statement. The gain or loss relating to the effective portion of cross-currency interest-rate swaps is recognised in profit or loss within ‘finance costs’. However, when the forecast transaction that is hedged results in the recognition of a non-financial asset (for example, inventory or fixed assets) the gains and losses previously deferred in equity are reclassified from equity and included in the initial measurement of the cost of the asset. The deferred amounts are ultimately recognised in profit or loss as cost of goods sold in the case of inventory, or as depreciation or impairment in the case of fixed assets. Discontinuation of hedge accounting Hedge accounting is discontinued when the Company revokes the hedging relationship, when the
hedging instrument expires or is sold, terminated, or exercised, or it no longer qualifies for hedge
accounting. Any gain or loss accumulated in equity is reclassified from equity to income statement
in the same period or periods during which the hedged forecast cash flows affect the income
statement. If the underlying hedge transaction is no longer expected to occur, the amounts
accumulated in equity are immediately reclassified in full to the income statement.
B.6.2.6 Receivable from related parties Receivables are amounts due from subsidiaries and other related parties for the services charged to them.
B.6.2.7 Cash and cash equivalents Cash and cash equivalents consist of cash on hand/bank and short-term deposits with an original maturity three month or less. Because of the short term nature of Cash and cash equivalent, the Company recognises these at its contractual par amount. Similar to trade receivables, the Cash and cash equivalent involves one single cash flow which is the repayment of the principal. Therefore, the cash flows resulting from the receivables meet the SPPI test of payments of principal and interest despite the interest component being zero. The Company holds these balances in order to collect contractual cash flows. Cash and cash equivalent is therefore classified as measured at amortised cost. Cash and cash equivalents are also subject to the general approach. However, due to the fact that Cash and cash equivalent is repayable on demand, 12-month and lifetime expected losses are the same. The expected credit losses are considered insignificant.
B.6.2.8 Taxes Current taxes are those taxes foreseeably payable on a year’s taxable income in accordance with the statutory tax rates or tax rates that had been substantially adopted as of the reporting date, as well as all adjustments to payable taxes in relation to previous reporting periods.

Annual Report 2018-19
Standalone Financial Statements
All amounts in Euro’000, unless otherwise stated
170
Income taxes for the annual result reported in the income statement comprise current taxes and deferred taxes. Income taxes are recorded in the income statement unless they relate to items recognised directly in equity or in other comprehensive income. In this case, the income taxes incurred are also recognised directly in equity or in other comprehensive income. Deferred tax assets and liabilities are recognised for all temporary differences between the carrying amount as per IFRS and the relevant tax assessment basis. Deferred tax liabilities are not recognised for temporary differences (“outside-basis differences”) if the timing of the reversal of the temporary difference is controlled by the Company and it is probable that the temporary difference will not reverse in the foreseeable future. Deferred tax liabilities for dividends from subsidiaries will be recognised if the parent company determines that the profits of the respective subsidiary will be distributed in the foreseeable future. Deferred tax assets contain tax assets that are derived from the expected utilization of unused tax losses and unused tax credits, unless it is improbable that the future taxable profits will be available against which the temporary differences can be utilized. Deferred taxes are calculated on the basis of the tax rates that are expected to apply to the period when the asset is realized and the liability is settled, based on the tax rates that have been enacted or substantively enacted by the end of the reporting period in the respective country.
B.6.2.9 Recognition of income and expenses Service Income is income generated from services provided to associated companies based on agreed scope of services. Operating expenses are recognised when goods or services are used or when the expense is incurred. Interest expense is recognised using the effective interest method as an expense or income for the period in which it occurs. This allows a constant, periodic interest rate for the remainder of the liability to be calculated. Dividend income is recognised when the right to receive payment is established and disclosed separately in the income statement. Interest income is recognised on a pro-rata basis for the period funds were given to the subsidiaries using effective interest method as per the rate of interest mentioned in the loan agreements. Interest income is included in the finance income and costs in the income statement.
B.6.2.10 Property, plant and equipment Property, plant and equipment are stated at cost less accumulated depreciation and impairment losses, if any. Cost comprises the aggregate amount paid and the fair value of any other consideration given to acquire the asset and includes costs directly attributable to making the asset capable of operating as intended.
Annual Report 2018-19
Standalone Financial Statements
All amounts in Euro’000, unless otherwise stated
171
B.6.2.11 Changes in accounting policies and disclosures The IASB has adopted the following changes to existing IFRS and adopted new IFRS standards, which have also already been adopted by the European Commission, thereby making their application mandatory as for Financial Year 2018-19 to the extent relevant for the Company.
New standards and interpretations
During the financial year ended March 31, 2019, below mentioned amendments to IFRS became applicable to the Company, however these did not have any impact on the net asset, financial or income position of the Company.
• IFRS 9 Financial Instruments
• IFRS 15 Revenue from Contracts with Customers
• Annual Improvements 2014-2016 cycle
• Interpretation 22 Foreign Currency Transactions and Advance Consideration
The Company had to change its accounting policies following the adoption of IFRS 9 and IFRS 15.
This is disclosed below. Most of the other amendments listed above did not have any impact on
the amounts recognised in prior periods and are not expected to significantly affect the current or
future periods.
IFRS 9 Financial Instruments
IFRS 9 replaces the provisions of IAS 39 that relate to the recognition, classification and measurement of financial assets and financial liabilities, derecognition of financial instruments, impairment of financial assets and hedge accounting.
The adoption of IFRS 9 Financial Instruments from April 01, 2018 resulted in changes in accounting policies. However there were no adjustments to the amounts recognised in the financial statements. The new accounting policies are set out in note B.6.2.5 above. In accordance with the transitional provisions in IFRS 9(7.2.15) and (7.2.26), comparative figures have not been restated. The Company has assessed which business models apply to the financial assets and liabilities held by the Company and has classified its financial instruments into the appropriate IFRS 9 categories. There is no change in categories assessed on transition to IFRS 9. The foreign currency forwards and cross currency swaps in place as at March 31, 2018 qualified as cash flow hedges under IFRS 9. The Company’s risk management strategies and hedge documentation are aligned with the requirements of IFRS 9 and these relationships are therefore treated as continuing hedges. IFRS 15 Revenue from Contracts with Customers IFRS 15 replaces the existing standards on recognition of revenue and provides new principles for recognition of revenue. The new standard is based on the principle that revenue is recognised when control of a good or service transfers to a customer. The standard permits either a full

Annual Report 2018-19
Standalone Financial Statements
All amounts in Euro’000, unless otherwise stated
172
retrospective or a modified retrospective approach for the adoption. The Company has adopted modified retrospective approach whereby comparative information has not been restated. The Company provide management and support services to its subsidiairies and other relared parties. Revenue is recognised in the accounting period in which the services are rendered. There was no change in recognition of revenue under IFRS 15, hence no adjustment was required to made in these financials.
New standards and interpretations not yet adopted
Certain new accounting standards and interpretations have been published that are not mandatory for March 31, 2019 reporting periods and have not been early adopted by the Company. The Company’s assessment of the impact of these new standards and interpretations is set out below.
(i) IFRS 16 Leases
Nature of change : IFRS 16 was issued in January 2016. It will result in almost all leases being recognised on the balance sheet, as the distinction between operating and finance leases is removed. Under the new standard, an asset (the right to use the leased item) and a financial liability to pay rental are recognised. The only exceptions are short-term and low-value leases. The accounting for lessors will not significantly change. Impact : The Company is currently reviewing the impact of the new accounting standard, however given the relatively smaller lease expense, the change is not expected to result in significant adjustments. Mandatory application date/ Date of adoption by the Company : The Company will apply the standard from its mandatory adoption date of April 01, 2019. The Company intends to apply the Modified Retrospective approach and will not restate comparative amounts for the year prior to first adoption. Right-of-use assets for property leases will be measured on transition as if the new rules had always been applied. All other right-of-use assets will be measured at the amount of the lease liability on adoption (adjusted for any prepaid or accrued lease expenses). There are no other standards that are not yet effective and that would be expected to have a material impact on the entity in the current or future reporting periods and on foreseeable future transactions. (ii) IFRIC 23 – Uncertainty over Income Tax Treatments
In June 2017 the IASB issued IFRIC Interpretation 23 – Uncertainty over Income Tax Treatments which provides requirements regarding how to reflect uncertainties in accounting for income taxes. The interpretation is effective on or after 1 January 2019. The company does not expect any material impact from the adoption of this interpretation.

Annual Report 2018-19
Standalone Financial Statements
All amounts in Euro’000, unless otherwise stated
173
(iii) IFRS 9 – Prepayment Features with Negative Compensation
In October 2017 the IASB issued Amendments to IFRS 9 – Financial Instruments that allow, under certain conditions, for a prepayable financial asset with negative compensation payments to be measured at amortized cost or at fair value through other comprehensive income. The final amendments also contain a clarification relating to the accounting for a modification or exchange of a financial liability measured at amortized cost that does not result in the derecognition of the financial liability. The amendments are effective on or after 1 January 2019 and are not expected to have a material impact upon adoption.The following have been issued by the IASB but not yet endorsed by the European Union.
This space has been intentionally left blank

Annual Report 2018-19
Standalone Financial Statements
All amounts in Euro’000, unless otherwise stated
174
B.6.3 Disclosures regarding the Statement of Financial Position
B.6.3.1 Property, plant and equipment
Land Total
Cost
At April 01, 2017 341 341
Additions 14 14
At March 31, 2018 355 355
Additions - -
At March 31, 2019 355 355
This space has been intentionally left blank

Annual Report 2018-19
Standalone Financial Statements
All amounts in Euro’000, unless otherwise stated
175
B.6.3.2 Investment in subsidiaries
In line with IAS 27, the investments have been valued at cost in the company’s separate financial statements. A summary of movement in the investments is presented below:
Amount in €
At March 31, 2017 1,055,282
Investments during the year 21,900
At March 31, 2018 1,077,182
Investments during the year 194,916
At March 31, 2019 1,272,098
During the year, the Company contributed additional capital of k€ 21,898 into SMP Automotive Technology Ibérica, S.L. Further, during the year company acquired Reydel Automotive Group by acquiring shares in Reydel Automotive Management B.V. (renamed as SMRC Automotive Interiors Management B.V) and and Reydel Automotive Holding B.V. (renamed as SMRC Automotive Holdings B.V.) and paid a consideration of k€ 173,018 (kUSD 200,390). The fair value of net assets as of the acquisition date was € 185,196, the resulting gain on bargain purchase has been recognised in the consolidated financial statements of the Company, for more details refer Note A.6.3.1 B.6.3.2.1 Details of investments
The carrying value of investments in subsidiaries and the percentage of shareholding are as below:
Name of the entity Share March 31, 2019 March 31, 2018
Samvardhana Motherson Reflectec Group Holdings Limited 98.45% 905,716 905,716
Samvardhana Motherson Peguform GmbH 100% 3,804 3,804
SMP Automotive Interiors (Beijing) Co. Ltd 100% 6,000 6,000
SMP Automotive Technology Ibérica, S.L. 100% 183,560 161,662
SMP Automotive Systems México, S. A. de C. V. 00.00% 0 0
SMRC Automotive Holdings B.V. 85.26%* 145,052 -
SMRC Automotive Interiors Management B.V. 100% 27,966 -
Total 1,272,098 1,077,182
* represents direct shareholding, however held 100% indirectly via SMRC Automotive Interiors Management B.V.
B.6.3.2.2 Impairment of investments At the end of each reporting period, the Company performs a review of its investments to determine whether there were indications that any of these investments may have been impaired. The amount of impairment is the difference between the investments carrying amount and the recoverable amount. The recoverable amount is the higher of fair value less costs of disposal and the value in use. Calculation of recoverable amount is based on estimated future cash flows, discounted at the effective interest rate at the reporting date. As at the end of March 31, 2019 there were no indications of decline in the recoverable value and hence no impairment loss needs to be recognised in the financial statements.

Annual Report 2018-19
Standalone Financial Statements
All amounts in Euro’000, unless otherwise stated
176
B.6.3.2.3 Investments pledged as security
Shares in Samvardhana Motherson Reflectec Group Holdings Limited, Samvardhana Motherson Peguform GmbH, SMP Automotive Technology Ibérica, S.L. and SMRC Automotive Holdings B.V. have been pledged as security for borrowings, refer Note B.6.3.8 for details.
B.6.3.3 Loans to related parties
March 31, 2019 March 31, 2018
Non-current
Loans to related parties 756,742 669,288
The loans are given to subsidiaries and carry varying rates of interest from 4.50% to 5.60% determined on the basis of credit risk of the relevant subsidiary and costs of borrowings to the Company. The loans are revolving in nature and governed by a master agreement which provides for an ultimate repayment date extending beyond 12 months after March 31, 2019 and hence classified as non-current. The Company’s receivables are from its subsidiaries for which credit risk is perceived as insignificant. The maximum exposure to the credit risk is the carrying value of the loans.
B.6.3.4 Other financial instruments
March 31, 2019 March 31, 2018
Assets Liabilities Assets Liabilities
Non-current
Cross currency swaps 2,087 5,422 - 28,065
Current
Cross currency swaps 673 - - -
The Company has entered into fixed to fixed cross currency swaps in order to hedge against the fluctuations in USD/EURO foreign exchange rate related to its US$ 400 million notes (amount hedged US$ 235 million) and term loans US$ 60 million (amount hedged US$ 60 million). The terms of the US$ 235 million swaps are on fixed to fixed basis wherein the Company pays interest in EURO terms on a fixed interest rate and receives interest in USD terms on a fixed interest rate. The terms of the US$ 60 million swap are on fixed/floating to floating basis wherein the Company pays interest in EURO terms on variable rate linked to EURIBOR and receives interest in USD terms on a fixed interest basis for part of the amount as well as time and on variable basis linked to USD LIBOR on remaining amount and time. The maximum exposure to the credit risk is the carrying value of instruments. Please refer note B.6.5.3 for more details.
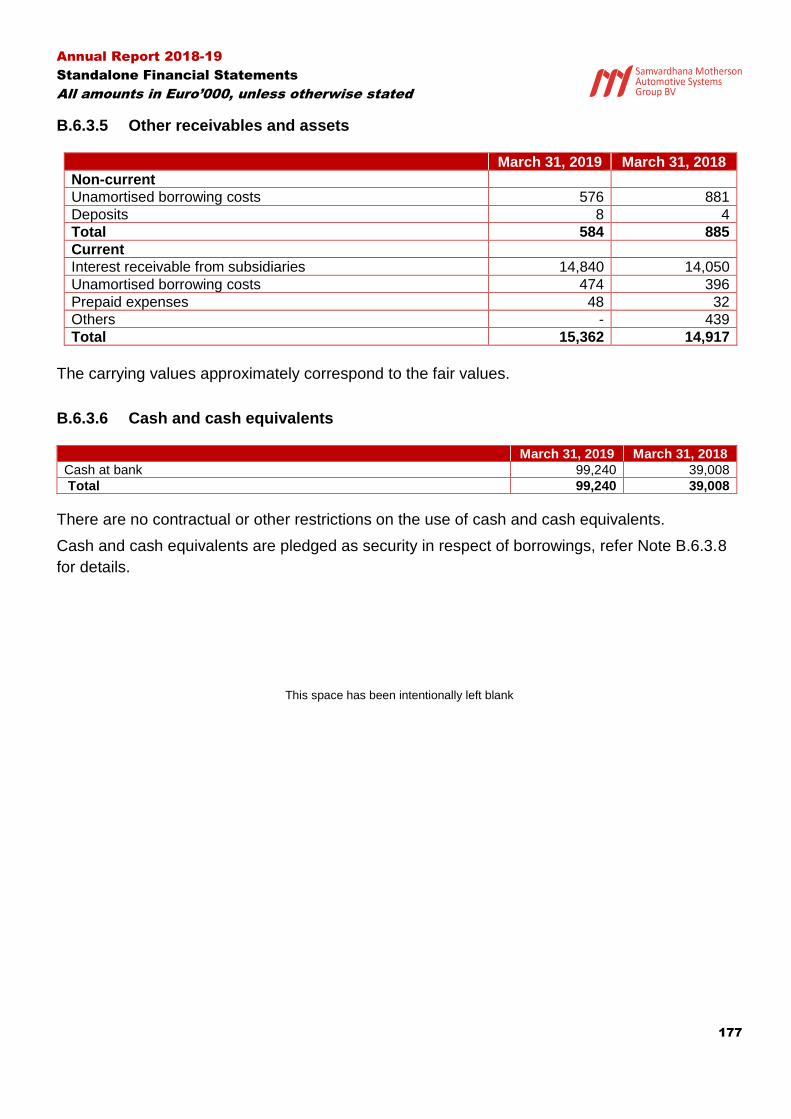
Annual Report 2018-19
Standalone Financial Statements
All amounts in Euro’000, unless otherwise stated
177
B.6.3.5 Other receivables and assets
March 31, 2019 March 31, 2018
Non-current
Unamortised borrowing costs 576 881
Deposits 8 4
Total 584 885
Current
Interest receivable from subsidiaries 14,840 14,050
Unamortised borrowing costs 474 396
Prepaid expenses 48 32
Others - 439
Total 15,362 14,917
The carrying values approximately correspond to the fair values.
B.6.3.6 Cash and cash equivalents
March 31, 2019 March 31, 2018
Cash at bank 99,240 39,008
Total 99,240 39,008
There are no contractual or other restrictions on the use of cash and cash equivalents.
Cash and cash equivalents are pledged as security in respect of borrowings, refer Note B.6.3.8
for details.
This space has been intentionally left blank

Annual Report 2018-19
Standalone Financial Statements
All amounts in Euro’000, unless otherwise stated
178
B.6.3.7 Equity
The authorised share capital of the Company amounts to € 90,000, divided into 90,000 shares with a nominal value of € 1 each. The issued and paid in capital amounts to € 66,176, divided into 66,176 shares with a nominal value of € 1 each held by Samvardhana Motherson Global Holdings Limited (45,676 shares) and Samvardhana Motherson Polymers Limited (20,500 shares). Movement during the period can be summarised as follows:
Number of equity shares (in No.s)
Share Capital (in €’000)
As at March 31, 2017 66,176 66
Add: Issued during the year - -
As at March 31, 2018 66,176 66
Add: Issued during the year - -
As at March 31, 2019 66,176 66
Share premium On June 13, 2014 The company issued 45,676 shares of € 1 each to Samvardhana Motherson Group Holdings Limited, Cyprus in lieu of acquisition of 98.45% interest in Samvardhana Motherson Reflectec Group Holdings Limited, Jersey for a non-cash consideration of k€ 905,716 consisting of € 45,676 towards share capital and transfer of k€ 12,250 loan from MSSL Mideast (FZE), the remaining amount of k€ 893,420 was recognised as share premium. As a result of this transaction, SMRP BV became subsidiary of SMGHL and SMR became subsidiary of SMRP BV. The Company also received share premium contributions amounting to k€7,490 in the previous years from its other shareholder Samvardhana Motherson Polymers Limited. Cash flow hedge reserve The Company uses cross currency interest rate swaps (‘swaps’) as hedging instruments for its foreign currency risk associated with foreign currency borrowings. The hedging reserve is used to record gains or losses on such hedging instruments that are designated and qualify as cash flow hedges and that are recognised in other comprehensive income. The foreign exchange gain or loss on the portion of borrowings hedged by swaps is reclassified from cash flow hedge reserve to profit or loss and recognised within ‘finance cost’. No approporiations can be made out of cash flow hedge reserve. Please refer note B.6.5.3 for more details. Retained earnings The retained earnings represent accumulated gains which have been transferred to the reserves and have not been approproiated or distributed as dividend to shareholders. The profits for the current year have been transferred to retained earnings.

Annual Report 2018-19
Standalone Financial Statements
All amounts in Euro’000, unless otherwise stated
179
B.6.3.7.1 Differences between the company equity and the Company’s consolidated equity
The difference between the company’s standalone equity and the Company’s consolidated equity is explained by the fact that the company’s investments in subsidiaries are eliminated against their net asset value in the consolidated financial statements; however these are accounted for at historical costs in the company financial statements. Further differences can be explained by the results on intercompany transactions. The difference between the company and Company’s consolidated equity and result for the year can be shown as follows:
March 31, 2019 March 31, 2018
Equity in accordance to the consolidated financial statements 791,987 654,434
Add: negative net asset values of consolidated subsidiary companies (523,794) (362,556)
Add: not realised cumulative intercompany results 820,669 683,597
Equity in accordance to the company financial statements 1,088,862 975,475
B.6.3.7.2 Difference in results Year ended
March 31, 2019 Year ended
March 31, 2018
Result for the year in accordance to the consolidated financial statements 105,975 138,365
Result of consolidated subsidiary companies (125,246) (152,705)
Results on Intercompany transactions 128,250 31,344
Result for the year in accordance to the company financial statements
108,979 17,004
B.6.3.8 Borrowings
March 31, 2019 March 31, 2018
Non-current
Notes (at amortized cost) 747,029 713,367
Term Loan from banks 52,684 -
Loans from related parties 150,000 -
Non-current borrowings 949,713 713,367
Current
Bank loans 62,405 69,218
Loans from related parties 24,500 -
Current borrowings 86,905 69,218
(i) Secured liabilities and assets pledged as security
a) Notes The Notes are structured as senior secured obligations and rank ‘pari passu’ in right of payment with all the existing and future senior obligations of SMRP BV, including the obligations under the Revolving Credit Facility. The Notes are guaranteed on a senior secured basis by certain subsidiaries of SMRP BV and are secured by share pledge and security interests granted over

Annual Report 2018-19
Standalone Financial Statements
All amounts in Euro’000, unless otherwise stated
180
certain property and assets of SMRP BV and certain of its subsidiaries. As of March 31, 2019, the Company has issued below mentioned notes which were outstanding on the date referred –
Principal amount Coupon rate (fixed) Maturity
€ 100 million 3.700% 18 June 2025 US$ 400 million 4.875% 16 December 2021 € 300 million 1.80% 06 July 2024
b) Term Loan
During the period, the Company entered into a term loan facility agreement for US$ 60 million for a period of 59 months maturing August 2023. The term loan is senior secured obligation and rank ‘pari passu’ in right of payment with all the existing and future senior obligations of SMRP BV, including the obligations under the Revolving Credit Facility and the Notes and carry the same security structure as existing Notes and Revolving Credit Facility. c) Bank Loans Borrowings from banks represent utilisations under the Revolving Credit Facility Agreement and are secured as mentioned above. d) Loans from related parties Loans from related parties represents unsecured loan amounting to Euro 150 million obtained from Samvardhana Motherson Global Holdings Ltd., Cyprus (SMGHL), one of the company’s shareholders. The interest rate on the loan is 5.99% and it will mature on 19th July 2026. Further the Company also received loans from its subsidiaries during the year. As of March 31, 2019 there was an outstanding of k€ 24,500 in respect of such loans. (ii) Fair value The Company’s Notes are listed on Irish Stock Exhcnage and their fair values are as below -
March 31, 2019 March 31, 2018
Carrying amount Fair value Carrying amount Fair value
€ 100 million 98,473 92,504 98,260 103,975
US$ 400 million 354,686 357,356 322,322 328,178
€ 300 million 293,870 264,237 292,785 287,187
Fair values of the notes represent traded value on Irish Stock Exchange where these notes are listed and they are classified as below –
As at March 31, 2019 Level 1 Level 2 Level 3
€ 100 million - - 92,504
US$ 400 million 357,356 - -
€ 300 million 264,237 - -
As at March 31, 2018 Level 1 Level 2 Level 3
€ 500 million - - 103,975
€ 100 million 328,178 - -
US$ 400 million 287,187 - -

Annual Report 2018-19
Standalone Financial Statements
All amounts in Euro’000, unless otherwise stated
181
Euro 100 million notes are held by a limited set of investors and are not very actively traded on the stock exchange, as a result the fair value of these notes is based on computed prices and hence fall in Level 3 hierarchy. Fair value of other loans is considered to be same as carrying value. Net debt reconciliation This section sets out an analysis of net debt and the movements in net debt for each of the periods presented.
March 31, 2019 March 31, 2018
Cash and Cash equivalents 99,240 39,008
Borrowings – repayable within one year (86,905) (69,218)
Borrowings – repayable after one year (949,713) (713,367)
Net Debt (937,378) (743,577)
Cash and Cash
equivalents Notes
Other Borrowings
Loans from related parties
Net Debt
As at April 01, 2017 361,260 (959,303) - (17,400) (615,443)
Cash flows (314,401) 208,000 (71,751) 17,400 (160,752)
Foreign exchange adjustments
(7,851) 50,598) 2,533 - 45,280
Other non-cash movements
- (12,662) - -
(12,662)
As at March 31, 2018 39,008 (713,367) (69,218) - (743,577)
Cash flows 64,521 - (38,927) (174,500) (148,906)
Foreign exchange adjustments
(4,289) (31,752) (6,849) - (42,890)
Other non-cash movements
- (1,910) (95) - (2,005)
As at March 31, 2019 99,240 (747,029) (115,089) (174,500) (937,378)
Other non-cash movements for represent amortisation of issue costs related to Notes and term loan issued by the Company.
B.6.3.9 Other liabilities March 31, 2019 March 31, 2018
Non-current
Interest on loans from related parties (note 1 below) 2,385 -
Total 2,385 -
Current
Interest and commitment fee on borrowings 11,114 10,890
VAT payable 0 19
Accrued expenses 2,164 4,431
Other payables 1,521 1,233
Total 14,799 16,573
1. As per the terms of the loan from SMGHL, interest is payable on maturity date of loan i.e. 19th June 2026 or repayment whichever is earlier.

Annual Report 2018-19
Standalone Financial Statements
All amounts in Euro’000, unless otherwise stated
182
B.6.4 Disclosures regarding the Income Statement
B.6.4.1 Service income Year ended
March 31, 2019 Year ended
March 31, 2018
Management Services 837 654
Internal audit - 72
General Services - 618
Total 837 1,344
B.6.4.2 Dividend income Year ended
March 31, 2019 Year ended
March 31, 2018
Samvardhana Motherson Peguform GmbH 39,000 39,000
SMP Automotive Technology Ibérica, S.L. 4,500 7,500
SMRC Automotive Holdings B.V. 55,000 - Total 98,500 46,500
B.6.4.3 Personnel expenses Year ended
March 31, 2019 Year ended
March 31, 2018
Salaries and wages 296 402
Social security costs 64 41
Other expenses 46 78
Total 406 521
For the year ended March 31, 2019 the Company has employed 3 persons (March 31, 2018 : 3 employees) (including part-time employment) based out of the Netherlands.

Annual Report 2018-19
Standalone Financial Statements
All amounts in Euro’000, unless otherwise stated
183
B.6.4.4 Other operating expenses Year ended
March 31, 2019 Year ended
March 31, 2018
General and administration expenses 1,985 2,220
Auditors remuneration 486 789
Foreign exchange loss (net) 12 56
Legal and professional expenses 1,084 3,719
Total 3,567 6,784
During the year ended March 31, 2019, following amounts were recorded in respect of fee (excluding VAT) paid to auditor for various services
Ernst & Young Accountants LLP
Other EY Network Total EY Network
Audit of the financial statements 115 324 439
Tax services1) - 7 7
Other non-audit services1) - 65 65
Total 115 396 511
The fees listed above relate to the procedures applied to the Company by accounting firms and external auditors forming part of Ernst & Young network; as referred to in Section 1, subsection 1 of the Audit Firms Supervision Act (‘Wet toezicht accountantsorganisaties - Wta’). For details on remuneration related to the consolidated group, please refer note A.6.4.6 of the consolidated financial statements. During the year ended March 31, 2018, following amounts were recorded in respect of fee (without VAT) paid to auditor for various services
Ernst & Young Accountants LLP
Other EY Network Total EY Network
Audit of the financial statements 84 320 404
Total 84 320 404
1) Included in legal and professional expenses
The fees listed above relate to the procedures applied to the Company and its consolidated group entities by accounting firms and external auditors forming part of PricewaterhouseCoopers network; as referred to in Section 1, subsection 1 of the Audit Firms Supervision Act (‘Wet toezicht accountantsorganisaties - Wta’). Above fee does not include fee for procedures performed by previous auditor for a part of the year before appointment of Ernst & Young as auditor for the year ended March 31, 2019.

Annual Report 2018-19
Standalone Financial Statements
All amounts in Euro’000, unless otherwise stated
184
B.6.4.5 Finance income and costs
Year ended March 31, 2019
Year ended March 31, 2018
Interest Income 38,443 31,584
Foreign exchange gain (net) 6,863 -
Total finance income 45,306 31,584
Foreign exchange losses (net) - 2,857
Interest expense on borrowings 29,244 39,574
Amortisation of borrowing costs 2,447 12,688
Total finance costs 31,691 55,119
Foreign exchange gain / loss contain amounts from the revaluation and settlement of foreign currency borrowings and cash and bank balances. Interest income recorded above is in line with effective interest rate method. On July 06, 2017 the Company issued € 300 million 1.8% Senior Secured Notes due 2024. The proceeds from these notes together with the cash available were utilised to prepay outstanding € 500 million 4.125% Senior Secured Notes due 2021. Accordingly, redemption premium and unamortised transaction costs amounting to k€ 21,153 were charged to the income statement for the year ended March 31, 2018.
B.6.4.6 Income taxes Deferred income taxes are calculated using the balance-sheet based liability method. Deferred tax assets and liabilities are recognised for all temporary differences between the carrying amount of an asset or liability and the values used for taxation purposes. However no deferred tax assets are recognised on current year and carry-forward tax losses as it is not certain when such assets will be reversed against taxable income. The income tax expense comprises the following:
Year ended March 31, 2019
Year ended March 31, 2018
Current tax expense - -
Deferred tax expense - -
Total - -
The general tax rate for the Company is 25% as per the corporate tax laws prevailing in the Netherlands. A reconciliation of tax expense and accounting profit is presented below
Year ended March 31, 2019
Year ended March 31, 2018
Earnings before tax 108,979 17,004
Tax on profits /(losses) 27,245 4,251
Deferred tax asset not recognised on loss - 7,374
Tax impact on dividends (exempt from tax) (24,625) (11,625)
Carry forward losses utilized (2,620) -
Tax expense - -
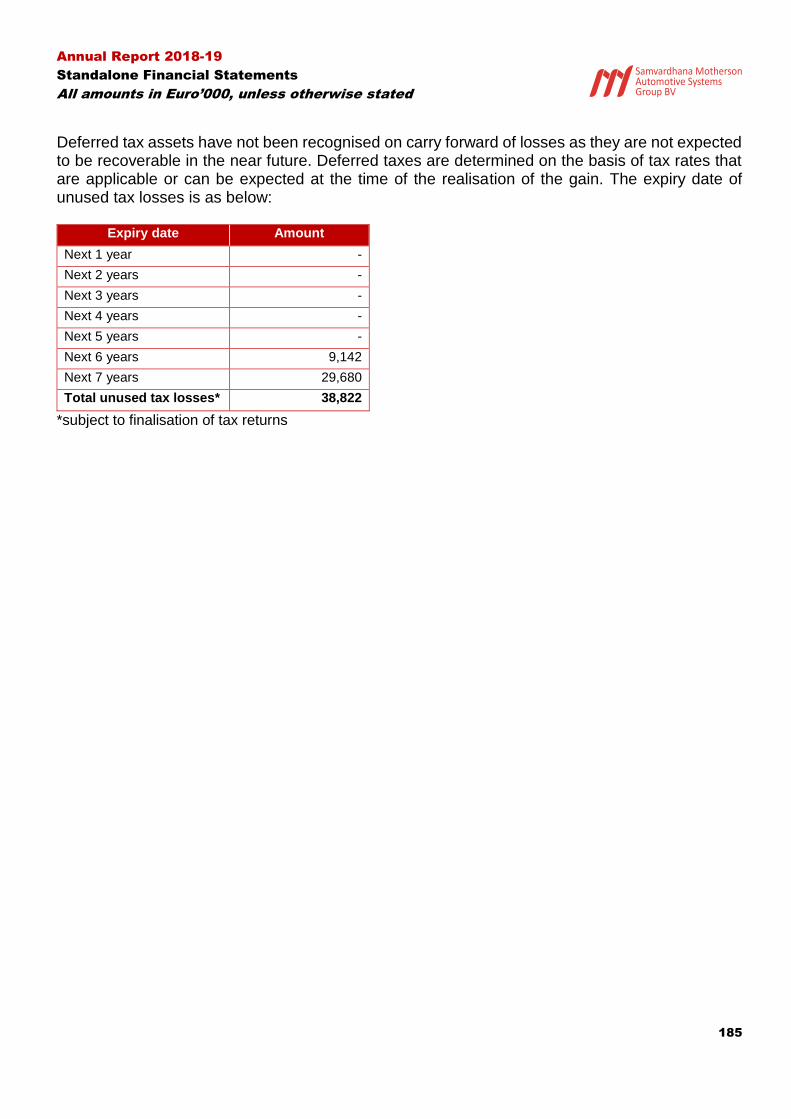
Annual Report 2018-19
Standalone Financial Statements
All amounts in Euro’000, unless otherwise stated
185
Deferred tax assets have not been recognised on carry forward of losses as they are not expected to be recoverable in the near future. Deferred taxes are determined on the basis of tax rates that are applicable or can be expected at the time of the realisation of the gain. The expiry date of unused tax losses is as below:
Expiry date Amount
Next 1 year -
Next 2 years -
Next 3 years -
Next 4 years -
Next 5 years -
Next 6 years 9,142
Next 7 years 29,680
Total unused tax losses* 38,822
*subject to finalisation of tax returns
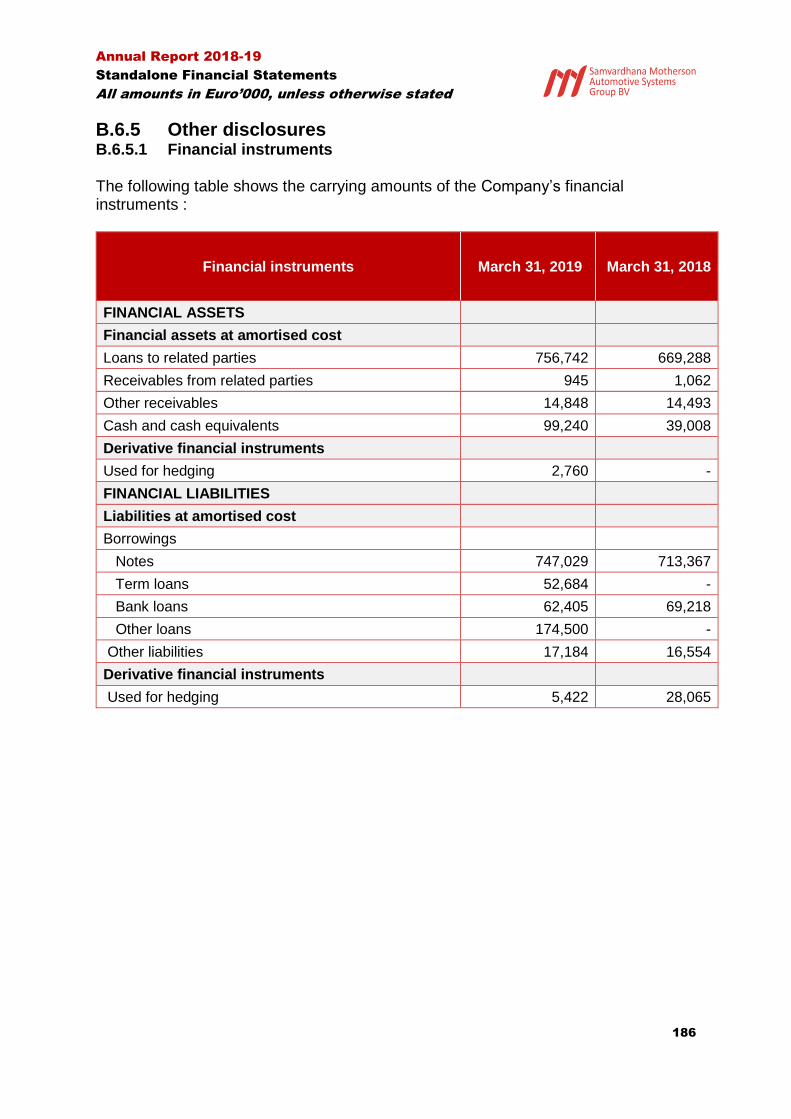
Annual Report 2018-19
Standalone Financial Statements
All amounts in Euro’000, unless otherwise stated
186
B.6.5 Other disclosures B.6.5.1 Financial instruments
The following table shows the carrying amounts of the Company’s financial instruments :
Financial instruments March 31, 2019 March 31, 2018
FINANCIAL ASSETS
Financial assets at amortised cost
Loans to related parties 756,742 669,288
Receivables from related parties 945 1,062
Other receivables 14,848 14,493
Cash and cash equivalents 99,240 39,008
Derivative financial instruments
Used for hedging 2,760 -
FINANCIAL LIABILITIES
Liabilities at amortised cost
Borrowings
Notes 747,029 713,367
Term loans 52,684 -
Bank loans 62,405 69,218
Other loans 174,500 -
Other liabilities 17,184 16,554
Derivative financial instruments
Used for hedging 5,422 28,065

Annual Report 2018-19
Standalone Financial Statements
All amounts in Euro’000, unless otherwise stated
187
Due to the short-term nature of cash and cash equivalents and the short-term maturities of receivables from related parties, trade payables, other receivables and liabilities, their fair values are equal to their carrying amounts. A description of the Company’s financial instrument risks, including risk management objectives and policies is given in note B.6.5.3.
B.6.5.2 Contingent Liabilities
The Company has issued senior secured notes and entered into term loan and revolving credit facilities agreements. As per the terms of the agreements, the Company is the initial guarantor to these borrowings and has provided security of its bank accounts along with assets of certain of its subsidiaries for these borrowings. Refer Note B.6.3.8 for details on the arrangement. The Company has further given corporate guarantees to various financial institutions in respect of working capital facilities and/or letters of credit extended by those financial institutions to the Company’s subsidiaries. As at March 31, 2019 total amount of such corporate guarantees outstanding was k€ 13,281 (March 31, 2018 : k€ 26,334) representing the utilised limits of those facilities. The Company has acted as surety in respect of subsidy received by one of its subsidiary, which
limits the total liability of the Company to the amount of subsidy. As at March 31, 2019 the
Company may be contingently liable for k€ 26,778 (March 31, 2018 : k€ 15,101) in the event of
non-compliance of subsidy conditions by the subsidiary.
For such financial guarantees issued by the Company, there is no expected default and therefore
the financial guarantees are not recognised.
B.6.5.3 Risk management with respect to financial risks The Company’s primary financial assets and liabilities include loans given to its subsidiaries and borrowings from third parties. The Company’s financial assets like receivables, cash and cash equivalents arise directly out of these primary financial assets and liabilities. These financial instruments are potentially exposed to foreign currency risk, credit risk and liquidity risk. Information on how these risks arise is set out below, as are the objectives, policies and processes agreed by the board for their management and the methods used to measure each risk. The objective of the Company’s treasury is to manage the financial risk, secure cost-effective funding for the Company and its subsidiaries operations and to minimise the adverse effects of fluctuations in the financial markets on the value of the Company’s financial assets and liabilities, on reported profitability and on the cash flows of the Company. The treasury team is accountable to the board. The Company gives due consideration to its risk mitigation process and ensures that appropriate measures are taken to avoid, reduce and transfer or intentionally accept risk. During the period

Annual Report 2018-19
Standalone Financial Statements
All amounts in Euro’000, unless otherwise stated
188
the Company did not enter into any complex financial instruments nor had established any hedge relationship. Credit risk Credit risk is the risk that a counterparty will not meet its obligations under a financial instrument or customer contract, leading to a financial loss. Credit risk arises from cash and cash equivalents, trade and other receivables, loan to subsidiaries, financial instruments entered into by the Company. For banks and financial institutions, the Company maintain relationships with only creditworthy banks which it reviews on an on-going basis. Consequently, the credit risk related to bank balances and financial instruments is not considered material. Loans given to subsidiaries, trade and other receivables represent balances with subsidiaries and other related parties, accordingly credit risk is perceived as insignificant. The following table shows the ageing of trade and other receivables:
Total Not overdue Over due
< 30 days
30-90 days
90-180 days
180-360 days
>360 days
March 31, 2019
Receivables from related parties
945 614 - 80 - - 251
Cash and cash equivalents
99,240 99,240 - - - - -
Interest receivable 14,840 10,404 2,218 2,206 12
Deposits 8 8 - - - - -
March 31, 2018
Receivables from related parties
1,062 75 - 361 10 - 616
Cash and cash equivalents
39,008 39,008 - - - - -
Interest receivable 14,050 8,557 (183) 1,568 706 240 3,162
Deposits 4 4 - - - - -

Annual Report 2018-19
Standalone Financial Statements
All amounts in Euro’000, unless otherwise stated
189
Liquidity risk Liquidity risk is the risk that the Company may encounter difficulty in meeting obligations associated with financial liabilities that are settled by delivering cash or another financial asset. The treasury is responsible for liquidity, funding as well as settlement management. In addition, liquidity and funding risks, related processes are overseen by management regularly. Financial liabilities for which the corresponding counterparty can demand repayment at any time are assigned to the earliest possible time period. The following table shows the remaining contractual maturities of financial liabilities of the Company presented on a gross and undiscounted basis and include estimated interest payments and exclude the impact of netting arrangements:
Financial Liabilities March 31, 2019
Less Than 1 Year
1 to 5 years More than 5 years
Total
Non-derivative financial liabilities
Borrowings (non-current) 16,6711) 488,454 625,696 1,130,821
Borrowings (current) 87,0621) - - 87,062
Other liabilities 14,799 - 2,385 17,184
Total 118,532 488,454 628,081 1,235,067
Derivative financial liabilities (5,128)1) (4,225) - (9,353)
1) Accrued interest as of March 31, 2019 is included in other financial liabilities
Financial Liabilities March 31, 2018
Less Than 1 Year
1 to 5 years More than 5 years
Total
Non-derivative financial liabilities
Borrowings (non-current) 13,4372) 408,529 419,002 840,968
Borrowings (current) 69,2802) - - 69,280
Other liabilities 16,554 - - 16,554
Total 99,271 408,529 419,002 926,802
Derivative financial liabilities (2,380)2) 13,375 - 10,995
2) Accrued interest as of March 31, 2018 is included in other financial liabilities Market risk Interest rate risk Due to the fixed terms of interest at which majority of the borrowings are obtained and fixed terms for loans given to subsidiaries, the Company is not exposed to significant cash flow interest rate risk on financial assets and liabilities. The terms of revolving credit facility provides Euribor and LIBOR as the relevant base rate for amounts utilised under the facility whereas US$ term loans has been fully hedged with a cross currency swap wherein Company has to pay interest in EUR based on EURIBOR movement, however given the current weak Euribor rates, the management does not expect any material impact of future changes in the Euribor. In respect

Annual Report 2018-19
Standalone Financial Statements
All amounts in Euro’000, unless otherwise stated
190
of USD denomination utilisations from the revolving credit facility, the variability in LIBOR rates is not considered to be significant enough. Foreign currency risk The Company is also exposed to market risk with respect to changes in foreign exchange rates. These changes may affect the operating result and financial position. Foreign exchange risk arises from loans given to few subsidiaries in USD and the related interest receivable and also the unhedged portion of USD denominated senior secured notes and interest arising thereon. In such cases, the Company usually borrow funds in USD and advances such funds to relevant subsidiary in USD, thereby achieving natural hedge. The Company is exposed to foreign exchange risk arising from its US$ 400 million senior secured notes and US$ 60 million term loan. The Company has in place fixed to fixed cross currency interest rate swaps amounting to US$ 235 million in order to hedge against the fluctuations in USD/EURO foreign exchange rate for its US$ 400 million senior secured notes. The terms of the swap are on fixed to fixed basis wherein the Company pays interest in EURO terms on fixed interest rate and receives interest in USD terms on fixed interest rate. With respect to US$ 60 million term loan, the company has undertaken cross currency interest rate swaps to hedge against the foreign exchange fluctuation. The terms of the swap also includes exchange of interest on the nominal EURO and USD amounts of the swap. The Company receives interest under the swap in USD at rate similar to interst payable on term loan and pays interest under the swap based on Euribor + Margin. As at March 31, 2019
Carrying amount of Hedge instrument
Nominal value of hedging instrument
Maturity date Hedge ratio
Weighted average strike price
Changes in fair value of hedging
instrument
Change in the value of
hedged item
Assets Liabilities
- 5,422 US$ 175 million 15 December 2021 1:1 1.11 17,947 17,680
673 - US$ 60 million 14 June 2019 1:1 1.14 5,371 5,371
2,087 - US$ 60 million 29 August 2023 1:1 1.17 2,087 1,953
As at March 31, 2018
Carrying amount of Hedge instrument
Nominal value of hedging
instrument
Maturity date Hedge ratio
Weighted average strike price
Changes in fair value of hedging
instrument
Change in the value of
hedged item
Assets Liabilities
- 23,367 US$ 175 million 15 December 2021 1:1 1.11 (2,657) (26,871)
- 4,698 US$ 60 million 14 June 2019 1:1 1.14 (4,698) (4,687)
Cash flow hedge reserve
Below is the movement in cash flow hedge reserve for the period
Opening Balance as at April 01, 2017 (2,848)
Add: change in fair value of hedging instrument recognised in OCI for the year (effective portion)
(31,569)
Less: reclassification to foreign exchange gain (finance costs – net) 26,260

Annual Report 2018-19
Standalone Financial Statements
All amounts in Euro’000, unless otherwise stated
191
Closing balance as at March 31, 2018 (8,157)
Add: change in fair value of hedging instrument recognised in OCI for the year (effective portion)
25,270
Less: reclassification to foreign exchange gain (finance costs – net) (20,862)
Closing balance as at March 31, 2019 (3,749)
During the year, hedge ineffectiveness gain of k€ 134 (March 31, 2018 : Nil) was recognised in
the statement of profit or loss. The Company’s hedging policy only allows for effective hedge
relationships to be established. Hedge effectiveness is determined at the inception of the hedge
relationship, and through periodic prospective effectiveness assessments to ensure that an
economic relationship exists between the hedged item and hedging instrument. The Company
enters into hedge relationships where the critical terms of the hedging instrument match exactly
with the terms of the hedged item, and so a qualitative assessment of effectiveness is performed.
The Company uses the hypothetical derivative method to assess effectiveness.
Unhedged receivables and liabilities in foreign currencies as of the reporting date are listed in the following table:
In USD March 31, 2019 March 31, 2018
Loans and other receivables 249,020 239,931
Borrowings 235,000 201,000
Other payables 2,775 2,468
The Company conducted sensitivity analyses at year-end to estimate the currency risk of these monetary financial instruments. If the Euro were to depreciate by 10% against the USD, receivables would increase by k€ 24,667 as on March 31, 2019 and if it were to appreciate by 10%, receivables would decrease by k€ 20,182. If the Euro were to depreciate by 10% against the Euro, borrowings and payables would increase by k€ 23,553 as on March 31, 2019 and if it were to appreciate by 10%, borrowings and payables would decrease by k€ 19,271. Net impact on equity would be gain of k€ 1,114 and a loss of k€ 911 in the mentioned two conditions respectively.

Annual Report 2018-19
Standalone Financial Statements
All amounts in Euro’000, unless otherwise stated
192
Capital management The Company’s objectives when managing capital are to safeguard the Company’s ability to continue as a going concern in order to provide returns for shareholders and benefits for other stakeholders and to maintain an optimal capital structure to reduce the cost of capital. Consistent with others in the industry, the Company monitors Net Debt to EBITDA ratio on a
group level: Net debt (total borrowings net of cash and cash equivalents) divided by EBITDA
(Profit before tax plus depreciation and amortization expense plus finance costs).
The Company is not subject to any capital requirements on the basis of its Articles of Incorporation. Certain capital requirements were contractually imposed in loan agreements with the financial institutions. As per the terms of the Notes and Revolver Credit Facilities referred to in note B.6.3.7, the Company is required to maintain financial covenants of net leverage ratio not exceeding 3.25x and net interest cover ratio more than 3.0x calculated on the Company’s consolidated financial statements. For more details refer note A.6.6.3 of the Consolidated Financial Statements. Upon the occurrence of any event of default under any of the Revolving Credit Facilities Agreements or the Notes, subject to applicable cure periods and other limitations on acceleration or enforcement, the relevant creditors/Trustee could elect to declare all amounts outstanding, together with accrued interest, immediately due and payable and cancel the availability of the facilities, as applicable. As at March 31, 2019 both the covenants have been met.

Annual Report 2018-19
Standalone Financial Statements
All amounts in Euro’000, unless otherwise stated
193
B.6.5.4 Related parties During the year the Company entered into transactions, in the ordinary course of business, with related parties. Transactions entered into, include the sale and purchase of goods and services. In addition, financing transactions have been undertaken. Entities with significant influence over the Company
Samvardhana Motherson Global Holdings Limited (“SMGHL”), Cyprus, the direct parent entity of the Company holds 69% of the voting shares in the Company. Samvardhana Motherson Polymers Limited (“SMPL”), India holds 31% of the voting shares in the Company. SMGHL and SMPL are both indirectly held by MSSL (which prepares financial statements available for public use) and by Samvardhana Motherson International Limited (“SAMIL”). MSSL effectively holds 51% of the voting shares in the Company and therefore considered as Ultimate parent entity. SAMIL holds 49% of the voting shares in the Company. As a result, MSSL and SAMIL and their direct and indirect held subsidiaries, except for the companies forming the Company are considered as related parties. Key Management Personnel Members of the management and supervisory board are considered to be Key Management Personnel as they are charged with the responsibility for planning, directing and controlling the activities of the Company.
Few of the KMP’s receives sitting fee from the Company but no other remuneration as they are
either the shareholders of substantial shareholders of the Company or these have operational
role in other group companies and draw their remuneration from those companies and for which
no recharge is made as their services to SMRP BV is considered incidental to their wider role.
There are no different roles and responsibilities for individual board member as all the directors
are charged with managing the company affairs, therefore a split of directors fee between
executive and non-executive directors is not presented.

Annual Report 2018-19
Standalone Financial Statements
All amounts in Euro’000, unless otherwise stated
194
B.6.5.4.1 Details of related party transactions
Year ended March 31, 2019
Fellow Subsidiaries
Key management
personnel
Entities with
significant influence
Other related parties
Subsidiaries Total
Services rendered - - - - 837 837
Interest on loans given - - - - 38,442 38,442
Dividend received - - - - 98,500 98,500
Services received 91 - - - - 91
Legal and professional expenses
42 - - 537 - 579
Interest on loans taken - - - 2,386 268 2,654
General administration expenses
73 - - 57 440 570
Directors fee - 161 - - - 161
Loans given - - - - 546,006 546,006
Loans received back - - - - 478,630 478,630
Loans taken - - - 150,000 79,500 229,500
Loans repaid - - - - 55,000 55,000
Year ended March 31, 2018
Fellow Subsidiaries
Key management
personnel
Entities with
significant influence
Other related parties
Subsidiaries Total
Services rendered - - - 10 1,334 1,344
Interest on loans given 4 - - - 31,143 31,147
Dividend received - - - - 46,500 46,500
Services received 93 - - - - 93
Legal and professional expenses
113 - - 23 262 398
Interest on loans taken - - - - 33 33
General administration expenses
54 - - 14 838 906
Directors fee - 113 - - - 113
Loans given 4,000 - - - 455,213 459,213
Loans received back 4,000 - - - 251,233 255,233
Loans repaid - - - - 17,400 17,400

Annual Report 2018-19
Standalone Financial Statements
All amounts in Euro’000, unless otherwise stated
195
B.6.5.4.2 Details of related party balances
As at March 31, 2019
Fellow Subsidiaries
Key management
personnel
Entities with significant influence
Other related parties
Subsidiaries Total
Receivables - - - - 945 945
Interest receivable - - - - 14,840 14,840
Interest Payable - - - 2,385 268 2,653
Loans receivable - - - - 756,742 756,742
Other payables 14 - - 519 160 693
Loans Payable - - - 150,000 24,500 174,500
As at March 31, 2018
Fellow Subsidiaries
Key management
personnel
Entities with significant influence
Other related parties
Subsidiaries Total
Receivables - - - 10 1,052 1,062
Interest receivable - - - - 14,050 14,050
Loans receivable - - - - 669,288 669,288
Other payables 16 - - 11 793 820

Annual Report 2018-19
Standalone Financial Statements
All amounts in Euro’000, unless otherwise stated
196
B.6.6 Accounting estimates and evaluations
The Company makes estimates and assumptions concerning the future. The resulting accounting estimates will, by definition, seldom equal the related actual results. The estimates and assumptions that have a significant risk of causing a material adjustment to the carrying amounts of assets and liabilities within the next financial year are addressed below:
• Impairment of financial fixed assets:
The company uses its judgement to perform the impairment testing on the bases of estimated discounted future cash flows. Details on the impairment testing can be found in note B.6.3.3. The actual results may differ from these estimates. The estimates and the underlying assumptions are constantly assessed. Revisions of estimates are recognised in the period in which the estimate is revised and in future periods for which the revision has consequences.

Annual Report 2018-19
Standalone Financial Statements
All amounts in Euro’000, unless otherwise stated
197
B.6.7 Subsequent Events
The Company have not observed any subsequent event.
Signing of the financial statements
Mr. Jacob Meint Buit
Mr. Randolph Marie Thaddeus De Cuba (Managing Director)
(Managing Director)
Mr. Laksh Vaaman Sehgal
Mr. Andreas Heuser (Managing Director)
(Managing Director)
Mr. Cezary Zawadzinski Mr. Bimal Dhar (Member of Supervisory Board)
(Member of Supervisory Board)
Mr. Kunal Malani Mr. G.N. Gauba (Member of Supervisory Board)
(Member of Supervisory Board)
Mr. Vivek Chaand Sehgal Ms. Geeta Mathur
(Member of Supervisory Board) (Member of Supervisory Board)

Annual Report 2018-19
Standalone Financial Statements
All amounts in Euro’000, unless otherwise stated
198
ABBREVIATIONS
€ Euro (European currency) k€ Thousands of Euros $ US Dollar (US currency) IASB International Accounting Standards Board IFRS International Financial Reporting Standards EU European Union
Abbreviations used for companies
SMRP BV or SMRP BV Group
Samvardhana Motherson Automotive Systems Group B.V. & its subsidiaries
SMR or SMR Group Samvardhana Motherson Reflectec Group Holdings Limited & its subsidiaries
SMP Group Samvardhana Motherson Peguform GmbH & its subsidiaries, SMP Automotive Technology Ibérica S.L. & its subsidiaries and SMP Automotive Interiors (Beijing) Co. Ltd.
SMPL Samvardhana Motherson Polymers Limited, India SMGHL Samvardhana Motherson Global Holdings Ltd, Cyprus MSSL Motherson Sumi Systems Limited, India SAMIL India Samvardhana Motherson International Limited, India SMG SMRC
Samvardhana Motherson Group Samvardhana Motherson Reydel Companies