sales forecast - south dakota
TRANSCRIPT

Direct Testimony and Schedules Jannell E. Marks
Before the South Dakota Public Utilities Commission State of South Dakota
In the Matter of the Application of Northern States Power Company, a Minnesota corporation
for Authority to Increase Rates for Electric Utility Service in South Dakota
Docket No. EL09-____ Exhibit___(JEM-1)
Sales Forecast
June 30, 2009

Table of Contents
I. Introduction and Qualifications 1
II. 2008 Test Year Customer and Sales Data 2
A. Weather Normalization 3
B. Unbilled Sales 5
III. The forecasted sales for 2009 and 2010 support using the 2008 adjusted actual sales for setting rates
7
A. Historical Customer and MWh Sales Trends 7
B. Customer and Sales Forecast 8
C. Results of the Forecasts 10
D. Overview of Sales and Customer Forecasting Methodology 12
E. Statistically Modeled Forecasts 15
F. Data Preparation 18
G. Calendar Month Sales Derivation 20
IV. Conclusion 22
Schedules
Resume Schedule 1
Definition of Terms Schedule 2
Test-Year Sales and Customers by Customer Class Schedule 3
Year 2010 Sales and Customers by Customer Class Schedule 4
Regression Models and Analysis Schedule 5
Regression Models and Analysis Schedule 6
Comparison of Definitional Changes Schedule 7
Docket No. EL09-____ Marks Direct
i

1
2
3
4
5
6
7
8
9
10
11
12
13
14
15
16
17
18
19
20
21
22
23
24
25
26
I. INTRODUCTION AND QUALIFICATIONS
Q. PLEASE STATE YOUR NAME AND BUSINESS ADDRESS.
A. My name is Jannell E. Marks. My business address is 550 15th Street, Denver,
Colorado 80202.
Q. BY WHOM ARE YOU EMPLOYED AND WHAT IS YOUR POSITION?
A. I am the Director of the Sales, Energy and Demand Forecasting Department
for Xcel Energy Services Inc. (“XES”), which is the service company
subsidiary of Xcel Energy Inc. (“XEI”).
Q. PLEASE SUMMARIZE YOUR QUALIFICATIONS AND EXPERIENCE.
A. I graduated from Colorado State University with a Bachelor of Science degree
in statistics. I began my employment with Public Service Company of
Colorado (“PSCo”) in 1982 in the Economics and Forecasting Department,
and in August 2000, following the merger of New Centuries Energy Inc.
(“NCE”) and Northern States Power Company (“NSP”), I assumed the
position of Manager, Economics and Energy Forecasting with XES. I was
promoted to my current position with XES in February 2007. My resume is
included as Exhibit___(JEM-1), Schedule 1.
Q. FOR WHOM ARE YOU TESTIFYING?
A. I am testifying on behalf of Northern States Power Company, a Minnesota
corporation (“Xcel Energy” or the “Company”), operating in South Dakota.
Q. WHAT IS THE PURPOSE OF YOUR TESTIMONY IN THIS PROCEEDING?
1 Docket No. EL09-____ Marks Direct

1
2
3
4
5
6
7
8
9
10
11
12
13
14
15
16
17
18
19
20
21
22
23
24
25
26
27
A. I will provide the 2008 test year sales as adjusted to reflect normal weather and
unbilled sales. I also sponsor the Company’s forecasts of sales and customers
for the 2009 and 2010 years. Because these forecasts project a reduction in
sales in 2009 with some recovery in 2010, the Company believes that the 2008
actual data, weather normalized and corrected for unbilled sales, is a
reasonable basis upon which to set rates in this proceeding. I recommend
that the South Dakota Public Utilities Commission (“Commission”) rely on
these forecasts as evidence of the reasonableness of using adjusted 2008 actual
sales and customer counts for setting rates in this proceeding. In support of
my forecasts, I first describe the historical customer and megawatt hour
(“MWh”) sales trends for Xcel Energy’s South Dakota service territory. Then
I present details of the methods I used to develop the electric MWh sales and
customer forecast and the results.
Q. ARE THERE INDUSTRY TERMS YOU PLAN TO USE IN YOUR TESTIMONY?
A. Yes. The definitions of terms that are included in my testimony are provided
in Exhibit___(JEM-1), Schedule 2.
II. 2008 TEST YEAR CUSTOMER AND SALES DATA
Q. SINCE THE 2008 TEST YEAR IS A FULLY HISTORICAL TEST YEAR, IS IT
NECESSARY TO MAKE ANY ADJUSTMENTS TO THAT DATA FOR RATEMAKING
PURPOSES?
A. Yes. We used actual customer counts from the actual 2008 year for the 2008
Test Year. The 2008 actual sales data needs to be weather normalized and it
needs to be adjusted for unbilled sales. I describe each of these adjustments in
the following sections of my testimony.
2 Docket No. EL09-____ Marks Direct

1
2
3
4
5
6 7 8
9
10
11
12
13
14
15
16
17
18
19
20
21
22
23
24
25
26
27
28
Q. WHAT ARE THE 2008 ADJUSTED SALES AND CUSTOMER COUNTS USED FOR TEST
YEAR PURPOSES?
A. The adjusted sales and customer counts for 2008 are presented as
Exhibit___(JEM-1), Schedule 3.
A. Weather Normalization
Q. HOW DID XCEL ENERGY ADJUST ITS TEST YEAR SALES FOR THE INFLUENCE OF
WEATHER ON SALES?
A. As discussed in more detail later in my testimony, the Company develops
linear regression models to forecast sales for the Residential without Space
Heating, Residential with Space Heating, and Small Commercial and Industrial
classes. These linear regression models include weather, as measured in terms
of heating degree days and temperature humidity index (“THI”), as an
explanatory variable. For each of these classes, sales are not weather adjusted
prior to developing the respective statistical models. In this way, the historical
weather impact on historical consumption for each class can be modeled
through the respective coefficients for the heating degree day and THI
variables included in each class’ model. Test year sales were then weather
adjusted using the weather response coefficients from the linear regression
models and “normal” heating degree days and THI, which are based on the
20-year moving average of historical heating degree days and THI.
For the Large Commercial and Industrial and Public Street and Highway
Lighting classes, test year volumes have not been weather normalized. These
customers’ use of electricity is influenced by factors other than weather (for
example, hours of daylight). As a result, the weather impact due to deviation
from normal weather is indistinguishable from other variables.
3 Docket No. EL09-____ Marks Direct

1
2
3
4
5
6
7
8
9
10
11
12
13
14
15
16
17
18
19
20
21
22
23
24
25
26
27
Q. WHAT WAS XCEL ENERGY’S MEASURE OF WEATHER, AND WHAT WAS THE
SOURCE?
A. The measure of weather used was heating degree days and THI, using a 65-
degree temperature base. This information was obtained from the National
Oceanic and Atmospheric Administration (“NOAA”) and measured at the
Sioux Falls weather station.
Q. IS IT APPROPRIATE TO USE THE SIOUX FALLS WEATHER STATION TO
REPRESENT XCEL ENERGY’S SOUTH DAKOTA SERVICE TERRITORY?
A. Yes, it is. The majority of Xcel Energy’s South Dakota electric customers (94
percent) reside within the Sioux Falls metropolitan area.
The coefficients for the heating degree day and THI variables included in each
class’ model were determined based on the historical relationship between
sales throughout Xcel Energy’s South Dakota service territory and Sioux Falls
weather. Therefore, the coefficients accurately reflect the distribution of
customers geographically within the South Dakota service territory. Since this
geographic distribution is not expected to change during the test year, it is
appropriate to use this historical relationship and Sioux Falls weather.
Q. DID THE WEATHER REFLECT THE SAME BILLING DAYS AS THE SALES DATA?
A. Yes. The heating degree days and THI were weighted by the number of times
a particular day was included in a particular billing month. These weighted
heating degree days and THI were divided by the total billing cycle days to
arrive at average daily heating degree days and THI for a billing month.
Q. HOW WAS NORMAL WEATHER DETERMINED?
4 Docket No. EL09-____ Marks Direct

1
2
3
4
5
6
7
8
9
10
11
12
13
14
15
16
17
18
19 20 21 22 23
24
25
26
27
A. Normal daily weather was calculated based on the average of twenty years of
historical heating degree days and THI. These normal heating degree days and
THI were related to the forecasted billing month in the same manner as were
the actual heating degree days and THI.
Q. WHAT IS THE SOURCE OF WEATHER DATA?
A. As I explained above, the measure of weather used was heating degree days
and THI. Eight temperature readings per day were obtained, and the average
daily temperature was determined by averaging the eight temperature readings.
Heating degree days were calculated for each day by subtracting the average
daily temperature from 65 degrees Fahrenheit. For example, if the average
daily temperature was 45 degrees Fahrenheit, then 65 minus 45 or 20 heating
degree days were calculated for that day. If the average daily temperature was
greater than 65 degrees Fahrenheit, then that day recorded zero heating degree
days. The normal daily heating degree days used to weather normalize test
year sales were calculated by averaging 20 years of daily heating degree days
using data from 1988 to 2007.
THI were calculated for each day using the formula:
THI = 17.5 + (0.55 * Dry Bulb) + (0.2 * Dew Point)
The NOAA commonly uses this formula, and the dew point data was based
on the same eight readings of temperature discussed above.
B. Unbilled Sales
Q. CAN YOU EXPLAIN THE TERM “UNBILLED SALES”?
5 Docket No. EL09-____ Marks Direct

1
2
3
4
5
6
7
8
9
10
11
12
13
14
15
16
17
18
19
20
21
22
23
24
25
26
A. Yes. Xcel Energy reads electric meters each working day according to a
meter-reading schedule based on 21 billing cycles per billing month. Meters
read early in the month mostly reflect consumption that occurred during the
previous month. Meters read late in the month mostly reflect consumption
that occurred during the current month. The “billing month” sales for the
current month reflect consumption that occurred in both the previous month
and the current month. Thus, billing month sales lag calendar month sales.
Unbilled sales reflect electricity consumed in the current month that are not
billed to the customer until the succeeding month.
Q. WHAT IS THE PURPOSE OF THE UNBILLED SALES ADJUSTMENT?
A. The purpose is to align the test year revenues with the relevant test year
expenses, which have been reported on a calendar month basis.
Q. IS XCEL ENERGY REFLECTING UNBILLED REVENUE ON ITS BOOKS FOR
ACCOUNTING AND FINANCIAL PURPOSES?
A. Yes. Xcel Energy adopted this practice during fiscal year 1992.
Q. HOW WERE THE ESTIMATED MONTHLY NET UNBILLED SALES VOLUMES
DETERMINED?
A. Xcel Energy determined its test year monthly net unbilled sales as the
difference between the estimated monthly calendar month sales, and actual
billing month sales. I describe the process used to estimate calendar month
sales later in my testimony. The process to estimate calendar month sales for
the test year is the same as the forecast year, except actual billing month sales
and actual weather are used rather than projected billing month sales and
6 Docket No. EL09-____ Marks Direct

1
2
3
4
5
6 7
8
9
10
11
12
13
14
15
16
17
18
19
20
21
22
23
24
25
26
27
28
normal weather. The actual billing month sales were from the Company’s
billing system.
III. THE FORECASTED SALES FOR 2009 AND 2010 SUPPORT USING
THE 2008 ADJUSTED ACTUAL SALES FOR SETTING RATES.
A. Historical Customer and MWh Sales Trends
Q. PLEASE DISCUSS THE RECENT TRENDS IN CUSTOMER GROWTH AND MWH
SALES GROWTH.
A. The total number of retail electric customers in Xcel Energy’s South Dakota
service territory increased an average of 1,572 customers per year from 1998
through 2008, for an annual growth rate of 2.2 percent per year on average.
The largest class of customers is the Residential class, which represents 87
percent of total customers and has averaged a growth rate of 2.2 percent or
1,354 additions per year during the period from 1998 through 2008.
After normalizing for weather, Xcel Energy’s South Dakota service territory
total electric retail sales have increased an average of 3.3 percent per year
during the period of 1998 through 2008. Both the Residential sales class and
the Commercial and Industrial sales class have averaged growth of 3.3 percent
per year during the period of 1998 through 2008. The average annual percent
change in customers and MWh sales by customer class during the period of
1998 through 2008 is presented in Table 1.
7 Docket No. EL09-____ Marks Direct

1 2 3 4
Table 1
1998-2008 Average Percent Change
Customer Class Number of Customers
Weather
Normalized Sales
2008 % of Total Sales
Residential 2.2% 3.3% 33.3%
Commercial & Industrial 2.3% 3.3% 66.2%
Street Lighting 3.1% 3.9% 0.5%
Total Retail 2.2% 3.3% 100.0%
5 6 7 8
9
10
11
12
13
14
15
16
17
18
19
20
21
22
B. Customer and Sales Forecast
Q. WHAT GEOGRAPHICAL AREA DO THE TEST YEAR SALES REFLECT?
A. My testimony and exhibits reflect electric usage and customers in Xcel
Energy’s South Dakota service territory.
Q. PLEASE DESCRIBE THE CUSTOMER CATEGORIES INCLUDED IN XCEL ENERGY’S
CUSTOMER AND SALES FORECASTS.
A. The following customer classes comprise Xcel Energy’s electric customer and
sales forecasts:
• Residential without Space Heating – residential service for domestic purposes
excluding space heating.
• Residential with Space Heating – residential service for domestic purposes
including space heating.
• Small Commercial and Industrial – commercial and industrial service requiring
less than 1,000 kilowatts (“kW”) billing demand per month on average per
year.
8 Docket No. EL09-____ Marks Direct

• Large Commercial and Industrial – commercial and industrial service requiring
more than 999 kW billing demand per month on average per year.
1
2
3
4
5
6
7
8
9
10
11
12
13
14
15
16
17
18
19
20
21
22
23
24
25
26
27
• Public Street and Highway Lighting – street lighting service available for year-
round illumination of public streets, parkways, and highways.
While we also have another customer class, Other Sales to Public Authorities –
public authority service including municipal pumping service and fire and civil
defense siren service, there have been no sales in this class since April 2008.
Consequently, we did not include possible sales to this class in our forecast.
Q. HAVE THE DEFINITIONS OF THESE CUSTOMER CLASSES CHANGED DURING THE
1998 TO 2008 HISTORICAL SAMPLE PERIOD USED TO DEVELOP THE CUSTOMER
AND SALES FORECASTS?
A. Yes. Prior to 2001, Xcel Energy’s North operations (consisting of the former
NSP operating system) considered a Commercial and Industrial customer
“large,” if the customer exceeded a maximum demand of 99 kW at any point
in the previous 12-month period. To achieve consistency in reporting among
operating companies within XEI, in 2001 that threshold changed to 999 kW.
The 999 kW threshold was selected because it follows the Federal Energy
Regulatory Commission (“FERC”) suggested standards.
Q. HOW ARE CUSTOMER AND SALES FORECASTS USED IN THIS PROCEEDING?
A. The customer and sales forecasts are used to calculate the following:
a) 2010 year revenue under present rates; and
b) 2010 year revenue under proposed rates.
As I indicated, these forecasts are used to support using the 2008 test year
adjusted sales for setting rates.
9 Docket No. EL09-____ Marks Direct

1
2
3
4
5
6
7
8
9
10
11
12
13
14
15
16
17
18
19
20
21
22
23
24
25
26
27
C. Results of the Forecasts
Q. WHAT IS XCEL ENERGY’S FORECAST OF ELECTRIC SALES AND CUSTOMERS FOR
THE YEAR ENDING DECEMBER 31, 2010?
A. Exhibit___(JEM-1), Schedule 4 summarizes monthly 2010 year MWh sales
and number of customers for each customer class.
Q. HOW DOES THE 2010 YEAR ELECTRIC CUSTOMER GROWTH COMPARE WITH
HISTORICAL CUSTOMER GROWTH?
A. As I stated earlier, the total number of electric customers in the Xcel Energy
South Dakota service territory increased at an average annual rate of 2.2
percent from 1998 through 2008, or 1,572 customers per year on average.
The total number of electric customers is expected to increase at a 1.7 percent
annual growth rate in 2009, adding 1,373 customers, followed by a 1.5%
growth rate in 2010, adding 1,201 customers. The lower growth rates of 1.7
percent and 1.5 percent compared to the historical average growth rate of 2.2
percent reflects both the slowdown in residential housing activity that has
occurred so far this year and the projections for continued slow housing-
activity growth through 2009 and 2010. I will explain the methodologies used
to develop this forecast in the following section of my testimony.
Q. HOW DOES THE 2009 AND 2010 YEAR ELECTRIC SALES COMPARE WITH 2008
WEATHER NORMALIZED ELECTRIC SALES?
A. Table 2 provides Xcel Energy’s weather normalized retail MWh sales by
customer class for 2008, 2009 and 2010, and provides the 2009 and 2010
annual growth rates, and includes the average annual growth rate for the 2009
through 2010 time period.
10 Docket No. EL09-____ Marks Direct

1
2
3
4
5
6
7
8
9
10
11
12
13
14
15 16 17 18
Total electric retail sales are expected to decrease 0.4 percent during the 2009
year compared to weather normalized 2008 electric sales, then increase 1.4%
during the 2010 year, for a 0.5% average annual rate of growth over the 2008
to 2010 time period. Residential sales are predicted to decrease 1.3 percent in
the 2009 year from 2008 sales, then to increase 1.6 percent in 2010 (0.2
percent annual average). Commercial and Industrial sales are projected to
remain flat in 2009 compared to 2008 (0.0 percent growth), followed by a 1.3
percent increase in 2010 (0.6 percent annual average). Street Lighting sales are
expected to increase 1.7 percent in 2009 and gain another 2.1 percent in 2010
(1.9 percent annual average). This slowdown in total projected retail sales
growth of 0.5 percent per year on average as compared to the historical
average growth rate of 3.3 percent is due to the current and projected weak
economy. I will explain the methodologies used to develop this forecast in the
following section of my testimony.
Table 2
Weather Normalized Sales by Class (MWh)
Customer Class
2008 Sales
2009 Sales
2009 % Change
2010 Sales
2010 % Change
Average Annual % Change
Residential 651,413 642,835 -1.3% 653,385 1.6% 0.2% Total Commercial & Industrial
1,296,990 1,296,872 0.0% 1,313,709 1.3% 0.6%
Street Lighting 10,555 10,735 1.7% 10,958 2.1% 1.9%
Total Retail 1,958,958 1,950,442 -0.4% 1,978,052 1.4% 0.5%
19
20
11 Docket No. EL09-____ Marks Direct

1
2
3
4 5
6
7
8
9
10
11
12
13
14
15
16
17
18
19
20
21
22
23
24
25
26
27
28
Q. YOU ARE FORECASTING A SMALL AMOUNT OF GROWTH IN SALES IN 2010
COMPARED TO THE 2008 TEST YEAR. IS THIS FORECAST A MORE RELIABLE
BASIS UPON WHICH TO SET RATES THAN THE 2008 TEST YEAR ACTUAL SALES?
A. No. While I have applied the techniques we historically rely upon in our
forecasting process, the current economic conditions are unprecedented.
Based on known current conditions it would be imprudent to consider our
forecast as other than a possible best case scenario and not as a known and
measureable change that should be used to replace sales from the required
historical test year.
There is no consensus within the economic community of when the current
recession will end much less when it will recover sufficiently to support sales
growth, much less sales growth beyond the 2008 actual levels. Clearly, the
current economic conditions we are experiencing with lower sales than
occurred in 2008 could extend well into 2010, eliminating the forecasted
growth in sales. Given the current economic conditions, I support using the
actual 2008 sales for ratemaking purposes in this proceeding.
D. Overview of Sales and Customer Forecasting Methodology
Q. PLEASE DESCRIBE IN GENERAL TERMS THE METHODS USED TO FORECAST
SALES AND CUSTOMERS.
A. The Sales, Energy and Demand Forecasting Department coordinated the
electric sales and customer forecast preparation using a combination of
econometric and statistical forecasting techniques and analyses to develop the
sales and customer forecasts.
12 Docket No. EL09-____ Marks Direct
1
2
3
4
5
6
7
8
9
10
11
12
13
14
15
16
17
18
19
20
21
22
23
24
25
26
Q. HOW WERE THE SALES FORECASTS DEVELOPED FOR THE RESIDENTIAL, SMALL
COMMERCIAL AND INDUSTRIAL, AND PUBLIC STREET AND HIGHWAY
LIGHTING CUSTOMER CLASSES?
A. I developed Ordinary Least Squares (“OLS”) multiple regression models as
the foundation for the sales forecasts of the Residential without Space
Heating, Residential with Space Heating, Small Commercial and Industrial,
and Public Street and Highway Lighting customer classes. OLS multiple
regression techniques are very well known, proven methods of forecasting and
are commonly accepted by forecasters throughout the utility industry. This
method provides reliable, accurate projections, accommodates the use of
predictor variables, such as economic or demographic indicators and weather,
and allows clear interpretation of the model. Xcel Energy has been using
these types of OLS regression models since 1991.
Monthly sales forecasts for these customer classes were developed based on
OLS regression models designed to define a statistical relationship between
the historical sales and the independent predictor variables, including historical
economic and demographic indicators, historical electricity prices, historical
weather (expressed in heating degree days and temperature humidity index
(“THI”)), and historical number of customers. In all of the models, monthly
historical data from January 1998 through December 2008 was used to
determine these relationships. The modeled relationships were then simulated
over the forecast period by assuming normal weather (expressed in terms of
20-year-averaged heating degree days and THI, calculated using data from
1989 to 2008) and the projected levels of the independent predictor variables.
13 Docket No. EL09-____ Marks Direct

1
2
3
4
5
6
7
8
9
10
11
12
13
14
15
16
17
18
19
20
21
22
23
24
25
26
Q. WERE ANY SPECIAL VARIABLES USED TO ADDRESS THE PREVIOUSLY-
DISCUSSED COMMERCIAL AND INDUSTRIAL RECLASSIFICATION?
A. Yes. As I explained earlier in my testimony, in 2001, Xcel Energy changed the
threshold used to determine “small” and “large” Commercial and Industrial
customers. In order to maintain the January 1998 to December 2008 sample
time period and to account for the reclassification, a step-change binary
variable was incorporated in the Small Commercial and Industrial sales
regression model. The binary variable equaled “1” in months prior to the
reclassification in January 2001, and “0” for all months after the
reclassification. Because the reclassification was not completed in one month,
an additional binary variable was used in January 2001 to account for
additional customer shifts between the Small and the Large Commercial and
Industrial classes that occurred in that month.
Q. WHAT PROCESS WAS USED TO FORECAST SALES IN THE LARGE COMMERCIAL
AND INDUSTRIAL CUSTOMER CLASS?
A. Usage in the Large Commercial and Industrial customer class often is
impacted by factors that are difficult to capture in an OLS multiple regression
model. The 2009 monthly sales forecast for this class was developed by
averaging the historical billing month sales by month. The 2010 monthly sales
forecast was developed by escalating the 2009 monthly billing month sales by
0.5 percent. The 0.5 percent is consistent with the weak economic outlook for
2010. The billing month sales were then converted to calendar month sales
using the process described later in my testimony.
Q. WHAT PROCESS WAS USED FOR FORECASTING NUMBER OF CUSTOMERS?
14 Docket No. EL09-____ Marks Direct

1
2
3
4
5
6
7
8
9
10
11
12
13
14
15
16
17
18
19
20
21
22
23
24
25
26
27
A. The number of customers by customer class for the classes Residential
without Space Heating, Residential with Space Heating, Small Commercial and
Industrial, and Public Street and Highway Lighting is forecasted using
demographic data for South Dakota in OLS regression models and analysis of
historical growth trends. The customer forecast for the Large Commercial
and Industrial customer class was developed by holding constant the
December 2008 number of customers.
E. Statistically Modeled Forecasts
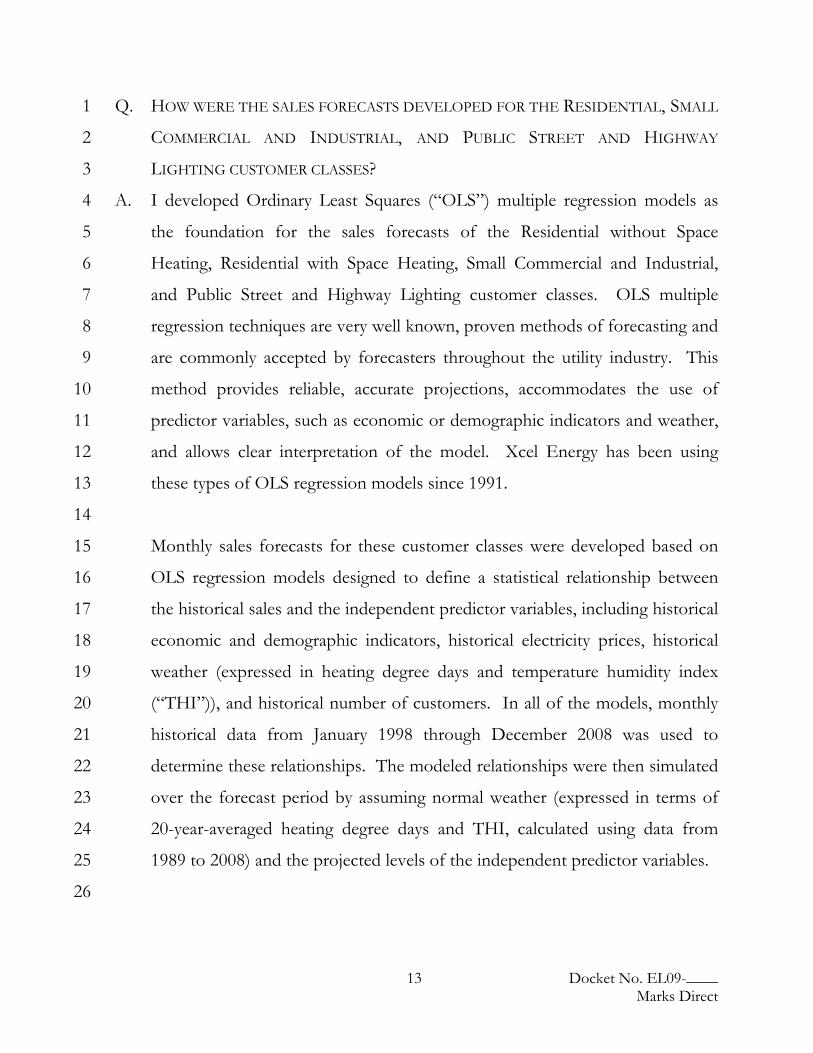
Q. PLEASE DESCRIBE THE REGRESSION MODELS AND ASSOCIATED ANALYSIS USED
IN XCEL ENERGY’S STATISTICAL PROJECTIONS OF SALES AND CUSTOMERS.
A. The regression models and associated analysis used in Xcel Energy’s statistical
projections of sales are provided in Exhibit___(JEM-1), Schedule 5, and the
regression models and associated analysis used in Xcel Energy’s statistical
projections of customers are provided in Exhibit___(JEM-1), Schedule 6.
These schedules include, by customer class, the models with their summary
statistics and output and descriptions for each variable included in the model.
Q. WHAT TECHNIQUES DID XCEL ENERGY EMPLOY TO EVALUATE THE
PLAUSIBILITY OF ITS QUANTITATIVE FORECASTING MODELS AND SALES
PROJECTIONS?
A. There are a number of quantitative and qualitative validity tests that are
applicable to OLS multiple regression analysis.
The coefficient of determination (“R-squared”) test statistic is a measure of
the quality of the model’s fit to the historical data. It represents the
15 Docket No. EL09-____ Marks Direct

1
2
3
4
5
6
7
8
9
10
11
12
13
14
15
16
17
18
19
20
21
22
23
24
25
26
27
proportion of the variation of the historical sales and customers around their
mean value that can be attributed to the functional relationship between the
historical data series and the explanatory variables included in the model. If
the R-squared statistic is high, the model is explaining a high degree of the
historical sales and customers variability. The regression models used to
develop the forecasts demonstrate very high R-squared statistics, ranging
between 97.6 percent and 99.9 percent.
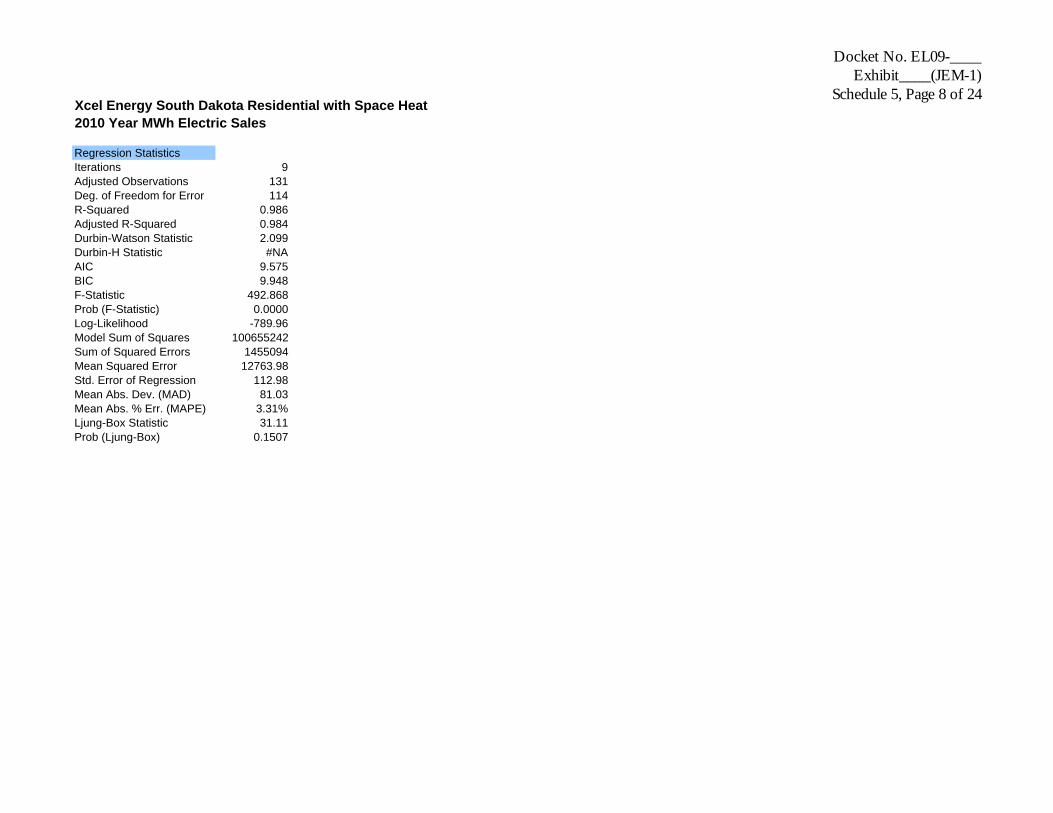
The t-statistics of the variables indicate the degree of correlation between that
variable’s data series and the sales and customer data series being modeled.
The t-statistic is a measure of the statistical significance of each variable’s
individual contribution to the prediction model. Generally, the absolute value
of each t-statistic should be greater than 2.0 to be considered statistically
significant at the 95 percent confidence level. This criterion was applied to the
regression models used to develop the sales and customer forecast. The final
regression models used to develop the forecast tested satisfactorily under this
standard. In the Residential without Space Heating sales model, the t-statistics
for the May weather variable was less than 2.0, but it was still significant at the
90 percent confidence level and the variable was included in the model to
account for weather variability that occurs in the month of May. In the
Residential without Space Heating customer model, the t-statistic for a binary
variable that accounts for the change in billing systems in 2005 was less than
2.0, but it also was significant at the 90 percent confidence level and the
variable was included in the model to improve the model’s explanatory power.
Each model was inspected for the presence of first-order autocorrelation, as
measured by the Durbin-Watson (“DW”) test statistic. Autocorrelation refers
16 Docket No. EL09-____ Marks Direct

1
2
3
4
5
6
7
8
9
10
11
12
13
14
15
16
17
18
19
20
21
22
23
24
25
26
27
to the correlation of the model’s error terms for different time periods. For
example, an overestimate in one period is likely to lead to an overestimate in
the succeeding period, and vice versa, under the presence of first-order
autocorrelation. Thus, when forecasting with an OLS regression model,
absence of autocorrelation between the residual errors is very important. The
DW test statistic ranges between 0 and 4 and provides a measure to test for
autocorrelation. In the absence of first-order autocorrelation, the DW test
statistic equals 2.0. The final regression models used to develop the sales
forecast tested satisfactorily for the absence of first-order autocorrelation, as
measured by the DW test statistic.
Graphical inspection of each model’s error terms (i.e. actual less predicted) was
used to verify that the models were not misspecified, and that statistical
assumptions pertaining to constant variance among the residual terms and
their random distribution with respect to the predictor variables were not
violated. Analysis of each model’s residuals indicated that the residuals were
homoscedastic (constant variance) and randomly distributed, indicating that
the OLS linear regression modeling technique was an appropriate selection for
each customer class’ sales and customer counts that were statistically modeled.
The statistically modeled forecasts for each customer class have been reviewed
for reasonableness as compared to the respective monthly history for that
class. Graphical inspection reveals that the patterns of the forecast fit well
with the respective historical patterns for each customer class. The annual
total forecast sales and customer counts have been compared to their
respective historical trends for consistency.
17 Docket No. EL09-____ Marks Direct

1
2
3
4
5
6
7
8
9
10
11
12
13
14
15
16
17
18
19
20
21
22
23
24
25
26
27
Q. HOW ACCURATE HAVE XCEL ENERGY’S SALES AND CUSTOMER FORECASTS
BEEN HISTORICALLY?
A. On average, the historical forecasts of sales have been within 2.0 percent of
actual levels over the last three years after adjusting for weather, while the
historical forecasts of number of customers have been within 1.2 percent of
actual levels.
Q. DO YOU EXPECT SIMILAR FORECAST ACCURACY FOR 2010 IN LIGHT OF THE
CURRENT VOLATILITY IN ECONOMIC CONDITIONS?
A. I believe that the 2010 forecast does present some unique challenges, given
the economic volatility we are currently experiencing. While the Company’s
models have historically been quite accurate, no model can completely
overcome impacts of economic uncertainty that exist in the current climate.
Thus, while the forecast for 2010 is the best available, given the information
currently in my possession, it is certainly subject to significant uncertainty,
given the volatile economic conditions we are currently experiencing.
F. Data Preparation
Q. PLEASE DESCRIBE THE DATA AND DATA SOURCES XCEL ENERGY USED TO
DEVELOP THE SALES AND CUSTOMER FORECASTS.
A. Historical billing month sales and number of customers were obtained from
Xcel Energy’s billing system reports. The forecasting process relied on
historical sales and customers from January 1998 through December 2008.
Q. WHAT IS THE SOURCE OF THE COMPANY’S PRE-FEBRUARY 2005 SALES
INFORMATION?
18 Docket No. EL09-____ Marks Direct

1
2
3
4
5
6
7
8
9
10
11
12
13
14
15
16
17
18
19
20
21
22
23
24
25
26
A. All of the pre-February 2005 billing data is from Xcel Energy’s legacy billing
system (“CSS”).
Q. WHAT IS THE SOURCE OF THE COMPANY’S POST-FEBRUARY 2005 SALES
INFORMATION?
A. In February 2005, the Company converted from CSS to the CRS billing
system. Most 2005 data will be from CRS. The definition of a billing month
is different under CRS from the definition of a billing month under CSS.
Consequently, the data presented by the post-February 2005 CRS monthly
billed sales will not be entirely consistent with the data presented by CSS prior
to 2005. However, the definitional differences have been addressed by
calculating both billing month weather and billing cycle days using the same
billing cycle information as the billing month sales.
Q. COULD YOU PLEASE EXPLAIN OTHER AREAS OF DIFFERENCE?
A. Yes. With the conversion from CSS to CRS, the number of customers in
2005 appears lower than it would have been under CSS. Analysis conducted
prior to system conversion indicated that CRS would report fewer customers
than CSS just based on tests of the change in the definition of active services.
These resulted from small definitional changes in what constitutes an active
services account needed to bring uniformity between the former NCE system
and the former NSP system. However, these customer-count definitional
changes did not impact the amount of sales billed to customers.
Exhibit___(JEM-1), Schedule 7, provides a detailed comparison of definitional
changes.
19 Docket No. EL09-____ Marks Direct

1
2
3
4
5
6
7
8
9
10
11
12
13
14
15
16
17
18 19 20
21
22
23
24
25
26
27
28
Q. DID YOU MAKE ANY ADJUSTMENT TO THE CUSTOMER COUNTS AS A RESULT OF
THESE CHANGES?
A. No, I did not adjust the customer counts. However, I did use binary variables
in the Residential without Space Heating and Small Commercial and Industrial
customer regression models to account for these definitional changes. The
use of the binary variable in the regression models provided a better statistical
fit to the historical data.
Q. WHAT WAS YOUR SOURCE OF ECONOMIC AND DEMOGRAPHIC DATA?
A. The historical and forecasted economic, and demographic variables were
obtained from Global Insight, Inc., a respected economic-forecasting firm
frequently relied on by forecasting professionals. These variables include
population, households, employment, personal income, and Gross State
Product, for the state of South Dakota. This information is used to determine
the historical relationship between customers and sales, and economic and
demographic measures.
G. Calendar Month Sales Derivation Q. HOW WERE THE ESTIMATED MONTHLY CALENDAR MONTH SALES
DETERMINED?
A. For the Residential without Space Heating, Residential with Space Heating,
and Small Commercial and Industrial classes, Xcel Energy calculated the
projected calendar month sales based on the projected billing month sales.
The calendar month sales were calculated in terms of the sales load
component that is not associated with weather (“base load”), and the sales
load component that is influenced by weather (“total weather load”). The
weather was measured in terms of normal heating degree days and THI, as
20 Docket No. EL09-____ Marks Direct

1
2
3
4
5
6 7
8
9
10
11
12
13
14
15
16
17
18
19
20
21
22
23
24
25
26
27
28
described above. The base load sales and the total weather sales components
were calculated for each class. The two components were then combined to
provide the total calendar month volumes.
The calendar month base load component was calculated as follows:
Step 1 The billing month total weather load was calculated. This was
accomplished by multiplying the billing month sales weather
normalization regression coefficients (defined in terms of billing
month heating degree days, THI and number of customers), times
billing month normal heating degree days and THI, times the
projected customers.
Step 2 The billing month base load was calculated by taking the difference
between the projected total billing month sales and the billing month
total weather load (as calculated in Step 1).
Step 3 The billing month base load sales per billing day was determined by
dividing the billing month base load sales (from Step 2) by the average
number of billing days per billing month.
Step 4 The calendar month base load sales were then calculated by
multiplying the billing month base load sales per billing day (from
Step 3) times the number of days in the calendar month.
The calendar month total weather load component was calculated the same
way the billing month total weather load was calculated (as described in Step 1
above). However, the calculation was performed by substituting the calendar
month sales weather normalization regression coefficient (defined in terms of
calendar month heating degree days, THI and number of customers) and the
calendar month normal heating degree days and THI.
21 Docket No. EL09-____ Marks Direct

1
2
3
4
5
6
7
8
9
10
11
12
13
14
15
16
17
18
19
20
21
22
23
24
25
26
27
The calendar month total sales were calculated by combining the calendar
month base load and calendar month total weather load components.
For the Large Commercial and Industrial class, Xcel Energy calculated the
calendar month sales simply based on the projected billing month sales in the
same manner as detailed for Residential with Space Heating, Residential
without Space Heating, and Small Commercial and Industrial classes.
However, for the Large Commercial and Industrial and Public Authority
classes, there are no total weather load sales. The 2010 year calendar-month
total sales for this class were calculated only in terms of their base load, where
the billing month base load equaled the projected billing month sales.
The Public Street and Highway Lighting class is billed on a calendar month
basis. Therefore, for this class, the calendar month sales equal the billing
month sales.
IV. CONCLUSION
Q. CAN YOU PLEASE SUMMARIZE YOUR DIRECT TESTIMONY?
A. The historical 2008 test year sales have been properly weather normalized and
adjusted to reflect unbilled sales. We compared those results to the forecast of
customers and sales for 2009 and 2010. Those forecasts reflect a loss of sales
in 2009 and a small level of growth in 2010. These forecasts reflect the
current and projected weak economic conditions. I believe these forecasts
provide additional support for using adjusted 2008 sales data for setting rates.
22 Docket No. EL09-____ Marks Direct

1
2
3
4
5
6
7
8
9
Q. PLEASE SUMMARIZE YOUR RECOMMENDATIONS FOR THE COMMISSION TO
CONSIDER.
A. I recommend that the Commission adopt my 2008 adjusted sales and
customers counts, as reflected in Exhibit___(JEM-1), Schedule 3 for the
purpose of determining the revenue requirement and final rates in this
proceeding.
Q. DOES THIS CONCLUDE YOUR TESTIMONY?
A. Yes, it does.
23 Docket No. EL09-____ Marks Direct

Docket No. EL09-_____ Exhibit___(JEM-1) Schedule 1
Page 1 of 2
Resume
Jannell E. Marks Director, Sales, Energy and Demand Forecasting
550 15th Street, Denver, Colorado 80202
February 2007 – Present
Director, Sales, Energy and Demand Forecasting Responsible for the development of forecasted sales data and economic conditions for Xcel Energy’s operating companies, and the presentation of this information to Xcel Energy’s senior management, other Xcel departments, and externally to various regulatory and reporting agencies. Also responsible for developing and implementing forecasting, planning, and load analysis studies for regulatory proceedings. Testified on forecasting issues before the Colorado Public Utilities Commission, the Minnesota Public Utilities Commission, and the North Dakota Public Service Commission.
August 2000 – February 2007 Manager, Energy Forecasting, Xcel Energy
Responsible for the development and presentation of forecasted data for Xcel Energy’s operating companies. Also responsible for reporting historical and statistical information to various regulatory agencies and others. Testified on forecasting issues before the Public Utility Commission of Texas, the Colorado Public Utilities Commission, and the Minnesota Public Utilities Commission.
May 1997 – August 2000 Manager, Demand, Energy and Customer Forecasts, New Century Energies,
Inc. Responsible for developing demand, energy, and customer forecasts
for New Century Energies, Inc.’s operating companies. Also directed the preparation of statistical reporting for regulatory agencies and others regarding historical and forecasted reports. Testified on forecasting issues before the Public Utility Commission of Texas and the Colorado Public Utilities Commission.

Docket No. EL09-_____ Exhibit___(JEM-1) Schedule 1
Page 2 of 2
1991-1997 Senior Research Analyst, Public Service Company of Colorado Responsible for developing the customer and sales forecasts for
Public Service Company of Colorado and the economic, customer, sales and demand forecasts for Cheyenne Light, Fuel and Power Company.
1982-1991 Research Analyst, Public Service Company of Colorado Education Colorado State University – Bachelor of Science: Statistics 1982

Docket No. EL09-____ Exhibit___(JEM-1)
Schedule 2, Page 1 of 3
Definitions of Terms Base Load - Component of sales not associated with weather. Billing Cycle Days - Based on the meter reading schedule for the 21 billing cycles. For example, there are approximately 651 (21 cycles * 31 days) billing cycle days during a typical billing month period. Billing Month Sales - Billed sales based on the meter reading schedule for the 21 billing cycles. Calendar Month Sales - Estimated sales, equal to the billing month sales, adjusted for the estimated unbilled sales of the current calendar month, less the estimated unbilled sales from the previous calendar month. Commission – South Dakota Public Utilities Commission. Company – Northern States Power Company d/b/a Xcel Energy. CRS – Customer Resource System; Xcel Energy’s billing system since February 2005. CSS – Xcel Energy’s billing system prior to February 2005. DW Test Statistic - Durbin-Watson test statistic; tests for the presence of first-order autocorrelation. In the absence of first-order autocorrelation, the statistic equals 2.0. Error Terms - The difference between the actual values of the data series being modeled (customers or sales) and the regression model’s predicted, or “fitted” values for that series. Also called Residual Terms. FERC – Federal Energy Regulatory Commission. Heating Degree Days - Measure of weather. Calculated by subtracting the average daily temperature from a base of 65 degrees Fahrenheit. kW – Kilowatt; measure of electricity demand.

Docket No. EL09-____ Exhibit___(JEM-1)
Schedule 2, Page 2 of 3
Definitions of Terms (continued) KWh – Kilowatt-hour; measure of electricity sales. MWh – Megawatt-hour; measure of electricity sales; one MWh = 1,000 KWh. NCE – New Centuries Energy Inc. NOAA – National Oceanic and Atmospheric Administration. NSP – Northern States Power Company. OLS Multiple Regression - Ordinary Least Squares Linear Regression employing multiple independent variables to model the variation of the dependent variable about its mean value. PSCo – Public Service Company of Colorado. R-squared - Coefficient of determination; measures the quality of the model’s fit to the historical data. The higher the R-squared statistic, the better the model is explaining the historical data. Residual Terms - The difference between the actual values of the data series being modeled (customers or sales) and the regression model’s predicted, or “fitted” values for that series. Also called Error Terms. t-Statistic - Measures the importance of the independent variable to the regression. The higher the absolute value of the t-statistic, the more likely it is that the variable has a relationship to the dependent variable and is making an important contribution to the equation. Test Year – January 1, 2008-December 31, 2008. THI – Temperature-humidity index. Total Weather Load - Component of sales influenced by weather. Unbilled Sales – Electric consumed in the current month but not billed to customers until the succeeding month.

Docket No. EL09-____ Exhibit___(JEM-1)
Schedule 2, Page 3 of 3
Definitions of Terms (continued) XEI – Xcel Energy Inc. XES – Xcel Energy Services Inc.

Docket No. EL09-____Exhibit___(JEM-1)
Schedule 3, Page 1 of 1
A B C D E F G H I J K L M N1 Xcel Energy - South Dakota State2 Test Year Sales and Customers by Customer Class34 Weather Normalized Calendar Month Sales (MWh)56 Jan Feb Mar Apr May Jun Jul Aug Sep Oct Nov Dec Year78 Residential without Space Heat 48,559 48,339 46,629 42,223 42,735 58,810 71,373 64,737 47,178 42,095 46,914 55,801 615,3929 Residential with Space Heat 4,361 3,829 3,465 2,417 1,906 2,322 2,993 2,390 1,863 2,287 3,536 4,653 36,02110 Small Commercial & Industrial 74,200 72,780 75,484 69,890 72,912 76,900 90,325 86,415 76,438 78,762 76,382 75,676 926,16311 Large Commercial & Industrial 29,214 27,411 28,875 27,224 30,327 35,266 37,799 36,012 31,533 29,592 28,664 28,758 370,67412 Public Street & Highway Lightin 1,247 1,062 954 910 732 679 621 641 771 909 908 1,122 10,55513 Other Sales to Public Authority 35 39 41 37 0 0 0 0 0 0 0 0 1521415 Total Retail 157,617 153,459 155,448 142,701 148,611 173,976 203,111 190,194 157,781 153,645 156,405 166,010 1,958,9581617181920 Xcel Energy - South Dakota State21 Test Year Sales and Customers by Customer Class2223 Number of Customers2425 Jan Feb Mar Apr May Jun Jul Aug Sep Oct Nov Dec Average2627 Residential without Space Heat 66,791 66,857 66,914 66,950 67,040 67,103 67,267 67,527 67,623 67,706 67,743 67,806 67,27728 Residential with Space Heat 2,672 2,696 2,715 2,721 2,728 2,732 2,745 2,759 2,785 2,813 2,827 2,886 2,75729 Small Commercial & Industrial 10,007 10,001 10,023 10,039 10,084 10,125 10,131 10,184 10,186 10,219 10,220 10,247 10,25030 Large Commercial & Industrial 19 20 20 20 20 21 21 21 21 19 19 20 1931 Public Street & Highway Lightin 361 362 361 361 362 361 361 364 366 365 366 365 36932 Other Sales to Public Authority 46 46 46 46 0 0 0 0 0 0 0 0 03334 Total Retail 79,896 79,982 80,079 80,137 80,234 80,342 80,525 80,855 80,981 81,122 81,175 81,324 80,5543536373839

Docket No. EL09-____Exhibit___(JEM-1)
Schedule 4, Page 1 of 1
A B C D E F G H I J K L M N1 Xcel Energy - South Dakota State2 2010 Year Sales and Customers by Customer Class34 Weather Normalized Calendar Month Sales (MWh)56 Jan Feb Mar Apr May Jun Jul Aug Sep Oct Nov Dec Year78 Residential without Space Heat 52,112 44,989 45,607 40,840 43,774 56,594 72,307 65,484 48,460 42,321 47,292 58,315 618,0939 Residential with Space Heat 4,742 4,000 3,529 2,159 2,177 2,069 2,483 2,340 1,834 2,139 2,621 5,197 35,29210 Small Commercial & Industrial 76,864 75,178 70,957 70,335 79,852 79,805 89,221 86,858 81,159 76,261 80,768 79,193 946,45111 Large Commercial & Industrial 29,861 26,093 23,426 27,228 32,214 31,423 36,465 34,728 34,313 32,930 29,225 29,352 367,25912 Public Street & Highway Lightin 1,165 1,026 972 881 792 727 699 744 834 940 1,018 1,160 10,95813 Other Sales to Public Authority 0 0 0 0 0 0 0 0 0 0 0 0 01415 Total Retail 164,743 151,287 144,491 141,444 158,809 170,617 201,176 190,154 166,601 154,589 160,923 173,217 1,978,0521617181920 Xcel Energy - South Dakota State21 2010 Year Sales and Customers by Customer Class2223 Number of Customers2425 Jan Feb Mar Apr May Jun Jul Aug Sep Oct Nov Dec Average2627 Residential without Space Heat 68,887 68,968 69,048 69,128 69,208 69,288 69,367 69,447 69,558 69,669 69,781 69,892 69,35328 Residential with Space Heat 2,936 2,940 2,944 2,947 2,951 2,955 2,959 2,963 2,967 2,970 2,974 2,978 2,95729 Small Commercial & Industrial 10,383 10,395 10,407 10,419 10,431 10,443 10,455 10,467 10,483 10,500 10,517 10,533 10,45330 Large Commercial & Industrial 20 20 20 20 20 20 20 20 20 20 20 20 2031 Public Street & Highway Lightin 370 371 371 371 372 372 372 373 373 374 374 375 37232 Other Sales to Public Authority 0 0 0 0 0 0 0 0 0 0 0 0 03334 Total Retail 82,596 82,694 82,790 82,885 82,982 83,078 83,173 83,270 83,401 83,533 83,666 83,798 83,1563536373839

Docket No. EL09-____Exhibit____(JEM-1)
Schedule 5, Page 1 of 24Xcel Energy South Dakota Residential without Space Heat2010 Year MWh Electric Sales
Variable Coefficient StdErr T-Stat P-Value DefinitionCONST -39254.138 3713.453 -10.571 0.00% Constant termSD.GSP2000C_SD 1.610 0.091 17.752 0.00% Real Gross State Product, South DakotaBillingDayscellnet.BillDaysCellnet21 1079.187 97.616 11.055 0.00% Billing DaysSDRXWeather.H65_bill_RX_SD_Jan 0.000 0.000 15.477 0.00% January HDD65 * January customersSDRXWeather.H65_bill_RX_SD_Feb 0.00009271 0.000 11.971 0.00% February HDD65 * February customersSDRXWeather.H65_bill_RX_SD_Mar 0.00007602 0.000 8.702 0.00% March HDD65 * March customersSDRXWeather.H65_bill_RX_SD_Apr 0.00005301 0.000 4.195 0.01% April HDD65 * April customersSDRXWeather.H65_bill_RX_SD_Nov 0.00004834 0.000 3.223 0.17% November HDD65 * November customersSDRXWeather.H65_bill_RX_SD_Dec 0.00010842 0.000 11.546 0.00% December HDD65 * December customersSDRXWeather.T65_bill_RX_SD_May 0.00215979 0.001 1.718 8.85% May THI65 * May customersSDRXWeather.T65_bill_RX_SD_Jun 0.00295035 0.000 13.447 0.00% June THI65 * June customersSDRXWeather.T65_bill_RX_SD_Jul 0.00257740 0.000 39.832 0.00% July THI65 * July customersSDRXWeather.T65_bill_RX_SD_Aug 0.00253678 0.000 46.044 0.00% August THI65 * August customersSDRXWeather.T65_bill_RX_SD_Sep 0.00268564 0.000 26.776 0.00% September THI65 * September customersSDRXWeather.T65_bill_RX_SD_Oct 0.00233726 0.000 5.447 0.00% October THI65 * October customersAR(1) 0.46220505 0.090 5.129 0.00% First order autoregressive term

Docket No. EL09-____Exhibit____(JEM-1)
Schedule 5, Page 2 of 24Xcel Energy South Dakota Residential without Space Heat2010 Year MWh Electric Sales
Regression StatisticsIterations 9Adjusted Observations 131Deg. of Freedom for Error 115R-Squared 0.984Adjusted R-Squared 0.982Durbin-Watson Statistic 2.084Durbin-H Statistic #NAAIC 14.583BIC 14.934F-Statistic 479.881Prob (F-Statistic) 0.0000Log-Likelihood -1116.46Model Sum of Squares 13832681140Sum of Squared Errors 220993256Mean Squared Error 1921680.49Std. Error of Regression 1386.25Mean Abs. Dev. (MAD) 1038.83Mean Abs. % Err. (MAPE) 2.37%Ljung-Box Statistic 28.79Prob (Ljung-Box) 0.2282

Xcel Energy South Dakota Residential without Space Heat2010 Year MWh Electric Sales
Docket No. EL09-____Exhibit____(JEM-1)
Schedule 5, Page 3 of 24
Year Month Actual Pred Resid %Resid StdResid1998 1 37,918.0001998 2 31,110.000 31,124.517 -14.517 -0.05% -0.0101998 3 30,461.000 30,183.458 277.542 0.91% 0.2001998 4 29,854.000 29,174.607 679.393 2.28% 0.4901998 5 29,942.000 28,323.106 1,618.894 5.41% 1.1681998 6 33,198.000 32,833.198 364.802 1.10% 0.2631998 7 49,188.000 46,668.260 2,519.740 5.12% 1.8181998 8 47,170.000 45,078.420 2,091.580 4.43% 1.5091998 9 46,387.000 46,170.939 216.061 0.47% 0.1561998 10 33,290.000 31,505.071 1,784.929 5.36% 1.2881998 11 30,988.000 30,194.559 793.441 2.56% 0.5721998 12 35,358.000 37,489.972 -2,131.972 -6.03% -1.5381999 1 42,056.000 42,673.941 -617.941 -1.47% -0.4461999 2 32,681.000 32,440.721 240.279 0.74% 0.1731999 3 31,164.000 31,409.887 -245.887 -0.79% -0.1771999 4 30,312.000 30,594.881 -282.881 -0.93% -0.2041999 5 27,659.000 27,364.917 294.083 1.06% 0.2121999 6 37,683.000 37,535.751 147.249 0.39% 0.1061999 7 50,046.000 49,655.069 390.931 0.78% 0.2821999 8 53,829.000 52,254.773 1,574.227 2.92% 1.1361999 9 41,867.000 44,567.548 -2,700.548 -6.45% -1.9481999 10 29,143.000 28,175.007 967.993 3.32% 0.6981999 11 28,982.000 30,200.208 -1,218.208 -4.20% -0.8791999 12 36,316.000 37,499.057 -1,183.057 -3.26% -0.8532000 1 42,757.000 42,113.098 643.902 1.51% 0.4642000 2 34,889.000 35,333.444 -444.444 -1.27% -0.3212000 3 31,266.000 32,411.847 -1,145.847 -3.66% -0.8272000 4 30,587.000 31,195.568 -608.568 -1.99% -0.4392000 5 29,953.000 31,599.287 -1,646.287 -5.50% -1.1882000 6 36,535.000 35,553.243 981.757 2.69% 0.7082000 7 51,396.000 49,729.729 1,666.271 3.24% 1.2022000 8 53,517.000 51,161.027 2,355.973 4.40% 1.7002000 9 47,162.000 46,109.577 1,052.423 2.23% 0.7592000 10 33,622.000 32,572.809 1,049.191 3.12% 0.7572000 11 33,025.000 33,293.232 -268.232 -0.81% -0.1932000 12 40,657.000 42,884.740 -2,227.740 -5.48% -1.6072001 1 44,705.000 46,346.460 -1,641.460 -3.67% -1.1842001 2 36,342.052 36,617.877 -275.825 -0.76% -0.1992001 3 35,519.063 35,313.899 205.164 0.58% 0.148

Xcel Energy South Dakota Residential without Space Heat2010 Year MWh Electric Sales
Docket No. EL09-____Exhibit____(JEM-1)
Schedule 5, Page 4 of 24Year Month Actual Pred Resid %Resid StdResid2001 4 33,890.057 33,263.752 626.305 1.85% 0.4522001 5 32,945.568 32,304.336 641.232 1.95% 0.4632001 6 36,841.310 38,021.646 -1,180.336 -3.20% -0.8512001 7 54,985.304 56,631.165 -1,645.861 -2.99% -1.1872001 8 61,628.700 62,126.158 -497.458 -0.81% -0.3592001 9 46,611.875 45,283.653 1,328.222 2.85% 0.9582001 10 33,155.129 31,716.262 1,438.867 4.34% 1.0382001 11 32,697.102 33,080.777 -383.675 -1.17% -0.2772001 12 39,644.813 39,784.915 -140.102 -0.35% -0.1012002 1 44,891.722 45,892.395 -1,000.673 -2.23% -0.7222002 2 37,303.717 37,620.361 -316.644 -0.85% -0.2282002 3 37,010.243 37,326.566 -316.323 -0.85% -0.2282002 4 35,999.123 36,429.371 -430.248 -1.20% -0.3102002 5 32,030.272 33,236.633 -1,206.361 -3.77% -0.8702002 6 42,012.834 41,223.676 789.158 1.88% 0.5692002 7 66,986.268 68,674.788 -1,688.520 -2.52% -1.2182002 8 60,230.203 59,065.860 1,164.343 1.93% 0.8402002 9 52,393.013 55,460.703 -3,067.690 -5.86% -2.2132002 10 36,344.658 36,358.581 -13.923 -0.04% -0.0102002 11 35,497.100 36,093.004 -595.904 -1.68% -0.4302002 12 43,306.124 44,558.762 -1,252.638 -2.89% -0.9042003 1 46,658.752 47,439.130 -780.378 -1.67% -0.5632003 2 40,719.624 40,310.672 408.952 1.00% 0.2952003 3 38,662.774 38,984.771 -321.997 -0.83% -0.2322003 4 34,935.625 35,959.669 -1,024.044 -2.93% -0.7392003 5 33,622.572 34,146.231 -523.659 -1.56% -0.3782003 6 38,154.891 38,609.135 -454.244 -1.19% -0.3282003 7 54,823.425 55,158.960 -335.535 -0.61% -0.2422003 8 60,586.622 58,766.443 1,820.179 3.00% 1.3132003 9 55,018.368 55,230.589 -212.221 -0.39% -0.1532003 10 35,037.349 36,029.815 -992.466 -2.83% -0.7162003 11 36,394.729 36,101.594 293.135 0.81% 0.2112003 12 45,449.507 45,974.975 -525.468 -1.16% -0.3792004 1 48,471.913 49,300.442 -828.529 -1.71% -0.5982004 2 42,758.009 43,008.692 -250.683 -0.59% -0.1812004 3 38,267.789 39,047.993 -780.204 -2.04% -0.5632004 4 35,668.708 37,451.182 -1,782.474 -5.00% -1.2862004 5 35,070.199 35,621.892 -551.693 -1.57% -0.3982004 6 41,876.664 41,640.854 235.810 0.56% 0.1702004 7 51,932.572 50,304.969 1,627.603 3.13% 1.1742004 8 52,657.203 51,750.376 906.827 1.72% 0.654

Xcel Energy South Dakota Residential without Space Heat2010 Year MWh Electric Sales
Docket No. EL09-____Exhibit____(JEM-1)
Schedule 5, Page 5 of 24Year Month Actual Pred Resid %Resid StdResid2004 9 48,089.003 48,963.510 -874.507 -1.82% -0.6312004 10 39,175.966 39,337.149 -161.183 -0.41% -0.1162004 11 36,557.718 37,430.823 -873.105 -2.39% -0.6302004 12 45,793.526 45,901.326 -107.800 -0.24% -0.0782005 1 52,524.398 52,031.607 492.791 0.94% 0.3552005 2 39,009.819 40,895.079 -1,885.260 -4.83% -1.3602005 3 40,503.358 42,016.493 -1,513.135 -3.74% -1.0922005 4 39,029.886 38,012.913 1,016.973 2.61% 0.7342005 5 35,090.345 36,237.678 -1,147.333 -3.27% -0.8282005 6 46,553.168 46,081.841 471.327 1.01% 0.3402005 7 63,049.050 64,160.853 -1,111.803 -1.76% -0.8022005 8 72,273.000 70,756.269 1,516.731 2.10% 1.0942005 9 54,982.076 55,001.631 -19.555 -0.04% -0.0142005 10 41,269.826 41,356.840 -87.014 -0.21% -0.0632005 11 35,690.830 37,066.410 -1,375.580 -3.85% -0.9922005 12 46,789.000 45,694.295 1,094.705 2.34% 0.7902006 1 50,300.141 51,301.013 -1,000.872 -1.99% -0.7222006 2 40,113.081 41,017.860 -904.779 -2.26% -0.6532006 3 45,216.621 44,996.024 220.597 0.49% 0.1592006 4 36,267.201 36,696.697 -429.496 -1.18% -0.3102006 5 36,729.299 39,723.494 -2,994.195 -8.15% -2.1602006 6 53,923.268 50,885.051 3,038.217 5.63% 2.1922006 7 60,403.389 58,512.944 1,890.445 3.13% 1.3642006 8 76,199.844 77,242.782 -1,042.939 -1.37% -0.7522006 9 49,092.443 47,378.262 1,714.181 3.49% 1.2372006 10 40,444.215 41,081.635 -637.420 -1.58% -0.4602006 11 39,689.074 38,776.350 912.724 2.30% 0.6582006 12 44,986.464 44,647.767 338.697 0.75% 0.2442007 1 57,141.961 54,600.492 2,541.469 4.45% 1.8332007 2 46,495.860 46,174.398 321.462 0.69% 0.2322007 3 47,311.431 45,687.087 1,624.344 3.43% 1.1722007 4 39,249.568 40,951.273 -1,701.705 -4.34% -1.2282007 5 42,340.580 41,261.083 1,079.497 2.55% 0.7792007 6 48,712.663 51,599.360 -2,886.697 -5.93% -2.0822007 7 66,967.320 66,047.256 920.064 1.37% 0.6642007 8 74,203.107 76,952.496 -2,749.389 -3.71% -1.9832007 9 55,045.203 52,989.515 2,055.688 3.73% 1.4832007 10 47,147.444 48,025.886 -878.442 -1.86% -0.6342007 11 39,903.334 39,329.775 573.559 1.44% 0.4142007 12 47,343.419 46,799.116 544.303 1.15% 0.3932008 1 59,940.604 58,575.287 1,365.317 2.28% 0.985

Xcel Energy South Dakota Residential without Space Heat2010 Year MWh Electric Sales
Docket No. EL09-____Exhibit____(JEM-1)
Schedule 5, Page 6 of 24Year Month Actual Pred Resid %Resid StdResid2008 2 50,573.557 49,047.394 1,526.163 3.02% 1.1012008 3 45,217.863 45,227.871 -10.008 -0.02% -0.0072008 4 45,959.974 45,169.304 790.670 1.72% 0.5702008 5 38,822.304 39,941.976 -1,119.672 -2.88% -0.8082008 6 44,031.942 43,110.481 921.461 2.09% 0.6652008 7 63,235.672 62,750.838 484.834 0.77% 0.3502008 8 64,031.691 65,964.600 -1,932.909 -3.02% -1.3942008 9 56,998.815 54,223.982 2,774.833 4.87% 2.0022008 10 44,796.797 45,641.946 -845.149 -1.89% -0.6102008 11 37,108.884 36,281.528 827.356 2.23% 0.5972008 12 56,218.574 52,430.124 3,788.450 6.74% 2.7332009 1 57,944.3622009 2 46,302.8162009 3 47,061.7242009 4 42,897.0592009 5 39,047.8062009 6 50,328.9682009 7 67,767.3402009 8 64,906.2242009 9 58,069.3172009 10 43,590.6892009 11 38,655.5782009 12 52,006.1782010 1 54,707.9392010 2 46,353.7582010 3 49,321.7622010 4 44,087.6132010 5 39,219.5292010 6 51,844.8232010 7 66,208.4882010 8 69,405.1402010 9 59,390.8762010 10 43,087.2782010 11 41,668.4912010 12 51,179.423

Docket No. EL09-____Exhibit____(JEM-1)
Schedule 5, Page 7 of 24Xcel Energy South Dakota Residential with Space Heat2010 Year MWh Electric Sales
Variable Coefficient StdErr T-Stat P-Value DefinitionCONST -1274.408 331.562 -3.844 0.02% Constant termSD.CYPNR_SD 45.149 8.004 5.640 0.00% Real per Capita Personal Income, South DakotaBillingDayscellnet.BillDaysCellnet21 51.713 8.257 6.263 0.00% Billing DaysSDRHWeather.H65_bill_RH_SD_Jan 0.00071076 0.000 36.949 0.00% January HDD65 * January customersSDRHWeather.H65_bill_RH_SD_Feb 0.00070093 0.000 36.495 0.00% February HDD65 * February customersSDRHWeather.H65_bill_RH_SD_Mar 0.00067022 0.000 30.561 0.00% March HDD65 * March customersSDRHWeather.H65_bill_RH_SD_Apr 0.00055283 0.000 16.377 0.00% April HDD65 * April customersSDRHWeather.H65_bill_RH_SD_May 0.00035010 0.000 5.304 0.00% May HDD65 * April customersSDRHWeather.H65_bill_RH_SD_Oct 0.00020644 0.000 2.453 1.57% October HDD65 * October customersSDRHWeather.H65_bill_RH_SD_Nov 0.00043849 0.000 11.041 0.00% November HDD65 * November customersSDRHWeather.H65_bill_RH_SD_Dec 0.00063289 0.000 27.911 0.00% December HDD65 * December customersSDRHWeather.T65_bill_RH_SD_Jun 0.00161019 0.001 2.879 0.48% June THI65 * June customersSDRHWeather.T65_bill_RH_SD_Jul 0.00152013 0.000 9.328 0.00% July THI65 * July customersSDRHWeather.T65_bill_RH_SD_Aug 0.00154228 0.000 11.191 0.00% August THI65 * August customersSDRHWeather.T65_bill_RH_SD_Sep 0.00143990 0.000 5.583 0.00% September THI65 * September customersBinaryTrans.Jul08 559.438 112.636 4.967 0.00% Binary variable July 2008AR(1) 0.373 0.094 3.954 0.01% First order autoregressive term
Docket No. EL09-____Exhibit____(JEM-1)
Schedule 5, Page 8 of 24Xcel Energy South Dakota Residential with Space Heat2010 Year MWh Electric Sales
Regression StatisticsIterations 9Adjusted Observations 131Deg. of Freedom for Error 114R-Squared 0.986Adjusted R-Squared 0.984Durbin-Watson Statistic 2.099Durbin-H Statistic #NAAIC 9.575BIC 9.948F-Statistic 492.868Prob (F-Statistic) 0.0000Log-Likelihood -789.96Model Sum of Squares 100655242Sum of Squared Errors 1455094Mean Squared Error 12763.98Std. Error of Regression 112.98Mean Abs. Dev. (MAD) 81.03Mean Abs. % Err. (MAPE) 3.31%Ljung-Box Statistic 31.11Prob (Ljung-Box) 0.1507

Xcel Energy South Dakota Residential with Space Heat2010 Year MWh Electric Sales
Docket No. EL09-____Exhibit____(JEM-1)
Schedule 5, Page 9 of 24
Year Month Actual Pred Resid %Resid StdResid1998 1 3,919.0001998 2 3,173.000 3,270.461 -97.461 -3.07% -0.8631998 3 3,195.000 3,031.041 163.959 5.13% 1.4511998 4 2,490.000 2,393.896 96.104 3.86% 0.8511998 5 1,702.000 1,668.247 33.753 1.98% 0.2991998 6 1,540.000 1,540.593 -0.593 -0.04% -0.0051998 7 1,868.000 1,877.244 -9.244 -0.49% -0.0821998 8 1,858.000 1,782.301 75.699 4.07% 0.6701998 9 1,829.000 1,813.637 15.363 0.84% 0.1361998 10 1,543.000 1,520.103 22.897 1.48% 0.2031998 11 2,123.000 2,053.146 69.854 3.29% 0.6181998 12 2,975.000 3,029.103 -54.103 -1.82% -0.4791999 1 4,420.000 4,359.204 60.796 1.38% 0.5381999 2 3,194.000 3,205.824 -11.824 -0.37% -0.1051999 3 3,222.000 2,984.781 237.219 7.36% 2.1001999 4 2,338.000 2,435.272 -97.272 -4.16% -0.8611999 5 1,733.000 1,646.671 86.329 4.98% 0.7641999 6 1,552.000 1,676.921 -124.921 -8.05% -1.1061999 7 1,957.000 1,916.482 40.518 2.07% 0.3591999 8 2,018.000 2,000.223 17.777 0.88% 0.1571999 9 1,636.000 1,779.191 -143.191 -8.75% -1.2671999 10 1,525.000 1,524.349 0.651 0.04% 0.0061999 11 1,794.000 1,969.940 -175.940 -9.81% -1.5571999 12 2,765.000 2,974.032 -209.032 -7.56% -1.8502000 1 4,106.000 3,837.897 268.103 6.53% 2.3732000 2 3,454.000 3,502.379 -48.379 -1.40% -0.4282000 3 2,575.000 2,687.123 -112.123 -4.35% -0.9922000 4 2,182.000 2,274.989 -92.989 -4.26% -0.8232000 5 1,689.000 1,697.004 -8.004 -0.47% -0.0712000 6 1,628.000 1,575.872 52.128 3.20% 0.4612000 7 1,977.000 1,937.638 39.362 1.99% 0.3482000 8 2,032.000 1,958.464 73.536 3.62% 0.6512000 9 1,778.000 1,798.636 -20.636 -1.16% -0.1832000 10 1,655.000 1,581.190 73.810 4.46% 0.6532000 11 2,162.000 2,076.569 85.431 3.95% 0.7562000 12 4,076.000 3,867.124 208.876 5.12% 1.8492001 1 4,531.000 4,619.187 -88.187 -1.95% -0.7812001 2 4,120.621 3,878.704 241.917 5.87% 2.1412001 3 3,484.455 3,741.466 -257.011 -7.38% -2.275

Xcel Energy South Dakota Residential with Space Heat2010 Year MWh Electric Sales
Docket No. EL09-____Exhibit____(JEM-1)
Schedule 5, Page 10 of 24Year Month Actual Pred Resid %Resid StdResid2001 4 2,746.481 2,580.335 166.146 6.05% 1.4712001 5 1,896.568 1,771.970 124.598 6.57% 1.1032001 6 1,738.127 1,704.273 33.854 1.95% 0.3002001 7 2,082.238 2,173.649 -91.411 -4.39% -0.8092001 8 2,283.100 2,279.205 3.895 0.17% 0.0342001 9 1,765.990 1,815.582 -49.592 -2.81% -0.4392001 10 1,586.863 1,575.635 11.228 0.71% 0.0992001 11 1,940.657 2,023.469 -82.812 -4.27% -0.7332001 12 2,840.265 2,989.967 -149.702 -5.27% -1.3252002 1 3,883.979 3,980.315 -96.336 -2.48% -0.8532002 2 3,478.283 3,343.734 134.549 3.87% 1.1912002 3 3,425.145 3,435.259 -10.114 -0.30% -0.0902002 4 2,803.874 2,706.467 97.407 3.47% 0.8622002 5 1,880.390 1,846.625 33.765 1.80% 0.2992002 6 1,790.840 1,677.091 113.749 6.35% 1.0072002 7 2,417.370 2,367.702 49.668 2.05% 0.4402002 8 2,172.222 2,129.791 42.431 1.95% 0.3762002 9 1,900.933 1,967.913 -66.980 -3.52% -0.5932002 10 1,709.620 1,610.945 98.675 5.77% 0.8732002 11 2,469.443 2,345.219 124.224 5.03% 1.1002002 12 3,404.852 3,513.976 -109.124 -3.20% -0.9662003 1 3,974.813 4,058.525 -83.712 -2.11% -0.7412003 2 3,966.196 3,859.941 106.255 2.68% 0.9402003 3 3,495.769 3,600.041 -104.272 -2.98% -0.9232003 4 2,418.675 2,403.504 15.171 0.63% 0.1342003 5 1,794.251 1,862.758 -68.507 -3.82% -0.6062003 6 1,648.342 1,618.950 29.392 1.78% 0.2602003 7 2,010.305 2,043.972 -33.667 -1.67% -0.2982003 8 2,166.766 2,106.884 59.882 2.76% 0.5302003 9 1,958.437 2,004.684 -46.247 -2.36% -0.4092003 10 1,553.564 1,661.915 -108.351 -6.97% -0.9592003 11 2,275.997 2,267.591 8.406 0.37% 0.0742003 12 3,549.926 3,558.303 -8.377 -0.24% -0.0742004 1 4,132.704 4,201.851 -69.147 -1.67% -0.6122004 2 4,156.457 4,173.010 -16.553 -0.40% -0.1472004 3 3,072.871 3,141.150 -68.279 -2.22% -0.6042004 4 2,217.124 2,390.862 -173.738 -7.84% -1.5382004 5 1,791.979 1,780.396 11.583 0.65% 0.1032004 6 1,730.500 1,696.452 34.048 1.97% 0.3012004 7 1,939.255 1,918.177 21.078 1.09% 0.1872004 8 1,872.396 1,922.019 -49.623 -2.65% -0.439

Xcel Energy South Dakota Residential with Space Heat2010 Year MWh Electric Sales
Docket No. EL09-____Exhibit____(JEM-1)
Schedule 5, Page 11 of 24Year Month Actual Pred Resid %Resid StdResid2004 9 1,800.064 1,823.286 -23.222 -1.29% -0.2062004 10 1,640.359 1,663.696 -23.337 -1.42% -0.2072004 11 2,007.604 2,158.568 -150.964 -7.52% -1.3362004 12 3,264.929 3,340.091 -75.162 -2.30% -0.6652005 1 4,508.332 4,499.601 8.731 0.19% 0.0772005 2 3,181.024 3,427.129 -246.105 -7.74% -2.1782005 3 3,346.279 3,375.068 -28.789 -0.86% -0.2552005 4 2,463.382 2,410.367 53.015 2.15% 0.4692005 5 1,641.919 1,897.741 -255.822 -15.58% -2.2642005 6 1,794.676 1,760.034 34.642 1.93% 0.3072005 7 2,140.064 2,170.200 -30.136 -1.41% -0.2672005 8 2,419.000 2,440.300 -21.300 -0.88% -0.1892005 9 1,882.438 1,945.589 -63.151 -3.35% -0.5592005 10 1,598.114 1,648.863 -50.749 -3.18% -0.4492005 11 1,848.247 2,082.268 -234.021 -12.66% -2.0712005 12 3,348.000 3,396.470 -48.470 -1.45% -0.4292006 1 3,786.819 3,878.668 -91.849 -2.43% -0.8132006 2 2,990.673 3,159.934 -169.261 -5.66% -1.4982006 3 3,535.222 3,527.621 7.601 0.21% 0.0672006 4 2,244.558 2,244.682 -0.124 -0.01% -0.0012006 5 1,899.860 1,928.366 -28.506 -1.50% -0.2522006 6 1,895.710 1,899.469 -3.759 -0.20% -0.0332006 7 2,069.482 1,988.973 80.509 3.89% 0.7132006 8 2,637.436 2,563.929 73.507 2.79% 0.6512006 9 1,920.541 1,769.381 151.161 7.87% 1.3382006 10 1,765.419 1,883.461 -118.042 -6.69% -1.0452006 11 2,425.399 2,328.264 97.135 4.00% 0.8602006 12 3,157.882 3,263.767 -105.885 -3.35% -0.9372007 1 4,370.165 4,305.166 64.999 1.49% 0.5752007 2 4,238.282 4,270.655 -32.373 -0.76% -0.2872007 3 3,824.063 3,753.100 70.963 1.86% 0.6282007 4 2,497.905 2,602.888 -104.983 -4.20% -0.9292007 5 2,060.001 1,927.267 132.734 6.44% 1.1752007 6 1,915.286 1,969.102 -53.816 -2.81% -0.4762007 7 2,313.171 2,330.692 -17.521 -0.76% -0.1552007 8 2,463.516 2,628.424 -164.908 -6.69% -1.4602007 9 2,067.801 1,854.170 213.631 10.33% 1.8912007 10 1,960.957 1,960.049 0.908 0.05% 0.0082007 11 2,189.299 2,280.709 -91.410 -4.18% -0.8092007 12 3,483.872 3,520.202 -36.330 -1.04% -0.3222008 1 4,973.228 4,964.188 9.040 0.18% 0.080

Xcel Energy South Dakota Residential with Space Heat2010 Year MWh Electric Sales
Docket No. EL09-____Exhibit____(JEM-1)
Schedule 5, Page 12 of 24Year Month Actual Pred Resid %Resid StdResid2008 2 4,568.821 4,526.821 42.000 0.92% 0.3722008 3 4,003.580 3,849.372 154.208 3.85% 1.3652008 4 3,200.518 3,161.710 38.808 1.21% 0.3432008 5 2,202.112 2,113.450 88.662 4.03% 0.7852008 6 1,898.212 1,822.448 75.764 3.99% 0.6712008 7 2,886.281 2,880.920 5.361 0.19% 0.0472008 8 2,305.126 2,290.741 14.385 0.62% 0.1272008 9 2,192.078 2,090.826 101.252 4.62% 0.8962008 10 2,047.970 1,984.306 63.664 3.11% 0.5642008 11 2,270.490 2,152.335 118.154 5.20% 1.0462008 12 4,553.250 4,230.720 322.531 7.08% 2.8552009 1 5,091.5152009 2 4,224.2902009 3 4,059.2732009 4 2,921.0142009 5 2,004.2162009 6 1,990.1722009 7 2,444.2902009 8 2,328.3782009 9 2,118.6202009 10 1,938.6402009 11 2,335.6752009 12 4,086.3922010 1 4,791.6812010 2 4,228.3092010 3 4,256.1762010 4 2,958.7202010 5 1,951.3372010 6 1,996.9142010 7 2,329.0002010 8 2,437.6822010 9 2,107.0902010 10 1,837.4542010 11 2,452.7342010 12 3,905.697

Docket No. EL09-____Exhibit____(JEM-1)
Schedule 5, Page 13 of 24Xcel Energy South Dakota Small Commercial and Industrial2010 Year MWh Electric Sales
Variable Coefficient StdErr T-Stat P-Value DefinitionCONST -86495.389 10224.305 -8.460 0.00% Constant termSD.EE_SD 378.133 26.265 14.397 0.00% Total Employment, South DakotaSDSmCIWeather.H65_bill_SmCI_SD_JanFebNovDec 0.00057179 0.000 5.870 0.00% HDD65 * customers; November, December, January, FebruarySDSmCIWeather.H65_bill_SmCI_SD_MarAprMay 0.00038171 0.000 2.625 0.99% HDD65 * customers; March, April, MaySDSmCIWeather.T65_bill_SmCI_SD_Jun 0.02218539 0.004 6.077 0.00% June THI65 * June customersSDSmCIWeather.T65_bill_SmCI_SD_Jul 0.01011341 0.001 9.335 0.00% July THI65 * July customersSDSmCIWeather.T65_bill_SmCI_SD_Aug 0.00993332 0.001 11.044 0.00% August THI65 * August customersSDSmCIWeather.T65_bill_SmCI_SD_Sep 0.01370545 0.002 8.520 0.00% September THI65 * September customersSDSmCIWeather.T65_bill_SmCI_SD_Oct 0.03795003 0.007 5.643 0.00% October THI65 * October customersBinary.CIReclass01Pre -34235.258 893.917 -38.298 0.00% Binary variable for 2001 C&I reclassificationBinary2.Jun2005 26591.158 3622.707 7.340 0.00% Binary variable June 2005Binary2.Jul2005 19315.073 3708.940 5.208 0.00% Binary variable July 2005Binary2.Aug2005 28685.395 3680.594 7.794 0.00% Binary variable August 2005Binary2.Nov2005 19447.434 3492.902 5.568 0.00% Binary variable November 2005Binary2.Jan2001 17007.554 3554.309 4.785 0.00% Binary variable January 2001Binary2.Dec2003 11939.597 3499.651 3.412 0.09% Binary variable December 2004Binary2.May2005 9095.611 3498.407 2.600 1.06% Binary variable May 2005Binary2.Mar2007 10172.346 3625.339 2.806 0.59% Binary variable March 2007

Docket No. EL09-____Exhibit____(JEM-1)
Schedule 5, Page 14 of 24Xcel Energy South Dakota Small Commercial and Industrial2010 Year MWh Electric Sales
Regression StatisticsIterations 1Adjusted Observations 132Deg. of Freedom for Error 114R-Squared 0.979Adjusted R-Squared 0.976Durbin-Watson Statistic 1.709Durbin-H Statistic #NAAIC 16.411BIC 16.805F-Statistic 315.949Prob (F-Statistic) 0.0000Log-Likelihood -1252.46Model Sum of Squares 63487962703Sum of Squared Errors 1347504295Mean Squared Error 11820213.11Std. Error of Regression 3438.05Mean Abs. Dev. (MAD) 2549.44Mean Abs. % Err. (MAPE) 5.25%Ljung-Box Statistic 41.73Prob (Ljung-Box) 0.0138

Docket No. EL09-____Exhibit____(JEM-1)
Schedule 5, Page 15 of 24Xcel Energy South Dakota Small Commercial and Industrial2010 Year MWh Electric Sales
Year Month Actual Pred Resid %Resid StdResid1998 1 23,937.000 20,106.893 3,830.107 16.00% 1.1141998 2 21,965.000 19,284.531 2,680.469 12.20% 0.7801998 3 21,337.000 17,680.995 3,656.005 17.13% 1.0631998 4 21,010.000 16,866.799 4,143.201 19.72% 1.2051998 5 21,699.000 15,757.111 5,941.889 27.38% 1.7281998 6 22,969.000 19,920.440 3,048.560 13.27% 0.8871998 7 25,710.000 25,763.070 -53.070 -0.21% -0.0151998 8 26,239.000 25,374.083 864.917 3.30% 0.2521998 9 25,892.000 28,227.046 -2,335.046 -9.02% -0.6791998 10 22,501.000 24,242.779 -1,741.779 -7.74% -0.5071998 11 21,603.000 19,473.710 2,129.290 9.86% 0.6191998 12 23,098.000 21,321.975 1,776.025 7.69% 0.5171999 1 26,031.000 24,713.880 1,317.120 5.06% 0.3831999 2 22,846.000 22,580.966 265.034 1.16% 0.0771999 3 22,240.000 20,957.849 1,282.151 5.77% 0.3731999 4 21,890.000 20,402.742 1,487.258 6.79% 0.4331999 5 20,749.000 19,761.196 987.804 4.76% 0.2871999 6 24,238.000 28,007.548 -3,769.548 -15.55% -1.0961999 7 27,150.000 30,924.891 -3,774.891 -13.90% -1.0981999 8 28,622.000 32,875.746 -4,253.746 -14.86% -1.2371999 9 25,564.000 30,792.160 -5,228.160 -20.45% -1.5211999 10 22,051.000 22,091.373 -40.373 -0.18% -0.0121999 11 21,371.000 23,497.250 -2,126.250 -9.95% -0.6181999 12 24,492.000 25,967.175 -1,475.175 -6.02% -0.4292000 1 27,719.000 28,353.200 -634.200 -2.29% -0.1842000 2 24,662.000 28,087.291 -3,425.291 -13.89% -0.9962000 3 23,722.000 24,877.798 -1,155.798 -4.87% -0.3362000 4 23,023.000 24,500.003 -1,477.003 -6.42% -0.4302000 5 24,870.000 23,432.493 1,437.507 5.78% 0.4182000 6 26,809.000 27,991.521 -1,182.521 -4.41% -0.3442000 7 30,241.000 32,425.583 -2,184.583 -7.22% -0.6352000 8 31,444.000 33,128.423 -1,684.423 -5.36% -0.4902000 9 30,316.000 31,794.499 -1,478.499 -4.88% -0.4302000 10 26,501.000 24,312.501 2,188.499 8.26% 0.6372000 11 25,688.000 24,761.029 926.971 3.61% 0.2702000 12 29,243.000 29,185.451 57.549 0.20% 0.0172001 1 82,345.000 82,345.000 0.000 0.00% 0.0002001 2 64,095.063 64,292.374 -197.311 -0.31% -0.0572001 3 64,573.916 61,485.840 3,088.076 4.78% 0.898

Docket No. EL09-____Exhibit____(JEM-1)
Schedule 5, Page 16 of 24Year Month Actual Pred Resid %Resid StdResid2001 4 54,834.371 59,802.197 -4,967.826 -9.06% -1.4452001 5 56,493.975 57,906.014 -1,412.039 -2.50% -0.4112001 6 59,727.778 63,686.945 -3,959.167 -6.63% -1.1522001 7 67,712.143 71,638.628 -3,926.485 -5.80% -1.1422001 8 71,391.900 75,737.080 -4,345.180 -6.09% -1.2642001 9 66,245.464 67,536.351 -1,290.887 -1.95% -0.3752001 10 58,002.772 58,786.187 -783.415 -1.35% -0.2282001 11 54,780.392 58,743.749 -3,963.357 -7.23% -1.1532001 12 58,782.117 60,537.346 -1,755.229 -2.99% -0.5112002 1 63,031.553 62,719.428 312.125 0.50% 0.0912002 2 57,628.534 61,304.760 -3,676.226 -6.38% -1.0692002 3 57,419.975 59,835.199 -2,415.224 -4.21% -0.7022002 4 58,155.873 58,979.953 -824.080 -1.42% -0.2402002 5 54,976.427 57,643.450 -2,667.023 -4.85% -0.7762002 6 61,567.972 64,620.767 -3,052.795 -4.96% -0.8882002 7 73,690.034 76,079.592 -2,389.558 -3.24% -0.6952002 8 71,611.052 71,576.230 34.822 0.05% 0.0102002 9 70,069.375 71,718.383 -1,649.008 -2.35% -0.4802002 10 60,472.308 64,364.336 -3,892.028 -6.44% -1.1322002 11 58,128.853 60,747.587 -2,618.734 -4.51% -0.7622002 12 64,921.215 62,547.511 2,373.704 3.66% 0.6902003 1 66,708.018 63,429.553 3,278.465 4.91% 0.9542003 2 62,244.124 63,464.922 -1,220.798 -1.96% -0.3552003 3 61,373.134 60,568.852 804.282 1.31% 0.2342003 4 59,379.781 58,560.718 819.063 1.38% 0.2382003 5 60,054.138 57,506.462 2,547.676 4.24% 0.7412003 6 63,755.814 60,878.243 2,877.571 4.51% 0.8372003 7 70,890.927 68,372.917 2,518.010 3.55% 0.7322003 8 72,500.666 71,131.877 1,368.789 1.89% 0.3982003 9 72,608.069 71,240.526 1,367.543 1.88% 0.3982003 10 60,839.229 60,284.448 554.781 0.91% 0.1612003 11 59,903.125 60,771.173 -868.048 -1.45% -0.2522003 12 75,235.140 75,235.140 0.000 0.00% 0.0002004 1 75,346.571 64,593.667 10,752.904 14.27% 3.1282004 2 63,473.003 65,281.265 -1,808.262 -2.85% -0.5262004 3 60,465.096 61,146.217 -681.121 -1.13% -0.1982004 4 60,250.065 60,272.329 -22.264 -0.04% -0.0062004 5 60,778.588 59,749.836 1,028.752 1.69% 0.2992004 6 65,459.020 64,877.745 581.275 0.89% 0.1692004 7 69,857.267 66,896.624 2,960.643 4.24% 0.8612004 8 71,088.694 67,825.064 3,263.630 4.59% 0.949

Docket No. EL09-____Exhibit____(JEM-1)
Schedule 5, Page 17 of 24Year Month Actual Pred Resid %Resid StdResid2004 9 70,627.729 67,828.737 2,798.992 3.96% 0.8142004 10 65,100.864 67,566.413 -2,465.549 -3.79% -0.7172004 11 61,522.894 62,353.673 -830.779 -1.35% -0.2422004 12 67,490.675 65,199.159 2,291.516 3.40% 0.6672005 1 72,162.626 67,977.972 4,184.654 5.80% 1.2172005 2 60,745.373 65,804.174 -5,058.801 -8.33% -1.4712005 3 58,227.675 64,008.998 -5,781.323 -9.93% -1.6822005 4 58,210.254 62,586.632 -4,376.378 -7.52% -1.2732005 5 71,120.466 71,120.466 0.000 0.00% 0.0002005 6 96,108.838 96,108.838 0.000 0.00% 0.0002005 7 97,043.664 97,043.664 0.000 0.00% 0.0002005 8 108,742.000 108,742.000 0.000 0.00% 0.0002005 9 78,720.401 74,672.198 4,048.203 5.14% 1.1772005 10 74,963.960 73,069.489 1,894.471 2.53% 0.5512005 11 84,605.030 84,605.030 0.000 0.00% 0.0002005 12 70,164.000 69,043.124 1,120.876 1.60% 0.3262006 1 75,304.701 69,685.479 5,619.222 7.46% 1.6342006 2 65,361.215 68,756.771 -3,395.556 -5.20% -0.9882006 3 73,257.831 67,653.028 5,604.803 7.65% 1.6302006 4 62,623.798 65,890.643 -3,266.845 -5.22% -0.9502006 5 59,964.968 65,071.323 -5,106.355 -8.52% -1.4852006 6 83,612.222 78,109.450 5,502.772 6.58% 1.6012006 7 79,917.241 76,632.913 3,284.328 4.11% 0.9552006 8 88,285.307 85,686.706 2,598.601 2.94% 0.7562006 9 78,587.977 72,804.175 5,783.802 7.36% 1.6822006 10 72,056.326 68,213.921 3,842.405 5.33% 1.1182006 11 66,690.741 69,493.257 -2,802.516 -4.20% -0.8152006 12 69,115.180 71,340.308 -2,225.128 -3.22% -0.6472007 1 79,313.971 73,333.068 5,980.903 7.54% 1.7402007 2 66,319.254 74,484.768 -8,165.514 -12.31% -2.3752007 3 81,051.389 81,051.389 0.000 0.00% 0.0002007 4 67,159.065 69,251.755 -2,092.690 -3.12% -0.6092007 5 73,947.294 68,014.191 5,933.103 8.02% 1.7262007 6 78,315.079 80,474.876 -2,159.797 -2.76% -0.6282007 7 85,275.188 83,624.509 1,650.679 1.94% 0.4802007 8 93,475.410 88,580.901 4,894.509 5.24% 1.4242007 9 77,280.986 81,200.711 -3,919.725 -5.07% -1.1402007 10 82,138.755 82,201.643 -62.888 -0.08% -0.0182007 11 68,049.864 71,184.632 -3,134.768 -4.61% -0.9122007 12 71,833.219 74,730.724 -2,897.505 -4.03% -0.8432008 1 81,595.607 77,813.843 3,781.764 4.63% 1.100

Docket No. EL09-____Exhibit____(JEM-1)
Schedule 5, Page 18 of 24Year Month Actual Pred Resid %Resid StdResid2008 2 74,938.333 77,568.641 -2,630.308 -3.51% -0.7652008 3 73,108.928 73,421.151 -312.223 -0.43% -0.0912008 4 73,489.399 72,002.380 1,487.019 2.02% 0.4332008 5 69,517.083 70,201.152 -684.069 -0.98% -0.1992008 6 76,661.877 72,412.023 4,249.854 5.54% 1.2362008 7 86,158.327 81,845.900 4,312.427 5.01% 1.2542008 8 83,503.057 86,835.844 -3,332.787 -3.99% -0.9692008 9 84,936.485 80,104.741 4,831.744 5.69% 1.4052008 10 80,846.537 76,832.538 4,013.999 4.96% 1.1682008 11 64,866.035 73,178.841 -8,312.806 -12.82% -2.4182008 12 74,601.558 77,443.942 -2,842.384 -3.81% -0.8272009 1 78,736.9162009 2 77,281.8642009 3 74,321.2762009 4 72,484.3052009 5 70,875.4892009 6 78,810.0462009 7 84,484.5952009 8 84,319.2612009 9 82,818.4742009 10 75,409.7032009 11 72,974.6242009 12 76,555.4302010 1 78,024.3022010 2 77,130.7602010 3 74,621.7002010 4 72,862.2712010 5 71,452.7112010 6 80,063.1402010 7 84,990.5762010 8 86,641.9802010 9 84,354.0672010 10 76,693.5842010 11 74,945.8722010 12 78,075.067
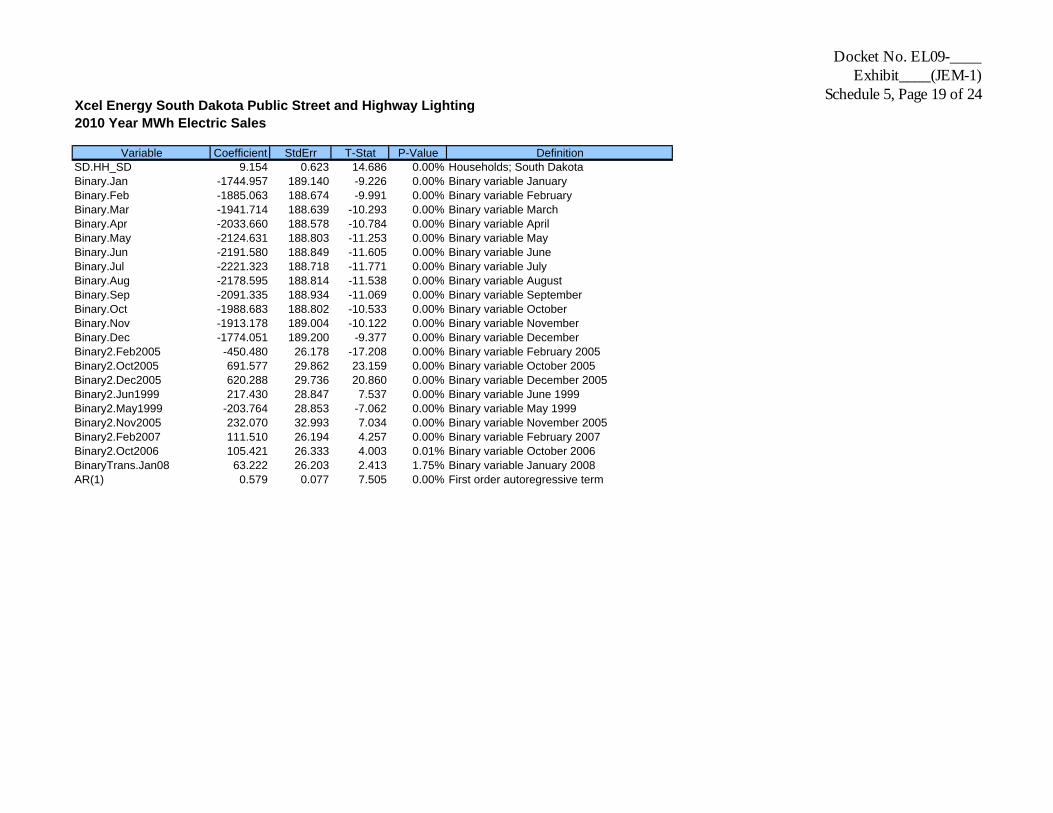
Docket No. EL09-____Exhibit____(JEM-1)
Schedule 5, Page 19 of 24Xcel Energy South Dakota Public Street and Highway Lighting2010 Year MWh Electric Sales
Variable Coefficient StdErr T-Stat P-Value DefinitionSD.HH_SD 9.154 0.623 14.686 0.00% Households; South DakotaBinary.Jan -1744.957 189.140 -9.226 0.00% Binary variable JanuaryBinary.Feb -1885.063 188.674 -9.991 0.00% Binary variable FebruaryBinary.Mar -1941.714 188.639 -10.293 0.00% Binary variable MarchBinary.Apr -2033.660 188.578 -10.784 0.00% Binary variable AprilBinary.May -2124.631 188.803 -11.253 0.00% Binary variable MayBinary.Jun -2191.580 188.849 -11.605 0.00% Binary variable JuneBinary.Jul -2221.323 188.718 -11.771 0.00% Binary variable JulyBinary.Aug -2178.595 188.814 -11.538 0.00% Binary variable AugustBinary.Sep -2091.335 188.934 -11.069 0.00% Binary variable SeptemberBinary.Oct -1988.683 188.802 -10.533 0.00% Binary variable OctoberBinary.Nov -1913.178 189.004 -10.122 0.00% Binary variable NovemberBinary.Dec -1774.051 189.200 -9.377 0.00% Binary variable DecemberBinary2.Feb2005 -450.480 26.178 -17.208 0.00% Binary variable February 2005Binary2.Oct2005 691.577 29.862 23.159 0.00% Binary variable October 2005Binary2.Dec2005 620.288 29.736 20.860 0.00% Binary variable December 2005Binary2.Jun1999 217.430 28.847 7.537 0.00% Binary variable June 1999Binary2.May1999 -203.764 28.853 -7.062 0.00% Binary variable May 1999Binary2.Nov2005 232.070 32.993 7.034 0.00% Binary variable November 2005Binary2.Feb2007 111.510 26.194 4.257 0.00% Binary variable February 2007Binary2.Oct2006 105.421 26.333 4.003 0.01% Binary variable October 2006BinaryTrans.Jan08 63.222 26.203 2.413 1.75% Binary variable January 2008AR(1) 0.579 0.077 7.505 0.00% First order autoregressive term

Docket No. EL09-____Exhibit____(JEM-1)
Schedule 5, Page 20 of 24Xcel Energy South Dakota Public Street and Highway Lighting2010 Year MWh Electric Sales
Regression StatisticsIterations 9Adjusted Observations 131Deg. of Freedom for Error 108R-Squared 0.985Adjusted R-Squared 0.982Durbin-Watson Statistic 2.084Durbin-H Statistic #NAAIC 6.861BIC 7.366F-Statistic 316.971Prob (F-Statistic) 0.0000Log-Likelihood -607.63Model Sum of Squares 5942366Sum of Squared Errors 88031Mean Squared Error 815.10Std. Error of Regression 28.55Mean Abs. Dev. (MAD) 19.90Mean Abs. % Err. (MAPE) 2.71%Ljung-Box Statistic 69.51Prob (Ljung-Box) 0.0000

Docket No. EL09-____Exhibit____(JEM-1)
Schedule 5, Page 21 of 24Xcel Energy South Dakota Public Street and Highway Lighting2010 Year MWh Electric Sales
Year Month Actual Pred Resid %Resid StdResid1998 1 768.0001998 2 641.000 674.249 -33.249 -5.19% -1.1651998 3 637.000 625.562 11.438 1.80% 0.4011998 4 561.000 564.571 -3.571 -0.64% -0.1251998 5 504.000 483.310 20.690 4.11% 0.7251998 6 454.000 436.480 17.520 3.86% 0.6141998 7 438.000 417.018 20.982 4.79% 0.7351998 8 481.000 468.171 12.829 2.67% 0.4491998 9 545.000 556.102 -11.102 -2.04% -0.3891998 10 640.000 645.781 -5.781 -0.90% -0.2031998 11 716.000 717.347 -1.347 -0.19% -0.0471998 12 807.000 857.362 -50.362 -6.24% -1.7641999 1 851.000 859.138 -8.138 -0.96% -0.2851999 2 718.000 728.196 -10.196 -1.42% -0.3571999 3 662.000 676.549 -14.549 -2.20% -0.5101999 4 596.000 585.666 10.334 1.73% 0.3621999 5 317.000 306.634 10.366 3.27% 0.3631999 6 689.000 671.090 17.910 2.60% 0.6271999 7 466.000 435.055 30.945 6.64% 1.0841999 8 520.000 492.636 27.364 5.26% 0.9581999 9 651.000 587.279 63.721 9.79% 2.2321999 10 664.000 716.107 -52.107 -7.85% -1.8251999 11 742.000 740.586 1.414 0.19% 0.0501999 12 867.000 882.016 -15.016 -1.73% -0.5262000 1 902.000 903.793 -1.793 -0.20% -0.0632000 2 747.000 767.966 -20.966 -2.81% -0.7342000 3 707.000 704.316 2.684 0.38% 0.0942000 4 646.000 623.188 22.812 3.53% 0.7992000 5 520.000 551.309 -31.309 -6.02% -1.0972000 6 509.000 465.276 43.724 8.59% 1.5312000 7 493.000 469.099 23.901 4.85% 0.8372000 8 517.000 520.966 -3.966 -0.77% -0.1392000 9 610.000 598.580 11.420 1.87% 0.4002000 10 702.000 705.743 -3.743 -0.53% -0.1312000 11 775.000 776.271 -1.271 -0.16% -0.0452000 12 875.000 915.146 -40.146 -4.59% -1.4062001 1 879.000 922.786 -43.786 -4.98% -1.5342001 2 743.896 769.349 -25.453 -3.42% -0.8922001 3 704.354 716.794 -12.440 -1.77% -0.436

Docket No. EL09-____Exhibit____(JEM-1)
Schedule 5, Page 22 of 24Year Month Actual Pred Resid %Resid StdResid2001 4 625.436 635.946 -10.510 -1.68% -0.3682001 5 570.396 553.712 16.684 2.93% 0.5842001 6 507.236 508.763 -1.527 -0.30% -0.0532001 7 469.711 482.413 -12.702 -2.70% -0.4452001 8 551.100 521.836 29.264 5.31% 1.0252001 9 643.339 632.681 10.658 1.66% 0.3732001 10 801.502 739.418 62.084 7.75% 2.1752001 11 825.474 848.254 -22.780 -2.76% -0.7982001 12 952.169 958.769 -6.600 -0.69% -0.2312002 1 978.611 981.874 -3.263 -0.33% -0.1142002 2 841.639 841.441 0.198 0.02% 0.0072002 3 789.608 787.820 1.788 0.23% 0.0632002 4 696.562 699.759 -3.197 -0.46% -0.1122002 5 587.729 609.363 -21.634 -3.68% -0.7582002 6 535.675 533.296 2.379 0.44% 0.0832002 7 536.098 513.389 22.709 4.24% 0.7952002 8 573.539 574.791 -1.252 -0.22% -0.0442002 9 662.955 660.215 2.740 0.41% 0.0962002 10 725.512 765.334 -39.822 -5.49% -1.3952002 11 829.237 818.851 10.386 1.25% 0.3642002 12 978.487 975.540 2.947 0.30% 0.1032003 1 1,016.980 1,011.715 5.265 0.52% 0.1842003 2 861.374 878.272 -16.898 -1.96% -0.5922003 3 803.385 813.881 -10.496 -1.31% -0.3682003 4 691.346 722.388 -31.042 -4.49% -1.0872003 5 649.005 621.015 27.990 4.31% 0.9802003 6 552.531 583.446 -30.915 -5.60% -1.0832003 7 539.242 537.846 1.396 0.26% 0.0492003 8 587.522 591.327 -3.805 -0.65% -0.1332003 9 692.869 683.040 9.829 1.42% 0.3442003 10 786.065 797.395 -11.330 -1.44% -0.3972003 11 884.661 868.661 16.000 1.81% 0.5602003 12 1,050.806 1,022.396 28.410 2.70% 0.9952004 1 1,052.894 1,068.365 -15.471 -1.47% -0.5422004 2 895.438 913.868 -18.430 -2.06% -0.6462004 3 867.454 848.422 19.032 2.19% 0.6672004 4 722.006 774.310 -52.304 -7.24% -1.8322004 5 683.313 653.616 29.697 4.35% 1.0402004 6 598.760 618.175 -19.415 -3.24% -0.6802004 7 587.482 579.490 7.992 1.36% 0.2802004 8 641.607 634.151 7.456 1.16% 0.261
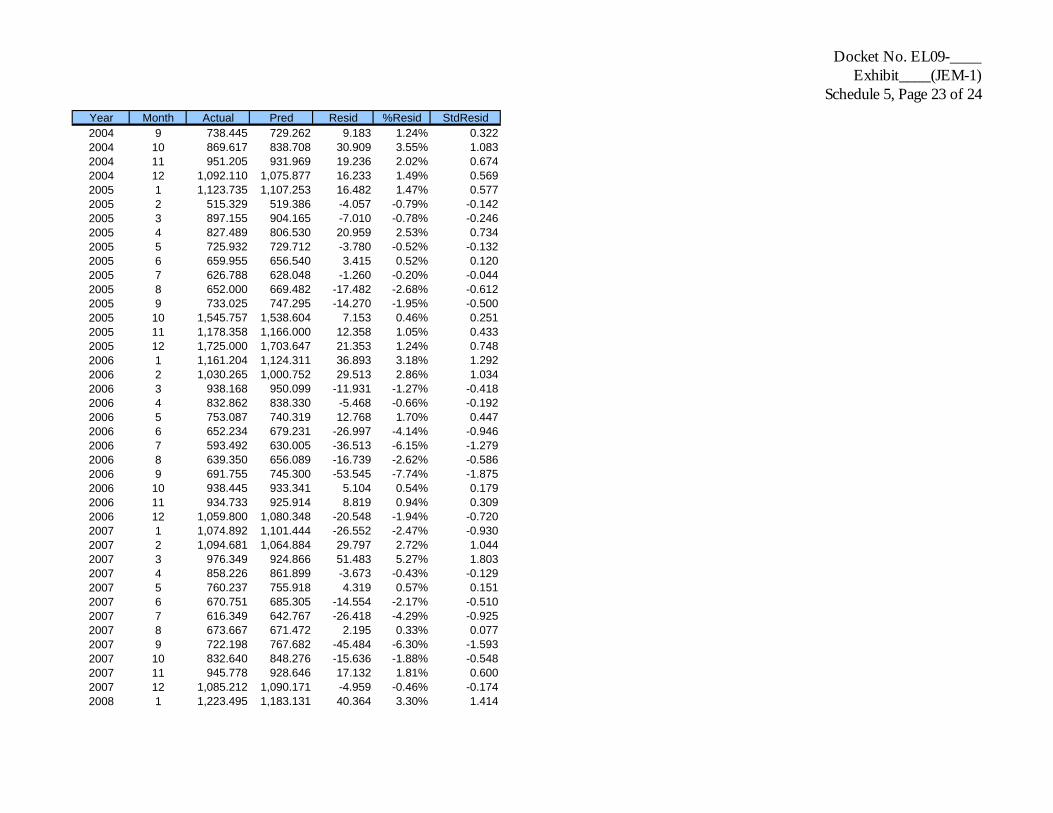
Docket No. EL09-____Exhibit____(JEM-1)
Schedule 5, Page 23 of 24Year Month Actual Pred Resid %Resid StdResid2004 9 738.445 729.262 9.183 1.24% 0.3222004 10 869.617 838.708 30.909 3.55% 1.0832004 11 951.205 931.969 19.236 2.02% 0.6742004 12 1,092.110 1,075.877 16.233 1.49% 0.5692005 1 1,123.735 1,107.253 16.482 1.47% 0.5772005 2 515.329 519.386 -4.057 -0.79% -0.1422005 3 897.155 904.165 -7.010 -0.78% -0.2462005 4 827.489 806.530 20.959 2.53% 0.7342005 5 725.932 729.712 -3.780 -0.52% -0.1322005 6 659.955 656.540 3.415 0.52% 0.1202005 7 626.788 628.048 -1.260 -0.20% -0.0442005 8 652.000 669.482 -17.482 -2.68% -0.6122005 9 733.025 747.295 -14.270 -1.95% -0.5002005 10 1,545.757 1,538.604 7.153 0.46% 0.2512005 11 1,178.358 1,166.000 12.358 1.05% 0.4332005 12 1,725.000 1,703.647 21.353 1.24% 0.7482006 1 1,161.204 1,124.311 36.893 3.18% 1.2922006 2 1,030.265 1,000.752 29.513 2.86% 1.0342006 3 938.168 950.099 -11.931 -1.27% -0.4182006 4 832.862 838.330 -5.468 -0.66% -0.1922006 5 753.087 740.319 12.768 1.70% 0.4472006 6 652.234 679.231 -26.997 -4.14% -0.9462006 7 593.492 630.005 -36.513 -6.15% -1.2792006 8 639.350 656.089 -16.739 -2.62% -0.5862006 9 691.755 745.300 -53.545 -7.74% -1.8752006 10 938.445 933.341 5.104 0.54% 0.1792006 11 934.733 925.914 8.819 0.94% 0.3092006 12 1,059.800 1,080.348 -20.548 -1.94% -0.7202007 1 1,074.892 1,101.444 -26.552 -2.47% -0.9302007 2 1,094.681 1,064.884 29.797 2.72% 1.0442007 3 976.349 924.866 51.483 5.27% 1.8032007 4 858.226 861.899 -3.673 -0.43% -0.1292007 5 760.237 755.918 4.319 0.57% 0.1512007 6 670.751 685.305 -14.554 -2.17% -0.5102007 7 616.349 642.767 -26.418 -4.29% -0.9252007 8 673.667 671.472 2.195 0.33% 0.0772007 9 722.198 767.682 -45.484 -6.30% -1.5932007 10 832.640 848.276 -15.636 -1.88% -0.5482007 11 945.778 928.646 17.132 1.81% 0.6002007 12 1,085.212 1,090.171 -4.959 -0.46% -0.1742008 1 1,223.495 1,183.131 40.364 3.30% 1.414

Docket No. EL09-____Exhibit____(JEM-1)
Schedule 5, Page 24 of 24Year Month Actual Pred Resid %Resid StdResid2008 2 1,076.615 1,006.874 69.741 6.48% 2.4432008 3 953.725 983.726 -30.001 -3.15% -1.0512008 4 909.726 854.066 55.660 6.12% 1.9502008 5 725.676 791.467 -65.791 -9.07% -2.3042008 6 678.602 670.143 8.459 1.25% 0.2962008 7 621.017 652.051 -31.034 -5.00% -1.0872008 8 642.948 678.813 -35.865 -5.58% -1.2562008 9 772.608 755.759 16.849 2.18% 0.5902008 10 906.930 883.762 23.168 2.55% 0.8112008 11 918.458 978.407 -59.949 -6.53% -2.1002008 12 1,149.983 1,081.296 68.687 5.97% 2.4062009 1 1,164.6682009 2 1,017.0242009 3 956.8012009 4 863.5852009 5 772.6772009 6 706.5382009 7 678.0532009 8 722.2962009 9 811.1992009 10 915.5812009 11 992.8652009 12 1,133.7802010 1 1,164.6772010 2 1,026.3852010 3 971.5312010 4 881.3862010 5 792.2192010 6 727.0642010 7 699.1172010 8 743.6412010 9 833.9382010 10 939.6282010 11 1,018.1712010 12 1,160.346

Docket No. EL09-____Exhibit____(JEM-1)
Schedule 6, Page 1 of 21Xcel Energy South Dakota Residential without Space Heat2010 Year Customer Counts
Variable Coefficient StdErr T-Stat P-Value DefinitionSD.HH_SD 239.172 44.467 5.379 0.00% Households, South DakotaBinary.CRS 274.738 143.787 1.911 5.84% Binary variable for CRS conversionBinary2.May1999 -2365.350 116.709 -20.267 0.00% Binary variable May 1999Binary2.Jun1999 2359.675 116.701 20.220 0.00% Binary variable June 1999Binary2.Dec2000 -1413.280 116.696 -12.111 0.00% Binary variable December 2000Binary2.Jan2001 1508.720 116.696 12.929 0.00% Binary variable January 2001AR(1) 0.995 0.006 164.100 0.00% First order autoregressive term

Docket No. EL09-____Exhibit____(JEM-1)
Schedule 6, Page 2 of 21Xcel Energy South Dakota Residential without Space Heat2010 Year Customer Counts
Regression StatisticsIterations 17Adjusted Observations 131Deg. of Freedom for Error 124R-Squared 0.999Adjusted R-Squared 0.999Durbin-Watson Statistic 2.028Durbin-H Statistic #NAAIC 9.972BIC 10.126F-Statistic 15025.797Prob (F-Statistic) 0.0000Log-Likelihood -825.69Model Sum of Squares 2138516869Sum of Squared Errors 2521151Mean Squared Error 20331.86Std. Error of Regression 142.59Mean Abs. Dev. (MAD) 104.57Mean Abs. % Err. (MAPE) 0.17%Ljung-Box Statistic 41.86Prob (Ljung-Box) 0.0134

Xcel Energy South Dakota Residential without Space Heat2010 Year Customer Counts
Docket No. EL09-____Exhibit____(JEM-1)
Schedule 6, Page 3 of 21
Year Month Actual Pred Resid %Resid StdResid1998 1 53,593.0001998 2 53,557.000 53,697.919 -140.919 -0.26% -0.9881998 3 54,162.000 53,657.684 504.316 0.93% 3.5371998 4 53,880.000 54,260.004 -380.004 -0.71% -2.6651998 5 53,890.000 53,979.457 -89.457 -0.17% -0.6271998 6 54,182.000 53,988.941 193.059 0.36% 1.3541998 7 54,162.000 54,279.717 -117.717 -0.22% -0.8261998 8 54,362.000 54,259.946 102.054 0.19% 0.7161998 9 54,369.000 54,460.255 -91.255 -0.17% -0.6401998 10 54,544.000 54,467.364 76.636 0.14% 0.5371998 11 54,788.000 54,641.690 146.310 0.27% 1.0261998 12 54,925.000 54,887.631 37.369 0.07% 0.2621999 1 55,102.000 55,024.148 77.852 0.14% 0.5461999 2 55,399.000 55,200.478 198.522 0.36% 1.3921999 3 55,415.000 55,505.520 -90.520 -0.16% -0.6351999 4 55,342.000 55,521.644 -179.644 -0.32% -1.2601999 5 53,072.000 53,083.833 -11.833 -0.02% -0.0831999 6 57,903.000 57,914.888 -11.888 -0.02% -0.0831999 7 55,649.000 55,660.944 -11.944 -0.02% -0.0841999 8 55,928.000 55,766.376 161.624 0.29% 1.1331999 9 55,670.000 56,044.256 -374.256 -0.67% -2.6251999 10 55,906.000 55,787.707 118.293 0.21% 0.8301999 11 55,917.000 56,022.856 -105.856 -0.19% -0.7421999 12 55,969.000 56,033.985 -64.985 -0.12% -0.4562000 1 56,393.000 56,085.991 307.009 0.54% 2.1532000 2 56,454.000 56,508.264 -54.264 -0.10% -0.3812000 3 56,391.000 56,589.134 -198.134 -0.35% -1.3902000 4 56,469.000 56,526.769 -57.769 -0.10% -0.4052000 5 56,401.000 56,604.747 -203.747 -0.36% -1.4292000 6 56,466.000 56,537.637 -71.637 -0.13% -0.5022000 7 56,611.000 56,602.676 8.324 0.01% 0.0582000 8 56,727.000 56,747.343 -20.343 -0.04% -0.1432000 9 57,033.000 56,863.377 169.623 0.30% 1.190

Xcel Energy South Dakota Residential without Space Heat2010 Year Customer Counts
Docket No. EL09-____Exhibit____(JEM-1)
Schedule 6, Page 4 of 21Year Month Actual Pred Resid %Resid StdResid2000 10 57,274.000 57,168.294 105.706 0.18% 0.7412000 11 57,474.000 57,408.515 65.485 0.11% 0.4592000 12 56,192.000 56,194.879 -2.879 -0.01% -0.0202001 1 59,245.000 59,247.893 -2.893 0.00% -0.0202001 2 57,867.000 57,869.906 -2.906 -0.01% -0.0202001 3 57,913.000 58,000.596 -87.596 -0.15% -0.6142001 4 58,049.000 58,046.727 2.273 0.00% 0.0162001 5 57,872.000 58,182.439 -310.439 -0.54% -2.1772001 6 57,980.000 58,006.844 -26.844 -0.05% -0.1882001 7 58,150.000 58,114.688 35.312 0.06% 0.2482001 8 58,224.000 58,284.242 -60.242 -0.10% -0.4222001 9 58,422.000 58,358.479 63.521 0.11% 0.4452001 10 58,580.000 58,555.905 24.095 0.04% 0.1692001 11 58,625.000 58,713.516 -88.516 -0.15% -0.6212001 12 58,726.000 58,758.890 -32.890 -0.06% -0.2312002 1 58,940.000 58,859.769 80.231 0.14% 0.5632002 2 59,000.000 59,073.120 -73.120 -0.12% -0.5132002 3 59,110.000 59,133.427 -23.427 -0.04% -0.1642002 4 59,334.000 59,243.264 90.736 0.15% 0.6362002 5 59,448.000 59,466.570 -18.570 -0.03% -0.1302002 6 59,382.000 59,580.627 -198.627 -0.33% -1.3932002 7 59,704.000 59,515.285 188.715 0.32% 1.3232002 8 59,809.000 59,836.136 -27.136 -0.05% -0.1902002 9 59,953.000 59,941.236 11.764 0.02% 0.0832002 10 60,129.000 60,084.918 44.082 0.07% 0.3092002 11 60,059.000 60,260.450 -201.450 -0.34% -1.4132002 12 60,004.000 60,191.367 -187.367 -0.31% -1.3142003 1 60,230.000 60,136.977 93.023 0.15% 0.6522003 2 60,437.000 60,362.277 74.723 0.12% 0.5242003 3 60,372.000 60,568.906 -196.906 -0.33% -1.3812003 4 60,625.000 60,504.563 120.437 0.20% 0.8452003 5 60,627.000 60,756.739 -129.739 -0.21% -0.9102003 6 60,691.000 60,759.325 -68.325 -0.11% -0.4792003 7 60,897.000 60,823.382 73.618 0.12% 0.5162003 8 61,013.000 61,028.778 -15.778 -0.03% -0.111

Xcel Energy South Dakota Residential without Space Heat2010 Year Customer Counts
Docket No. EL09-____Exhibit____(JEM-1)
Schedule 6, Page 5 of 21Year Month Actual Pred Resid %Resid StdResid2003 9 60,870.000 61,144.834 -274.834 -0.45% -1.9272003 10 61,195.000 61,002.857 192.143 0.31% 1.3482003 11 61,278.000 61,326.700 -48.700 -0.08% -0.3422003 12 61,294.000 61,409.912 -115.912 -0.19% -0.8132004 1 61,544.000 61,426.195 117.805 0.19% 0.8262004 2 61,700.000 61,675.388 24.612 0.04% 0.1732004 3 61,857.000 61,831.262 25.738 0.04% 0.1812004 4 61,882.000 61,987.889 -105.889 -0.17% -0.7432004 5 62,141.000 62,013.132 127.868 0.21% 0.8972004 6 62,004.000 62,271.527 -267.527 -0.43% -1.8762004 7 62,082.000 62,135.526 -53.526 -0.09% -0.3752004 8 62,432.000 62,213.523 218.477 0.35% 1.5322004 9 62,460.000 62,562.496 -102.496 -0.16% -0.7192004 10 62,426.000 62,590.727 -164.727 -0.26% -1.1552004 11 62,658.000 62,557.247 100.753 0.16% 0.7072004 12 62,830.000 62,788.772 41.228 0.07% 0.2892005 1 62,830.000 62,960.333 -130.333 -0.21% -0.9142005 2 62,680.000 62,685.958 -5.958 -0.01% -0.0422005 3 62,623.000 62,810.723 -187.723 -0.30% -1.3172005 4 62,390.000 62,754.352 -364.352 -0.58% -2.5552005 5 62,297.000 62,522.802 -225.802 -0.36% -1.5842005 6 62,253.000 62,395.238 -142.238 -0.23% -0.9982005 7 62,223.000 62,351.642 -128.642 -0.21% -0.9022005 8 62,297.000 62,321.980 -24.980 -0.04% -0.1752005 9 62,418.000 62,395.908 22.092 0.04% 0.1552005 10 62,662.000 62,516.543 145.457 0.23% 1.0202005 11 62,869.000 62,759.605 109.395 0.17% 0.7672005 12 62,939.000 62,965.913 -26.913 -0.04% -0.1892006 1 63,128.000 63,035.786 92.214 0.15% 0.6472006 2 63,280.000 63,224.105 55.895 0.09% 0.3922006 3 63,463.000 63,375.670 87.330 0.14% 0.6122006 4 63,475.000 63,558.017 -83.017 -0.13% -0.5822006 5 63,628.000 63,570.161 57.839 0.09% 0.4062006 6 63,756.000 63,688.431 67.569 0.11% 0.4742006 7 63,912.000 63,815.875 96.125 0.15% 0.674

Xcel Energy South Dakota Residential without Space Heat2010 Year Customer Counts
Docket No. EL09-____Exhibit____(JEM-1)
Schedule 6, Page 6 of 21Year Month Actual Pred Resid %Resid StdResid2006 8 64,221.000 63,971.188 249.812 0.39% 1.7522006 9 64,623.000 64,278.791 344.209 0.53% 2.4142006 10 64,834.000 64,678.958 155.042 0.24% 1.0872006 11 64,954.000 64,889.015 64.985 0.10% 0.4562006 12 65,172.000 65,008.500 163.500 0.25% 1.1472007 1 65,390.000 65,225.524 164.476 0.25% 1.1532007 2 65,459.000 65,442.549 16.451 0.03% 0.1152007 3 65,574.000 65,511.270 62.730 0.10% 0.4402007 4 65,712.000 65,625.775 86.225 0.13% 0.6052007 5 65,908.000 65,763.172 144.828 0.22% 1.0162007 6 65,991.000 65,965.040 25.960 0.04% 0.1822007 7 66,118.000 66,047.725 70.275 0.11% 0.4932007 8 66,244.000 66,174.205 69.795 0.11% 0.4892007 9 66,253.000 66,306.416 -53.416 -0.08% -0.3752007 10 66,410.000 66,315.477 94.523 0.14% 0.6632007 11 66,576.000 66,471.849 104.151 0.16% 0.7302007 12 66,688.000 66,643.964 44.036 0.07% 0.3092008 1 66,791.000 66,755.577 35.423 0.05% 0.2482008 2 66,857.000 66,858.232 -1.232 0.00% -0.0092008 3 66,914.000 66,933.682 -19.682 -0.03% -0.1382008 4 66,950.000 66,990.596 -40.596 -0.06% -0.2852008 5 67,040.000 67,026.608 13.392 0.02% 0.0942008 6 67,103.000 67,086.979 16.021 0.02% 0.1122008 7 67,267.000 67,149.728 117.272 0.17% 0.8222008 8 67,527.000 67,313.006 213.994 0.32% 1.5012008 9 67,623.000 67,612.990 10.010 0.01% 0.0702008 10 67,706.000 67,708.778 -2.778 0.00% -0.0192008 11 67,743.000 67,791.625 -48.625 -0.07% -0.3412008 12 67,806.000 67,828.095 -22.095 -0.03% -0.1552009 1 67,891.0332009 2 67,975.9022009 3 68,060.3302009 4 68,144.5952009 5 68,228.6972009 6 68,312.058

Xcel Energy South Dakota Residential without Space Heat2010 Year Customer Counts
Docket No. EL09-____Exhibit____(JEM-1)
Schedule 6, Page 7 of 21Year Month Actual Pred Resid %Resid StdResid2009 7 68,395.2592009 8 68,478.2992009 9 68,560.6082009 10 68,642.7582009 11 68,724.7512009 12 68,806.0242010 1 68,887.1412010 2 68,968.1022010 3 69,048.3482010 4 69,128.4402010 5 69,208.3782010 6 69,287.9262010 7 69,367.3212010 8 69,446.5652010 9 69,558.1032010 10 69,669.4912010 11 69,780.7292010 12 69,892.067

Docket No. EL09-____Exhibit____(JEM-1)
Schedule 6, Page 8 of 21Xcel Energy South Dakota Small Commercial and Industrial2010 Year Customer Counts
Variable Coefficient StdErr T-Stat P-Value DefinitionSDRXCusts.Filled 0.149 0.000 1149.472 0.00% South Dakota Residential without Space Heating CustomersBinary.CIReclass01Pre -364.882 11.422 -31.945 0.00% Binary variable for 2001 C&I reclassificationBinary.CRS -97.505 10.734 -9.084 0.00% Binary variable for CRS conversionBinary2.Jun1999 -182.314 36.922 -4.938 0.00% Binary variable June 1999Binary2.Feb2005 -141.388 38.654 -3.658 0.04% Binary variable February 2005Binary2.Mar2005 -112.361 38.318 -2.932 0.40% Binary variable March 2005BinaryTrans.Post0408 85.549 19.262 4.441 0.00% Binary variable all months after April 2008AR(1) 0.267 0.087 3.056 0.28% First order autoregressive term

Docket No. EL09-____Exhibit____(JEM-1)
Schedule 6, Page 9 of 21Xcel Energy South Dakota Small Commercial and Industrial2010 Year Customer Counts
Regression StatisticsIterations 8Adjusted Observations 131Deg. of Freedom for Error 123R-Squared 0.998Adjusted R-Squared 0.998Durbin-Watson Statistic 2.078Durbin-H Statistic #NAAIC 7.331BIC 7.506F-Statistic 6973.354Prob (F-Statistic) 0.0000Log-Likelihood -653.02Model Sum of Squares 80266211Sum of Squared Errors 176973Mean Squared Error 1438.80Std. Error of Regression 37.93Mean Abs. Dev. (MAD) 26.90Mean Abs. % Err. (MAPE) 0.31%Ljung-Box Statistic 37.67Prob (Ljung-Box) 0.0375
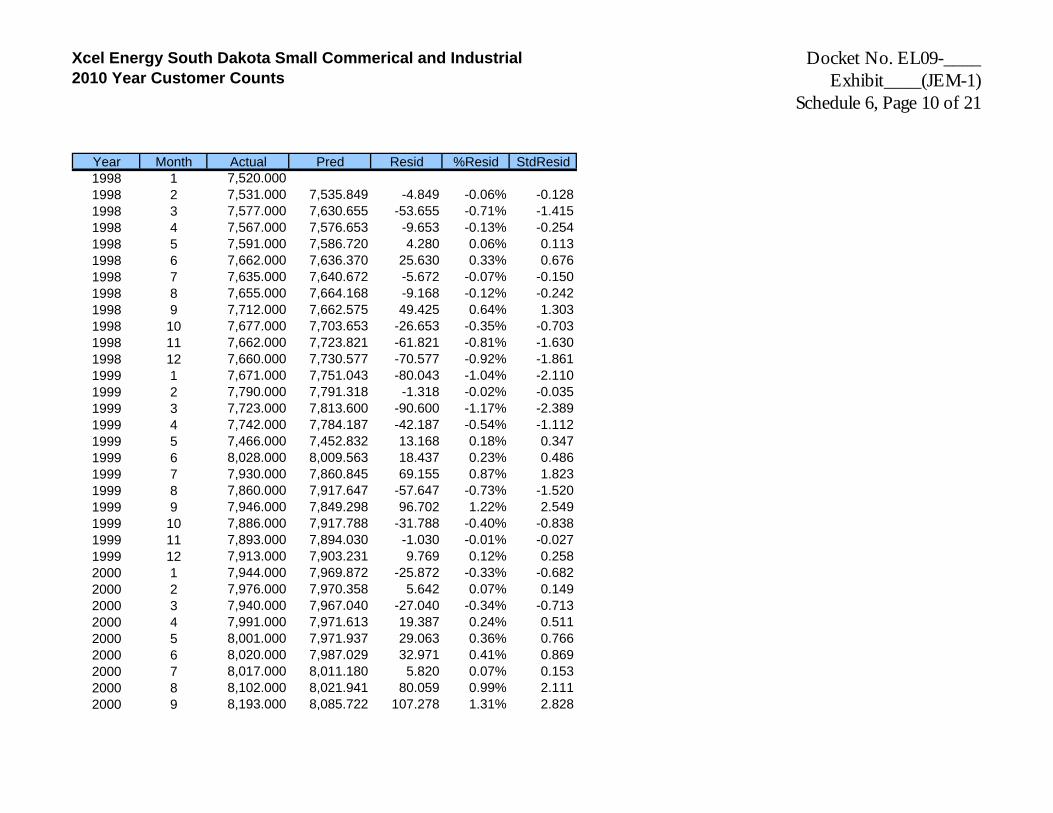
Xcel Energy South Dakota Small Commerical and Industrial 2010 Year Customer Counts
Docket No. EL09-____Exhibit____(JEM-1)
Schedule 6, Page 10 of 21
Year Month Actual Pred Resid %Resid StdResid1998 1 7,520.0001998 2 7,531.000 7,535.849 -4.849 -0.06% -0.1281998 3 7,577.000 7,630.655 -53.655 -0.71% -1.4151998 4 7,567.000 7,576.653 -9.653 -0.13% -0.2541998 5 7,591.000 7,586.720 4.280 0.06% 0.1131998 6 7,662.000 7,636.370 25.630 0.33% 0.6761998 7 7,635.000 7,640.672 -5.672 -0.07% -0.1501998 8 7,655.000 7,664.168 -9.168 -0.12% -0.2421998 9 7,712.000 7,662.575 49.425 0.64% 1.3031998 10 7,677.000 7,703.653 -26.653 -0.35% -0.7031998 11 7,662.000 7,723.821 -61.821 -0.81% -1.6301998 12 7,660.000 7,730.577 -70.577 -0.92% -1.8611999 1 7,671.000 7,751.043 -80.043 -1.04% -2.1101999 2 7,790.000 7,791.318 -1.318 -0.02% -0.0351999 3 7,723.000 7,813.600 -90.600 -1.17% -2.3891999 4 7,742.000 7,784.187 -42.187 -0.54% -1.1121999 5 7,466.000 7,452.832 13.168 0.18% 0.3471999 6 8,028.000 8,009.563 18.437 0.23% 0.4861999 7 7,930.000 7,860.845 69.155 0.87% 1.8231999 8 7,860.000 7,917.647 -57.647 -0.73% -1.5201999 9 7,946.000 7,849.298 96.702 1.22% 2.5491999 10 7,886.000 7,917.788 -31.788 -0.40% -0.8381999 11 7,893.000 7,894.030 -1.030 -0.01% -0.0271999 12 7,913.000 7,903.231 9.769 0.12% 0.2582000 1 7,944.000 7,969.872 -25.872 -0.33% -0.6822000 2 7,976.000 7,970.358 5.642 0.07% 0.1492000 3 7,940.000 7,967.040 -27.040 -0.34% -0.7132000 4 7,991.000 7,971.613 19.387 0.24% 0.5112000 5 8,001.000 7,971.937 29.063 0.36% 0.7662000 6 8,020.000 7,987.029 32.971 0.41% 0.8692000 7 8,017.000 8,011.180 5.820 0.07% 0.1532000 8 8,102.000 8,021.941 80.059 0.99% 2.1112000 9 8,193.000 8,085.722 107.278 1.31% 2.828

Xcel Energy South Dakota Small Commerical and Industrial 2010 Year Customer Counts
Docket No. EL09-____Exhibit____(JEM-1)
Schedule 6, Page 11 of 21Year Month Actual Pred Resid %Resid StdResid2000 10 8,080.000 8,133.814 -53.814 -0.67% -1.4192000 11 8,142.000 8,123.979 18.021 0.22% 0.4752000 12 7,982.000 7,940.899 41.101 0.51% 1.0842001 1 8,695.000 8,770.593 -75.593 -0.87% -1.9932001 2 8,601.000 8,535.740 65.260 0.76% 1.7202001 3 8,555.000 8,572.474 -17.474 -0.20% -0.4612001 4 8,528.000 8,578.707 -50.707 -0.59% -1.3372001 5 8,552.000 8,539.629 12.371 0.14% 0.3262001 6 8,565.000 8,569.226 -4.226 -0.05% -0.1112001 7 8,604.000 8,593.801 10.199 0.12% 0.2692001 8 8,682.000 8,608.485 73.515 0.85% 1.9382001 9 8,670.000 8,655.929 14.071 0.16% 0.3712001 10 8,644.000 8,668.458 -24.458 -0.28% -0.6452001 11 8,669.000 8,661.956 7.044 0.08% 0.1862001 12 8,629.000 8,681.925 -52.925 -0.61% -1.3952002 1 8,716.000 8,699.225 16.775 0.19% 0.4422002 2 8,687.000 8,722.861 -35.861 -0.41% -0.9452002 3 8,726.000 8,729.181 -3.181 -0.04% -0.0842002 4 8,811.000 8,768.680 42.320 0.48% 1.1162002 5 8,805.000 8,799.455 5.545 0.06% 0.1462002 6 8,796.000 8,783.446 12.554 0.14% 0.3312002 7 8,860.000 8,831.811 28.189 0.32% 0.7432002 8 8,848.000 8,851.737 -3.737 -0.04% -0.0992002 9 8,870.000 8,865.879 4.121 0.05% 0.1092002 10 8,876.000 8,892.315 -16.315 -0.18% -0.4302002 11 8,883.000 8,876.436 6.564 0.07% 0.1732002 12 8,940.000 8,872.871 67.129 0.75% 1.7702003 1 8,943.000 8,924.043 18.957 0.21% 0.5002003 2 8,903.000 8,946.779 -43.779 -0.49% -1.1542003 3 8,950.000 8,918.148 31.852 0.36% 0.8402003 4 8,973.000 8,971.089 1.911 0.02% 0.0502003 5 9,024.000 8,967.437 56.563 0.63% 1.4912003 6 8,985.000 8,990.521 -5.521 -0.06% -0.1462003 7 8,988.000 9,008.367 -20.367 -0.23% -0.5372003 8 9,007.000 9,018.297 -11.297 -0.13% -0.298

Xcel Energy South Dakota Small Commerical and Industrial 2010 Year Customer Counts
Docket No. EL09-____Exhibit____(JEM-1)
Schedule 6, Page 12 of 21Year Month Actual Pred Resid %Resid StdResid2003 9 9,068.000 8,997.363 70.637 0.78% 1.8622003 10 8,973.000 9,067.908 -94.908 -1.06% -2.5022003 11 9,048.000 9,042.035 5.965 0.07% 0.1572003 12 9,104.000 9,061.114 42.886 0.47% 1.1312004 1 9,161.000 9,112.778 48.222 0.53% 1.2712004 2 9,092.000 9,141.331 -49.331 -0.54% -1.3012004 3 9,145.000 9,140.187 4.813 0.05% 0.1272004 4 9,196.000 9,151.797 44.203 0.48% 1.1652004 5 9,121.000 9,203.114 -82.114 -0.90% -2.1652004 6 9,147.000 9,152.317 -5.317 -0.06% -0.1402004 7 9,160.000 9,176.369 -16.369 -0.18% -0.4322004 8 9,195.000 9,229.046 -34.046 -0.37% -0.8982004 9 9,281.000 9,228.614 52.386 0.56% 1.3812004 10 9,189.000 9,245.344 -56.344 -0.61% -1.4852004 11 9,228.000 9,256.851 -28.851 -0.31% -0.7612004 12 9,326.000 9,283.714 42.286 0.45% 1.1152005 1 9,275.000 9,302.987 -27.987 -0.30% -0.7382005 2 9,218.000 9,223.085 -5.085 -0.06% -0.1342005 3 9,227.000 9,246.072 -19.072 -0.21% -0.5032005 4 9,249.000 9,320.535 -71.535 -0.77% -1.8862005 5 9,233.000 9,291.828 -58.828 -0.64% -1.5512005 6 9,253.000 9,284.691 -31.691 -0.34% -0.8352005 7 9,266.000 9,287.292 -21.292 -0.23% -0.5612005 8 9,300.000 9,303.016 -3.016 -0.03% -0.0802005 9 9,332.000 9,327.219 4.781 0.05% 0.1262005 10 9,351.000 9,367.402 -16.402 -0.18% -0.4322005 11 9,384.000 9,393.687 -9.687 -0.10% -0.2552005 12 9,414.000 9,404.699 9.301 0.10% 0.2452006 1 9,439.000 9,438.160 0.840 0.01% 0.0222006 2 9,459.000 9,460.015 -1.015 -0.01% -0.0272006 3 9,479.000 9,486.645 -7.645 -0.08% -0.2022006 4 9,492.000 9,486.477 5.523 0.06% 0.1462006 5 9,529.000 9,512.336 16.664 0.17% 0.4392006 6 9,567.000 9,535.237 31.763 0.33% 0.8372006 7 9,604.000 9,563.587 40.413 0.42% 1.065

Xcel Energy South Dakota Small Commerical and Industrial 2010 Year Customer Counts
Docket No. EL09-____Exhibit____(JEM-1)
Schedule 6, Page 13 of 21Year Month Actual Pred Resid %Resid StdResid2006 8 9,652.000 9,613.425 38.575 0.40% 1.0172006 9 9,678.000 9,674.000 4.000 0.04% 0.1052006 10 9,717.000 9,696.452 20.548 0.21% 0.5422006 11 9,730.000 9,716.379 13.621 0.14% 0.3592006 12 9,750.000 9,747.650 2.350 0.02% 0.0622007 1 9,791.000 9,776.881 14.119 0.14% 0.3722007 2 9,792.000 9,789.439 2.561 0.03% 0.0682007 3 9,804.000 9,804.146 -0.146 0.00% -0.0042007 4 9,818.000 9,823.391 -5.391 -0.05% -0.1422007 5 9,844.000 9,850.923 -6.923 -0.07% -0.1832007 6 9,856.000 9,862.450 -6.450 -0.07% -0.1702007 7 9,881.000 9,881.326 -0.326 0.00% -0.0092007 8 9,886.000 9,901.765 -15.765 -0.16% -0.4162007 9 9,886.000 9,899.422 -13.422 -0.14% -0.3542007 10 9,921.000 9,922.532 -1.532 -0.02% -0.0402007 11 9,946.000 9,950.421 -4.421 -0.04% -0.1172007 12 9,977.000 9,967.213 9.787 0.10% 0.2582008 1 10,007.000 9,986.411 20.589 0.21% 0.5432008 2 10,001.000 10,000.170 0.830 0.01% 0.0222008 3 10,023.000 10,004.461 18.539 0.18% 0.4892008 4 10,039.000 10,013.436 25.564 0.25% 0.6742008 5 10,084.000 10,115.270 -31.270 -0.31% -0.8242008 6 10,125.000 10,110.290 14.710 0.15% 0.3882008 7 10,131.000 10,143.226 -12.226 -0.12% -0.3222008 8 10,184.000 10,177.155 6.845 0.07% 0.1802008 9 10,186.000 10,195.274 -9.274 -0.09% -0.2442008 10 10,219.000 10,204.389 14.611 0.14% 0.3852008 11 10,220.000 10,215.410 4.590 0.04% 0.1212008 12 10,247.000 10,223.619 23.381 0.23% 0.6162009 1 10,241.0182009 2 10,248.7212009 3 10,260.0132009 4 10,272.2552009 5 10,284.7332009 6 10,297.169

Xcel Energy South Dakota Small Commerical and Industrial 2010 Year Customer Counts
Docket No. EL09-____Exhibit____(JEM-1)
Schedule 6, Page 14 of 21Year Month Actual Pred Resid %Resid StdResid2009 7 10,309.5992009 8 10,322.0112009 9 10,334.3142009 10 10,346.5942009 11 10,358.8512009 12 10,371.0002010 1 10,383.1252010 2 10,395.2282010 3 10,407.2232010 4 10,419.1962010 5 10,431.1462010 6 10,443.0372010 7 10,454.9052010 8 10,466.7512010 9 10,483.4242010 10 10,500.0752010 11 10,516.7032010 12 10,533.347

Docket No. EL09-____Exhibit____(JEM-1)
Schedule 6, Page 15 of 21Xcel Energy South Dakota Public Street and Highway Lighting2010 Year Customer Counts
Variable Coefficient StdErr T-Stat P-Value DefinitionSD.HH_SD 1.207 0.194 6.222 0.00% Households, South DakotaBinary2.May1999 -65.638 2.269 -28.933 0.00% Households, Minneapolis-St. Paul MSABinary2.Jun1999 68.677 2.269 30.272 0.00% Binary variable May 1999Binary2.Sep1999 21.496 1.965 10.941 0.00% Binary variable June 1999Binary2.Dec1999 -23.375 2.485 -9.405 0.00% Binary variable December 1999Binary2.Jan2000 -238.742 3.044 -78.427 0.00% Binary variable January 2000Binary2.Feb2000 -238.102 3.044 -78.214 0.00% Binary variable February 2000Binary2.Mar2000 -194.554 2.485 -78.278 0.00% Binary variable March 2000Binary2.Mar2001 -11.503 1.965 -5.855 0.00% Binary variable March 2001Binary2.Nov2005 -291.502 1.965 -148.366 0.00% Binary variable November 2005AR(1) 0.990 0.012 79.599 0.00% First order autoregressive term

Docket No. EL09-____Exhibit____(JEM-1)
Schedule 6, Page 16 of 21Xcel Energy South Dakota Public Street and Highway Lighting2010 Year Customer Counts
Regression StatisticsIterations 6Adjusted Observations 131Deg. of Freedom for Error 120R-Squared 0.998Adjusted R-Squared 0.997Durbin-Watson Statistic 2.333Durbin-H Statistic #NAAIC 2.114BIC 2.355F-Statistic 4577.676Prob (F-Statistic) 0.0000Log-Likelihood -310.93Model Sum of Squares 384701Sum of Squared Errors 917Mean Squared Error 7.64Std. Error of Regression 2.76Mean Abs. Dev. (MAD) 1.74Mean Abs. % Err. (MAPE) 0.60%Ljung-Box Statistic 35.27Prob (Ljung-Box) 0.0645

Xcel Energy South Dakota Public Street and Highway Lighting2010 Year Customer Counts
Docket No. EL09-____Exhibit____(JEM-1)
Schedule 6, Page 17 of 21
Year Month Actual Pred Resid %Resid StdResid1998 1 262.0001998 2 257.000 263.049 -6.049 -2.35% -2.1881998 3 269.000 258.080 10.920 4.06% 3.9511998 4 274.000 269.956 4.044 1.48% 1.4631998 5 266.000 274.905 -8.905 -3.35% -3.2221998 6 265.000 266.987 -1.987 -0.75% -0.7191998 7 267.000 265.999 1.001 0.37% 0.3621998 8 268.000 267.980 0.020 0.01% 0.0071998 9 279.000 268.976 10.024 3.59% 3.6261998 10 270.000 279.863 -9.863 -3.65% -3.5681998 11 271.000 270.959 0.041 0.02% 0.0151998 12 274.000 271.965 2.035 0.74% 0.7361999 1 275.000 274.935 0.065 0.02% 0.0241999 2 275.000 275.926 -0.926 -0.34% -0.3351999 3 274.000 275.975 -1.975 -0.72% -0.7141999 4 274.000 274.988 -0.988 -0.36% -0.3571999 5 207.000 209.351 -2.351 -1.14% -0.8511999 6 340.000 342.376 -2.376 -0.70% -0.8601999 7 270.000 272.402 -2.402 -0.89% -0.8691999 8 277.000 271.095 5.905 2.13% 2.1361999 9 299.000 299.520 -0.520 -0.17% -0.1881999 10 278.000 278.525 -0.525 -0.19% -0.1901999 11 280.000 279.019 0.981 0.35% 0.3551999 12 258.000 257.626 0.374 0.15% 0.1352000 1 44.000 43.622 0.378 0.86% 0.1372000 2 46.000 45.618 0.382 0.83% 0.1382000 3 91.000 90.614 0.386 0.42% 0.1402000 4 287.000 286.610 0.390 0.14% 0.1412000 5 288.000 288.044 -0.044 -0.02% -0.0162000 6 289.000 289.038 -0.038 -0.01% -0.0142000 7 290.000 290.032 -0.032 -0.01% -0.0122000 8 291.000 291.025 -0.025 -0.01% -0.0092000 9 293.000 292.020 0.980 0.33% 0.355

Xcel Energy South Dakota Public Street and Highway Lighting2010 Year Customer Counts
Docket No. EL09-____Exhibit____(JEM-1)
Schedule 6, Page 18 of 21Year Month Actual Pred Resid %Resid StdResid2000 10 297.000 294.003 2.997 1.01% 1.0842000 11 297.000 297.965 -0.965 -0.32% -0.3492000 12 296.000 297.970 -1.970 -0.67% -0.7132001 1 300.000 296.984 3.016 1.01% 1.0912001 2 299.000 300.946 -1.946 -0.65% -0.7042001 3 287.000 288.459 -1.459 -0.51% -0.5282001 4 298.000 299.474 -1.474 -0.49% -0.5332001 5 297.000 298.980 -1.980 -0.67% -0.7162001 6 300.000 297.996 2.004 0.67% 0.7252001 7 300.000 300.968 -0.968 -0.32% -0.3502001 8 299.000 300.972 -1.972 -0.66% -0.7132001 9 301.000 299.988 1.012 0.34% 0.3662001 10 300.000 301.971 -1.971 -0.66% -0.7132001 11 300.000 300.985 -0.985 -0.33% -0.3562001 12 301.000 300.990 0.010 0.00% 0.0042002 1 300.000 301.984 -1.984 -0.66% -0.7182002 2 306.000 300.998 5.002 1.63% 1.8102002 3 306.000 306.940 -0.940 -0.31% -0.3402002 4 309.000 306.944 2.056 0.67% 0.7442002 5 307.000 309.917 -2.917 -0.95% -1.0552002 6 306.000 307.943 -1.943 -0.63% -0.7032002 7 305.000 306.958 -1.958 -0.64% -0.7082002 8 305.000 305.972 -0.972 -0.32% -0.3522002 9 303.000 305.977 -2.977 -0.98% -1.0772002 10 302.000 304.002 -2.002 -0.66% -0.7242002 11 304.000 303.017 0.983 0.32% 0.3562002 12 307.000 305.001 1.999 0.65% 0.7232003 1 308.000 307.973 0.027 0.01% 0.0102003 2 311.000 308.967 2.033 0.65% 0.7362003 3 311.000 311.941 -0.941 -0.30% -0.3402003 4 312.000 311.945 0.055 0.02% 0.0202003 5 308.000 312.938 -4.938 -1.60% -1.7872003 6 309.000 308.986 0.014 0.00% 0.0052003 7 308.000 309.979 -1.979 -0.64% -0.7162003 8 310.000 308.994 1.006 0.32% 0.364

Xcel Energy South Dakota Public Street and Highway Lighting2010 Year Customer Counts
Docket No. EL09-____Exhibit____(JEM-1)
Schedule 6, Page 19 of 21Year Month Actual Pred Resid %Resid StdResid2003 9 310.000 310.978 -0.978 -0.32% -0.3542003 10 308.000 310.982 -2.982 -0.97% -1.0792003 11 313.000 309.007 3.993 1.28% 1.4452003 12 319.000 313.960 5.040 1.58% 1.8232004 1 318.000 319.901 -1.901 -0.60% -0.6882004 2 318.000 318.916 -0.916 -0.29% -0.3312004 3 320.000 318.921 1.079 0.34% 0.3902004 4 322.000 320.904 1.096 0.34% 0.3972004 5 322.000 322.887 -0.887 -0.28% -0.3212004 6 322.000 322.892 -0.892 -0.28% -0.3232004 7 323.000 322.896 0.104 0.03% 0.0372004 8 324.000 323.890 0.110 0.03% 0.0402004 9 324.000 324.885 -0.885 -0.27% -0.3202004 10 328.000 324.889 3.111 0.95% 1.1262004 11 327.000 328.851 -1.851 -0.57% -0.6702004 12 329.000 327.867 1.133 0.34% 0.4102005 1 338.000 329.850 8.150 2.41% 2.9492005 2 336.000 338.760 -2.760 -0.82% -0.9982005 3 336.000 336.786 -0.786 -0.23% -0.2842005 4 336.000 336.790 -0.790 -0.24% -0.2862005 5 337.000 336.794 0.206 0.06% 0.0742005 6 338.000 337.610 0.390 0.12% 0.1412005 7 338.000 338.601 -0.601 -0.18% -0.2182005 8 337.000 338.604 -1.604 -0.48% -0.5802005 9 337.000 337.617 -0.617 -0.18% -0.2232005 10 338.000 337.619 0.381 0.11% 0.1382005 11 46.000 47.109 -1.109 -2.41% -0.4012005 12 337.000 338.121 -1.121 -0.33% -0.4052006 1 337.000 337.626 -0.626 -0.19% -0.2272006 2 337.000 337.628 -0.628 -0.19% -0.2272006 3 342.000 337.631 4.369 1.28% 1.5812006 4 343.000 342.581 0.419 0.12% 0.1522006 5 343.000 343.573 -0.573 -0.17% -0.2072006 6 342.000 343.402 -1.402 -0.41% -0.5072006 7 342.000 342.413 -0.413 -0.12% -0.150

Xcel Energy South Dakota Public Street and Highway Lighting2010 Year Customer Counts
Docket No. EL09-____Exhibit____(JEM-1)
Schedule 6, Page 20 of 21Year Month Actual Pred Resid %Resid StdResid2006 8 344.000 342.414 1.586 0.46% 0.5742006 9 343.000 344.393 -1.393 -0.41% -0.5042006 10 346.000 343.404 2.596 0.75% 0.9392006 11 346.000 346.373 -0.373 -0.11% -0.1352006 12 347.000 346.374 0.626 0.18% 0.2272007 1 347.000 347.364 -0.364 -0.10% -0.1322007 2 351.000 347.364 3.636 1.04% 1.3152007 3 353.000 351.323 1.677 0.48% 0.6072007 4 355.000 353.302 1.698 0.48% 0.6142007 5 353.000 355.282 -2.282 -0.65% -0.8252007 6 354.000 353.337 0.663 0.19% 0.2402007 7 354.000 354.327 -0.327 -0.09% -0.1182007 8 354.000 354.328 -0.328 -0.09% -0.1192007 9 354.000 354.363 -0.363 -0.10% -0.1312007 10 355.000 354.364 0.636 0.18% 0.2302007 11 357.000 355.355 1.645 0.46% 0.5952007 12 358.000 357.369 0.631 0.18% 0.2282008 1 361.000 358.360 2.640 0.73% 0.9552008 2 362.000 361.330 0.670 0.18% 0.2422008 3 361.000 362.370 -1.370 -0.38% -0.4962008 4 361.000 361.383 -0.383 -0.11% -0.1382008 5 362.000 361.385 0.615 0.17% 0.2232008 6 361.000 362.228 -1.228 -0.34% -0.4442008 7 361.000 361.239 -0.239 -0.07% -0.0862008 8 364.000 361.239 2.761 0.76% 0.9992008 9 366.000 364.416 1.584 0.43% 0.5732008 10 365.000 366.398 -1.398 -0.38% -0.5062008 11 366.000 365.411 0.589 0.16% 0.2132008 12 365.000 366.400 -1.400 -0.38% -0.5072009 1 365.4132009 2 365.8252009 3 366.2332009 4 366.6402009 5 367.0452009 6 367.445

Xcel Energy South Dakota Public Street and Highway Lighting2010 Year Customer Counts
Docket No. EL09-____Exhibit____(JEM-1)
Schedule 6, Page 21 of 21Year Month Actual Pred Resid %Resid StdResid2009 7 367.8442009 8 368.2412009 9 368.6342009 10 369.0252009 11 369.4152009 12 369.8002010 1 370.1842010 2 370.5662010 3 370.9442010 4 371.3212010 5 371.6962010 6 372.0682010 7 372.4392010 8 372.8092010 9 373.3412010 10 373.8722010 11 374.4012010 12 374.930

Comparison of Definitional Changes Docket No. EL09-____Exhibit ___(JEM-1)
Schedule 7, Page 1 of 4
General High-Level Description of How Billed Customers are Counted
CSS CRS - active service
Count of unique premise, service, utility type, and tariff (rate schedule) having a meter connected for at least one day during the calendar month, having a customer current for at least one service day during the calendar month, for which one or more invoices for a never before billed service period were created during
This only counts a service once as billed if it received a bill, regardless of how many physical invoices were generated.
Exceptions to Active Metered Service Count where 1 service is counted multiple times by different tariffs (rate schedules)
LGINT - if a service is classed by the LGINT tariff found on register number 50, then count that service as 4 active services under tariffs found on registers 50, 51, 79, and 80.
RTP - if a service is classed by RTP tariff found on register number 31, then count that service as 3 active services under tariffs found on registers 31, 32, and 41.
Active Metered Services CSS counted customers as they were billed (all accounts “Billed” with current “Revenue Month” revenue). Billed Customer counts were primarily derived from RV931b and RV773 (or variations of these depending on roll-ups- i.e. by Division, etc.) New customers were counted even if they only had a partial bill. Final bills were also counted if invoiced in the same month. If a customer had two load points for the same product, he was counted as one customer. If a customer was supplied with more than one product, he was counted as a customer of each product (unless on lighting or other period billing).

Comparison of Definitional Changes Docket No. EL09-____Exhibit ___(JEM-1)
Schedule 7, Page 2 of 4
Electric Lighting Services. Periodic Billing Contracts, including individual street light and signal devices, as well as the “special C” rates (phone booths, air raid sirens, etc.), whether provided to a government agency or private corporation.
These types of customers, including “Night Watch” (lighting) are not counted as billed customers.
Count unique combinations of distinct tariff classes assigned to each Periodic Billing (PBL) contract. For example, if a contract has multiple street lights (SL) and signal devices (TSL), this contract would count as two customers (one SL and one TSL).
Electric Specific Scenarios: CSS CRS - active service
Service is supplied at more than one site.
Each site counted as separate customer No change
Customer receives gas and electricity at the same address.
Counted as one gas customer and one electric customer
No change
Customer begins service prior to the end of the billing period.
Customer is counted Service is counted once if occupied by any one or more customer for 1 day during the period.
Customer discontinues service prior to the end of the billing period (creating the account status of final).
Customer is counted Service is counted once if occupied by any one or more customer for 1 day during the period
Customers in apartment houses. For example if an apartment has 50 electric units metered separately.
Each counted as a customer as long as billed separately
Each metered service still counted as a customer

Comparison of Definitional Changes Docket No. EL09-____Exhibit ___(JEM-1)
Schedule 7, Page 3 of 4
Two different types of utility services are used at the same premise. For example if a residence has both a residential and a commercial meter for a business in the basement.
Each counted as separate customer (unless additional service is lighting or periodic billing)
No change
Same type of utility service for the same premise is metered separately. For example if a customer has an electric meter for the house and an electric meter for the garage at the same address.
One customer counted No change
Same type of utility service for two premises is metered separately. For example if the landlord lives on the first floor and the basement is metered separately.
Two customers counted No change
Customers with electric service in unincorporated areas with a street light (SLUs). For example, three residential customers share one street light.
Not applicable, because even if customers are sharing the street light, one customer pays the utility (and gets reimbursed directly from other customers). And, as discussed above, that customer would not be counted a second time as a “Night Watch” customer.
Counted consistent with CIS
Electric customers with area lights.
As discussed above, that customer would not be counted a second time as a “Night Watch” customer.
Counted consistent with CIS

Comparison of Definitional Changes Docket No. EL09-____Exhibit ___(JEM-1)
Schedule 7, Page 4 of 4
Phone booths, sprinkler systems, air raid sirens and other types of non-metered accounts.
Not counted as customers Counted consistent with CIS
Interdepartmental Sales Not billed out of CSS so not counted. Counted consistent with CIS