sakura group - twse.com.tw
TRANSCRIPT

櫻花集團 SAKURA GROUP

2
Established in 1978
Date of Listing:1992/07/16
Chairman :Chang, Yung-Chieh
Paid-in Capital:NTD 2.21 billion
Production Base : Taiwan - Daya main div./Daya 2nd div./Shenkang /Wufeng China - Kunshan, Jiangsu/Shunde, Guangdong
Employees: 1,040 (Taiwan) / 3,200 (China)
Company Profile
Head Office

3
Investment Structure
43.19%
Taiwan Sakura http://www.sakura.com.tw/
Puda http://www.puda.com.tw/
Topax http://www.topax.com.tw/
100%
Sakura B.V.I.
Sakura Huanan
100%
Sakura Cayman
Sakura China http://www.sakura.com.cn/
100%
Sakura Shunde
Shareholding Ratio: 44.39%
100%
45%
100%
Capital: NTD 171mn
Capital: NTD 217mn
Capital: USD 17.15mn
Capital: RMB 320mn
Capital: NTD 2,211mn
Capital: USD 5.85mn
Capital: RMB 80mn
Capital: USD 21.8mn
55.61%

4
1978 「SAKURA」
established
SAKURA Milestones
1987 “free
examination of
water heater” as
the free
permanent
service
2008 got the agency of
SVAGO and Electrolux,
and stepped into the
multi-brand era
2010 started producing
and marketing the
“solar water heater”
1995 began to produce
kitchen cabinets
provided to
constructors
1980 “free oil filters with
a door-to- door
delivery” as the free
permanent service
1994 “SAKURA (China) Bath
and Kitchen Co., Ltd”
officially began the
production and sales
activities
1997 established the
franchising chain store,
“Sakura Kitchen Life
Store"
2009 SAKURA China
began to produce
kitchen
appliances
2014 Promoting the four
major upgrades, and
reshaping the
consumer’s
experience with us
2017 Sakura brand
imposed the ideal of
intelligent products

5
Business Concept
N P S a p p l i e d
compresensively
SAKURA CARE
24/7 service hotline
On-duty service all year
round
High-pressure leak test
Constant temperature and
moisture duration test
Ignition switch test
Withstand voltage test
D F S S / D F M E A
Meet the needs of
local consumers
Innovation
Q u a l i t y Ser vice
6
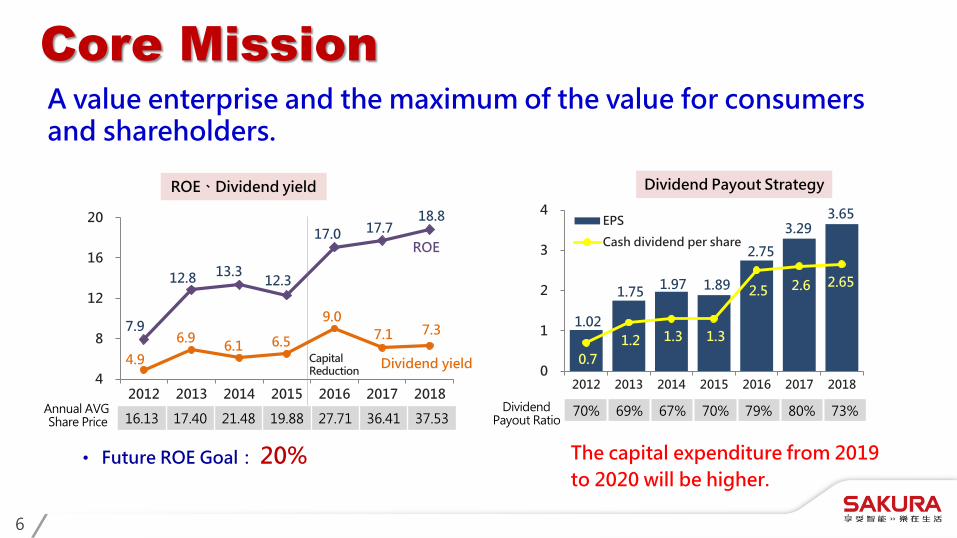
A value enterprise and the maximum of the value for consumers and shareholders.
Core Mission
Dividend Payout Strategy ROE、Dividend yield
7.9
12.8 13.3 12.3
17.0 17.7 18.8
4.9
6.9 6.1 6.5
9.0
7.1 7.3
4
8
12
16
20
2012 2013 2014 2015 2016 2017 2018
Capital Reduction
16.13 17.40 21.48 19.88 27.71 36.41 37.53
ROE
Dividend yield
• Future ROE Goal: 20%
Annual AVG Share Price
Dividend Payout Ratio
70% 69% 67% 70% 79% 80% 73%
1.02
1.75 1.97 1.89
2.75
3.29 3.65
0.7
1.2 1.3 1.3
2.5 2.6 2.65
0
1
2
3
4
2012 2013 2014 2015 2016 2017 2018
EPS
Cash dividend per share
The capital expenditure from 2019
to 2020 will be higher.

7
Brands
Bathroom Solution Water Heater/
Kitchen Appliance Kitchen Solution Imported
Kitchen Appliance
Authorized agent of Electrolux major appliance in Taiwan

8
Products
Kitchen Solution Water Heater/ Kitchen Appliance
Imported Kitchen Appliance Bathroom Solution

9
The Level of Brands
High-end
High- intermediate
Intermediate
Basic
Keep going up
Water Heater/ Kitchen Appliance Kitchen Solution

10
Channel Structure
Taiwan Sakura
Regional Agents
(9)
Brand store Store/Shop、 Hypermarket
Distributor、Sanitary
materials
Kitchenware factory
Special dealer Property
developer
End users
Regional Branches (kitchen solution、import department)
Brand store Distributor
Sanitary materials Special dealer
Kitchenware factory Store/Shop
Property developer Hypermarket
(102) (300) (700) (1500) (670) (300)
Direct Dealer

11
Global Market Network
ODM/OEM Hong Kong
Australia
USA
Brazil
Dominican Republic
OBM Hong Kong
Macau
USA
Canada
Vietnam
Myanmar
Philippine
Mexico
Peru

12
33%
19% 20%
12%
11%
5%
60%
25%
10%
4%
Channel
51%
18%
19%
6% 6%
Product
Sakura 86%
Topax 14%
Brand
Kitchen Solution 1.49 billion
Water Heater & Kitchen Appliance
3.58 billion
Total Sales Revenue: NT$ billion 5.99
Sales Breakdown of 2018
Export 0.57 billion
Import 0.25 billion
Distributor、 Sanitary materials
Store/shop、Hypermarket
Special dealer
Property developer
Brand store
Kitchenware factory
Water heaters
Gas stoves
Range hoods
Dish dryers
Others
Sales Revenue of WH & KA: NT$ billion 3.58

13
69%
31%
60%
25%
10%
4%
Kitchen Solution 1.49 billion
Water heater & Kitchen appliance
3.58 billion
Export 0.57 billion
Import 0.25 billion
Sales Breakdown of 2018
Channel
Property developer
Brand store
Sales Revenue of KS: NT$ billion 1.49 Total Sales Revenue: NT$ billion 5.99

14
Water Heater & Kitchen Appliance
1,200
1,300
1,400
1,500
1,600
2011 2012 2013 2014 2015 2016 2017 2018
Dual brands strategy
• Sakura:Increase profits by promoting high-end models and stabilize the market share.
• Topax: Increase market share, especially by low-priced kitchen appliances.
39% 42% 42% 43% 42% 44% 43% 44%
35% 38% 37% 37% 36% 37% 36% 37%
3.4% 4.5% 5.3% 5.9% 6.1% 6.6% 6.4% 6.8%
0%
10%
20%
30%
40%
50%
2011 2012 2013 2014 2015 2016 2017 2018
S+T Sakura Topax
Market share in Taiwan Taiwan overall market
Stable market
Market size 1.55m units
8.6 million households in Taiwan
Over 6 million homes use our products
(1000 units)
Household penetration: 73%

15
16L Intelligent Turbo Boost Water Heater NTD 23,900
10L RF Water Heater NTD 7,500
Gas Stove NTD 4,700
Intelligent Built-in Hob with Double Vertex Flames NTD 18,300
Slope-side Range Hood NTD 6,590
加倍水量
加倍舒暢
獨家專利環吸技術
3D Ring Suction DC motor Range Hood NTD 25,600
Innovative Products of Taiwan Sakura

16
509 491 497
516 498 504
490 488 508 508
467 495 495 495
398 377
343 339 322 320
293 288 292 278
251 251 247 243
110 114
154 178 176 184 197 201
216 230
215 244 248 252
2008 2009 2010 2011 2012 2013 2014 2015 2016 2017 2018 2019 2020 2021
S+T 55%
Others 45%
The market of Water Heater is about 495,000 units per year.
Assumedly, the digitals will surpass the traditional ones after 2021.
The market share of the digitals will be 60% in the future.
Water Heater
FY2013 FY2018
S+T 53%
Others 47%
FE 60% RF 50%
59% 58% 57% 54% 52% 50%
41% 42% 43% 46% 48% 50%
0%
20%
40%
60%
80%
2013 2014 2015 2016 2017 2018
Traditional Digital
Taiwan Sakura sales quantity
Overall market Market share (S+T) (1000 units)
RF+FE total
RF 54% (Traditional)
FE 46% (Digital)

17
50% 50% 40%
60%
Built-in hobs
Gas Stove
385 354
423 402
378
454 425
451 468 457 455 457 452 452
Building use
permit Building license
Used house
transfer
2008 2009 2010 2011 2012 2013 2014 2015 2016 2017 2018 2019 2020 2021
Table gas stoves
Stable increase Up to 70% in the future
Market: 455,000 units per year
Inside:2013 Outside:2018
S+T 42% Others
58%
FY2013 FY2018
S+T
40% Others 60%
60% 58% 58% 60% 57% 55%
40% 42% 42% 40% 43%
45%
0%
20%
40%
60%
80%
2013 2014 2015 2016 2017 2018
Table Built-in
Taiwan Sakura sales quantity
Overall market Market share (S+T) (1000 units)

18
25%
75%
15%
85%
Rang Hood
Traditional Style
S+T 40% Others
60%
S+T
36% Others
64%
67 128
199 245
287 293 7,900
14,800
21,900 25,900
29,200 31,000
2013 2014 2015 2016 2017 2018
Taiwan Sakura BLDC Rang Hoods Sales
Amount (NT$mn)
Quantity (units)
Overall market Market share (S+T)
(1000 units)
Inside:2013 Outside:2018
385 354
423 402
378
454 425
451 468 457 455 457 452 452
Building use
permit Building license
Used house
transfer
2008 2009 2010 2011 2012 2013 2014 2015 2016 2017 2018 2019 2020 2021
Market: 364,000 units per year
Stable increase of market share Up to 40% in the future
BLDC / European Style
FY2013 FY2018

19
372 420 441
503 525 555
28.0 28.8 28.8 23.6 22.5 22.9
0
200
400
600
2013 2014 2015 2016 2017 2018
T/O of KS Building Use Permit(K house)
Two strategies for future growth: Stable business increase in the channel of property developer; transition of retail
operation
Optimization of the production procedure to increase the gross margin ratio.
147 157 163 169
177 175 160
177
0
50
100
150
200
2011 2012 2013 2014 2015 2016 2017 2018
437
478 470
494
478
465
90 91 94
103 103 102
400
440
480
520
2013 2014 2015 2016 2017 2018
Net Revenue Brand store(1000 sets) (NT$ mn) (NT$ mn)
Kitchen Solution
Increasing benefits of the brand stores The future plan of 4th generation shop
Overall market about 160,000 sets
Constant sales increase of the KS
CAGR 49%
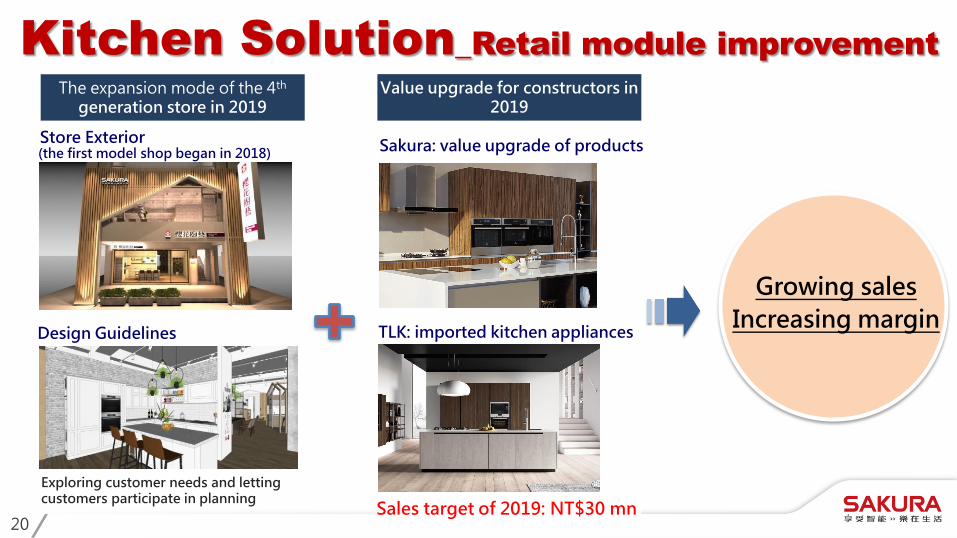
20
Store Exterior
Design Guidelines
(the first model shop began in 2018)
Value upgrade for constructors in 2019
Sakura: value upgrade of products
TLK: imported kitchen appliances
Sales target of 2019: NT$30 mn
Kitchen Solution_Retail module improvement
Exploring customer needs and letting customers participate in planning
The expansion mode of the 4th generation store in 2019
Growing sales
Increasing margin

21
Shenkang plant / Range hood (Spraying) Daya plant / Water heater & Gas stove Wufeng plant / Kitchen solution
Lack of space / Inefficient flow of processing
It’s difficult to install automatic production line with the present space.
Development Plan_Production Optimization
1. Renewal of machines 2. Install of software
2019~2022 Main Capital expenditure
22
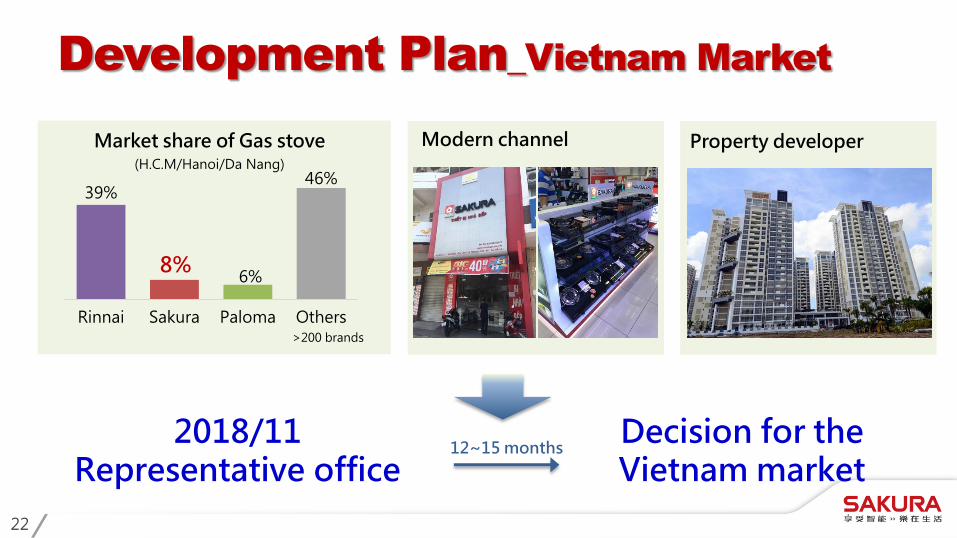
Development Plan_Vietnam Market
2018/11 Representative office
Decision for the Vietnam market
12~15 months
39%
8% 6%
46%
Rinnai Sakura Paloma Others
Market share of Gas stove (H.C.M/Hanoi/Da Nang)
>200 brands
Modern channel Property developer
23
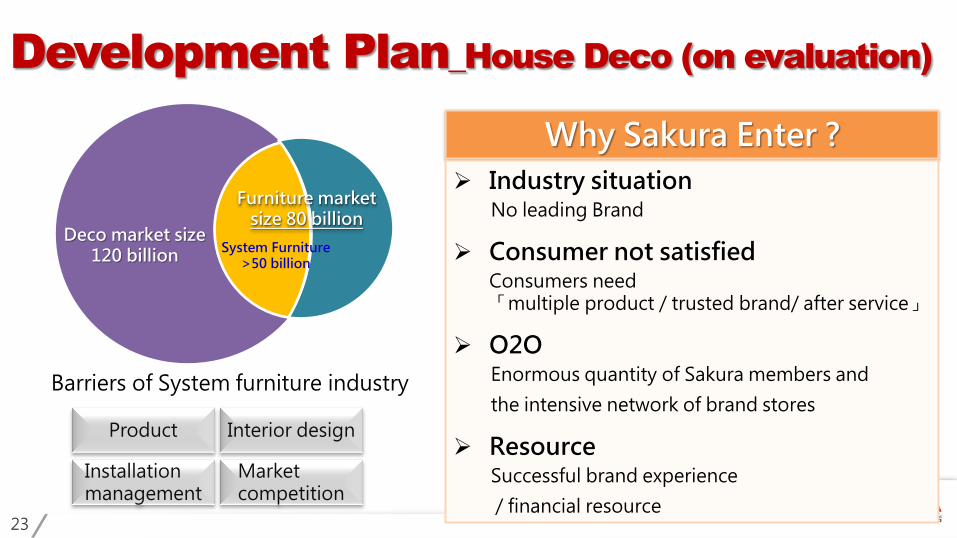
Development Plan_House Deco (on evaluation)
Furniture market size 80 billion
Deco market size 120 billion
System Furniture>50 billion
Barriers of System furniture industry
Product Interior design
Installation management
Market competition
Why Sakura Enter ?
Industry situation No leading Brand
Consumer not satisfied Consumers need 「multiple product / trusted brand/ after service」
O2O Enormous quantity of Sakura members and
the intensive network of brand stores
Resource Successful brand experience
/ financial resource

24
4,074 4,485
4,852 5,149
5,601 5,644 5,986
1,382
276 478 539 517 701 720 800
198
1.02
1.75 1.97 1.89
2.75
3.29
3.65
0.91
0
1
2
3
4
0
1,000
2,000
3,000
4,000
5,000
6,000
2012 2013 2014 2015 2016 2017 2018 2019Q1
Net Revenue Net Income EPS
Sakura Group
Key Financial Indicators
NTD mn NTD
YoY +2 %
YoY +11%

25
Sakura Group
Key Financial Indicators
NTD mn 2012 2013 2014 2015 2016 2017 2018 2019Q1
Net Revenue 4,074 4,485 4,852 5,149 5,601 5,644 5,986 1,382
Gross Profit 1,214 1,371 1,461 1,617 1,825 1,908 2,037 498
Gross Profit Margin 30% 31% 30% 31% 33% 34% 34% 36%
Operating Expenses 928 1,000 960 1,012 1,124 1,152 1,208 305
Operating Profit 286 371 501 606 701 756 756 192 Non-operation Income (Losses)
51 198 136 25 148 107 163 47
Profit Before Tax 337 570 637 631 849 863 993 240
Net Profit 276 478 539 517 701 720 800 198
EPS (NTD) 1.02 1.75 1.97 1.89 2.75 3.29 3.65 0.91
EBITDA 286 371 501 606 803 852 933 221 Profit (loss) from Sakura China
(10) 87 55 (69) 91 67 85 24

26
The market share of kitchen appliances keeps growing while the average retail price and margin are going up by selling more high-end products.
Kitchen Solution is expected to keep growing the market share for new houses and improve the operation efficiency of brand stores.
Expand new business & new market actively.
The investment in production will increase from 2019 to 2020.
Business Prospection
1
2
3
4

27
Sakura China
28
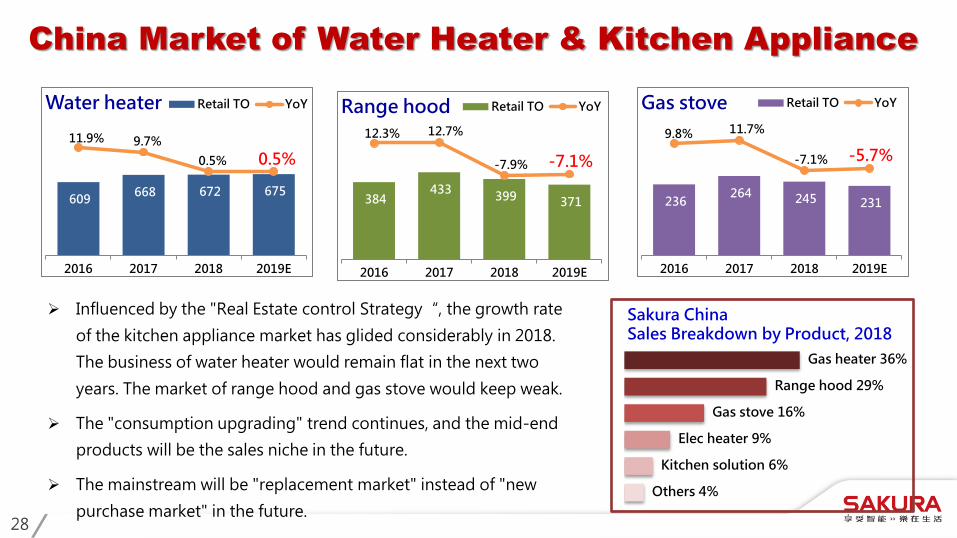
China Market of Water Heater & Kitchen Appliance
384 433
399 371
12.3% 12.7%
-7.9% -7.1%
2016 2017 2018 2019E
Range hood Retail TO YoY
609 668 672 675
11.9% 9.7%
0.5% 0.5%
2016 2017 2018 2019E
Water heater Retail TO YoY
236 264 245 231
9.8% 11.7%
-7.1% -5.7%
2016 2017 2018 2019E
Gas stove Retail TO YoY
Influenced by the "Real Estate control Strategy“, the growth rate
of the kitchen appliance market has glided considerably in 2018.
The business of water heater would remain flat in the next two
years. The market of range hood and gas stove would keep weak.
The "consumption upgrading" trend continues, and the mid-end
products will be the sales niche in the future.
The mainstream will be "replacement market" instead of "new
purchase market" in the future.
Gas heater 36%
Range hood 29%
Gas stove 16%
Elec heater 9%
Kitchen solution 6%
Others 4%
Sakura China Sales Breakdown by Product, 2018

29
Sakura China Overall Business Strategies
1
2
3
Continue to focus on the management in regional and the niche in the replacement markets.
E-commerce deployments / off-line distributor developments in 3-4 tier cities.
Managing Fixed costs / Enforcing Inventory management.

30
Target and key strategy for 2019
1. Sales of Middle –High product grows.
Sales share of 14L above rise to 46%.
2. The market share of gas water heater
from 1.4% to 1.8%.
43% 54%
3%
52% 45%
3%
0%
20%
40%
60%
80%
Gas Electric Others
2017 2018
Water heater market share
9%
Gas water heater is the
mainstream. Gas
Electric
18% 25%
57%
24% 34% 42%
0%
20%
40%
60%
80%
16L 13L,14L <12L
2017 2018
Gas water heater market share
9% 6%
Products of 13L and
above grows rapidly.
Gas(>14L)
Main product_Intelligent gas water heaters
55%
62% 66%
45%
38% 34%
17%
43% 46%
2015 2016 2017 2018 2019E
SC water heater sales share

31
Retailer 39.6%
Key Account
29.1%
EC 16.4%
Agent 8.3%
Others 6.6%
Sakura China
Agents
E-commerce ( EC )
Key Accounts
31 Branches
Retailers
34 Branches
8 Regional Centers
27 Regional Agents
Direct
Sales Breakdown by Channel, 2018
Property developer
Renovation
Main growing power
End users
Channel Structure
Dealer Direct
KA channel:
• Department store • Hypermarket store • National/regional
electric goods chain store
Retailer:
• Sakura Only • Boutique store • Cabinet store

32
E-commerce
20 50 87 109 132
177
0
50
100
150
200
2013 2014 2015 2016 2017 2018
Sakura China - Sales amount of EC
(RMB mn)
2013-2018 CAGR 54%
TMALL
45% JD京東
45%
Others
10%
Sales Breakdown by Customer, 2018
2019 growth target: 40%
2018 Sales YoY
TMALL 25%
JD 39%
Others 48%
Total 33%
EC main strategy
Signing up new area agents
The niche of replacement market in the cities of tier 1 & 2

33
1,161
1,359 1,439 1,430 1,458 1,416
1,312
311
(5) 42 29
(14) 48 33 42 12
(500)
0
500
1,000
1,500
2,000
2012 2013 2014 2015 2016 2017 2018 2019Q1
Net Revenue Net Income(RMB mn)
Sakura China
- Performance and Milestone
Withdrew from KM, and adjusted
the operation and products.
Channel rearrangement & new product development
Q4 Stock
Clearance
Q2 Price
Adjustment

34
THANK YOU!