safe and efficient electrical vehicle - trip | … · · 2015-07-03safe and efficient electrical...
TRANSCRIPT

Safe and Efficient Electrical Vehicle
7th Framework programme / FP7-2010-ICT-GC /
ICT for the fully electrical vehicle / Grant Agreement Number 258133
D210.24 Scenarios descriptions

D210.24 Scenarios descriptions
Final version / non-confidential page 2
Authors
Name Company
SCHMITZ, Marcus, SCHOEMIG, Nadja WIVW
TRUEMAN, Neil TMETC
GLASER, Sébastien, GRUYER, Dominique,
ORFILA, Olivier, AUBERT, Didier,
NOUVELIERE, Lydie, MAMMAR, Said
IFSTTAR
KAISER, Gerd INT
ENGEN, Egil MIL

D210.24 Scenarios descriptions
Final version / non-confidential page 3
Copyright, eFuture Consortium, 2011
Revision chart
Version Date Reason
1.0 29.03.2011 Version derived from D23
1.1 6.4.2011 Final version with additional
introduction content
D210.24 Scenarios descriptions
Final version / non-confidential page 4
Executive Summary
This report describes and specifies scenarios and test procedures relevant for testing the vehicle
dynamics under different circumstances. The first bundle of scenarios is specified for the on-line
simulation of the data fusion, the situation assessment, and the manoeuvre controllers under
ADAS intervention schemes. The second one is realised in a driving simulator and tests the
acceptance of the drivers on vehicle dynamics mainly depending on the influencing parameters
acceleration and speed. The third package of scenarios should test the vehicle dynamics under the
safety perspective. The fourth part describes scenarios for the energy flow simulation and the
battery modelling.
D210.24 Scenarios descriptions
Final version / non-confidential page 5
Table of Content
Introduction.............................................................................................................................6
1 Creation of scenarios for the on-line simulation on the data fusion, situation assessment,
and manoeuvre controllers ......................................................................................................7
1.1 Aims of the scenarios..........................................................................................................7
1.2 Presentation of the SiVIC software.....................................................................................8
1.3 Environment for the scenarios............................................................................................9
1.4 Perception scenario description .......................................................................................11
1.5 Data fusion and object processing scenario description ..................................................13
1.6 Copilot...............................................................................................................................13
2 Creation of scenarios for testing acceptance of the drivers on vehicle dynamics ...............16
2.1 Description of the driving simulator .................................................................................16
2.2 Description of the scenarios .............................................................................................16
3 Creation of scenarios for testing vehicle dynamics and safety issues ................................19
3.1 Hazards..............................................................................................................................19
3.2 Evaluation of new functions in the vehicle.......................................................................20
3.3 Outcomes..........................................................................................................................22
4 Creation of scenarios for testing the energy flow .............................................................23
4.1 Scenario definition............................................................................................................23
Acronyms...............................................................................................................................24

D210.24 Scenarios descriptions
Final version / non-confidential page 6
Introduction
One essential tool in today’s vehicle development is the numerical simulation of complex
processes by means of virtual models which reflect the reality as close as needed for the subject
under development. Numerous simulation tools and models are used for various tasks. A
common procedure is to validate the simulation models with tests using real or virtual scenarios
which are designed especially for the investigation of the model’s purposes. The tests shall reflect
the entire space of requirements set for the models. The tests are run in standard scenarios
varying different parameters to achieve the complete set of possible variations. In eFuture, we
have two different scenario types. The first type is meant to evaluate the vehicle functions for
their requirements (positive testing) whereas the other type accounts for the detection and
assessment of hazard situations for defined failures (hazard or safety testing).
The report at hand describes and specifies common scenarios and test procedures for testing the
project expected targets. These scenarios are relevant for vehicle dynamics (execution layer) up
to ADAS intervention schemes (command layer) as well as for the vehicle’s energy flow. There are
four responsible partners for different areas of scenario modelling:
• IFSTTAR is in charge of the creation of scenarios for the on-line simulation of the (a) data
fusion, (b) the situation assessment, and (c) the manoeuvre controllers.
• WIVW is responsible for scenarios that test the acceptance of the drivers on vehicle
dynamics mainly depending on the influencing parameters acceleration and speed.
• TMETC creates scenarios for testing the vehicle dynamics and the safety issues.
• MIL runs an energy flow simulation and is responsible for battery modelling.
The scenarios serve as input for the simulation tests that are realised within the work package
WP210. The results of these tests are then reported in the project deliverables D210.21
Preliminary results of the vehicle dynamics and stability and D210.22 Preliminary results of the
vehicle behaviour and the acceptance.
This report is a non-confidential document. More details – especially about the scenarios – can be
found in the non-public deliverable D210.23 Scenarios descriptions.

D210.24 Scenarios descriptions
Final version / non-confidential page 7
1 Creation of scenarios for the on-line simulation on the
data fusion, situation assessment, and manoeuvre
controllers
1.1 Aims of the scenarios
This section is dedicated towards the creation of scenarios for the on-line simulation on the data
fusion, situation assessment and manoeuvre controllers. It aims at sensing the environment,
defining potential threat and generate manoeuvre and control recommendation that will be
merged with the driver intention at the decision unit level.
The scenarios must define the aim of the test and evaluation of the technological parts (e.g.
perception) as well as the functions by themselves. We do not deal here with the interaction with
the driver. The scenarios should reflect the environment where each functions will be evaluated
(see Table 1). These scenarios will be investigated with the SiVIC software (see 1.2) which allows
to define sensors and to compare the perception and data analysis phase with a ground truth1.
Table 1: Distribution of functions and test environment.
Perception Function Urban Extra Urban Highway
Data Fusion X X X
eHorizon X X X
Longitudinal Function Urban Extra Urban Highway
SL (Speed Limiter) X X X
CC (Cruise Control) X X
ACC (Adaptive Cruise Control) X X
S&G(Stop and Go) X X X (traffic jam situation)
EB (emergency Braking) X X X (traffic jam situation)
FSFR-ACC (Full Speed Full
Range ACC) X X X
ACC + (Enhanced ACC) X X
SAGA (Smart and Green ACC) X X X
Lateral Function Urban Extra Urban Highway
LDW (Lane Departure Warning) X X
LKAS (Lane Keeping Assistance
System) X X
LCS (Lane Change System) X X X
AELC (Autonomous emergency
lane change) X X X
1 Ground truth is a term used in cartography, meteorology, analysis of aerial photographs, satellite imagery and a range
of other remote sensing techniques in which data are gathered at a distance. Ground truth refers to information that is
collected "on location." In remote sensing, this is especially important in order to relate image data to real features and
materials on the ground. The collection of ground-truth data enables calibration of remote-sensing data, and aids in the
interpretation and analysis of what is being sensed.

D210.24 Scenarios descriptions
Final version / non-confidential page 8
1.2 Presentation of the SiVIC software
The simulation will be realised using the SiVIC software. This software platform is dedicated
toward the test and evaluation of sensing systems that could be embedded in a vehicle. The full
system can be described in the SiVIC environment:
• Basic track with realistic environment,
• Vehicles with associated dynamic, actuators and dedicated objectives (human pilot,
machine pilot or predefined trajectory)
• Large range of sensors both exteroceptive as cameras, radar, laser scanner and
proprioceptive as odometer and accelerometers.
Data processing and fusion, situation assessment, and derived controller can then be done either
with third party software packages (MATLAB, RT-Maps) or using hardware in the loop simulation
with automotive ECU.
Control workflow
Perception
Data Fusion
Decision
Vehicle Control
Sivic Software
Figure 1 Interaction between control workflow and SiVIC software
D210.24 Scenarios descriptions
Final version / non-confidential page 9
Hence, the simulation and validation can be made at several levels (compare Figure 1):
• Perception level: SiVIC can generate raw data, once the perception system is defined
(images for vision system for instance)
• Fusion level: either we can use the results from the previous level or world reference2
from the simulator (for instance, the lateral displacement can be provided through the
perception system or as a world descriptor in SiVIC)
• Decision level: as for the previous level, we can use higher level objects from the fusion
results or objects description from SiVIC.
• Control level: either SiVIC uses its own description of the vehicle trajectory or we use the
command request generated by the control.
At each level, we have the ground truth in order to validate the processing realised at each
previous level.
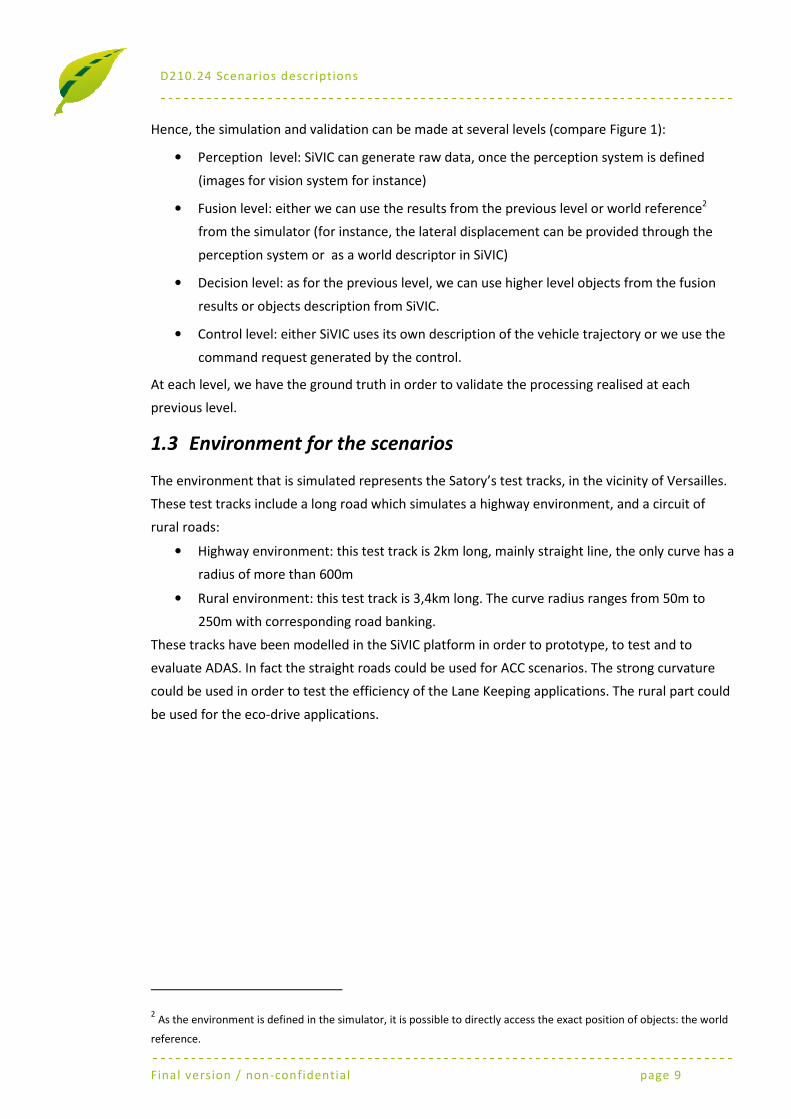
1.3 Environment for the scenarios
The environment that is simulated represents the Satory’s test tracks, in the vicinity of Versailles.
These test tracks include a long road which simulates a highway environment, and a circuit of
rural roads:
• Highway environment: this test track is 2km long, mainly straight line, the only curve has a
radius of more than 600m
• Rural environment: this test track is 3,4km long. The curve radius ranges from 50m to
250m with corresponding road banking.
These tracks have been modelled in the SiVIC platform in order to prototype, to test and to
evaluate ADAS. In fact the straight roads could be used for ACC scenarios. The strong curvature
could be used in order to test the efficiency of the Lane Keeping applications. The rural part could
be used for the eco-drive applications.
2 As the environment is defined in the simulator, it is possible to directly access the exact position of objects: the world
reference.

D210.24 Scenarios descriptions
Final version / non-confidential page 10
Figure 2: Satory’s tracks.
Figure 3: Straight road.
Figure 4: Road with curvature.

D210.24 Scenarios descriptions
Final version / non-confidential page 11
Using the previous architecture diagram, we will need to define four levels of processing for the
basic simulation and validation:
• First level: sensors. At this level we will need to generate the signals from the selected
sensors (both proprioceptive and exteroceptive) and noise associated with each. These
inputs will be used in the next level.
• Second level: data processing. From this level, we will extract data from sensors signals.
We can have at this level a first evaluation of the performance of the algorithm while
looking at the difference between the results that are obtained and the ground truth from
the simulator.
• Third level: object processing. This level aims at transforming previous data to an
aggregated object that will be used by the driver assistance. These objects cover, for
example, the road description, the obstacle, and /or pedestrians. The confidence in the
detection is also set at this level. Again, results can be evaluated with the ground truth
provided by the simulator.
• Fourth level: Co-pilot. This level uses previous results to assess the near future manoeuvre
that must be achieved in order to enhance the safety of the vehicle. The validation of this
level uses the complete closed loop of the simulator.
1.4 Perception scenario description
Different scenarios will be tested by means of driving simulation tools in order to analyse the
perception performance as well as its adequacy to the needs. Simulation will enable to test the
system on several scenes and for a given scene under various conditions such as traffic,
illumination, obstacle contrast, weather, etc. Thus, the scenarios take place in different traffic
environments and should reflect different and realistic conditions:
• Traffic conditions:
o Free
o Congested
• Object aspects
o Well contrasted
o Poorly contrasted
• Driving conditions:
o Weather: For the perception task
o Daytime: For the perception task
All simulated scenarios should match real ones undertaken on vehicles. Three perception systems
will be tested: road detection and characterization, obstacles detection, speed limit road sign
recognition.

D210.24 Scenarios descriptions
Final version / non-confidential page 12
1.4.1 Scenario for the road marking and lanes detection and
tracking
For these tests, different types of road and geometry are needed to evaluate if the system is able
to detect and track various types of lanes marking as well as straight and curve ones. It is also
necessary to test the efficiency of the detection under various roads marking contrast (marking on
asphalt or concrete), adverse road surface and under various weather conditions.
Thus two scenarios will be realised: one is dealing with an extra urban road and the other dealing
with a highway. For the extra urban road scenario, the road is a succession of straight lane and
curves (some of them are very sharp as presented in the environment of scenarios).
1.4.2 Scenario for the obstacle detection and tracking
The purpose of the obstacle detection and tracking is twofold. For several scenarios, it is
necessary to detect and to track the closer front vehicle located in the same lane. For another
scenario (emergency braking), the aim is to detect as fast as possible an obstacle appearing
suddenly. For the latter scenario, the obstacle will be a vehicle, too.
1.4.2.1 Scenario to test the stereo system
One factor that strongly impacts a vision perception system is the contrast. To test the
performance of the stereo system with regard to the contrast, variously coloured vehicles are
needed as well as various weather and daytime conditions. The performance of a stereovision
system is also affected by repetitive shapes. Three scenarios will be realised (highway, extra-
urban and urban), and each test is characterised by a road surface, a traffic density, weather and
daytime conditions. This gives 48 different situations for each of the three scenarios.
1.4.2.2 Scenario to test the RADAR system
RADAR signals are not affected by daytime condition nor by fog or by the road surface. This
reduces the number of situations to simulate. RADAR signals are affected by the object material,
size and shape. Thus, various degrees of signal absorption must be accounted for the simulated
scenes. As previously, three scenarios will be tested, one for each road type. These scenarios are
the same than previously except that vehicles’ colour is replaced by signal absorption. For each of
the three scenarios, each test is characterised by a traffic density and a weather condition. This
gives four different situations for each of the three scenarios.
1.4.3 Scenario for the speed limit road sign recognition
Speed limit sign recognition is no more a research topic. Several products exist already and
several cars are equipped with it. Thus, no specific development will be undertaken on this topic
but what is available will be used. That means an existing recognition system will be used or the
speed limit is received from the map assuming that the location of road sign is accurate on the
D210.24 Scenarios descriptions
Final version / non-confidential page 13
road map used (eHorizon). Two scenarios will be performed, one for the extra-urban and the
other for the urban roads. Extra urban is described in the simulation section. For the urban one,
we will need to define a network of roads to get cross-junction, round-about and a city with
various buildings and road signal as well as advertisement, tags affecting the saliency. The road is
characterised by a succession of straight and curve lane. Road signal will be along the road.
Various types of vehicles will be present as well as other objects (trees for instance). These
vehicles and objects will mask partially or completely the road signal from time to time. For each
of the 2 scenarios (extra-urban and urban), each test is characterised by a traffic density, a
weather and daytime conditions. This gives 12 different situations for each of the 2 scenarios.
1.5 Data fusion and object processing scenario description
In order to provide a local perception of the surrounding area of an ego-vehicle, several sensors
are embedded. The exteroceptive sensors include two cameras in front of the vehicle, two other
cameras in lateral positions and one RADAR for telemetric data. Moreover, for the localisation
stage, one GPS is available. The chosen fusion algorithm will be based on a cooperative approach:
when possible, targets detected by the accurate sensor will be used to define area of interest in
the vision sensors. This approach will decrease the complexity and increase the robustness. The
scenarios and quality indicators will be the same as for the perception part.
1.6 Copilot
Different scenarios will be tested by means of driving simulation tools in order to analyse the
validity of ADAS especially concerning their outputs and internal data flow. These scenarios
should match the scenarios that are used for testing ADAS operation in the real vehicle. The
scenarios take place in different traffic environments and should reflect different and realistic
conditions: a) traffic conditions and b) driving conditions for the perception task (weather /
daytime).
1.6.1 Longitudinal scenarios
The aim of speed control is to limit the vehicle speed to the legal speed limit. The driver remains
responsible for the vehicle speed and the throttle position is limited when the vehicle speed
reaches the legal limit. The driver can overrule the system by a stronger action on the acceleration
pedal. As the function mainly uses driver information, it will not be tested on the ADAS part.
The aim of cruise control is to regulate the vehicle speed around a driver selected value. The
driver can disengage the system by braking or switching it off. As the function mainly uses driver
information, and as a more complex system will be tested, it will not be tested on the ADAS part.
The adaptive cruise control embeds a cruise control (regulation of the vehicle speed to the driver
defined speed) with a vehicle following system. When a vehicle is in front of the ego vehicle,
when its speed is below the driver's defined speed or when the time headway is below a desired
one, the system regulates the ego vehicle speed accordingly. If the regulation is not possible

D210.24 Scenarios descriptions
Final version / non-confidential page 14
(outside of the ego vehicle acceleration range) a warning is emitted for the driver. In this function
the scenario is a mix of situation between free driving (without any leading vehicle) and
constrained driving (with a leading vehicle). The considered behaviour for the leading vehicle
ranges from: acceleration and deceleration in the same lane, or changing lane to and from the
ego vehicle lane.
The stop and go function assists the driver between 0 and 30 km/h to regulate the vehicle speed
according to the preceding vehicle. When the ego vehicle reaches 30km/h, the driver must
accelerate by himself in order to drive at higher speeds. The behaviour of the preceding vehicle
ranges with a speed between 0 to 50km/h up to stopping.
The emergency braking aims at slowing the vehicle (until stopping it), when an obstacle is
detected and the collision becomes impossible to be avoided. Depending on the strategy, the
function could firstly warn the driver, and then starts a small braking. If the time to collision drops
below a predefined value, a stronger braking is generated. The other vehicle is used in this
scenario as an obstacle in the same lane.
The FSFR-ACC embeds an ACC and an S&G. Moreover, it closes the gap between 30 and 80km/h.
The Enhanced ACC (or ACC+) embeds an ACC function and the knowledge of the incoming road
difficulties to adapt the ego vehicle speed to a safe speed. This safe speed is evaluated depending
on the road situation. If the safe speed (no collision, safe headway spacing, legal speed, speed
deduced from the road attributes) is lower than the driver desired speed, then it overrules the
driver setting. The driver can still bypass the function by normal way (as for an ACC) or by
switching it off.
This scenario implies one vehicle equipped with the SAGA function on a specific known incoming
road with the information about the slope, the presence of an intersection, the legal speed limit
and the geometrical attributes of a curve. The SAGA function has to control the ego vehicle speed
taking into account these data in order to optimise the fuel consumption while improving safety
(no collision, under the legal speed, up to the safe headway).
When a lane change occurs while the SAGA function has been activated, this last one adapts to
this new situation (sudden changing in speed and headway spacing). The other vehicles generate
various traffic conditions.
1.6.2 Lateral Scenario
The aim of Lane Departure Warning (LDW) is to inform the driver that the vehicle is leaving its
lane. This information (e.g. sound, vibration) can be deactivated when the indicators are on.
The aim of Lane Keeping Assistant System is to control the vehicle to keep it inside its lane. This
scenario will imply one vehicle equipped with LKAS function on a specific road with several curves.
The vehicle will travel, at constant speed, on a road equivalent to a highway with short curvature
radii.

D210.24 Scenarios descriptions
Final version / non-confidential page 15
The aim of Lane Change System (LCS) is to automatically change the vehicle lane when the driver
turns on the indicators.
The aim of Autonomous Emergency Lane Change is, if the possibility is offered, to change the
vehicle lane if a dangerous event (e.g. presence of obstacle) occurs in order to avoid a crash.
D210.24 Scenarios descriptions
Final version / non-confidential page 16
2 Creation of scenarios for testing acceptance of the
drivers on vehicle dynamics
Different scenarios will be tested by means of a driving simulator in order to analyse the
acceptance of the drivers on a) changes in the vehicle dynamics, b) interventions of the car, and c)
feedback/info given to the driver. These scenarios should partly match the scenarios that are used
for testing the acceptance in the real vehicle (i.e. prototype).
Test scenarios that are related to questions on safety and stability are not included in the driving
simulation test as driving simulation is not an appropriate method for realising extreme dynamical
scenarios.
The usage of different drive cycles to test the vehicle model and consumption model will not be
done by means of test drivers.
2.1 Description of the driving simulator
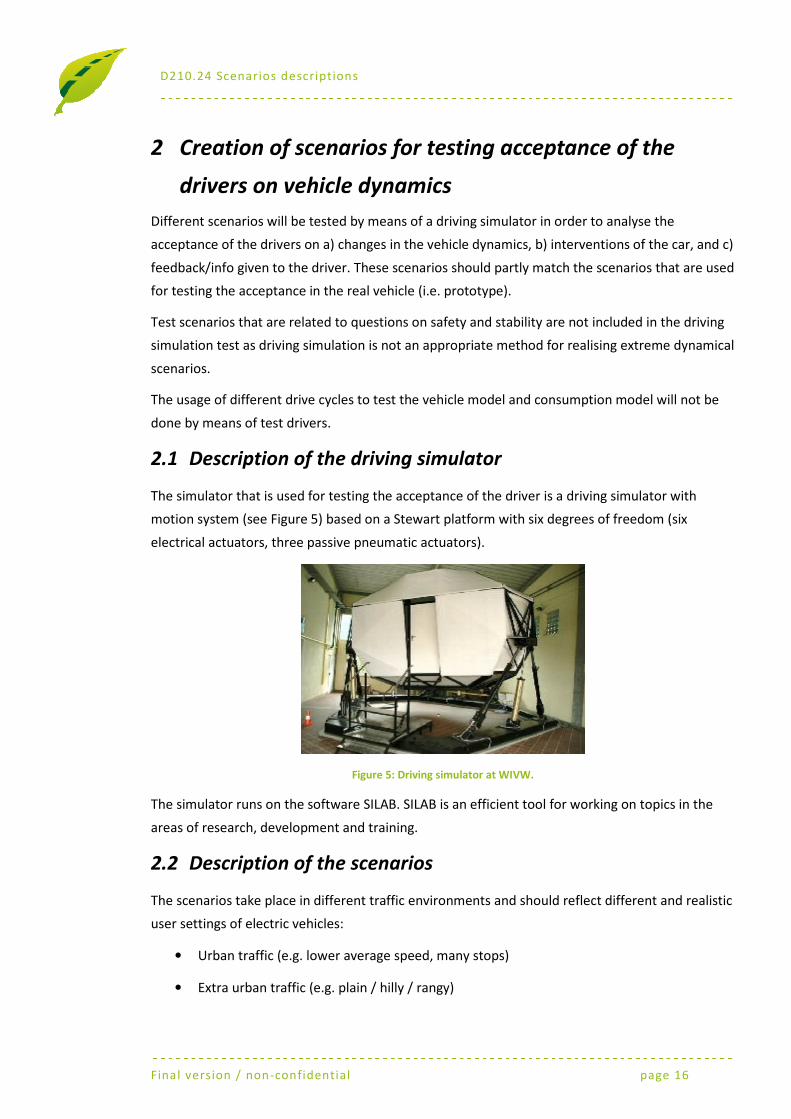
The simulator that is used for testing the acceptance of the driver is a driving simulator with
motion system (see Figure 5) based on a Stewart platform with six degrees of freedom (six
electrical actuators, three passive pneumatic actuators).
Figure 5: Driving simulator at WIVW.
The simulator runs on the software SILAB. SILAB is an efficient tool for working on topics in the
areas of research, development and training.
2.2 Description of the scenarios
The scenarios take place in different traffic environments and should reflect different and realistic
user settings of electric vehicles:
• Urban traffic (e.g. lower average speed, many stops)
• Extra urban traffic (e.g. plain / hilly / rangy)

D210.24 Scenarios descriptions
Final version / non-confidential page 17
Figure 6: Screenshots of different simulated environments (left: urban scenario / right: extra urban scenario)
The scenarios are subsumed under different use cases that are explained in the following
sections.
The parameters that mainly influence the energy efficiency are acceleration and maximum speed.
These two influencing factors will either be limited by the performance of the car (i.e. maximum
performance) or by the thresholds set via (a) the eco-mode or (b) the safe mode.
• The performance mode does not limit any parameters of the vehicle, i.e. 100%
acceleration and speed.
• The eco-mode is a range-oriented mode, selectable by the driver or by the vehicle energy
management system. The mode limits the acceleration and the maximum speed of the
vehicle. Two variants with two different thresholds for the limitations will be tested in
studies with test drivers.
• The safe mode should keep the vehicle and its components in a safe status in case of
(upcoming) systems errors or a very low battery status. The limits of acceleration and
maximum speed are significantly low. Further interventions of the vehicle might be
necessary, e.g. shutting down additional consumers. The safe mode will only be selected
by the vehicle energy management and - in case of a low battery status - should
guarantee that the driver will reach a safe position before draining the battery
completely.
2.2.1 Use case 1: Limiting the vehicle’s performance to enhance
the energy efficiency
In order to find reasonable thresholds for the limitations four different modules are designed to
test the energy consumption under different conditions. These modules make a compromise
between real traffic and standard driving cycles in terms of dynamic traffic. The variation of the
dynamic character is realised in terms of variation in speed, slope, curvature, and different
number of stops. In addition, a variation of acceleration and deceleration is realised by different
instructions on the driving style and driving manoeuvres in specific traffic situations.

D210.24 Scenarios descriptions
Final version / non-confidential page 18
Table 2: Module description.
Module Environment Dynamic ΔSpeed Slope Curvature
XU_high_dynamic Extra urban High High High in-/decline High
XU_low_dynamic Extra urban Low Low Low in-/decline Low
U_high_dynamic Urban High High High in-/decline High
U_low_dynamic Urban Low Low Low in-/decline Low
2.2.2 Use case 2: Drivers’ acceptance of limitations in vehicle
dynamics
In a second step, the acceptance of the limitations is tested by driving different manoeuvres in
different environments. The following scenarios are part of the first acceptance study in the
driving simulator with a set of test drivers. The exact eco-mode limits will be fixed during the pre-
testing phase as a result of the first use case.
Table 3: Scenarios for driver acceptance tests.
Manoeuvre Environment Performance
Eco-Mode
Limit 1
Eco-Mode
Limit 2
Safe
mode
1 Normal driving urban x x x
2 Normal driving extra urban x x x
4
Acceleration from 0
kph (e.g. traffic
lights)
urban x x x
5 Overtaking (e.g.
lorry, bus) extra urban x x x
6
Overtaking intention
with very low
battery status
extra urban x x
7 Drive up the hill extra urban,
5% slope x x x
8 Drive up the hill extra urban,
10% slope x x x
9 Drive down the hill extra urban,
5% slope x x x
10 Drive down the hill extra urban,
10% slope x x x
11 Restricted driving urban x
12 Restricted driving extra urban x
D210.24 Scenarios descriptions
Final version / non-confidential page 19
3 Creation of scenarios for testing vehicle dynamics and
safety issues
A vehicle level safety analysis is underway. Preliminary hazards have been identified. The main
consideration of the vehicle dynamics hazard analysis focuses on the unintended erroneous
delivery of traction or braking torque demand to driving wheels.
3.1 Hazards
Each functional hazard that can lead to this error condition shall be individually judged with
respect to Severity (the risk assessment of the hazardous event focusing on the harm to each
endangered person), Exposure (the risk assessment of the hazardous event focusing on the
likelihood of occurrence) and Controllability (the risk assessment of the estimation of the
probability that the driver or other endangered persons are able to gain control of the hazardous
event). Based on these three criteria, in accordance with ISO 26262, each hazard shall be given a
Safety Integrity Level. The Safety Integrity Level shall be determined by the execution of a Safety
Case analysis which shall be conducted during the course of the programme. Typical Hazard
descriptions include:
• Unintended increase in or excessive torque
• Insufficient torque
• Torque applied in the opposite direction
• Intermittent torque
• Erratic Torque
• Lack or loss of torque
• Braking torque applied instead of traction torque
In the first instance, the hazards with the highest Safety Integrity Level shall be analysed.
The process shall involve the creation of scenarios based on the vehicle performing a defined
repeatable steady state or transient handling driving manoeuvre during which the hazard is
injected. After defining the scenarios in this document, the simulations will be run on a
Matlab/Simulink model. The velocity before the failure occurs will be varied from 0-120 kph in
steps of 40 kph. The road-tire adhesion will be varied for dry asphalt (µ=0.9), wet asphalt (µ=0.6)
and a snowy road (µ=0.3). The driver will not be considered in the simulation because there are
no general, unique driver models available and it is not the scope of this project to develop driver
models. The straight line handling test states are listed in the table below:

D210.24 Scenarios descriptions
Final version / non-confidential page 20
Table 4: Straight line test with motor failures
Scenario Failure Initial velocity
[kph]
Road
adhesion
µ =
One motor 40 / 80 / 120 0.3 / 0.6 / 0.9 Straight line
acceleration Two motors 40 / 80 / 120 0.3 / 0.6 / 0.9
One motor 40 / 80 / 120 0.3 / 0.6 / 0.9 Straight line
deceleration Two motors 40 / 80 / 120 0.3 / 0.6 / 0.9
It is not efficient to do all the described simulations listed in Table 4. After making some
simulations it is possible to find tendencies and the most dangerous hazards (in terms of Severity,
Exposure and Controllability). So not every hazard should be simulated for each scenario but it is
important to document which test is done and why a test is skipped. The failures will be occurring
on one or both motors. A further dimension of testing is the duration of motor failure because it
makes a difference if the failure occurs for 1 millisecond or if the failure occurs for 1 minute. So
this is a further error parameter which has to be simulated. After simulating the straight
manoeuvres the cornering performance with errors has to be simulated. To limit the number of
tests the velocity can be fixed to the most “dangerous” velocity (found in the straight line test).
But now the lateral acceleration has to be varied.
Table 5: Cornering tests with motor failures
Scenario Failure
Lateral
acceleration
[m/s²]
Road
adhesion
µ =
Two motors 2 / 4 / 6 0.3 / 0.6 / 0.9
Inside motor 2 / 4 / 6 0.3 / 0.6 / 0.9
Outside motor 2 / 4 / 6 0.3 / 0.6 / 0.9
Constant
radius
turning
Two motors in
opposite direction 2 / 4 / 6 0.3 / 0.6 / 0.9
To interpret the simulations the main vehicle states have to be defined. A first suggestion is to
compare the longitudinal acceleration, the lateral acceleration, the yaw rate, the side slip angle
and the lateral displacement from the normal driving route.
3.2 Evaluation of new functions in the vehicle
After evaluating a real base line vehicle with state of the art functions, the simulation will be used
to test new drive line functions which are developed during the project. Also the interconnection
of new functions with existing body functions is very important because the new features may
interfere with known and well understood functions.
A first guess for a problem can be the strong braking capability of the electric motors. From a
vehicle safety and hand ability point of view it is necessary that the wheels are not locked while
driving. In an internal combustion engine (ICE) driven vehicle the braking capability of the engine

D210.24 Scenarios descriptions
Final version / non-confidential page 21
is week, so the ICE cannot lock the wheels. To reach an adequate deceleration performance
hydraulic brakes are installed. With the strong braking torque of the hydraulic brakes it is possible
to lock the wheels while driving. This is an undesired behaviour so in actual vehicles an Anti-lock
Braking System (ABS) is installed. ABS reduces the braking pressure to ensure a proper wheel
movement.
But in an electric vehicle, the electric motors can bypass the existing ABS (which is only
influencing the hydraulic brakes). This can cause in a dangerous driving situation for the driver.
So all new drive line functions which are controlling the vehicle dynamics have to be evaluated
with all existent functions. As a result the function ABS has to be modified to work with electric
motors or there has to be a hydraulic and an electric anti blocking system. Similarly the TCS
(Traction Control System) has to be modified to fit to the electric motors.
In this project a general vehicle observer will be developed. In actual vehicles, every control unit is
observing the vehicle states which are needed for this function. So the systems are independent
of other systems but some calculations will be done more than once. To avoid unnecessary
calculations there will be a general vehicle observer to estimate the states of the vehicle and to
provide the states to every function.
Additional new degrees of freedom are realizable with a vehicle with two independent electric
motors at one axle. In a normal vehicle the torque from the motor is distributed to the wheels
with a final drive. The final drive just splits the torque equally to the left and right wheel. In most
of the cases this is a good strategy but while driving corners or on roads with different surfaces
(e.g. asphalt & snow) the final drive is not optimal. So the simulation of the vehicle should be used
to compare a vehicle with an active torque distribution with a normal vehicle. With this simulation
the usage of the so called Torque Vectoring can be evaluated. To validate the integrity of these
new functions the general vehicle will be simulated with the vehicle observer and the torque
distribution to every motor. For this evaluation the following scenarios will be used:
Table 6: Simulation scenarios for drivetrain decision unit validation
Functions included Why?
Vehicle Observer &
Decision Unit - Drivetrain
compare eFuture
to standard vehicle
Straight Line Acceleration Test TCS functionality
Straight Line Braking (ISO 21994) Test ABS functionality
Constant Radius Turning (ISO 4138) Test TorVec functionality
Brake in Bend (ISO 7975) Test ABS + TorVec
Acceleration in a Bend Test TCS + TorVec
Step Steer (ISO 7401) Test TorVec + ESP
Lift Off Oversteer (ISO 9816) Test TorVec + ESP + ABS
Ma
no
eu
vre
s
Sinus with dwell (NHTSA) Test TorVec + ESP + ABS + TCS

D210.24 Scenarios descriptions
Final version / non-confidential page 22
Functions included Road Surface Existing functions -
status
EBD ABS ESC
Vehicle Observer &
Decision Unit - Drivetrain
µ =
0.3
µ =
0.6
µ =
0.9 On On On Off
Straight Line Acceleration x x x x x x x
Straight Line Braking (ISO 21994) x x x x x x x
Constant Radius Turning (ISO 4138) x x x x x x x
Brake in Bend (ISO 7975) x x x x x x x
Acceleration in a Bend x x x x x x x
Step Steer (ISO 7401) x x x x x x x
Lift Off Oversteer (ISO 9816) x x x x x x x
Ma
no
eu
vre
s
Sinus with dwell (NHTSA) x x x x x x x
The initial velocity of the vehicle will be adapted for every test and will be changed according to
the standard procedures. Additional the road surface conditions can be varied on the left and
right side.
3.3 Outcomes
The application of the erroneous torque demand error, in the context of the driving scenarios can
lead to the following manoeuvre deviations:
• Un-demanded accelerated forward motion, requiring, for example, extra stopping
distances.
• Un-demanded decelerated forward motion, requiring, for example, awareness of self-
obstruction.
• Oversteer/Understeer
• Usability of new functions and adaption to two electric motors
The result of the simulation should objectively determine measures as to what is deemed an
acceptable deviation from controlled driving before the function intervenes and switches the
system into a safe state.

D210.24 Scenarios descriptions
Final version / non-confidential page 23
4 Creation of scenarios for testing the energy flow
4.1 Scenario definition
For the energy flow simulation it is important to capture the behaviour of the traction battery
under different circumstances. In this relation Miljøbil will focus on developing a battery model
describing the main electrical and thermal behaviour of the traction battery. This allows Miljøbil
to study the efficiency under different performance modes, topographies, temperatures, charging
states etc. The scenarios agreed to capture this behaviour are listed in the table below:
Performance Eco Safe Scenario Performance
mode SOC>70% SOC< 20% SOC>70% SOC< 20% SOC>70% SOC< 20%
Acceleration / 0-80kph X X X X
Acceleration / 20-50* kph X X X X X*
Acceleration / 50-80* kph X X X X
Drive up the hill 5% slope /
50 kph X X X X X*
Drive up the hill 10% slope
/ 50 kph X X X X X*
NEDC X X N/A
*Maximum speed can be limited.

D210.24 Scenarios descriptions
Final version / non-confidential page 24
Acronyms
ABS Antilock braking system
ACC Adaptive cruise control
ADAS Advanced driver assistance system
AELC Autonomous Emergency Lane Change
BMMS Battery measurement and monitoring system
BMS Battery management system
CAN Controller area network
EB Emergency Braking
EBD Electronic Brakeforce Distribution
EC European Commission
ECG Electrocardiogram
EEG Electroencephalogram
ESP Electronic Stability Program
EV Electric Vehicle
FMEA Failure mode and effect analysis
GPS Global Positioning System
HMI Human Machine Interface
HV High voltage
HVAC Heating, ventilation and air conditioning
ICE Internal combustion engine
ICT Information and communication technology
INS Inertial Navigation System
LCD Liquid Crystal Display
LCS Lane Change System
mu Friction coefficient
NEDC New European driving cycle
PDU Power distribution unit
PTC Positive temperature coefficient
RFQ Request for quotation
RTD Research and technology development
SOC State of charge
TCS Traction Control System
VMU Vehicle management unit