sacramento central groundwater authority groundwater
TRANSCRIPT
Sacramento Central Groundwater Authority Groundwater Elevation
Monitoring Plan
February 2012
Table of Contents
1.0 Introduction ........................................................................................................................................... 1
1.1 Scope of Sacramento Central Groundwater Authority ..................................................................... 1
2.0 Principle Aquifer Features of South American Sub-basin .................................................................... 4
3.0 History of Monitoring ........................................................................................................................... 7
4.0 Monitoring Sites and Timing .............................................................................................................. 12
4.1 South American Well Network Design ........................................................................................... 12
4.2 Current Wells .................................................................................................................................. 12
4.3 Future Wells .................................................................................................................................... 12
4.4 Data Gaps ........................................................................................................................................ 13
5.0 Monitoring Schedule ........................................................................................................................... 16
6.0 Groundwater Monitoring Protocol ...................................................................................................... 17
6.0.1 Scope and Application ................................................................................................................. 17
6.0.2 Method Summary ......................................................................................................................... 18
6.0.3 Potential Problems........................................................................................................................ 19
6.0.4 Equipment .................................................................................................................................... 20
6.0.5 Field Method Procedures ............................................................................................................. 20
6.0.6 Calculations .................................................................................................................................. 22
6.0.7 Quality Assurance/Quality Control .............................................................................................. 22
6.1 Data Reporting .................................................................................................................................... 23

List of Figures
Figure 1: SCGA Boundary.......................................................................................................................... 3
Figure 2: Cross-section of Groundwater Formations Underlying South American Sub-basin .................. 5
Figure 3: Sources of Groundwater Recharge .............................................................................................. 7
Figure 4: Location of Historically Monitored Wells in South American Sub-basin .................................. 9
Figure 5: Groundwater Contour Map - Spring 2007 ................................................................................ 10
Figure 6: Groundwater Contour Map Fall 2007 ....................................................................................... 11
Figure 7: Location of Current CASGEM Wells within South American Sub-basin ................................ 14
List of Tables
Table 1: Active Monitoring Wells by Agency .......................................................................................... 15
Table 2: Sacramento Regional Climate Characteristics ............................................................................ 17
Sacramento Central Groundwater Authority Groundwater Elevation Monitoring Plan
February 2012
Sacramento Central Groundwater Authority Page 1 M an ag ing Grou nd wa te r Resou r ces i n Ce n t ra l S a cr a m en to Cou n ty
1.0 Introduction
The purpose of this monitoring plan is to outline the objectives and actions of the Sacramento Central
Groundwater Authority (Authority) in its role as the responsible monitoring and reporting entity under
the California State Groundwater Elevation Monitoring (CASGEM) program for the South American
Subbasin (DWR Bulletin 118, Basin 5-21.65) and a small portion of the Cosumnes Subbasin (DWR
Bulletin 118, Basin 5-22.16) for which the Authority’s administrative boundary overlaps.
This plan meets the CASGEM program requirements set forth by the California State Department of
Water Resources (DWR) pursuant to Senate Bill X7 6 which calls for the regular and systematic
monitoring of groundwater elevations that demonstrate seasonal and long-term groundwater basin trends
and to make that information readily available to the public. In accordance with these directives this
plan contains the following components:
Principle aquifer features of the sub-basin
History of monitoring within the sub-basin
Discussion of the well network (including location maps and detailed well information table)
Monitoring schedule
Description of well monitoring protocol and reporting
1.1 Scope of Sacramento Central Groundwater Authority
The Authority was formed on August 29, 2006 through a Joint Powers Agreement between the Cities of
Elk Grove, Folsom, Rancho Cordova, and Sacramento and the County of Sacramento. The Board of
Directors of the Authority consists of sixteen members representing stakeholder interest groups
including agriculture, agriculture/residential users, business, environmental/community organizations,
local governments/public agencies and water purveyors who are charged with ensuring the
implementation of the Basin Management Objectives prescribed by the Central Sacramento County
Groundwater Management Plan (February 2006).

Sacramento Central Groundwater Authority Groundwater Elevation Monitoring Plan
February 2012
Sacramento Central Groundwater Authority Page 2 M an ag ing Grou nd wa te r Resou r ces i n Ce n t ra l S a cr a m en to Cou n ty
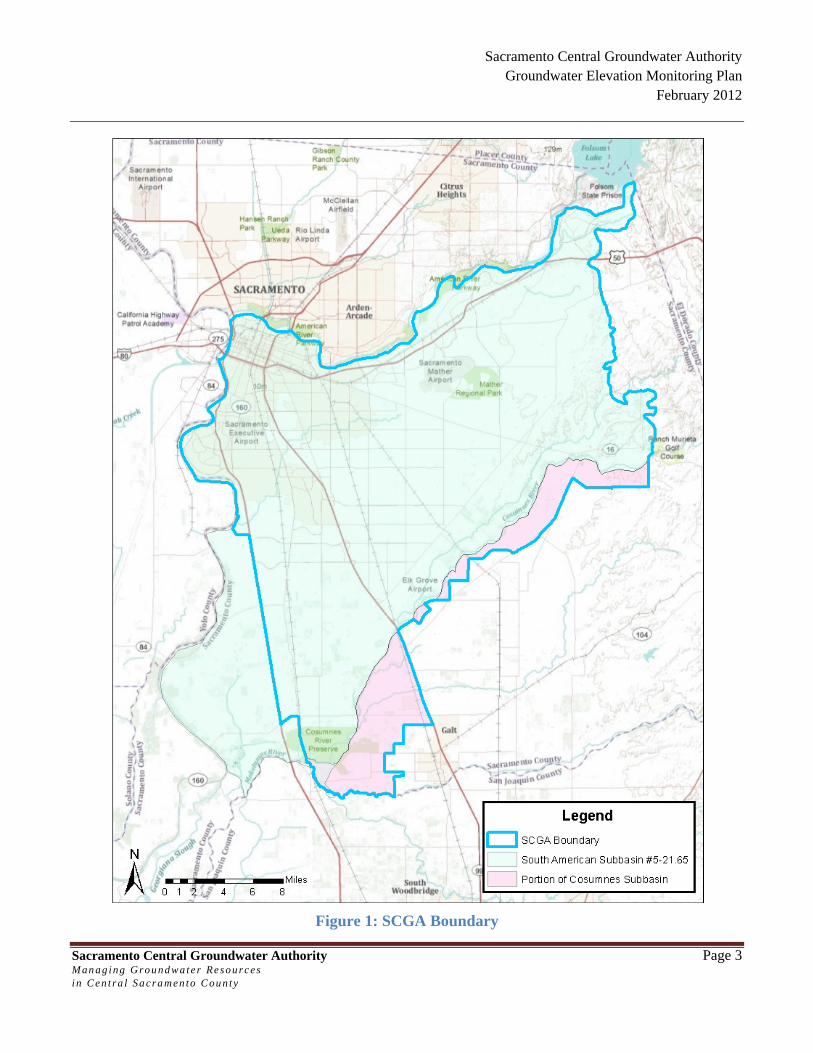
The Authority’s boundary encompasses roughly 386 square miles in the central region of Sacramento
County; encompassing a majority of the South American Subbasin and a small portion of the Cosumnes
Subbasin (Figure 1). Groundwater use in the region is made up of a variety of users including
agricultural, agricultural residential, municipal, industrial, and environmental.
The Authority will be responsible for monitoring the entirety of the South American Subbasin including
those areas that lie outside of the Authority’s boundary. These areas lie at the western and eastern most
edges of the sub-basin, in generally rural areas, and do not currently possess any known groundwater
monitoring facilities.
The small portion of the Cosumnes Subbasin for which Authority is responsible, lies along the northern
most portion of the subbasin adjacent to the Cosumnes River and does not currently possess any known
groundwater elevation monitoring locations. For this reason, this monitoring plan will not specifically
address a monitoring rationale for the Cosumnes Subbasin at this time.
Sacramento Central Groundwater Authority Groundwater Elevation Monitoring Plan
February 2012
Sacramento Central Groundwater Authority Page 3 M an ag ing Grou nd wa te r Resou r ces i n Ce n t ra l S a cr a m en to Cou n ty
Figure 1: SCGA Boundary
Sacramento Central Groundwater Authority Groundwater Elevation Monitoring Plan
February 2012
Sacramento Central Groundwater Authority Page 4 M an ag ing Grou nd wa te r Resou r ces i n Ce n t ra l S a cr a m en to Cou n ty
2.0 Principle Aquifer Features of South American Subbasin
The South American Subbasin, for which the Authority’s boundary is a portion, is defined as that area
bounded on the west by the Sacramento River, on the north by the American River, on the south by the
Cosumnes and Mokelumne rivers, and on the east by the Sierra Nevada Range (Figure 1). The perennial
rivers that surround the sub-basin generally create a groundwater divide in the shallow subsurface. It is
clear that interaction occurs between groundwater of adjacent subbasins at greater depths.
Average annual precipitation in the basin ranges from about 14 inches along the western boundary to
greater than 20 inches along the eastern boundary. The eastern basin boundary is defined by the
uprising foothills of the Sierra Nevada, and is a north-south line extending from Folsom Reservoir south
to the small community of Rancho Murieta. This represents the approximate edge of the alluvial basin,
where little groundwater flows into or out of the groundwater basin from the Sierra Nevada foothills.
The western portion of the subbasin consists of nearly flat floodplain deposits from the Sacramento,
American, and Cosumnes rivers, and several small east side tributaries.
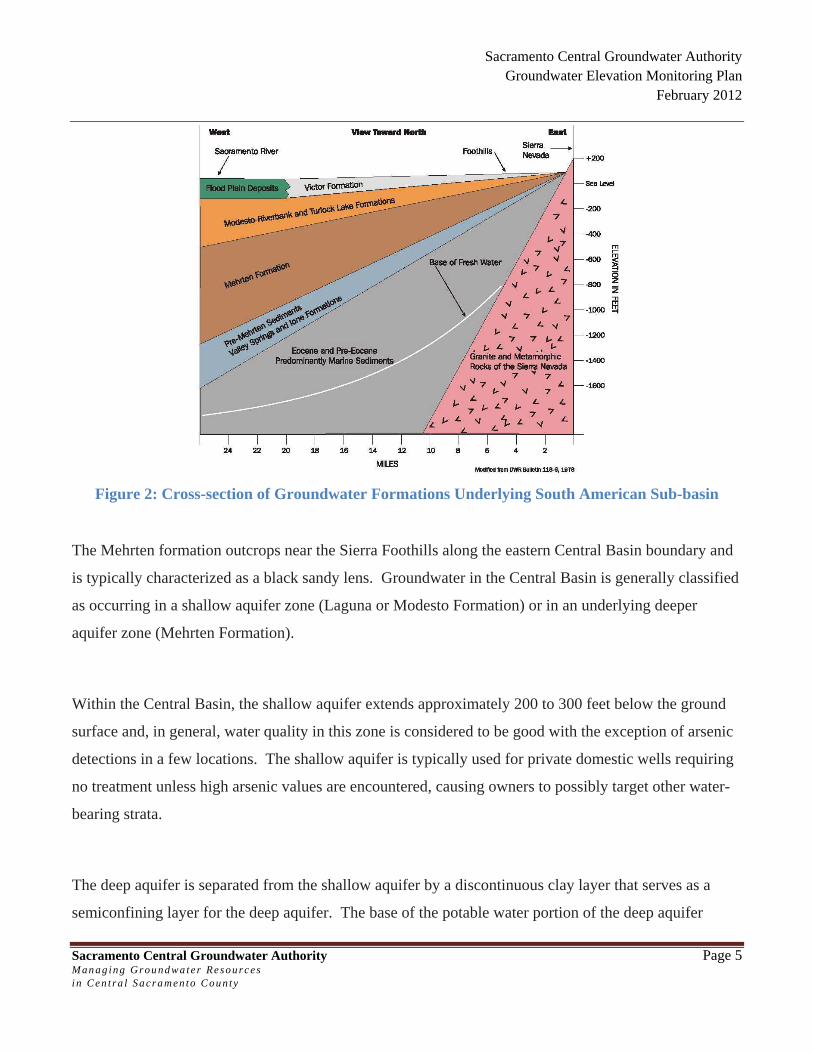
Bulletin 118-3 identifies and describes various geologic formations that constitute the water-bearing
deposits underlying Sacramento County. These formations include an upper, unconfined aquifer system
consisting of the Victor, Fair Oaks, and Laguna Formations (now known as the Modesto Formation),
and a lower, semi-confined aquifer system consisting primarily of the Mehrten Formation, known for its
fine black sands. These formations are typically composed of lenses of inter-bedded sand, silt, and clay,
interlaced with coarse-grained stream channel deposits. Figure 2 illustrates that these deposits form a
wedge that generally thickens from east to west to a maximum thickness of about 2,500 feet under the
Sacramento River.
Sacramento Central Groundwater Authority Groundwater Elevation Monitoring Plan
February 2012
Sacramento Central Groundwater Authority Page 5 M an ag ing Grou nd wa te r Resou r ces i n Ce n t ra l S a cr a m en to Cou n ty
Figure 2: Cross-section of Groundwater Formations Underlying South American Sub-basin
The Mehrten formation outcrops near the Sierra Foothills along the eastern Central Basin boundary and
is typically characterized as a black sandy lens. Groundwater in the Central Basin is generally classified
as occurring in a shallow aquifer zone (Laguna or Modesto Formation) or in an underlying deeper
aquifer zone (Mehrten Formation).
Within the Central Basin, the shallow aquifer extends approximately 200 to 300 feet below the ground
surface and, in general, water quality in this zone is considered to be good with the exception of arsenic
detections in a few locations. The shallow aquifer is typically used for private domestic wells requiring
no treatment unless high arsenic values are encountered, causing owners to possibly target other water-
bearing strata.
The deep aquifer is separated from the shallow aquifer by a discontinuous clay layer that serves as a
semiconfining layer for the deep aquifer. The base of the potable water portion of the deep aquifer
Sacramento Central Groundwater Authority Groundwater Elevation Monitoring Plan
February 2012
Sacramento Central Groundwater Authority Page 6 M an ag ing Grou nd wa te r Resou r ces i n Ce n t ra l S a cr a m en to Cou n ty
averages approximately 1,400 feet below ground surface (bgs). Water in the deep aquifer typically has
higher concentrations of total dissolved solids (TDS), iron, and manganese. Groundwater used in the
Central Basin is supplied from both the shallow and deeper aquifer systems. Older municipal wells and
all domestic wells have been constructed in the shallow aquifer zone to avoid treatment. However, the
policies and practices of the Sacramento County Water Agency (SCWA) in the Central Basin have led
to the construction of larger municipal wells that target the Mehrten Formation where higher production
rates can be achieved with less impact to private domestic wells.
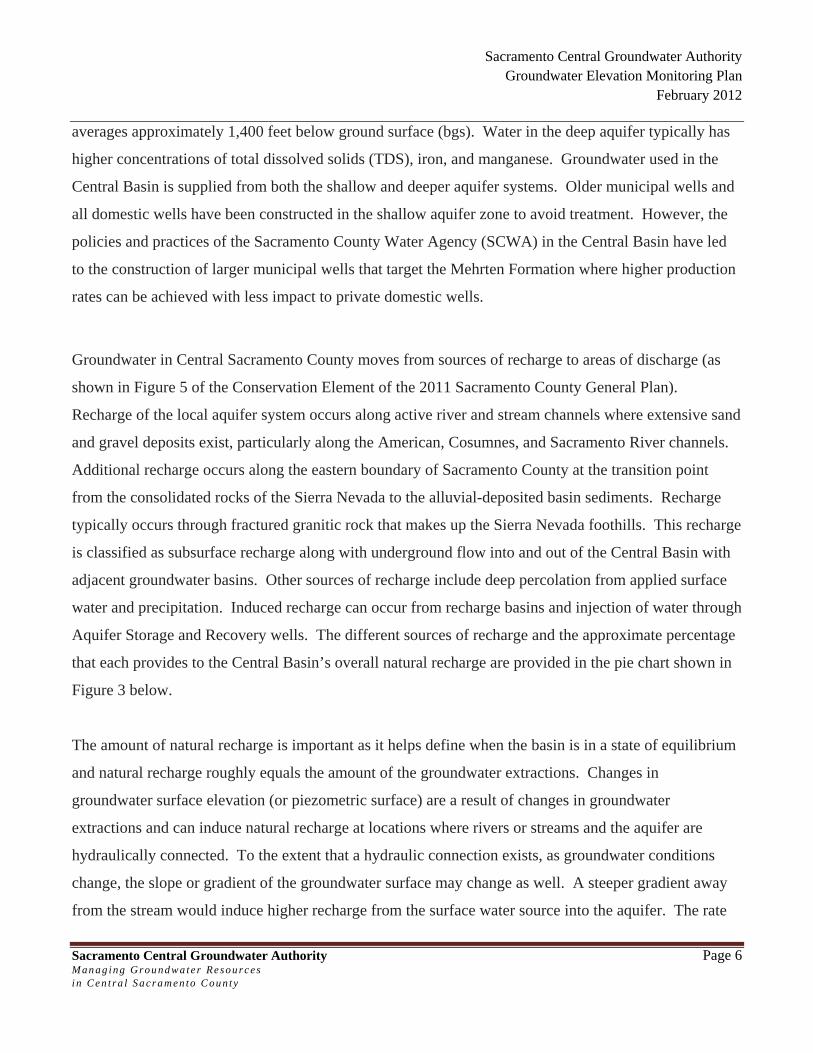
Groundwater in Central Sacramento County moves from sources of recharge to areas of discharge (as
shown in Figure 5 of the Conservation Element of the 2011 Sacramento County General Plan).
Recharge of the local aquifer system occurs along active river and stream channels where extensive sand
and gravel deposits exist, particularly along the American, Cosumnes, and Sacramento River channels.
Additional recharge occurs along the eastern boundary of Sacramento County at the transition point
from the consolidated rocks of the Sierra Nevada to the alluvial-deposited basin sediments. Recharge
typically occurs through fractured granitic rock that makes up the Sierra Nevada foothills. This recharge
is classified as subsurface recharge along with underground flow into and out of the Central Basin with
adjacent groundwater basins. Other sources of recharge include deep percolation from applied surface
water and precipitation. Induced recharge can occur from recharge basins and injection of water through
Aquifer Storage and Recovery wells. The different sources of recharge and the approximate percentage
that each provides to the Central Basin’s overall natural recharge are provided in the pie chart shown in
Figure 3 below.
The amount of natural recharge is important as it helps define when the basin is in a state of equilibrium
and natural recharge roughly equals the amount of the groundwater extractions. Changes in
groundwater surface elevation (or piezometric surface) are a result of changes in groundwater
extractions and can induce natural recharge at locations where rivers or streams and the aquifer are
hydraulically connected. To the extent that a hydraulic connection exists, as groundwater conditions
change, the slope or gradient of the groundwater surface may change as well. A steeper gradient away
from the stream would induce higher recharge from the surface water source into the aquifer. The rate
Sacramento Central Groundwater Authority Groundwater Elevation Monitoring Plan
February 2012
Sacramento Central Groundwater Authority Page 7 M an ag ing Grou nd wa te r Resou r ces i n Ce n t ra l S a cr a m en to Cou n ty
of recharge from streams or rivers that are hydraulically disconnected from the groundwater surface is
indifferent to changes in groundwater elevations or gradient. This is typically true with smaller streams
where the groundwater surface is located far below the streambed. In such cases, surface water
percolates through the unsaturated zone to the groundwater and its rate is a function of the aquifer
materials underlying the streambed and the water level in the surface stream. The rate of infiltration
under these conditions is not controlled by the change in elevation of the underlying groundwater. In the
case of larger rivers, the American and Sacramento rivers are considered to be hydraulically connected
and the Cosumnes River is considered to be hydraulically disconnected in the lower reaches of the river
that flow through the Central Basin.
Figure 3: Sources of Groundwater Recharge
3.0 History of Monitoring
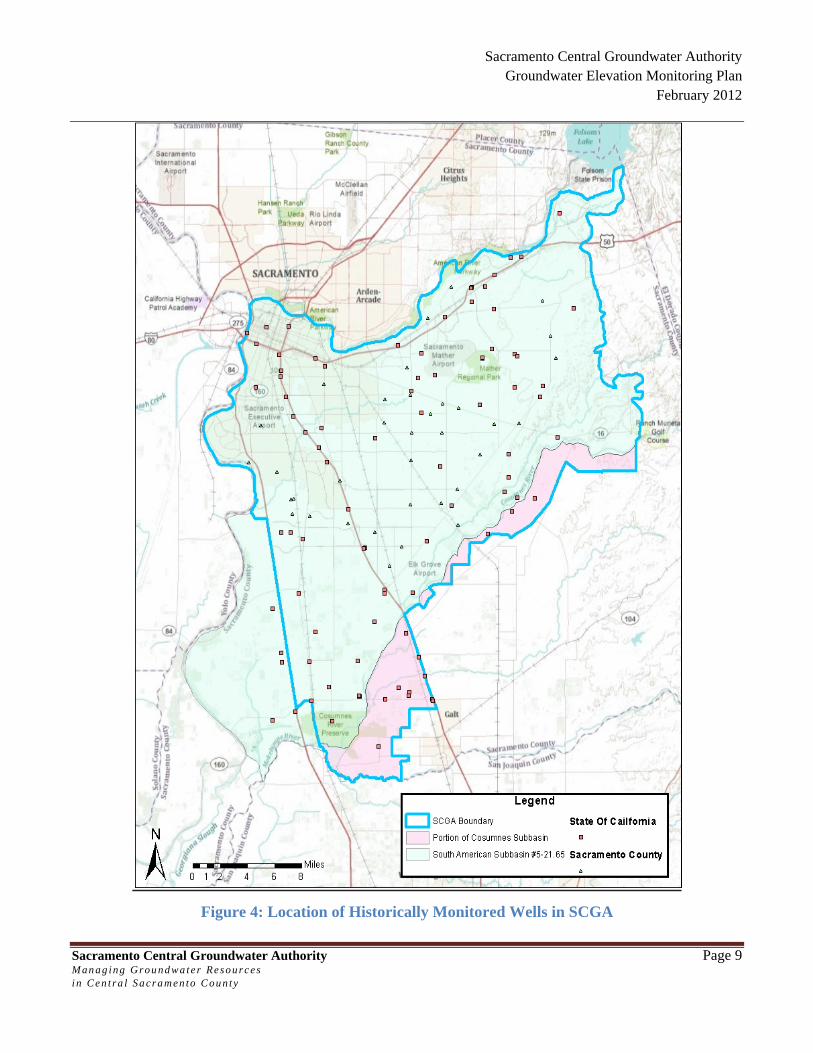
Beginning in the 1950’s, DWR and SCWA have a cooperated on a program that collects semiannual
(spring and fall) groundwater level data from more than 120 wells within the South American and
Cosumnes Sub-basins. Historically, SCWA has collected and reported groundwater elevation data for
as many as sixty of those wells, however, because wells have been added and dropped from the program
over time, the number currently stands at forty one wells (Figure 4).
Sacramento Central Groundwater Authority Groundwater Elevation Monitoring Plan
February 2012
Sacramento Central Groundwater Authority Page 8 M an ag ing Grou nd wa te r Resou r ces i n Ce n t ra l S a cr a m en to Cou n ty
Data collected from these wells show that groundwater elevations generally declined consistently from
the 1950s and 1960s to about 1980 on the order of 20 to 30 feet. From 1980 through 1983, water levels
recovered by about 10 feet and remained stable until the beginning of the 1987 through 1992 drought.
From 1987 until 1995, water levels declined by about 15 feet. From 1995 to 2003 most water levels
recovered generally higher than levels prior to the 1987 through 1992 drought. Much of this recovery
can be attributed to the increased use of surface water in the Central Basin, and the fallowing of
previously irrigated agricultural lands transitioning into new urban development areas in accordance
with the Sacramento County and City of Elk Grove General Plans.
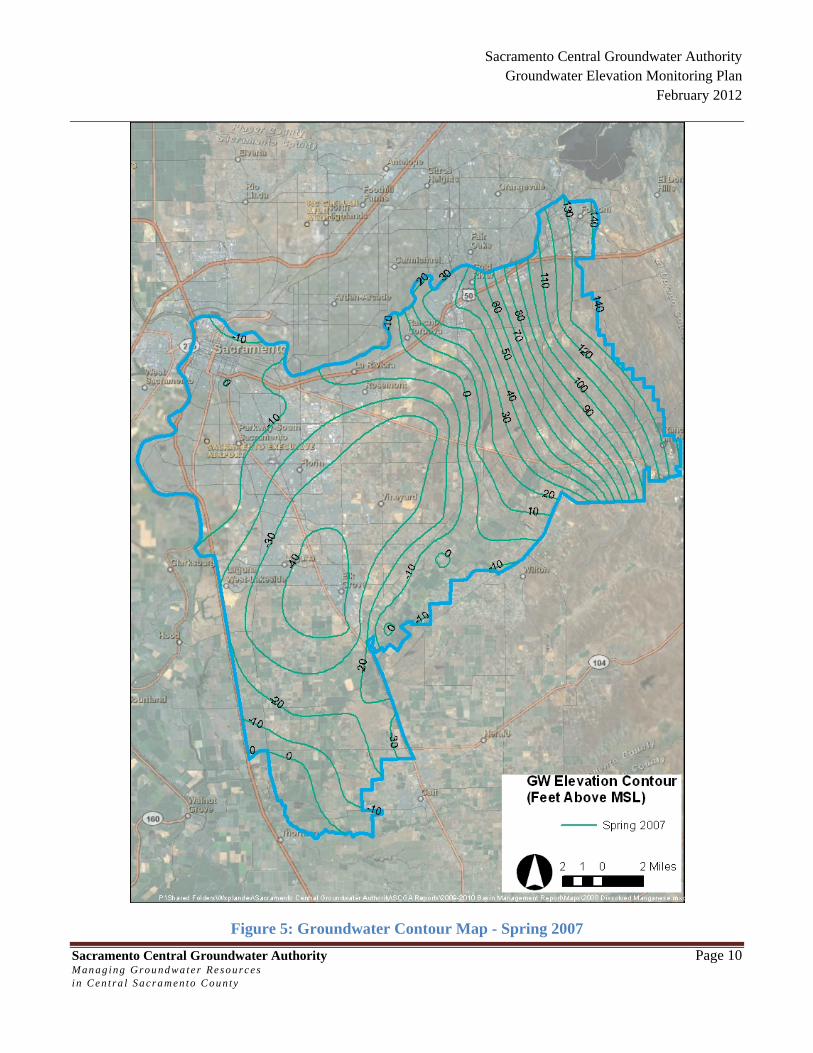
Data collected from these wells has also been used by SCWA staff to generate biannual, spring and fall,
groundwater contour maps. As early as 1968, pumping depressions were evident in the Central Basin.
These depressions have grown and coalesced into a single cone of depression centered in the southern
portion of the South American Sub-basin area, as shown in Spring 2007 (Figure 5) and (Fall 2007
(Figure 6) contour maps. The map contours were determined using the Inverse Distance to a Power
method. Fluctuations in regional cones of depression are measured over years and result from (1)
changes in recharge and (2) changes in extractions from increasing and decreasing water demands. For
example, a sequence of successive dry years can decrease the amount of natural recharge to the aquifer.
If this is coupled with a coinciding increase in groundwater extraction, an imbalance is created between
natural recharge and extractions. Consequently, groundwater elevations would decrease in response to
this imbalance. Over time, the shape and location of the aquifer’s regional cone of depression
fluctuates. Intensive use of the groundwater basin has resulted in a general lowering of groundwater
elevations near the center (or centroid) of the basin away from the sources of recharge.
Sacramento Central Groundwater Authority Groundwater Elevation Monitoring Plan
February 2012
Sacramento Central Groundwater Authority Page 9 M an ag ing Grou nd wa te r Resou r ces i n Ce n t ra l S a cr a m en to Cou n ty
Figure 4: Location of Historically Monitored Wells in SCGA
Sacramento Central Groundwater Authority Groundwater Elevation Monitoring Plan
February 2012
Sacramento Central Groundwater Authority Page 10 M an ag ing Grou nd wa te r Resou r ces i n Ce n t ra l S a cr a m en to Cou n ty
Figure 5: Groundwater Contour Map - Spring 2007

Sacramento Central Groundwater Authority Groundwater Elevation Monitoring Plan
February 2012
Sacramento Central Groundwater Authority Page 11 M an ag ing Grou nd wa te r Resou r ces i n Ce n t ra l S a cr a m en to Cou n ty
Figure 6: Groundwater Contour Map Fall 2007
Sacramento Central Groundwater Authority Groundwater Elevation Monitoring Plan
February 2012
Sacramento Central Groundwater Authority Page 12 M an ag ing Grou nd wa te r Resou r ces i n Ce n t ra l S a cr a m en to Cou n ty
4.0 Monitoring Sites and Timing
4.1 SCGA Monitoring Well Network Design
The SCGA well monitoring network consists of monitoring wells that have historically been monitored
by SCWA and reported to the DWR Water Data Library as discussed above. The monitoring network
under CASGEM will represent the continuation of 50 plus years of historical record and will allow for
the contiguous analysis of specific hydrographs, generation of ground water contour maps, and tracking
of the regional cone of depression.
4.2 Current Wells
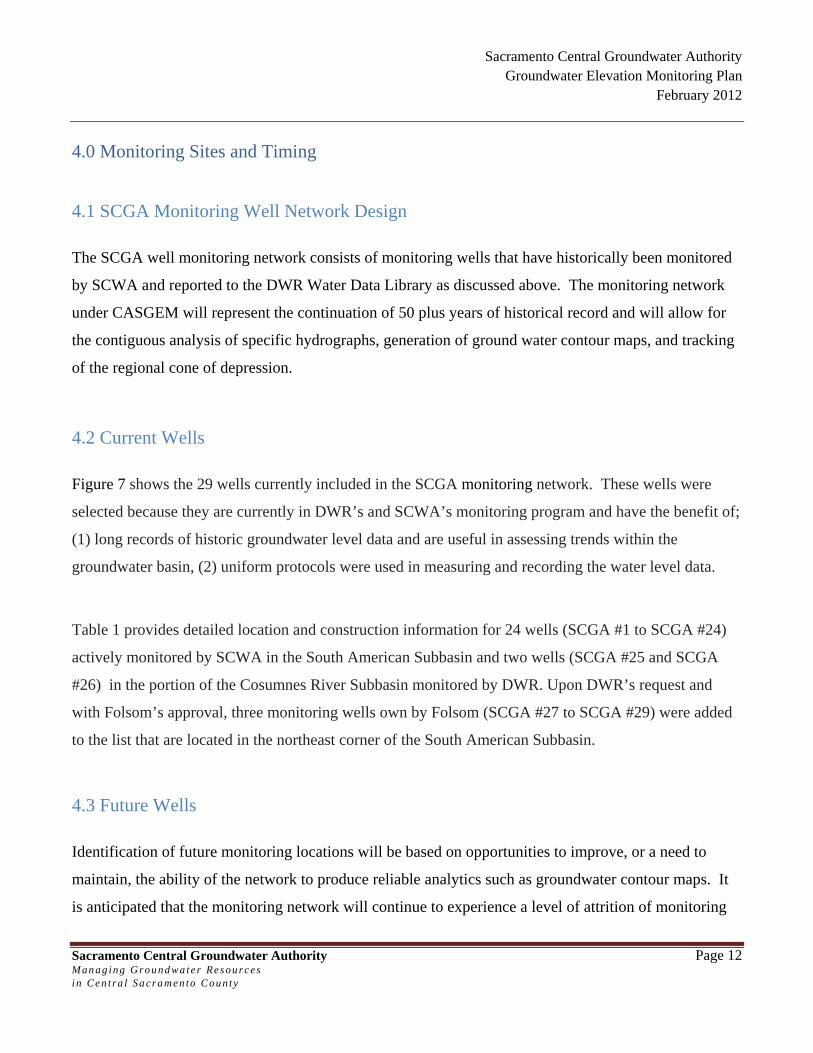
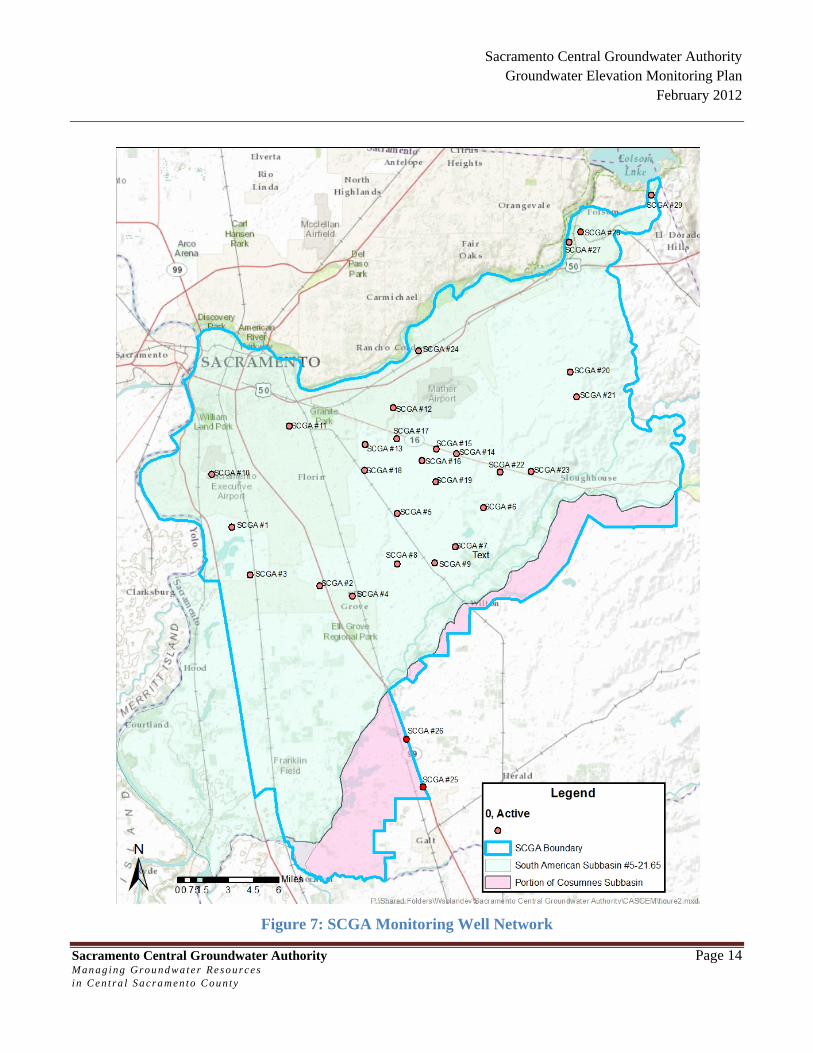
Figure 7 shows the 29 wells currently included in the SCGA monitoring network. These wells were
selected because they are currently in DWR’s and SCWA’s monitoring program and have the benefit of;
(1) long records of historic groundwater level data and are useful in assessing trends within the
groundwater basin, (2) uniform protocols were used in measuring and recording the water level data.
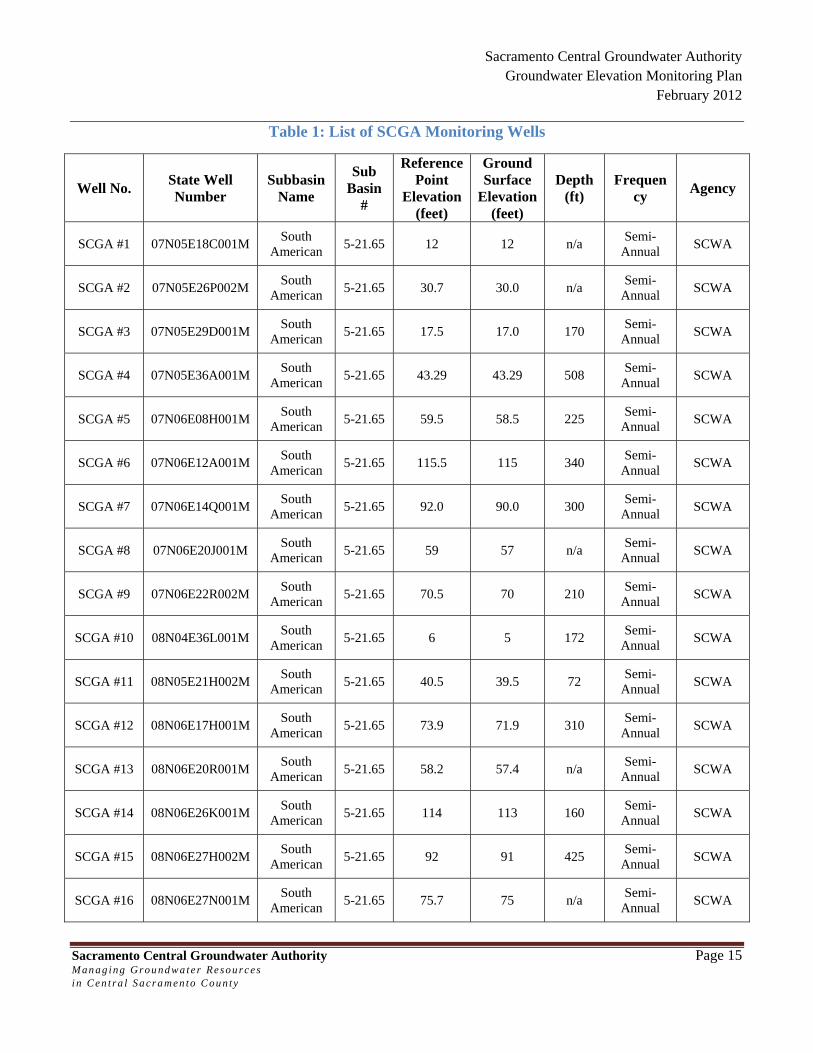
Table 1 provides detailed location and construction information for 24 wells (SCGA #1 to SCGA #24)
actively monitored by SCWA in the South American Subbasin and two wells (SCGA #25 and SCGA
#26) in the portion of the Cosumnes River Subbasin monitored by DWR. Upon DWR’s request and
with Folsom’s approval, three monitoring wells own by Folsom (SCGA #27 to SCGA #29) were added
to the list that are located in the northeast corner of the South American Subbasin.
4.3 Future Wells
Identification of future monitoring locations will be based on opportunities to improve, or a need to
maintain, the ability of the network to produce reliable analytics such as groundwater contour maps. It
is anticipated that the monitoring network will continue to experience a level of attrition of monitoring
Sacramento Central Groundwater Authority Groundwater Elevation Monitoring Plan
February 2012
Sacramento Central Groundwater Authority Page 13 M an ag ing Grou nd wa te r Resou r ces i n Ce n t ra l S a cr a m en to Cou n ty
locations due to various factors such as development. SCGA will coordinate with its member agencies
along with other local agencies and State DWR to identify opportunities to secure dedicated, long-term
monitoring locations.
4.4 Data Gaps
Over time the monitoring network has experienced a level of attrition due to development, change in
condition of monitoring location or well, lack of access, and other factors. As a result, a number of
monitoring locations have been lost without replacement. To date, the loss of these locations has not
significantly impacted the ability to accurately track and analyze the behavior of the groundwater table
in the sub-basin. However, it is anticipated that the attrition of monitoring locations will continue in the
future with the possibility of an impact to the effective tracking and analysis of the groundwater table.
Potential constraints to filling gaps in the monitoring network are areas subject to dense urban
development under built-out conditions such as certain areas within the City of Elk Grove or areas of
planned development in unincorporated Sacramento County. High levels of development make the
acquisition of property for monitoring well construction or the granting of easements or right-of-way for
access to monitoring locales unfeasible in many cases.
Likewise, rural areas with limited to no infrastructure can serve as possible constraints to filling data
gaps. Such areas are mainly located on the far western portion of the sub-basin, in what is the delta
region of the Sacramento River system, and the far eastern portion of the sub-basin occupying the low
Sierra Nevada foothills. Logistics and environmental sensitivity issues are the primary constraints in
these areas.
Sacramento Central Groundwater Authority Groundwater Elevation Monitoring Plan
February 2012
Sacramento Central Groundwater Authority Page 14 M an ag ing Grou nd wa te r Resou r ces i n Ce n t ra l S a cr a m en to Cou n ty
Figure 7: SCGA Monitoring Well Network
Sacramento Central Groundwater Authority Groundwater Elevation Monitoring Plan
February 2012
Sacramento Central Groundwater Authority Page 15 M an ag ing Grou nd wa te r Resou r ces i n Ce n t ra l S a cr a m en to Cou n ty
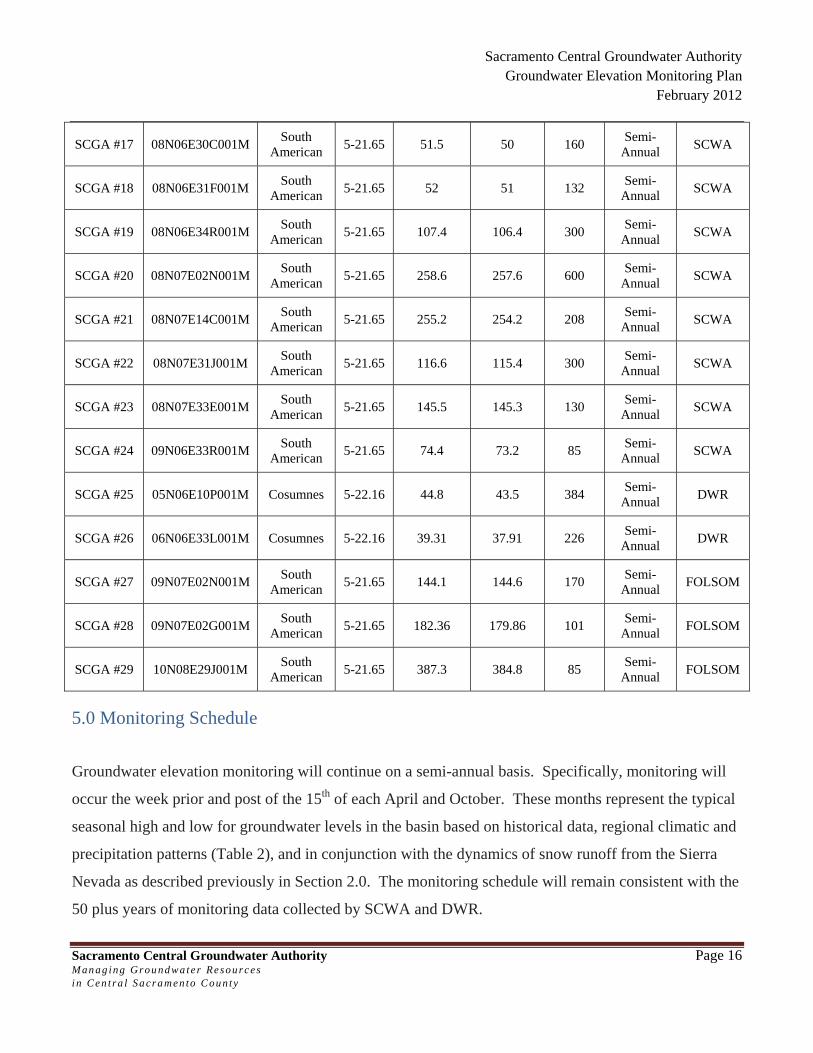
Table 1: List of SCGA Monitoring Wells
Well No. State Well Number
Subbasin Name
Sub Basin
#
Reference Point
Elevation (feet)
Ground Surface
Elevation (feet)
Depth (ft)
Frequency
Agency
SCGA #1 07N05E18C001M South
American 5-21.65 12 12 n/a
Semi-Annual
SCWA
SCGA #2 07N05E26P002M South
American 5-21.65 30.7 30.0 n/a
Semi-Annual
SCWA
SCGA #3 07N05E29D001M South
American 5-21.65 17.5 17.0 170
Semi-Annual
SCWA
SCGA #4 07N05E36A001M South
American 5-21.65 43.29 43.29 508
Semi-Annual
SCWA
SCGA #5 07N06E08H001M South
American 5-21.65 59.5 58.5 225
Semi-Annual
SCWA
SCGA #6 07N06E12A001M South
American 5-21.65 115.5 115 340
Semi-Annual
SCWA
SCGA #7 07N06E14Q001M South
American 5-21.65 92.0 90.0 300
Semi-Annual
SCWA
SCGA #8 07N06E20J001M South
American 5-21.65 59 57 n/a
Semi-Annual
SCWA
SCGA #9 07N06E22R002M South
American 5-21.65 70.5 70 210
Semi-Annual
SCWA
SCGA #10 08N04E36L001M South
American 5-21.65 6 5 172
Semi-Annual
SCWA
SCGA #11 08N05E21H002M South
American 5-21.65 40.5 39.5 72
Semi-Annual
SCWA
SCGA #12 08N06E17H001M South
American 5-21.65 73.9 71.9 310
Semi-Annual
SCWA
SCGA #13 08N06E20R001M South
American 5-21.65 58.2 57.4 n/a
Semi-Annual
SCWA
SCGA #14 08N06E26K001M South
American 5-21.65 114 113 160
Semi-Annual
SCWA
SCGA #15 08N06E27H002M South
American 5-21.65 92 91 425
Semi-Annual
SCWA
SCGA #16 08N06E27N001M South
American 5-21.65 75.7 75 n/a
Semi-Annual
SCWA
Sacramento Central Groundwater Authority Groundwater Elevation Monitoring Plan
February 2012
Sacramento Central Groundwater Authority Page 16 M an ag ing Grou nd wa te r Resou r ces i n Ce n t ra l S a cr a m en to Cou n ty
SCGA #17 08N06E30C001M South
American 5-21.65 51.5 50 160
Semi-Annual
SCWA
SCGA #18 08N06E31F001M South
American 5-21.65 52 51 132
Semi-Annual
SCWA
SCGA #19 08N06E34R001M South
American 5-21.65 107.4 106.4 300
Semi-Annual
SCWA
SCGA #20 08N07E02N001M South
American 5-21.65 258.6 257.6 600
Semi-Annual
SCWA
SCGA #21 08N07E14C001M South
American 5-21.65 255.2 254.2 208
Semi-Annual
SCWA
SCGA #22 08N07E31J001M South
American 5-21.65 116.6 115.4 300
Semi-Annual
SCWA
SCGA #23 08N07E33E001M South
American 5-21.65 145.5 145.3 130
Semi-Annual
SCWA
SCGA #24 09N06E33R001M South
American 5-21.65 74.4 73.2 85
Semi-Annual
SCWA
SCGA #25 05N06E10P001M Cosumnes 5-22.16 44.8 43.5 384 Semi-
Annual DWR
SCGA #26 06N06E33L001M Cosumnes 5-22.16 39.31 37.91 226 Semi-
Annual DWR
SCGA #27 09N07E02N001M South
American 5-21.65 144.1 144.6 170
Semi-Annual
FOLSOM
SCGA #28 09N07E02G001M South
American 5-21.65 182.36 179.86 101
Semi-Annual
FOLSOM
SCGA #29 10N08E29J001M South
American 5-21.65 387.3 384.8 85
Semi-Annual
FOLSOM
5.0 Monitoring Schedule
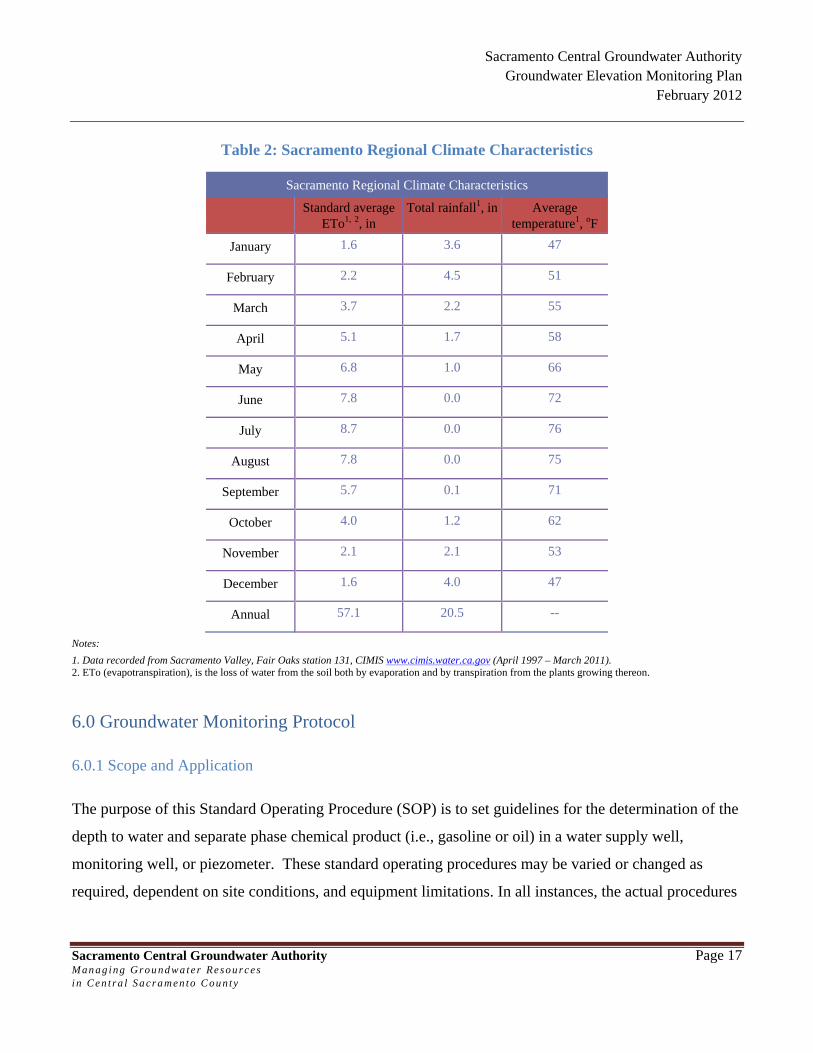
Groundwater elevation monitoring will continue on a semi-annual basis. Specifically, monitoring will
occur the week prior and post of the 15th of each April and October. These months represent the typical
seasonal high and low for groundwater levels in the basin based on historical data, regional climatic and
precipitation patterns (Table 2), and in conjunction with the dynamics of snow runoff from the Sierra
Nevada as described previously in Section 2.0. The monitoring schedule will remain consistent with the
50 plus years of monitoring data collected by SCWA and DWR.
Sacramento Central Groundwater Authority Groundwater Elevation Monitoring Plan
February 2012
Sacramento Central Groundwater Authority Page 17 M an ag ing Grou nd wa te r Resou r ces i n Ce n t ra l S a cr a m en to Cou n ty
Table 2: Sacramento Regional Climate Characteristics
Sacramento Regional Climate Characteristics
Standard average ETo1, 2, in
Total rainfall1, in Average temperature1, oF
January 1.6 3.6 47
February 2.2 4.5 51
March 3.7 2.2 55
April 5.1 1.7 58
May 6.8 1.0 66
June 7.8 0.0 72
July 8.7 0.0 76
August 7.8 0.0 75
September 5.7 0.1 71
October 4.0 1.2 62
November 2.1 2.1 53
December 1.6 4.0 47
Annual 57.1 20.5 --
Notes:
1. Data recorded from Sacramento Valley, Fair Oaks station 131, CIMIS www.cimis.water.ca.gov (April 1997 – March 2011). 2. ETo (evapotranspiration), is the loss of water from the soil both by evaporation and by transpiration from the plants growing thereon.
6.0 Groundwater Monitoring Protocol
6.0.1 Scope and Application
The purpose of this Standard Operating Procedure (SOP) is to set guidelines for the determination of the
depth to water and separate phase chemical product (i.e., gasoline or oil) in a water supply well,
monitoring well, or piezometer. These standard operating procedures may be varied or changed as
required, dependent on site conditions, and equipment limitations. In all instances, the actual procedures

Sacramento Central Groundwater Authority Groundwater Elevation Monitoring Plan
February 2012
Sacramento Central Groundwater Authority Page 18 M an ag ing Grou nd wa te r Resou r ces i n Ce n t ra l S a cr a m en to Cou n ty
employed will be documented and described on the field form. Mention of trade names or commercial
products does not constitute endorsement or recommendation for use.
Generally, water-level measurements taken in piezometers, or wells are used to construct water table or
potentiometric surface maps and to determine flow direction as well as other aquifer characteristics.
Therefore, all water level measurements in a given district should preferably be collected within a 24-
hour period and SCWA’s Zone 40 area within one week. However, certain situations may produce
rapidly changing groundwater levels that necessitate taking measurements as close in time as possible.
Large changes in water levels among wells may be indicative of such a condition. Rapid groundwater
level changes may occur due to:
• Atmospheric pressure changes
• Changes in river stage, impoundments levels, or flow in unlined ditches
• Pumping of nearby wells
• Precipitation
• Tidal influences
6.0.2 Method Summary
A survey mark should be placed on the top of the riser pipe or casing as a reference point for
groundwater level measurements. If the lip of the riser pipe is not flat, the reference point may be
located on the grout apron or the top of the outer protective casing (if present). The measurement
reference point should be documented on the groundwater level data form. All field personnel must be
made aware of the measurement reference point being used in order to ensure the collection of
comparable data.
Before measurements are made, water levels in piezometers and monitor wells should be allowed to
stabilize for a minimum of 24 hours after well construction and development. Measurements in water
supply wells need to be noted as questionable if pumping has or is occurring. In low yield situations,
recovery of water levels to equilibrium may take longer. All measurements should be made as
Sacramento Central Groundwater Authority Groundwater Elevation Monitoring Plan
February 2012
Sacramento Central Groundwater Authority Page 19 M an ag ing Grou nd wa te r Resou r ces i n Ce n t ra l S a cr a m en to Cou n ty
accurately as possible, with a minimum accuracy of 0.1 feet. Future measurements may have to be more
accurate (measurements to the nearest 0.01 foot may be needed for conjunctive use projects, etc.).
Ideally, the minimum measurement accuracy is 0.1 feet and the recommended accuracy is 0.01 feet. If
there is reason to suspect groundwater contamination, water level measuring equipment must be
decontaminated and, in general, measurements should proceed from the least to the most contaminated
wells.
This SOP assumes an absence of contamination and no need for air monitoring or decontamination.
Open the well and monitor the headspace with the appropriate air-monitoring instrument if the presence
of volatile organic compounds is suspected. For electrical sounders lower the device into the well until
the water surface is reached as indicated by a tone or meter deflection. Record the distance from the
water surface to the reference point. Measurement with a chalked tape will necessitate lowering the tape
below the water level and holding a convenient foot marker at the reference point. Record both the water
level as indicated on the chalked tape section and the depth mark held at the reference point. The depth
to water is the difference between the two readings. Remove measuring device, replace riser pipe cap,
and decontaminate equipment as necessary. Note that if a separate phase is present, an oil/water
indicator probe is required for measurement of product thickness and water level.
6.0.3 Potential Problems
1. Cascading water, particularly in open-hole or rock wells, may interfere with the measurement.
2. Some older types of electric sounders are only marked at five-foot intervals. A surveyor’s tape is
necessary to extrapolate between the 5-foot marks.
3. Oil or other product floating on the water column can insulate the contacts of the probe on an
electric sounder and give false readings. For accurate level measurements in wells containing
floating product, a special oil/water level indicator is required, and the corrected water level must
be calculated.
4. Tapes (electrical or surveyor’s) may have damaged or missing sections, or may be spliced
inaccurately.
Sacramento Central Groundwater Authority Groundwater Elevation Monitoring Plan
February 2012
Sacramento Central Groundwater Authority Page 20 M an ag ing Grou nd wa te r Resou r ces i n Ce n t ra l S a cr a m en to Cou n ty
5. An air line may be the only available means to make measurements in sealed production wells
but the method is generally accurate only to approximately 0.2 foot.
6. When using a steel tape, it is necessary to lower the tape below the water level in order to make a
measurement. This assumes knowledge of the approximate groundwater level.
6.0.4 Equipment
The electric water level indicator and the chalked steel tape are the devices commonly used to measure
water levels. Both have an accuracy of 0.01 feet. Other field equipment may include:
• Air monitoring instrumentation
• Well depth measurement device (sounder)
• Chalk
• Ruler
• Site logbook
• Paper towels and trash bags
• Decontamination supplies (assumed unnecessary)
• Groundwater level data forms
6.0.5 Field Method Procedures
Preparation
1. Determine the number of measurements needed, the methods to be employed, and the equipment and
supplies needed.
2. Decontaminate or pre-clean equipment, and ensure that it is in working order.
3. Coordinate schedule with staff and regulatory agency, if appropriate.
4. If this is an initial visit, perform a general site survey prior to site entry in accordance with a current
approved site specific Health and Safety Plan (id applicable).
5. Identify measurement locations.

Sacramento Central Groundwater Authority Groundwater Elevation Monitoring Plan
February 2012
Sacramento Central Groundwater Authority Page 21 M an ag ing Grou nd wa te r Resou r ces i n Ce n t ra l S a cr a m en to Cou n ty
Procedures
Procedures for determining water levels are as follows:
1. If possible, and when applicable, start at those wells that are least contaminated and proceed
to those wells that are most contaminated.
2. Rinse all the equipment entering the well.
3. Remove locking well cap, note well ID, time of day, and date on the groundwater level data
form.
4. Remove well cap.
5. If required by site-specific condition, monitor headspace of well with a photoionization
detector (PID) or flame ionization detector (FID) to determine presence of volatile organic
compounds, and record results in logbook.
6. Lower water-level measuring device into the well. Electrical tapes are lowered to the water
surface whereas chalked steel tapes are lowered generally a foot or more below the water
surface. Steel tapes are generally chalked so that a 1-to 5-foot long section will fall below
the expected water level.
7. For electrical tapes record the distance from the water surface, as determined by the audio
signal or meter, to the reference measuring point and record. For chalked tapes, an even foot
mark is held at the reference point, once the chalked section of the tape is below the water
level. Both the water level on the tape and the foot mark held at the reference point is
recorded. The depth to the water is then the difference between the two readings. In
addition, note the reference point used (top of the outer casing, top of the riser pipe, ground
surface, or some other reproducible position on the well head). Repeat the measurement.
8. Remove all downhole equipment, replace well cap and locking steel caps.
9. Rinse all downhole equipment and store for transport to the next well.
10. Note any physical changes, such as erosion or cracks in protective concrete pad or
11. Note any physical changes, such as erosion or cracks in protective concrete pad or variation
in total depth of well on groundwater level data form.
Sacramento Central Groundwater Authority Groundwater Elevation Monitoring Plan
February 2012
Sacramento Central Groundwater Authority Page 22 M an ag ing Grou nd wa te r Resou r ces i n Ce n t ra l S a cr a m en to Cou n ty
6.0.6 Calculations
To determine groundwater elevation above mean sea level, use the following equation:
Ew = E - D
where:
EW = Elevation of water above mean sea level (feet) or local datum
E = Elevation above sea level or local datum at point of measurement (feet)
D = Depth to water (feet)
6.0.7 Quality Assurance/Quality Control
The following general quality assurance/quality control (QA/QC) procedures apply:
1. All data must be documented on the groundwater level data forms.
2. All instrumentation must be operated in accordance with operating instructions as supplied
by the manufacturer, unless otherwise specified.
3. Each well should be tested at least twice in order to compare results. If results do not agree
to within 0.02 feet, a third measurement should be taken and the readings averaged.
Consistent failure of consecutive readings to agree suggests that levels are changing because
of one or more conditions as indicated in Section 1, and should be noted on the field form.
4. Results should be compared to historical measurements while in the field and significant
discrepancies noted and resolved if possible.
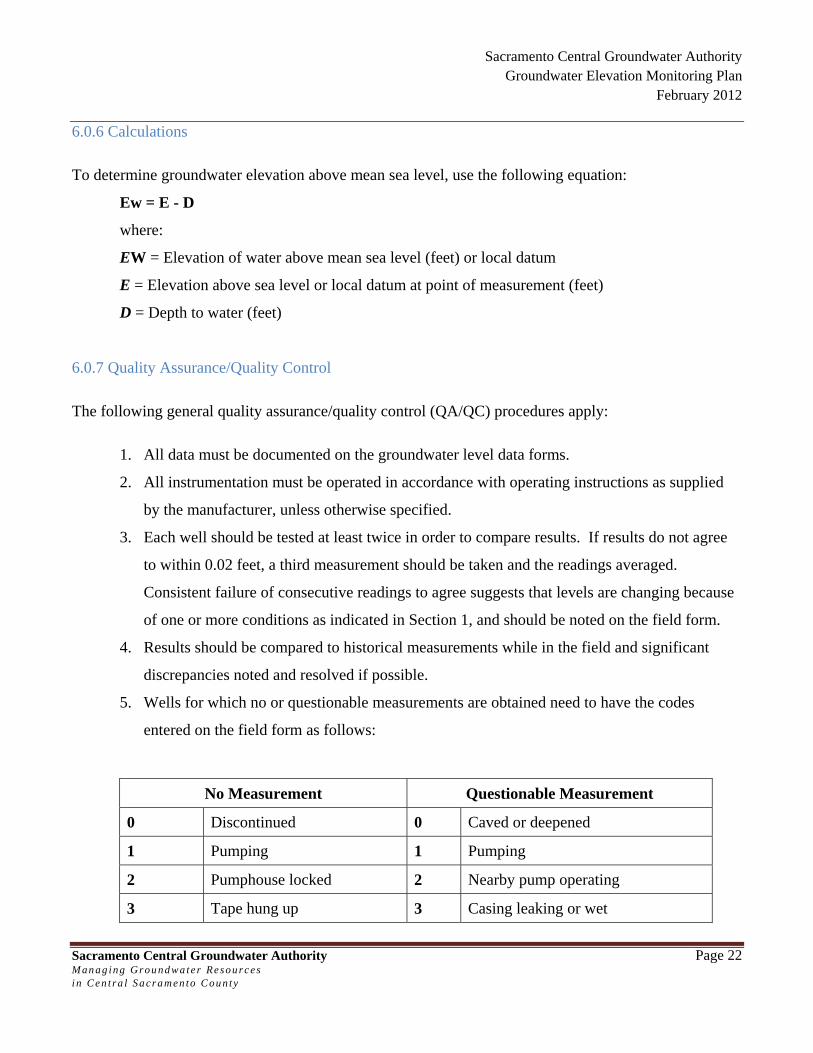
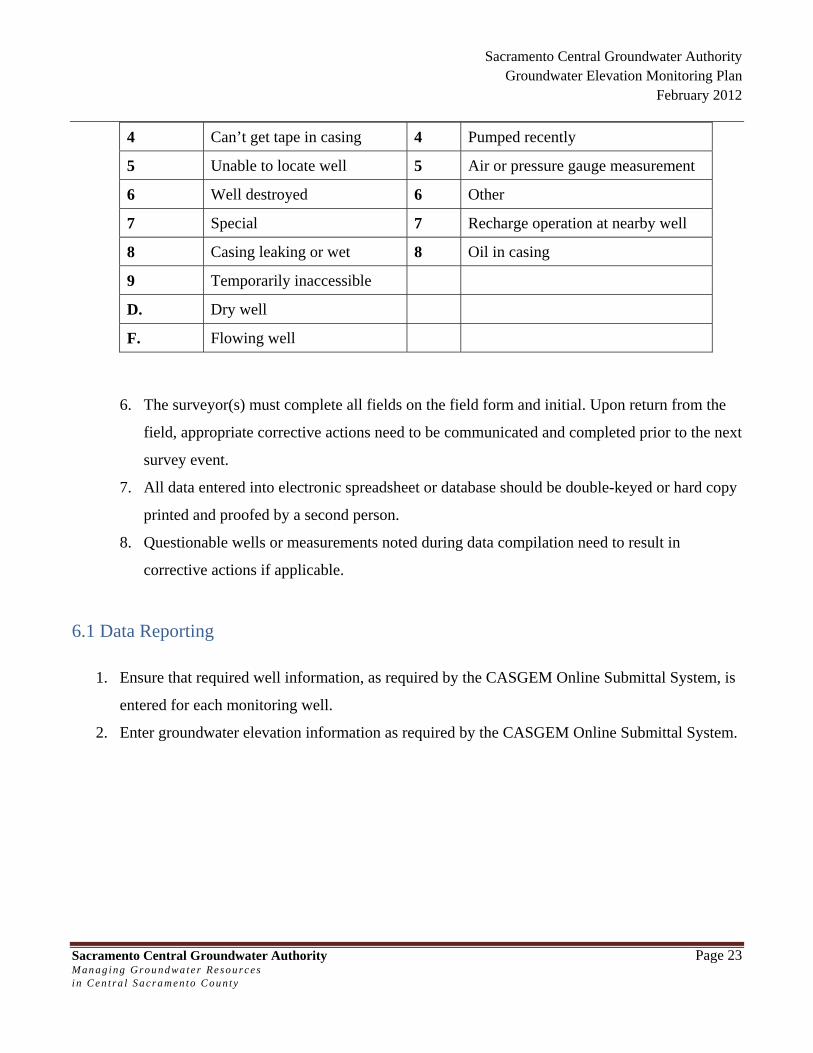
5. Wells for which no or questionable measurements are obtained need to have the codes
entered on the field form as follows:
No Measurement Questionable Measurement
0 Discontinued 0 Caved or deepened
1 Pumping 1 Pumping
2 Pumphouse locked 2 Nearby pump operating
3 Tape hung up 3 Casing leaking or wet
Sacramento Central Groundwater Authority Groundwater Elevation Monitoring Plan
February 2012
Sacramento Central Groundwater Authority Page 23 M an ag ing Grou nd wa te r Resou r ces i n Ce n t ra l S a cr a m en to Cou n ty
4 Can’t get tape in casing 4 Pumped recently
5 Unable to locate well 5 Air or pressure gauge measurement
6 Well destroyed 6 Other
7 Special 7 Recharge operation at nearby well
8 Casing leaking or wet 8 Oil in casing
9 Temporarily inaccessible
D. Dry well
F. Flowing well
6. The surveyor(s) must complete all fields on the field form and initial. Upon return from the
field, appropriate corrective actions need to be communicated and completed prior to the next
survey event.
7. All data entered into electronic spreadsheet or database should be double-keyed or hard copy
printed and proofed by a second person.
8. Questionable wells or measurements noted during data compilation need to result in
corrective actions if applicable.
6.1 Data Reporting
1. Ensure that required well information, as required by the CASGEM Online Submittal System, is
entered for each monitoring well.
2. Enter groundwater elevation information as required by the CASGEM Online Submittal System.