s hso + so
TRANSCRIPT
-15-
Determination of the pH of sea water using the indicator dye m-cresol purple
1. Scope and field of application
This procedure describes a method for the spectrophotometric determination of the pH
of sea water on the total hydrogen ion concentration pH scale. The total hydrogen ion concentration, [H�], is expressed as moles per kilogram of sea water.
2. Definition
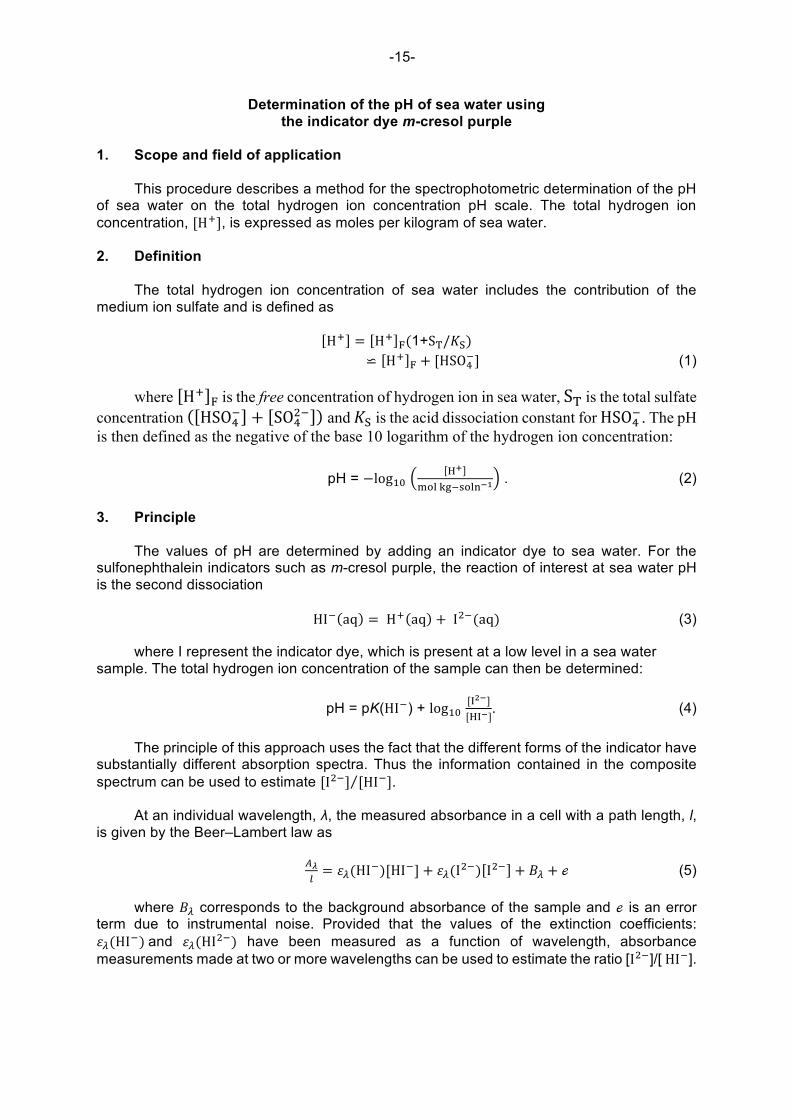
The total hydrogen ion concentration of sea water includes the contribution of the
medium ion sulfate and is defined as
H� = H� �(1+S�/𝐾𝐾�) ⋍ H� � + [HSO��] (1)
where H� � is the free concentration of hydrogen ion in sea water, S� is the total sulfate concentration HSO�
� + SO��� and 𝐾𝐾� is the acid dissociation constant for HSO�
�. The pH is then defined as the negative of the base 10 logarithm of the hydrogen ion concentration:
pH = −log�� ��
������������ . (2)
3. Principle The values of pH are determined by adding an indicator dye to sea water. For the
sulfonephthalein indicators such as m-cresol purple, the reaction of interest at sea water pH is the second dissociation
HI� aq = H� aq + I��(aq) (3)
where I represent the indicator dye, which is present at a low level in a sea water sample. The total hydrogen ion concentration of the sample can then be determined:
pH = pK(HI�) + log�� [�
��][���]. (4)
The principle of this approach uses the fact that the different forms of the indicator have substantially different absorption spectra. Thus the information contained in the composite spectrum can be used to estimate [I��] [HI�].
At an individual wavelength, λ, the measured absorbance in a cell with a path length, l,
is given by the Beer–Lambert law as
��� = 𝜀𝜀�(HI�)[HI�] + 𝜀𝜀�(I��) I�� + 𝐵𝐵� + ℯ (5)
where 𝐵𝐵� corresponds to the background absorbance of the sample and ℯ is an error term due to instrumental noise. Provided that the values of the extinction coefficients: 𝜀𝜀�(HI�)and 𝜀𝜀�(HI��) have been measured as a function of wavelength, absorbance measurements made at two or more wavelengths can be used to estimate the ratio [I��]/[HI�].
-16-
In the case that only two wavelengths are used, and provided that the background can be eliminated effectively by a subtractive procedure, (5) can be rearranged to give (assuming no instrumental error)
[���][���] =
�� �����(���)/��(���)��(���)/��(���)�(�� ��)��(���)/��(���) (6)
where the numbers 1 and 2 refer to the wavelengths chosen. For the best sensitivity,
the wavelengths corresponding to the absorbance maxima of the base (I��) and acid (HI�) forms, respectively, are used. The various terms ε are the extinction
coefficients of the specified species at wavelengths 1 and 2, respectively.
4. Apparatus 4.1 Flexible drawing tube
Approximately 40 cm long, sized to fit snugly over cell port. Silicone rubber is suitable
for this.
4.2 Spectrophotometric cells These should be made of optical glass with a 10 cm path-length, two ports and
polytetrafluoroethylene (Teflon®) stoppers. A sufficient number of cells are needed to collect all the samples that will be analyzed from a particular cast (see section 6).
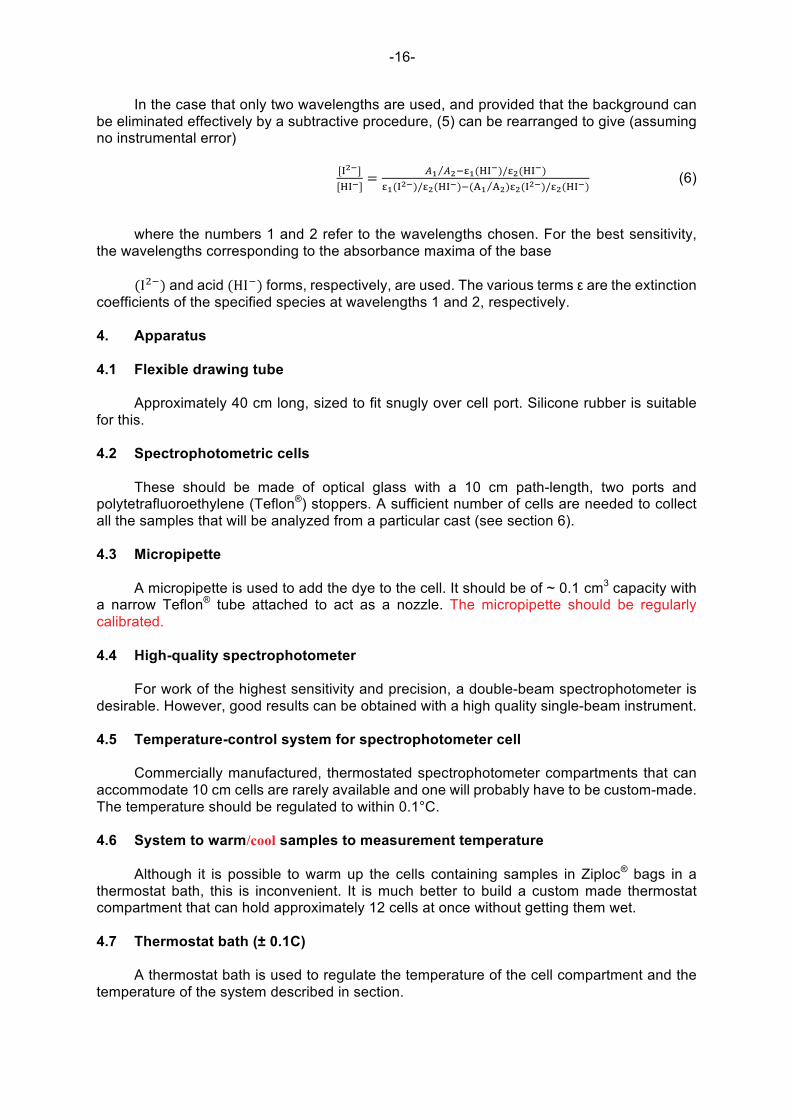
4.3 Micropipette
A micropipette is used to add the dye to the cell. It should be of ~ 0.1 cm3 capacity with
a narrow Teflon® tube attached to act as a nozzle. The micropipette should be regularly calibrated.
4.4 High-quality spectrophotometer
For work of the highest sensitivity and precision, a double-beam spectrophotometer is
desirable. However, good results can be obtained with a high quality single-beam instrument.
4.5 Temperature-control system for spectrophotometer cell Commercially manufactured, thermostated spectrophotometer compartments that can
accommodate 10 cm cells are rarely available and one will probably have to be custom-made. The temperature should be regulated to within 0.1°C.
4.6 System to warm/cool samples to measurement temperature
Although it is possible to warm up the cells containing samples in Ziploc® bags in a
thermostat bath, this is inconvenient. It is much better to build a custom made thermostat compartment that can hold approximately 12 cells at once without getting them wet.
4.7 Thermostat bath (± 0.1C)
A thermostat bath is used to regulate the temperature of the cell compartment and the
temperature of the system described in section.
-17-
5. Reagents 5.1 Solution of m-cresol purple
A concentrated (at least 2 mmol dm–3) dye solution of known pH adjusted to be in the
range 7.9 ± 0.1 pH units, which is chosen to match pH measurements from an oceanic profile, is required; this implies that for m-cresol purple A1/A2 ≈ 1.6. Note: 1. Solution of m-Cresol Purple 2 mmole dm-3 was prepared by dissolve 0.202 g of m-
Cresol Purple sodium salt (C21H17NaO5S; MW=404.41 g mol-1) in 250 ml of deionize water. The pH of the solution will be adjusted with 0.1mol/L of HCl or NaOH to get pH 7.9±0.1.
2. The absorbance ratio (A1/A2) of a concentrated dye solution can be measured using a cell with a short path length (0.5 mm or less).
6. Sampling and sample preservation
Measurements of pH can be performed within 6 hours of sampling at sea, or pH samples
can be preserved and brought back to labs for analysis. In the former case, draw the sample by using the drawing tube connect direct from the Niskin bottle (or other water sampler) into the optical cell. After remove all air bubbles from the drawing tube, flush the optical cell with seawater sample for 15–20 seconds, then seal the cell with the Teflon® caps ensuring that there is no headspace.
To collect and preserve the seawater sample for further measurement in the laboratory.
The sample has to be drawn from the Nisking water sampler into the clean Pyrex reagent bottle (see Note 6) by using the drawing tube and rinse the bottle several times with sample before filling. Before sealing the bottle, ~1-2% of seawater sample has to be taken out from the bottle to make the headspace then preserve it with saturated mercury chloride solution (about 0.02% of the sample volume). The detail of procedure shows in Appendix A.
Note: Cleaning sample containers (Pyrex reagent bottle) by precombustion in a muffle
furnace will remove any organic carbon and associated microorganisms. However, it may be difficult to has big muffle furnaces in some laboratory. The alternative methods could be used such as (1) soaking the bottles in 1 N HCl; however, care must be taken to remove all residual acid during rinsing and (2) using analytical grade bottle detergent to wash, followed by thorough DI water rinse.
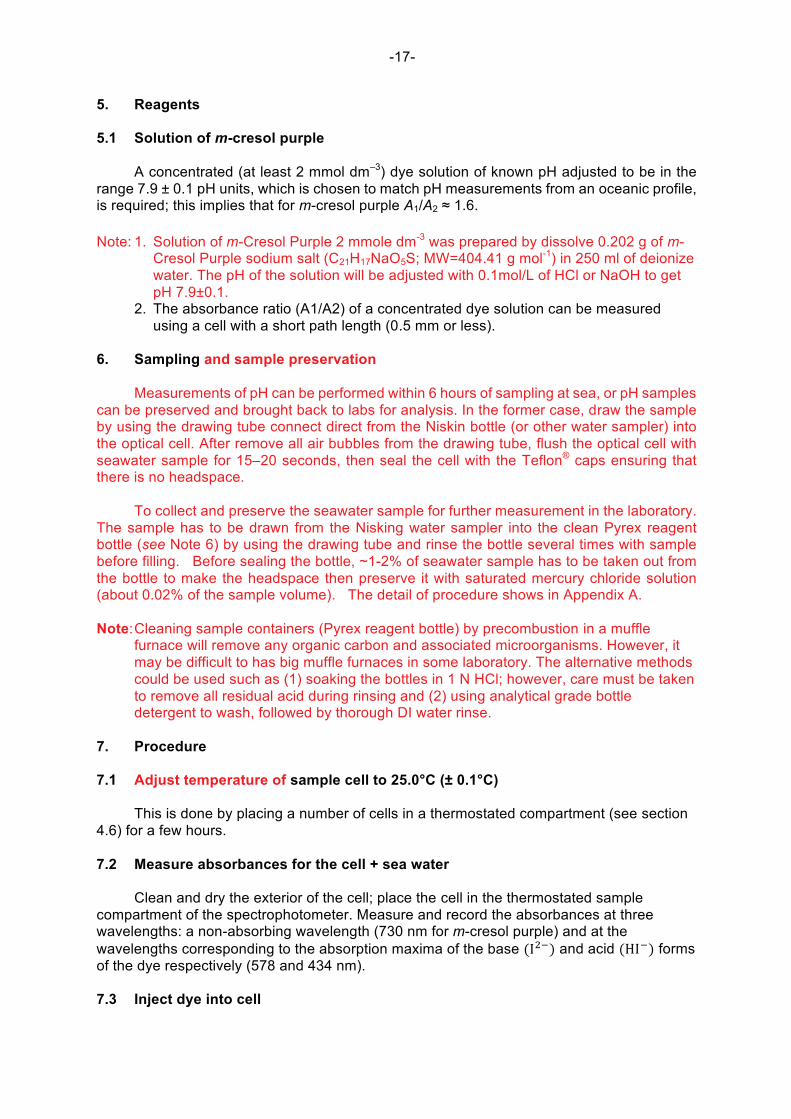
7. Procedure 7.1 Adjust temperature of sample cell to 25.0°C (± 0.1°C)
This is done by placing a number of cells in a thermostated compartment (see section
4.6) for a few hours.
7.2 Measure absorbances for the cell + sea water Clean and dry the exterior of the cell; place the cell in the thermostated sample
compartment of the spectrophotometer. Measure and record the absorbances at three wavelengths: a non-absorbing wavelength (730 nm for m-cresol purple) and at the wavelengths corresponding to the absorption maxima of the base (I��) and acid (HI�) forms of the dye respectively (578 and 434 nm).
7.3 Inject dye into cell
-18-
Remove one of the cell caps, add approximately 0.05–0.1 cm3 (depend on the volume
of the optical cell) of concentrated dye (~2 mmol dm–3) to the sample, replace the cap and gently shake the cell to mix the sea water and dye. The amount of dye required is that which will produce absorbance values of between 0.4 and 1.0 at each of the two absorbance peaks.
7.4 Measure absorbances of cell + sea water + dye
Return the cell to the spectrophotometer and again measure the absorbances at the
three wavelengths used in section 7.2. Cells should be positioned to maintain consistent alignment(s) between baseline and indicator absorbance measurements.
Note: The difference between the baseline absorbance (sea water only) and the
absorbance of the sample + dye at 730 nm should be no greater than ± 0.001to ±0.003; if this value is exceeded, the cell should be removed and the optical windows cleaned before the absorbances are measured again.
8. Calculation and expression of results 8.1 Correction of measured absorbances
At each of the three wavelengths, subtract the absorbances measured for the
background measurement (without dye) from the corresponding absorbances measured for the system containing dye. In addition, the absorbance measured at a non-absorbing wavelength is used to monitor and correct for any baseline shift due to error in repositioning the cell, instrumental shifts, etc. This assumes that the magnitude of any observed baseline shift is identical across the visible spectrum. To do this, subtract the measured shift from the background-corrected absorbances at wavelengths 1 and 2 to obtain the final corrected absorbance value at each wavelength.
These final absorbance values, corrected for background absorbances and any
observed baseline shifts, are used to calculate A1/A2, the absorbance ratio which describes the extent of protonation of the dye.
8.2 Calculation of the pH of the sea water + dye
The pH of the sea water and dye in the cell is computed from
pH = p𝐾𝐾�+ log�� �� �����(���)/��(���)��(���)/��(���)�(�� ��)��(���)/��(���) (7)
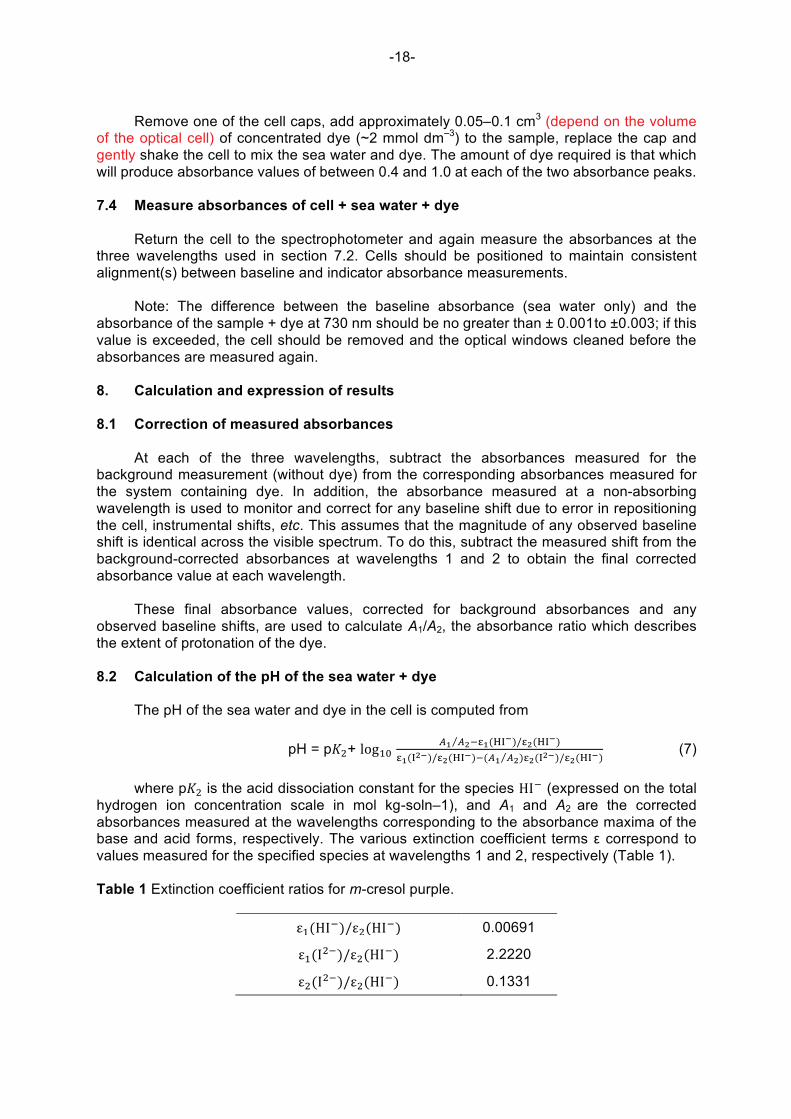
where p𝐾𝐾� is the acid dissociation constant for the species HI� (expressed on the total hydrogen ion concentration scale in mol kg-soln–1), and A1 and A2 are the corrected absorbances measured at the wavelengths corresponding to the absorbance maxima of the base and acid forms, respectively. The various extinction coefficient terms ε correspond to values measured for the specified species at wavelengths 1 and 2, respectively (Table 1).
Table 1 Extinction coefficient ratios for m-cresol purple.
ε�(HI�)/ε�(HI�) 0.00691
ε�(I��)/ε�(HI�) 2.2220
ε�(I��)/ε�(HI�) 0.1331
-19-
λ1 = 578 nm; λ2 = 434 nm.
The equilibrium constant 𝐾𝐾� is a function of salinity and temperature and has been determined by careful laboratory measurements3. For m-cresol purple,
p𝐾𝐾�=����.��
(�/�) +3.8275 + 0.00211(35 − 𝑆𝑆) (8) where 293 ≤ T/K ≤ 303 and 30 ≤ S ≤ 37. Note: Although DelValls and Dickson (1998) have suggested that this pK_2 may be in
error because of an error in calibrating TRIS buffer, it seems that there may be a compensating error that largely mitigates the proposed correction. The pK_2 given here is that from Clayton and Byrne (1993).
8.3 Correction for pH change resulting from addition of the dye
The addition of indicator dye to the sea water sample will perturb the pH (another acid–
base system has been added!). Although care is taken to minimize this (by adjusting the dye solution pH), it is desirable to correct for the addition of dye to obtain the best pH measurements.
Although, in principle, the pH perturbation could be calculated from a knowledge of the
equilibrium chemistry of the sample and the dye, it is simpler to evaluate the magnitude of the correction empirically. A pair of additions of dye is made to each of a series of sea water samples with different pHs, and the change in the measured ratio (𝐴𝐴� 𝐴𝐴�) with the second addition of indicator solution is determined as a function of the measured value (𝐴𝐴� 𝐴𝐴�) determined after the first addition of dye using a least-squares procedure (SOP 23):
∆(�� ��)
� = 𝑎𝑎 + 𝑏𝑏(𝐴𝐴�/𝐴𝐴�) (9)
where V is the volume of dye added at each addition. The final, corrected, absorbance
ratio is
(𝐴𝐴�/𝐴𝐴�)���� = (𝐴𝐴�/𝐴𝐴�) − 𝑉𝑉[𝑎𝑎 + 𝑏𝑏(𝐴𝐴�/𝐴𝐴�)]. (10) 8.4 Example calculation
t = 25°C, S = 35, p𝐾𝐾� = 8.0056, and for indicator stock solution with 𝐴𝐴�/𝐴𝐴� = 1.6,
∆(�� ��)
� = 0.125 − 0.147(𝐴𝐴�/𝐴𝐴�).
Measured absorbances: Sea water: 𝐴𝐴��� = 0.02433 ; 𝐴𝐴��� = 0.01936 ; 𝐴𝐴��� = 0.08365 Dye + sea water: 𝐴𝐴��� = 0.45123 ; 𝐴𝐴��� = 0.84574 ; 𝐴𝐴��� = 0.08298 After addition of dye,
-20-
𝐴𝐴� 𝐴𝐴� = �.�������.������ �.������.������.�������.������ �.�������.����� = 1.93430.
Corrected to zero dye addition (V = 0.08 cm3), (𝐴𝐴�/𝐴𝐴�)���� = 1.9343-0.08[0.125-0.147(1.93430)] = 1.94705 and thus
pH = 8.0056 + log�� �.�������.������.������.������.���� = 8.0005.
9. Quality assurance 9.1 For general principles of analytical quality control see Chapter 3 9.2 Specific applications of analytical quality control 9.2.1 Spectrophotometer performance
The spectrophotometric performance of the instrument used can be confirmed using
reference materials that are available from the U.S. National Institute for Standards and Technology (NIST). SRM 2034 is a holmium oxide solution in a sealed cuvette that allows the wavelength accuracy of the spectrophotometer to be determined; SRM 930d is a set of absorbance filters that allows the absorbance measurement accuracy to be verified. Property control charts of these measurements should be maintained, and the spectrophotometer adjusted if it goes out of tolerance. (Nevertheless, the procedure detailed here is fairly insensitive to minor changes in spectrophotometer performance.)
A more important concern is that the spectrometer must have a high stability. This can be confirmed by making a series of repeated measurements on a system of
constant absorbance (e.g., SRM 930d or a thermostated buffer solution containing indicator dye) and computing the standard deviation at the wavelengths of interest.
9.2.2 Precision
A precision of better than 0.001 pH units (1 SD) is possible with care—particularly in
regard to the sample handling. The results of duplicate analyses should be plotted on a range control chart.
9.2.3 Bias
The bias of spectrophotometric pH measurements depends on the accuracy with which
the various extinction coefficient ratios were determined, and on the accuracy of the values assigned to the values of pK2. A significant advantage of spectrophotometric measurements is that, if more accurate information becomes available for these parameters at a later time, the pH results obtained can be adjusted without any degradation in precision provided that the original data are retained. At present, the likely bias is estimated to be less than 0.005 pH units.
9.2.4 Accuracy of the measurement method (Percent Recovery of Standard Referent
Material)

-21-
The accuracy of the measurement method could be carried out by measure the Standard Referent Material (SRM: Tris Buffer Solution in synthetic seawater) which provide the high accuracy of pH. (it could be ordered from: [email protected])
10. Bibliography
Byrne, R.H. and Breland, J.A. 1989. High precision multiwavelength pH determinations in seawater using cresol red. Deep-Sea Res. 36: 803–810.
Byrne, R.H., Robert-Baldo, G., Thompson, S.W. and Chen, C.T.A. 1988. Seawater pH measurements: an at-sea comparison of spectrophotometric and potentiometric methods. Deep-Sea Res. 35: 1405–1410.
Clayton, T.D. and Byrne, R.H. 1993. Spectrophotometric seawater pH measurements: total hydrogen ion concentration scale calibration of m-cresol purple and at-sea results. Deep-Sea Res. 40: 2115–2129.
DelValls, T.A. and Dickson, A.G. 1998. The pH of buffers based on 2-amino-2 hydroxymethyl-1,3-propanediol (‘tris’) in synthetic sea water. Deep-Sea Res. 45: 1541–1554.
Dickson, A.G. 1993. The measurement of sea water pH. Marine Chem. 44: 131–142.
Dickson, A.G., Sabine, C.L. and Christian, J.R. (Eds.) 2007. Guide to best practices for ocean CO2 measurements. PICES Special Publication 3, 191 pp.
-22-
Appendix A
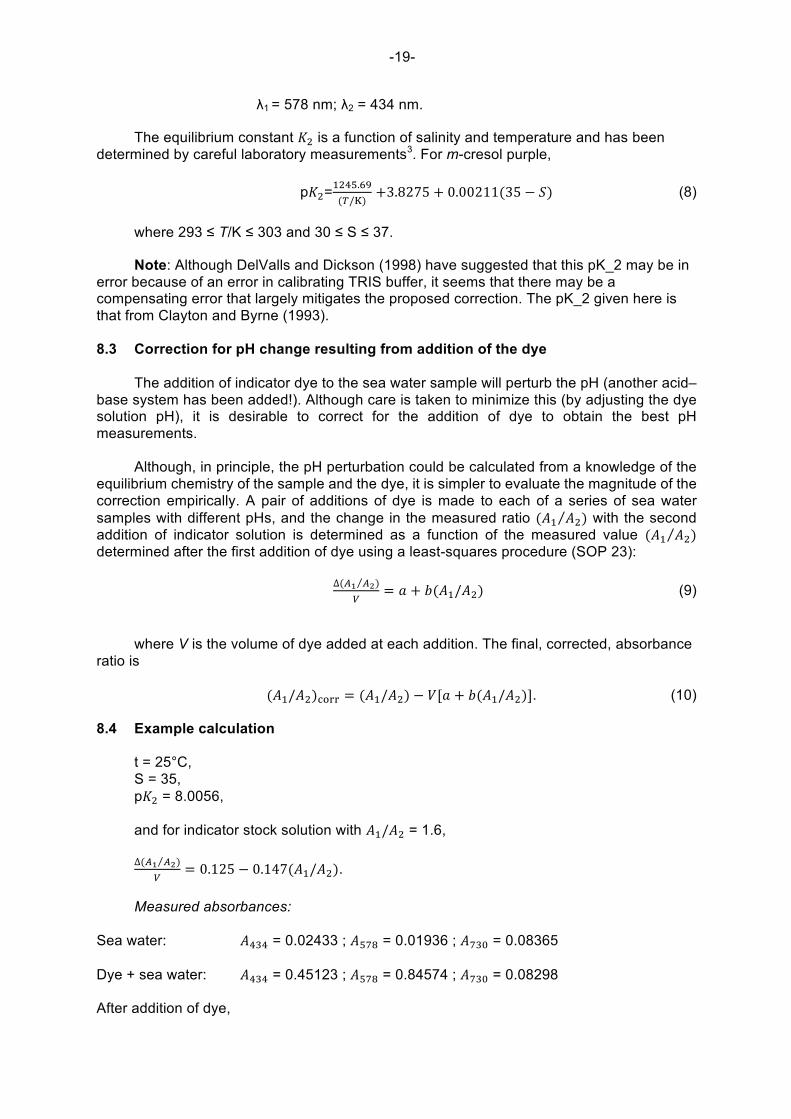
The picture and procedure are provided by Prof. Andrew Dickson.
Figure A Positioning sampling equipment and greasing a stopper before filling a bottle. It is encouraged to secure all equipment to the bench top as weather can be unpredictable.
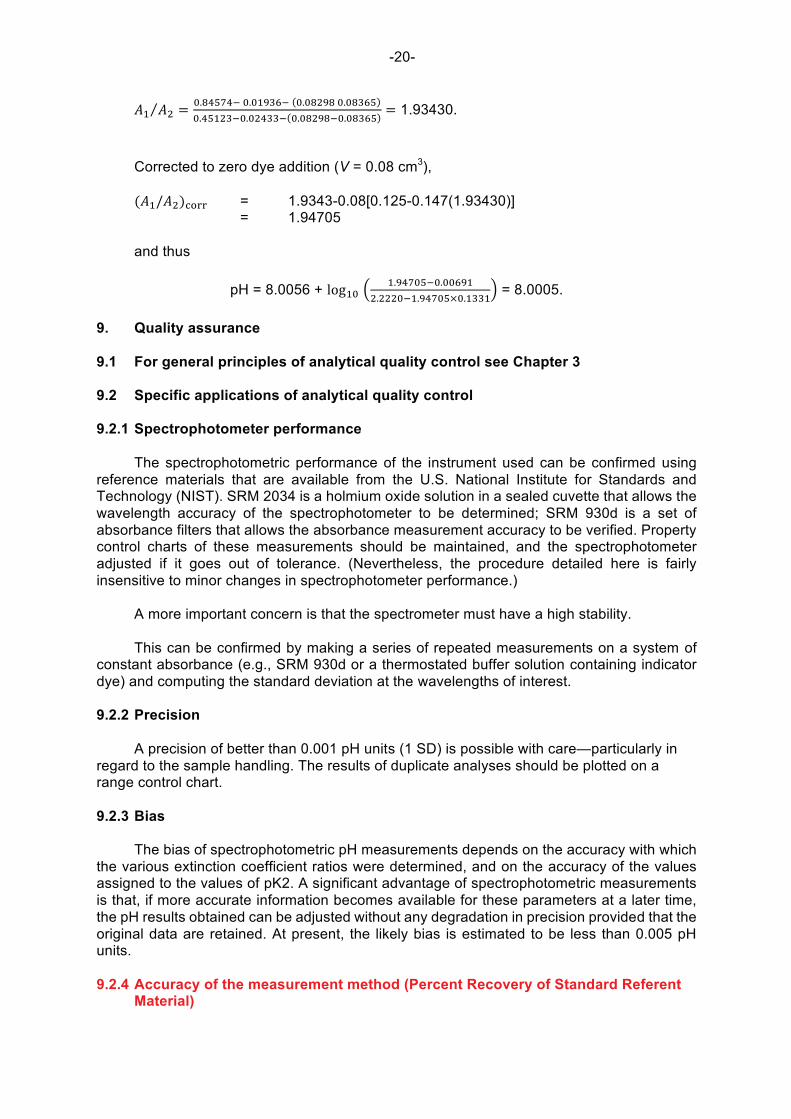
Figure B The end of the tubing is at the bottom of the bottle and the tubing is being pinched to remove any bubbles inside the tubing.
-23-
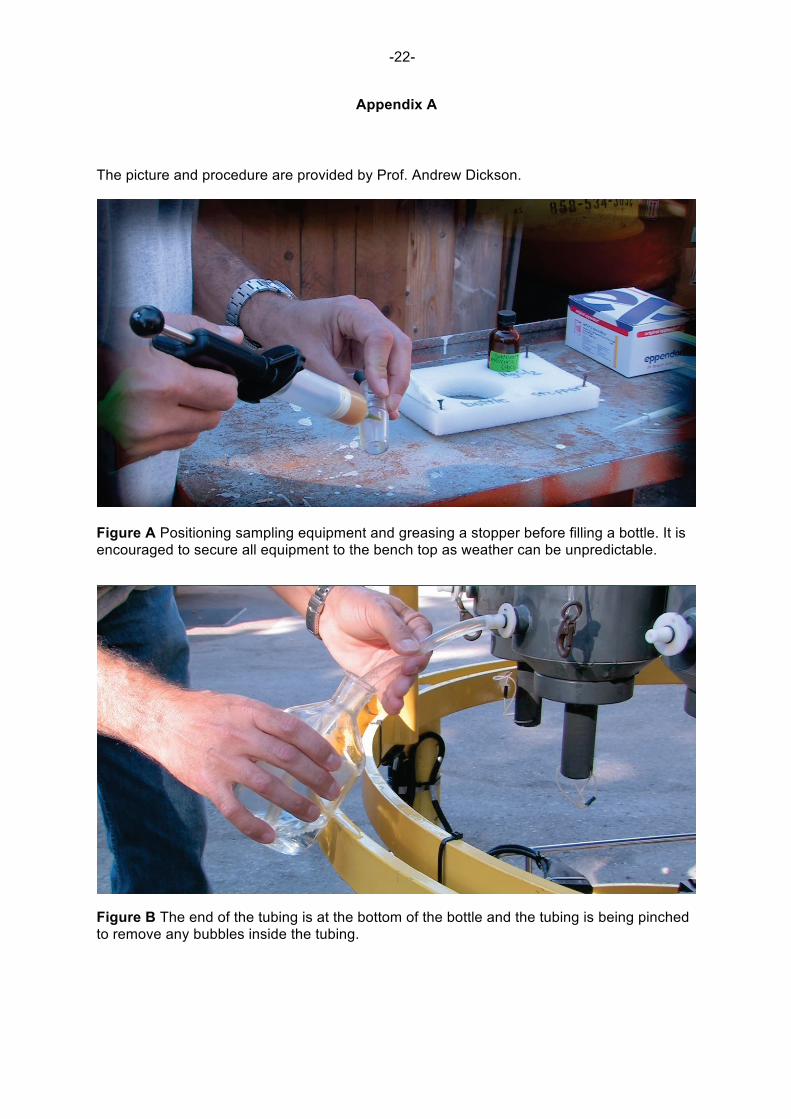
Figure C Placing the filled bottle into the polyethafoam block. Notice that all sampling equipment is already prepared and within arms reach.
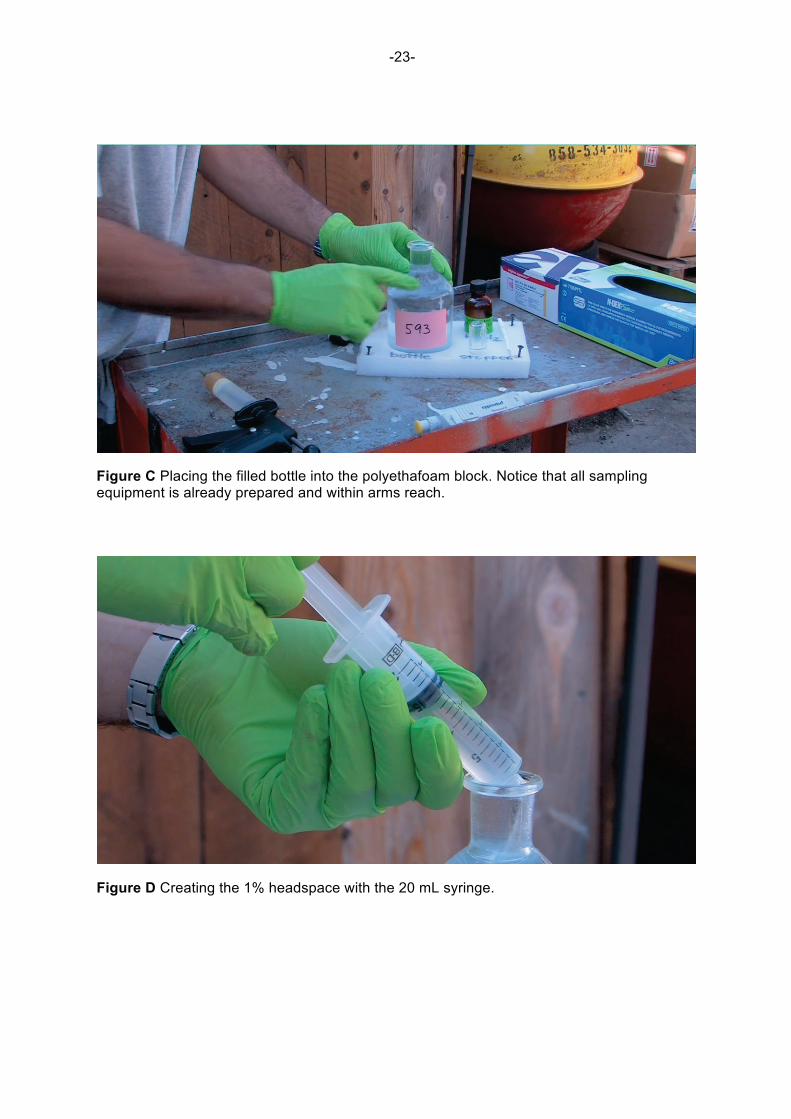
Figure D Creating the 1% headspace with the 20 mL syringe.
-24-
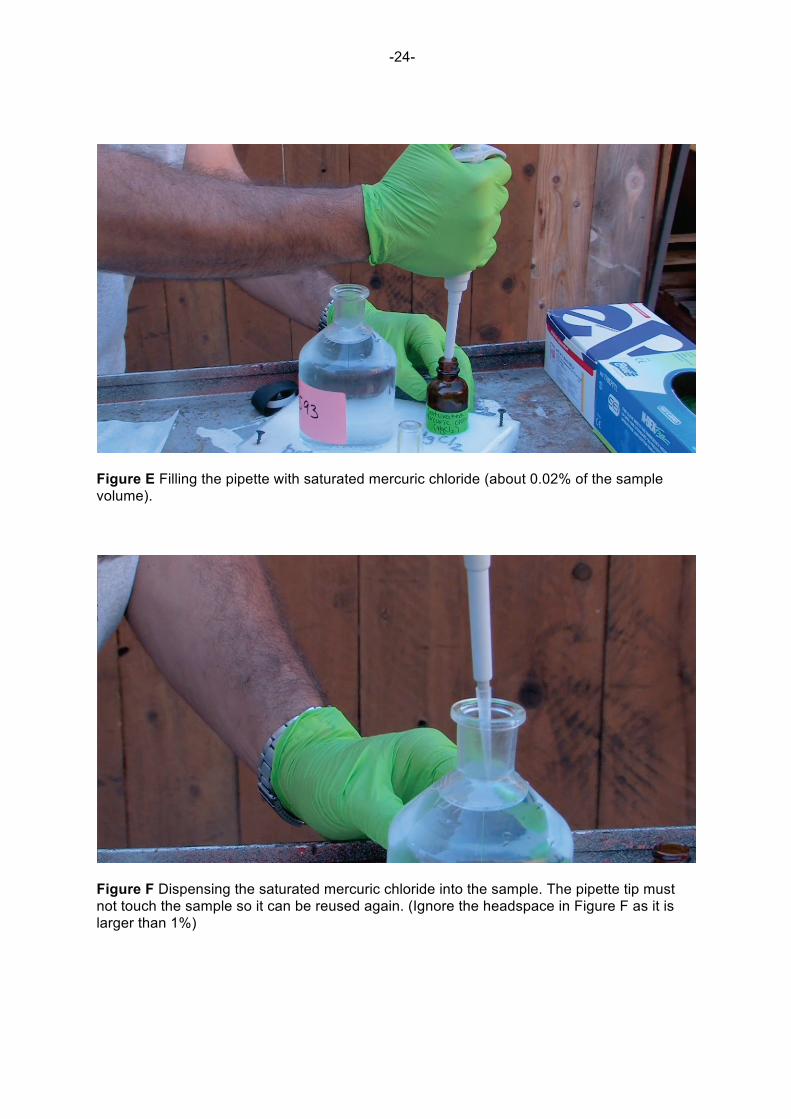
Figure E Filling the pipette with saturated mercuric chloride (about 0.02% of the sample volume).
Figure F Dispensing the saturated mercuric chloride into the sample. The pipette tip must not touch the sample so it can be reused again. (Ignore the headspace in Figure F as it is larger than 1%)
-25-
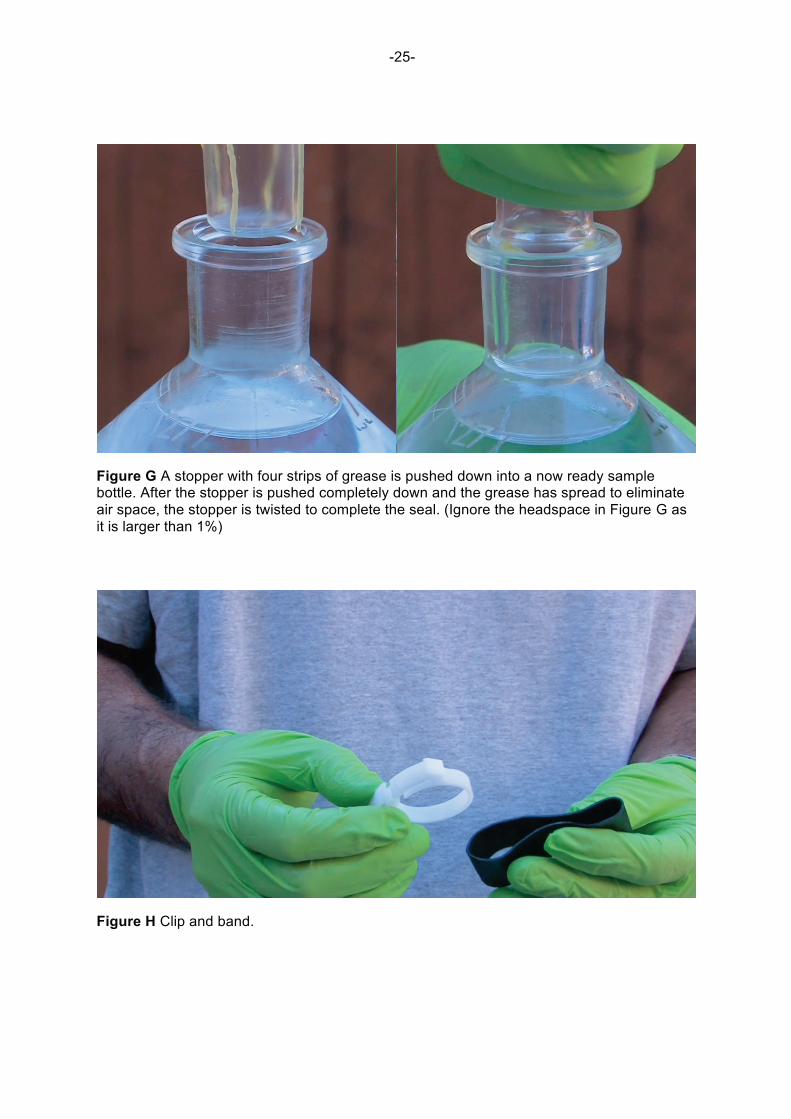
Figure G A stopper with four strips of grease is pushed down into a now ready sample bottle. After the stopper is pushed completely down and the grease has spread to eliminate air space, the stopper is twisted to complete the seal. (Ignore the headspace in Figure G as it is larger than 1%)
Figure H Clip and band.
-26-
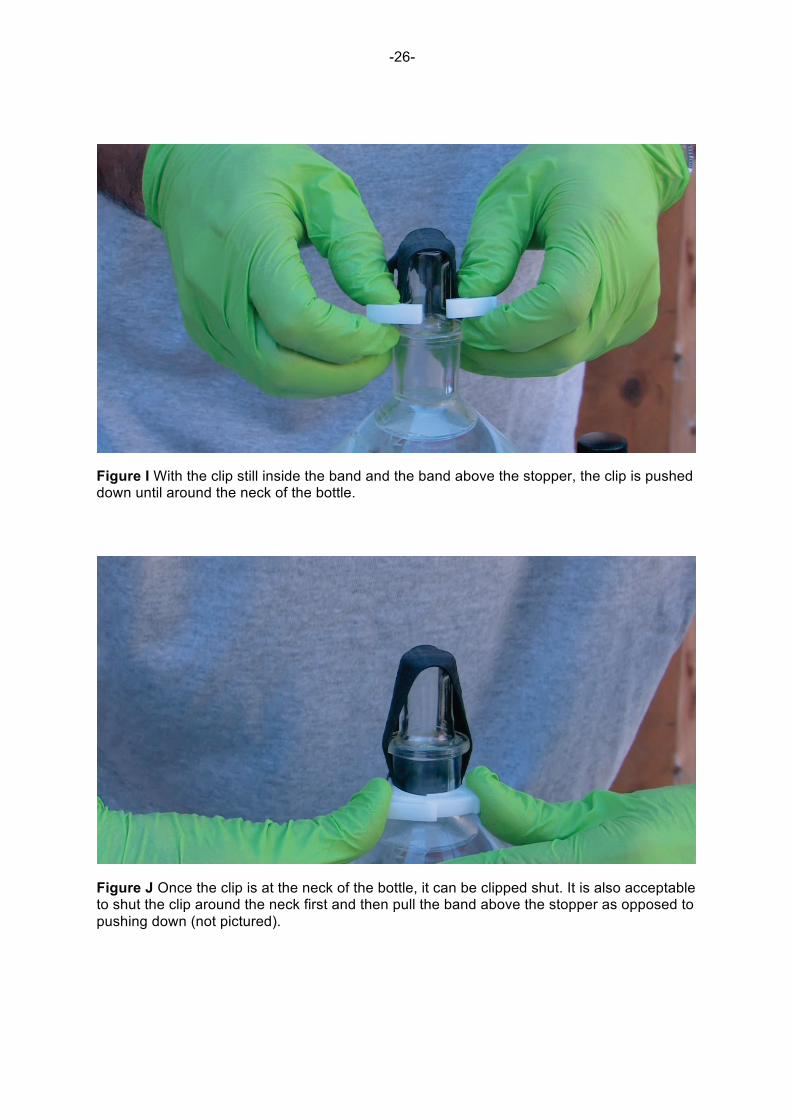
Figure I With the clip still inside the band and the band above the stopper, the clip is pushed down until around the neck of the bottle.
Figure J Once the clip is at the neck of the bottle, it can be clipped shut. It is also acceptable to shut the clip around the neck first and then pull the band above the stopper as opposed to pushing down (not pictured).

Appendix 2
Excel sheet for calculation of pH
A B C D E F G H I J K L M N O P Q R
Sample Salinity Temp°C Dry(ml) A730SW A578SW A434SW A730SWDRY A578SWDRY A434SWDRY TempK ε1 ε2 ε3 pK2 A1/A2 (A1/A2)Corr pH
35 25 0.08 0.08365 0.01936 0.02433 0.08298 0.84574 0.45123 298.15 0.00691 2.222 0.1331 8.005565 1.934303 1.9470506 8.000511
=273.15+C2 =(1245.69/K2)+3.8275+0.002111*(35-B2)
=(I2-F2-(H2-E2))/(J2-G2-(H2-E2))
=P2-D2*(0.125-(0.147*P2))
=O2+LOG((Q2-L2)/(M2-(Q2*N2)))
Salinity = salinity of sample
Temperature = at the measure time which control at 25°c
Dry = volume of dry which added into the sample (mixing in the optical cell)
A730SW = measure seawater sample with wavelength 730 nm
A578SW = measure seawater sample with wavelength 578 nm
A434SW = measure seawater sample with wavelength 578 nm
A730SWDRY = measure seawater sample + Dry with wavelength 730 nm
A578SWDRY = measure seawater sample + Dry with wavelength 578 nm
A434SWDRY = measure seawater sample + Dry with wavelength 578 nm
ε1, ε2, ε3 = constant value (see table 1)