rr results q4_2014_en_final
TRANSCRIPT
© 2015 Ramirent
ADVANCING OPERATIONAL IMPROVEMENT AGENDA IN MIXED MARKET ENVIRONMENT 12 February 2015 Magnus Rosén, President and CEO Jonas Söderkvist, CFO and EVP Corporate Functions
Q4 Financial Statements Bulletin 2014
© 2014 Ramirent © 2014 Ramirent
Agenda
2
Group performance
Segment review
Market outlook
Key figures
Financial position
Company overview
Appendix
© 2014 Ramirent 3
Strong cash flow in the fourth quarter
Key figures Q4/2014
Business performance
Market situation
Increased geopolitical uncertainty and slow economic growth in our main markets combined with the rapid decline in oil price impacted negatively on net sales
Net sales down by 4.1% or by 1.6% at comparable exchange rates
EBITA 14.5 (20.9) MEUR or 9.0% (12.5%) of net sales
EBITA excl. non-recurring items 18.2 (20.9) MEUR or 11.4% (12.5%) of net sales
The non-recurring items include restructuring costs and asset write-downs of -3.7 (0.0) MEUR
Restructuring and asset write-downs burdened profitability especially in Finland, Sweden and Europe Central
Cost reduction measures continued and we held back on investments in the rental fleet and delivered a strong free cash flow
Financial Statements Bulletin 2014 l 12 February 2015
© 2014 Ramirent 4
Advancing operational improvement agenda in mixed market environment
Key figures 1-12/2014
Business performance
Market situation
Weaker than expected recovery in the Nordic construction sector impacted negatively on the demand for equipment rental
We saw growth in Sweden, while the demand picture remained weak in Finland reflecting increased geopolitical uncertainty
Net sales down by 5.2%; adjusted for transferred or divested operations, net sales
were down by 0.6% at comparable exchange rates
EBITA 65.8 (92.1) MEUR or 10.7% (14.2%) of net sales
EBITA excl. non-recurring items1) and adjusted for transferred or divested
operations 71.5 (83.6) MEUR or 11.7% (13.1%) of net sales
Non-recurring items1) incl. restructuring costs and asset write-downs of -5.7 (8.5)
MEUR
Cost reductions and efficiency improvements were carried out in all segments
Profitability strengthened in the Baltics and Europe Central
Financial Statements Bulletin 2014 l 12 February 2015
1) Non-recurring items include restructuring costs of EUR 1.9 million in the third quarter 2014 and EUR 3.7 million of restructuring costs and asset write-downs in the fourth quarter 2014. The comparison period included a non-taxable capital gain of EUR 10.1 million from the formation of Fortrent in the first quarter 2013, a EUR 1.9 million loss from disposal of Hungary as well as EUR 1.5 million of restructuring costs in Denmark in the third quarter of 2013.
© 2014 Ramirent 5
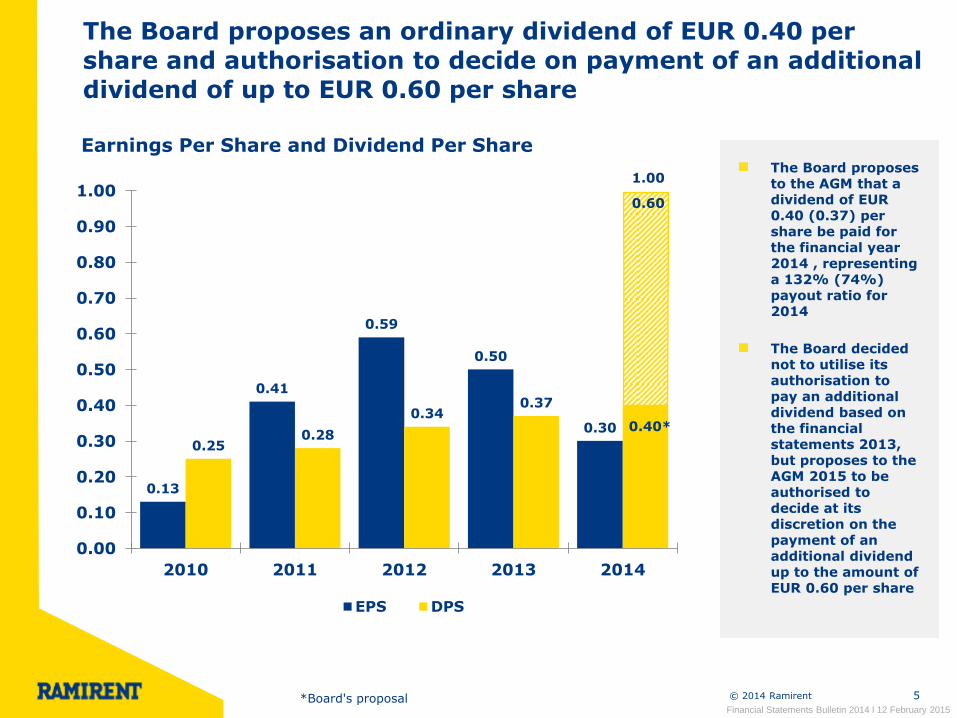
The Board proposes an ordinary dividend of EUR 0.40 per
share and authorisation to decide on payment of an additional
dividend of up to EUR 0.60 per share
Earnings Per Share and Dividend Per Share
0.13
0.41
0.59
0.50
0.30
0.25 0.28
0.34 0.37
0.00
0.10
0.20
0.30
0.40
0.50
0.60
0.70
0.80
0.90
1.00
2010 2011 2012 2013 2014
EPS DPS
The Board proposes to the AGM that a dividend of EUR 0.40 (0.37) per share be paid for the financial year 2014 , representing a 132% (74%) payout ratio for 2014
The Board decided not to utilise its authorisation to pay an additional dividend based on the financial statements 2013, but proposes to the AGM 2015 to be authorised to decide at its discretion on the payment of an additional dividend up to the amount of EUR 0.60 per share
1.00
0.40*
0.60
Financial Statements Bulletin 2014 l 12 February 2015 *Board's proposal
© 2014 Ramirent 6
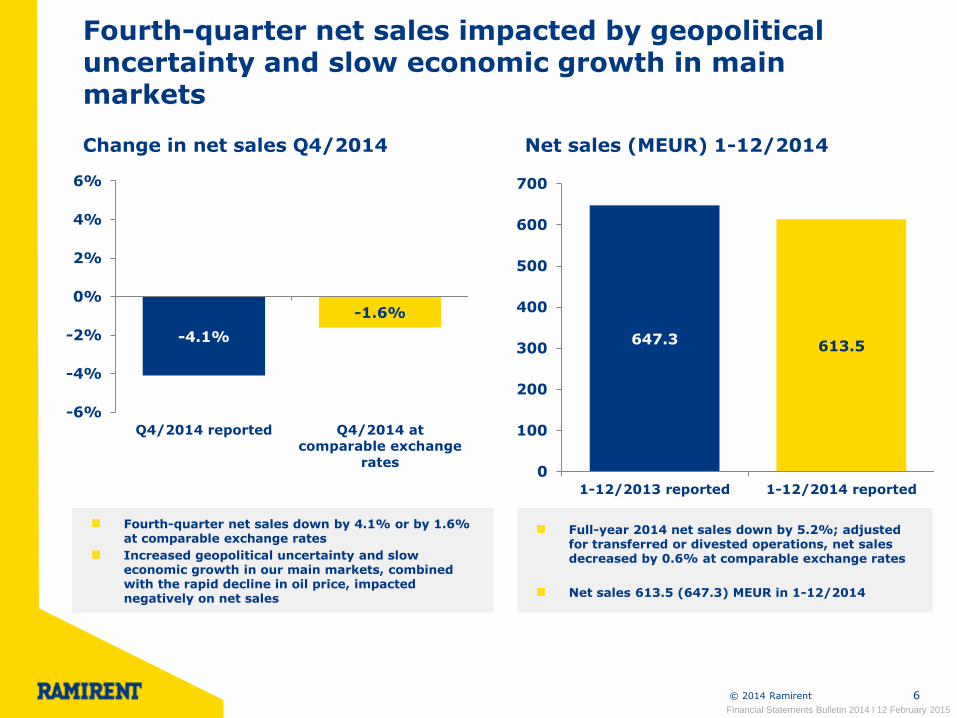
Fourth-quarter net sales impacted by geopolitical uncertainty and slow economic growth in main markets
Change in net sales Q4/2014
-4.1%
-1.6%
-6%
-4%
-2%
0%
2%
4%
6%
Q4/2014 reported Q4/2014 at
comparable exchange
rates
Net sales (MEUR) 1-12/2014
Fourth-quarter net sales down by 4.1% or by 1.6% at comparable exchange rates
Increased geopolitical uncertainty and slow economic growth in our main markets, combined with the rapid decline in oil price, impacted negatively on net sales
647.3 613.5
0
100
200
300
400
500
600
700
1-12/2013 reported 1-12/2014 reported
Full-year 2014 net sales down by 5.2%; adjusted for transferred or divested operations, net sales decreased by 0.6% at comparable exchange rates
Net sales 613.5 (647.3) MEUR in 1-12/2014
Financial Statements Bulletin 2014 l 12 February 2015
© 2014 Ramirent 7
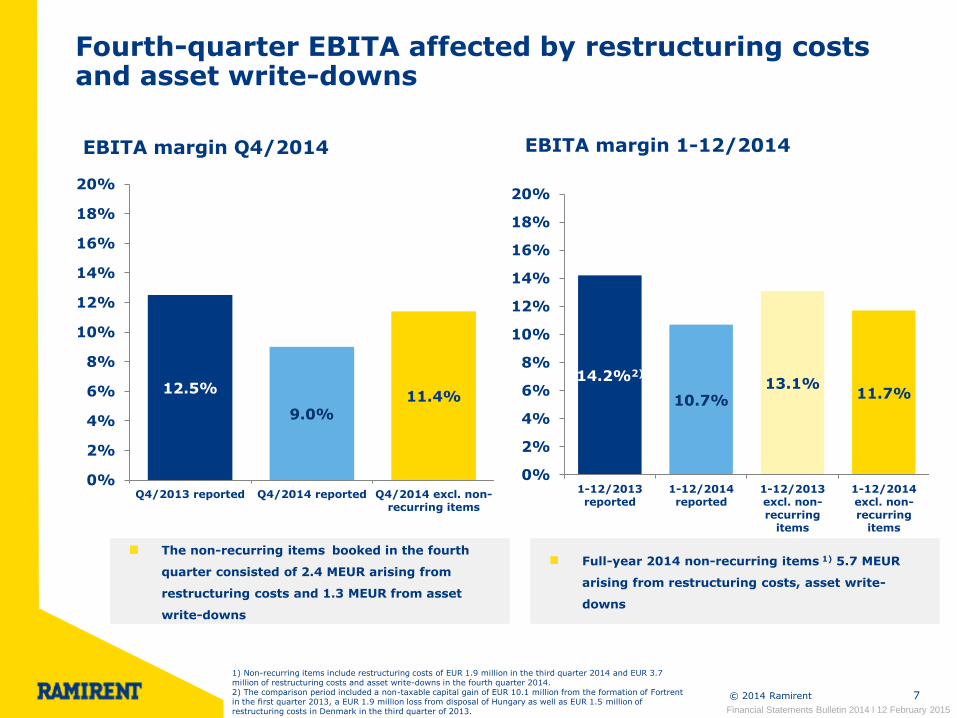
Fourth-quarter EBITA affected by restructuring costs and asset write-downs
12.5%
9.0% 11.4%
0%
2%
4%
6%
8%
10%
12%
14%
16%
18%
20%
Q4/2013 reported Q4/2014 reported Q4/2014 excl. non-recurring items
The non-recurring items booked in the fourth
quarter consisted of 2.4 MEUR arising from
restructuring costs and 1.3 MEUR from asset
write-downs
EBITA margin Q4/2014 EBITA margin 1-12/2014
Full-year 2014 non-recurring items 1) 5.7 MEUR
arising from restructuring costs, asset write-
downs
Financial Statements Bulletin 2014 l 12 February 2015
14.2%2)
10.7% 13.1%
11.7%
0%
2%
4%
6%
8%
10%
12%
14%
16%
18%
20%
1-12/2013reported
1-12/2014reported
1-12/2013excl. non-recurring
items
1-12/2014excl. non-recurring
items
1) Non-recurring items include restructuring costs of EUR 1.9 million in the third quarter 2014 and EUR 3.7 million of restructuring costs and asset write-downs in the fourth quarter 2014. 2) The comparison period included a non-taxable capital gain of EUR 10.1 million from the formation of Fortrent in the first quarter 2013, a EUR 1.9 million loss from disposal of Hungary as well as EUR 1.5 million of restructuring costs in Denmark in the third quarter of 2013.
© 2014 Ramirent 8
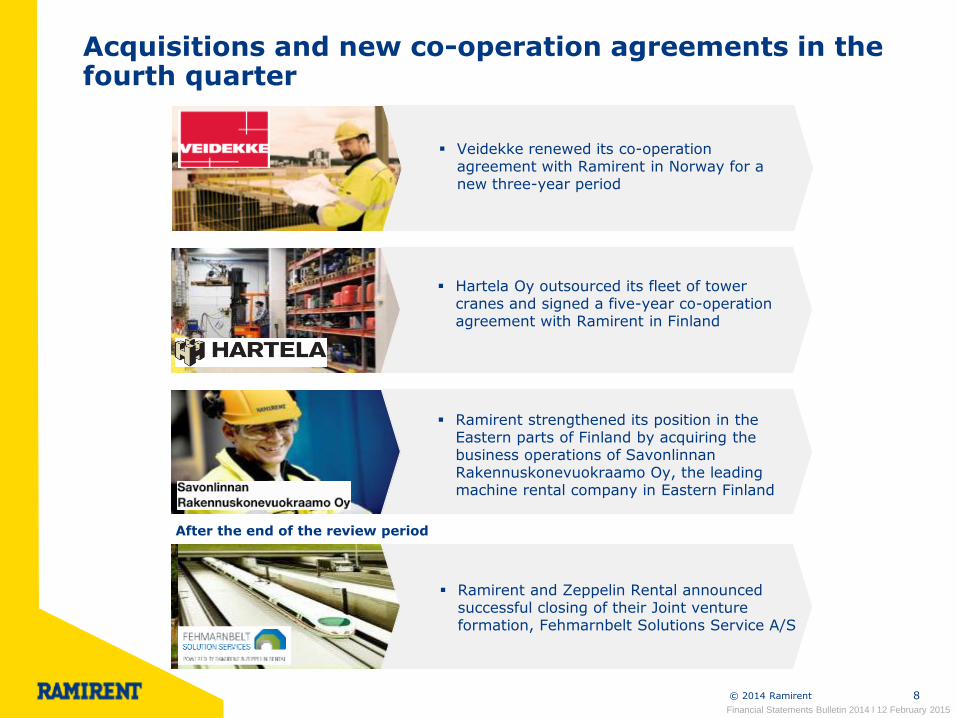
Acquisitions and new co-operation agreements in the fourth quarter
Veidekke renewed its co-operation agreement with Ramirent in Norway for a new three-year period
Hartela Oy outsourced its fleet of tower cranes and signed a five-year co-operation agreement with Ramirent in Finland
After the end of the review period
Financial Statements Bulletin 2014 l 12 February 2015
Skanska's internal machinery department, Skanska Maskin AB, signed a three-year equipment rental agreement with Ramirent in Sweden
The agreement covers the whole assortment of both companies, from light and heavy machinery to modules and cranes
Ramirent strengthened its position in the Eastern parts of Finland by acquiring the business operations of Savonlinnan Rakennuskonevuokraamo Oy, the leading machine rental company in Eastern Finland
Ramirent and Zeppelin Rental announced successful closing of their Joint venture formation, Fehmarnbelt Solutions Service A/S
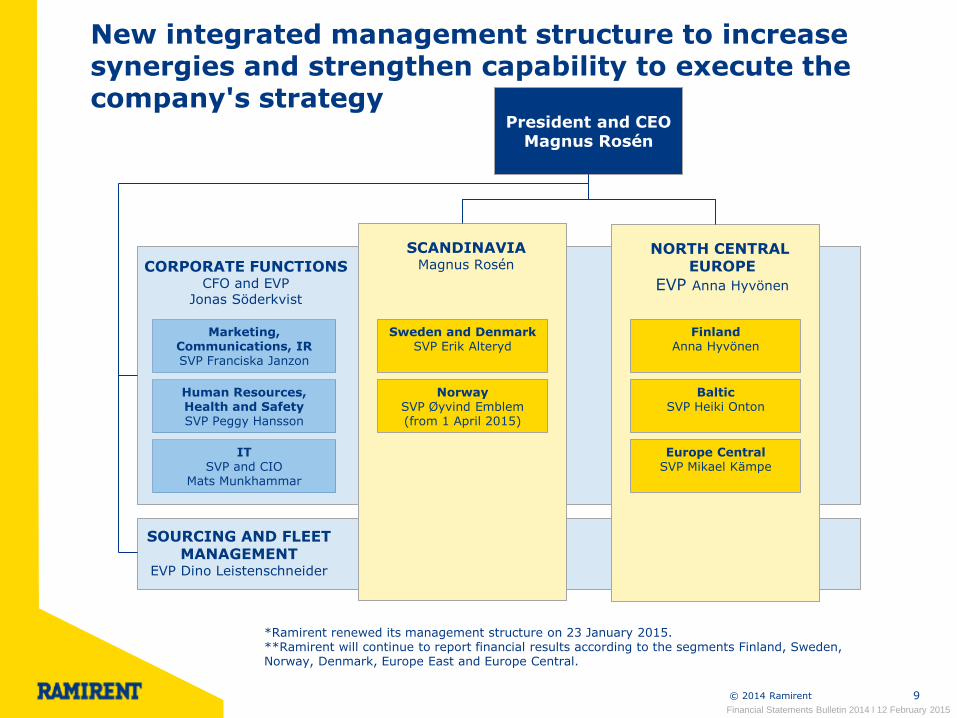
© 2014 Ramirent 9
SOURCING AND FLEET MANAGEMENT
EVP Dino Leistenschneider
Human Resources, Health and Safety SVP Peggy Hansson
Marketing, Communications, IR SVP Franciska Janzon
CORPORATE FUNCTIONS CFO and EVP
Jonas Söderkvist
IT SVP and CIO
Mats Munkhammar
President and CEO
Magnus Rosén
Sweden and Denmark SVP Erik Alteryd
Norway SVP Øyvind Emblem (from 1 April 2015)
SCANDINAVIA Magnus Rosén
NORTH CENTRAL EUROPE
EVP Anna Hyvönen
Europe Central SVP Mikael Kämpe
Baltic SVP Heiki Onton
Finland Anna Hyvönen
*Ramirent renewed its management structure on 23 January 2015. **Ramirent will continue to report financial results according to the segments Finland, Sweden, Norway, Denmark, Europe East and Europe Central.
New integrated management structure to increase synergies and strengthen capability to execute the company's strategy
Financial Statements Bulletin 2014 l 12 February 2015

© 2014 Ramirent 10
Financial Statements Bulletin 2014 l 12 February 2015
Through a diversified business portfolio
One company
Sustainable profitable
growth
Agility in managing business
Our long-term strategic objectives are still valid
Customer first through NextRamirent
Realised synergies of scale and scope while maintaining local accountability
More Proactive
More Competent
More Conscious
More Safe & Green
More Efficient
Leading and most profitable general rental company in markets where present, growing in selected growth pockets
Geographies
Customers Competences
Products
© 2014 Ramirent 11
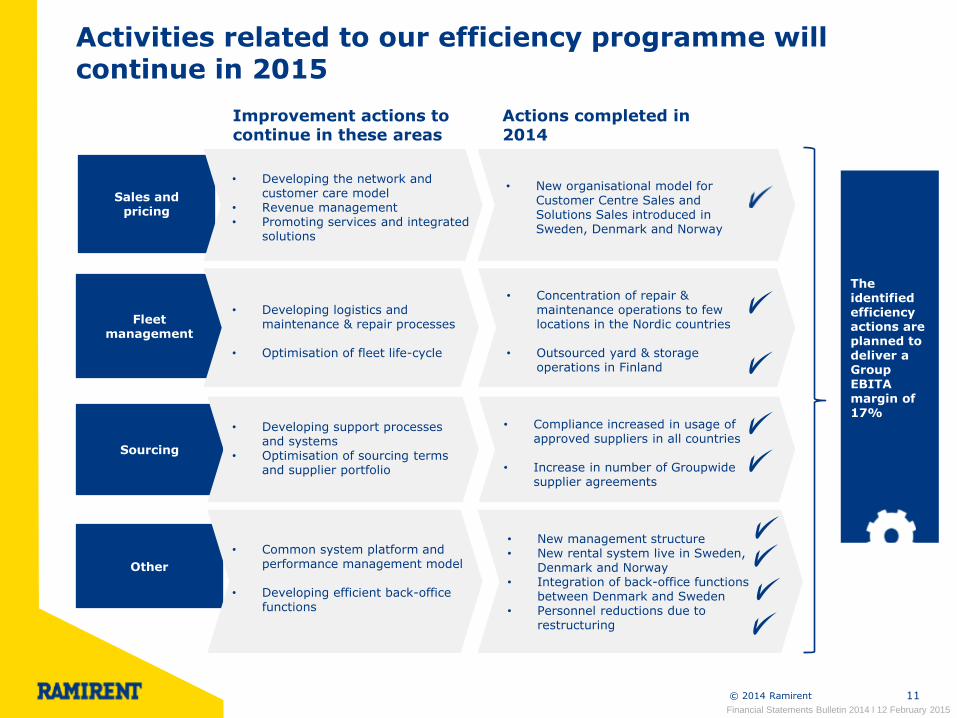
Activities related to our efficiency programme will continue in 2015
Sales and pricing
Other
Sourcing
Fleet management
• Developing logistics and maintenance & repair processes
• Optimisation of fleet life-cycle
• Developing support processes and systems
• Optimisation of sourcing terms and supplier portfolio
• Common system platform and performance management model
• Developing efficient back-office functions
The identified efficiency actions are planned to deliver a Group EBITA margin of 17%
Improvement actions to continue in these areas
• Developing the network and customer care model
• Revenue management • Promoting services and integrated
solutions
• New organisational model for Customer Centre Sales and Solutions Sales introduced in Sweden, Denmark and Norway
Actions completed in 2014
• Concentration of repair & maintenance operations to few locations in the Nordic countries
• Outsourced yard & storage operations in Finland
• Compliance increased in usage of approved suppliers in all countries
• Increase in number of Groupwide supplier agreements
• New management structure • New rental system live in Sweden,
Denmark and Norway • Integration of back-office functions
between Denmark and Sweden • Personnel reductions due to
restructuring
Financial Statements Bulletin 2014 l 12 February 2015
© 2014 Ramirent © 2014 Ramirent 12
Group performance
Segment review
Market outlook
Key figures
Financial position
Company overview
Appendix
© 2014 Ramirent 13
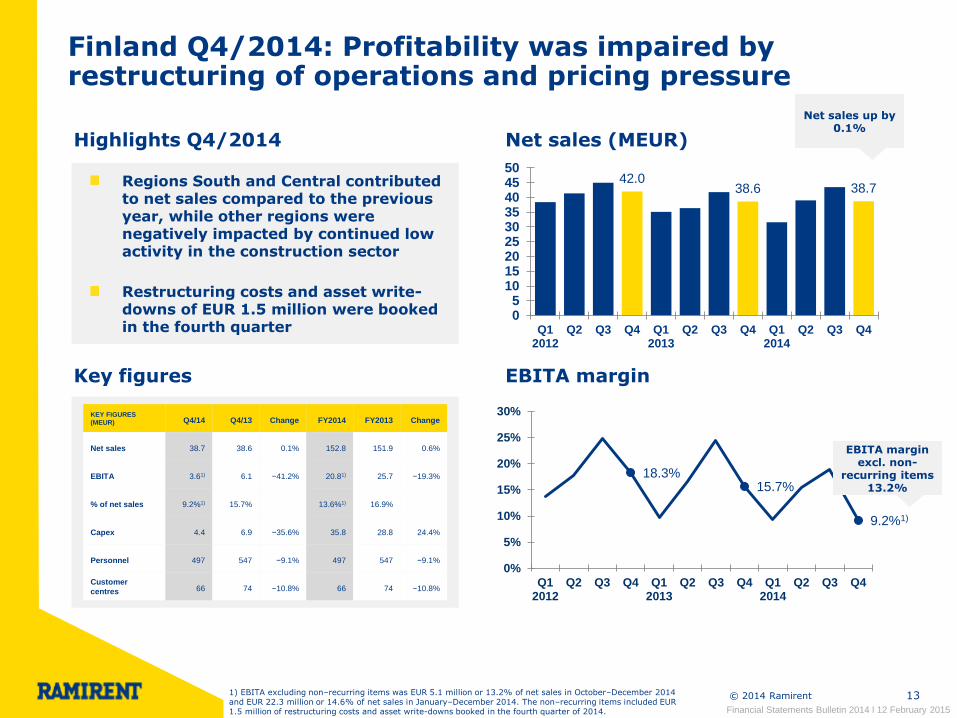
Finland Q4/2014: Profitability was impaired by restructuring of operations and pricing pressure
18.3% 15.7%
9.2%1)
0%
5%
10%
15%
20%
25%
30%
Q12012
Q2 Q3 Q4 Q12013
Q2 Q3 Q4 Q12014
Q2 Q3 Q4
Net sales (MEUR) Highlights Q4/2014
42.0 38.6 38.7
05
101520253035404550
Q12012
Q2 Q3 Q4 Q12013
Q2 Q3 Q4 Q12014
Q2 Q3 Q4
EBITA margin Key figures
Regions South and Central contributed to net sales compared to the previous year, while other regions were negatively impacted by continued low activity in the construction sector
Restructuring costs and asset write-downs of EUR 1.5 million were booked in the fourth quarter
Net sales up by 0.1%
Financial Statements Bulletin 2014 l 12 February 2015
1) EBITA excluding non–recurring items was EUR 5.1 million or 13.2% of net sales in October–December 2014 and EUR 22.3 million or 14.6% of net sales in January–December 2014. The non–recurring items included EUR 1.5 million of restructuring costs and asset write-downs booked in the fourth quarter of 2014.
KEY FIGURES
(MEUR) Q4/14 Q4/13 Change FY2014 FY2013 Change
Net sales 38.7 38.6 0.1% 152.8 151.9 0.6%
EBITA 3.61) 6.1 −41.2% 20.81) 25.7 −19.3%
% of net sales 9.2%1) 15.7% 13.6%1) 16.9%
Capex 4.4 6.9 −35.6% 35.8 28.8 24.4%
Personnel 497 547 −9.1% 497 547 −9.1%
Customer
centres 66 74 −10.8% 66 74 −10.8%
EBITA margin excl. non-
recurring items 13.2%
© 2014 Ramirent 14
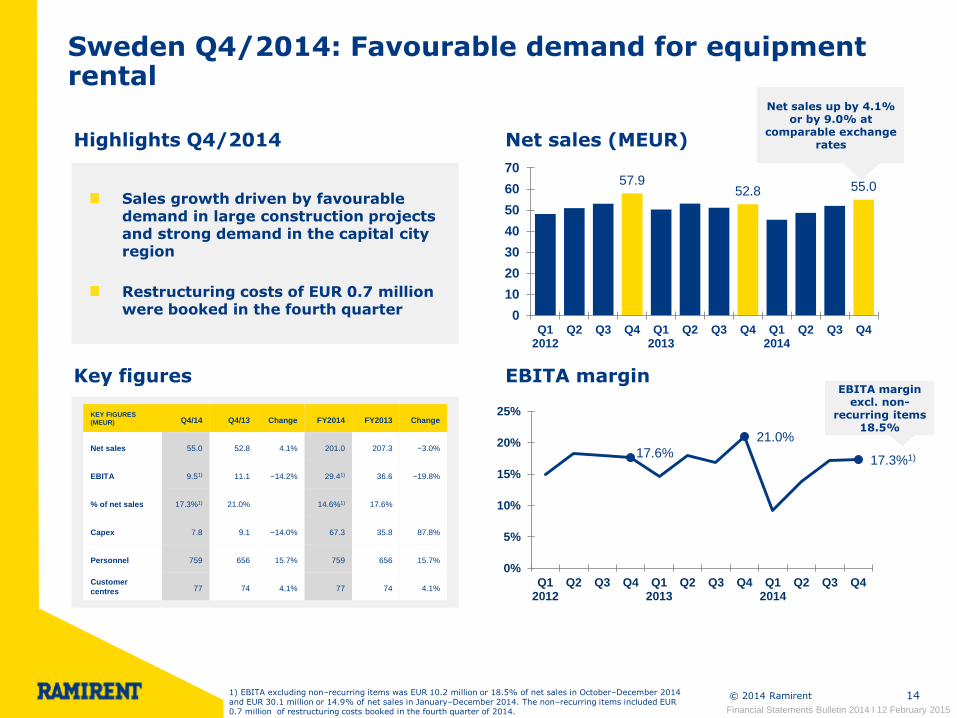
Sweden Q4/2014: Favourable demand for equipment rental
17.6%
21.0%
17.3%1)
0%
5%
10%
15%
20%
25%
Q12012
Q2 Q3 Q4 Q12013
Q2 Q3 Q4 Q12014
Q2 Q3 Q4
Net sales (MEUR) Highlights Q4/2014
57.9 52.8 55.0
0
10
20
30
40
50
60
70
Q12012
Q2 Q3 Q4 Q12013
Q2 Q3 Q4 Q12014
Q2 Q3 Q4
EBITA margin Key figures
Sales growth driven by favourable demand in large construction projects and strong demand in the capital city region
Restructuring costs of EUR 0.7 million were booked in the fourth quarter
Net sales up by 4.1% or by 9.0% at
comparable exchange rates
Financial Statements Bulletin 2014 l 12 February 2015
1) EBITA excluding non–recurring items was EUR 10.2 million or 18.5% of net sales in October–December 2014 and EUR 30.1 million or 14.9% of net sales in January–December 2014. The non–recurring items included EUR 0.7 million of restructuring costs booked in the fourth quarter of 2014.
KEY FIGURES
(MEUR) Q4/14 Q4/13 Change FY2014 FY2013 Change
Net sales 55.0 52.8 4.1% 201.0 207.3 −3.0%
EBITA 9.51) 11.1 −14.2% 29.41) 36.6 −19.8%
% of net sales 17.3%1) 21.0% 14.6%1) 17.6%
Capex 7.8 9.1 −14.0% 67.3 35.8 87.8%
Personnel 759 656 15.7% 759 656 15.7%
Customer
centres 77 74 4.1% 77 74 4.1%
EBITA margin excl. non-
recurring items 18.5%
© 2014 Ramirent 15
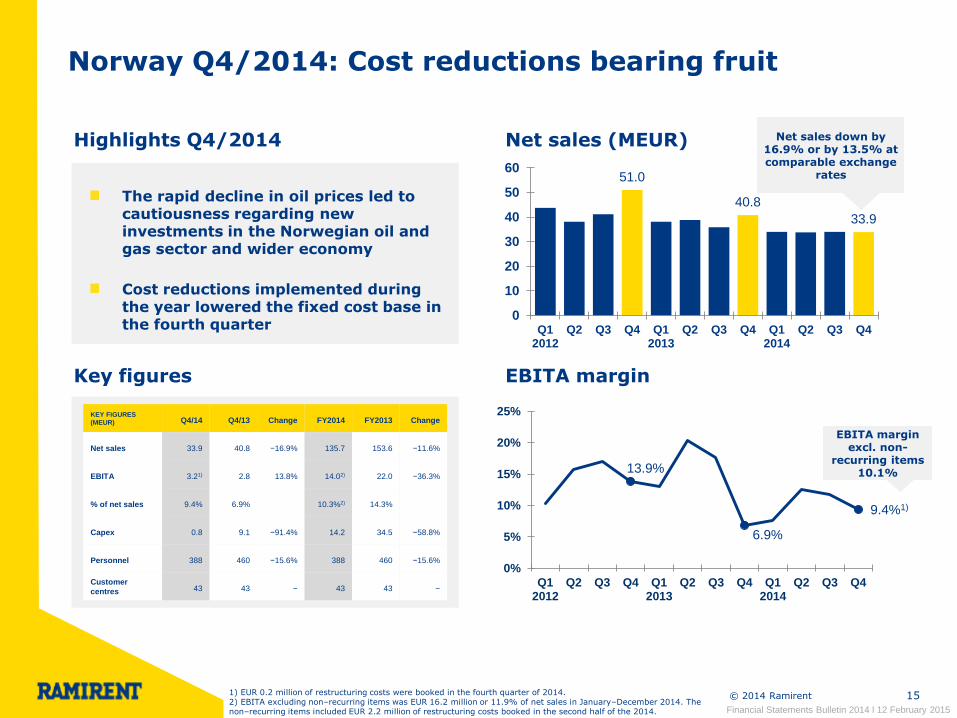
Norway Q4/2014: Cost reductions bearing fruit
13.9%
6.9%
9.4%1)
0%
5%
10%
15%
20%
25%
Q12012
Q2 Q3 Q4 Q12013
Q2 Q3 Q4 Q12014
Q2 Q3 Q4
Net sales (MEUR) Highlights Q4/2014
51.0
40.8
33.9
0
10
20
30
40
50
60
Q12012
Q2 Q3 Q4 Q12013
Q2 Q3 Q4 Q12014
Q2 Q3 Q4
EBITA margin Key figures
The rapid decline in oil prices led to cautiousness regarding new investments in the Norwegian oil and gas sector and wider economy
Cost reductions implemented during the year lowered the fixed cost base in the fourth quarter
Net sales down by 16.9% or by 13.5% at comparable exchange
rates
Financial Statements Bulletin 2014 l 12 February 2015
1) EUR 0.2 million of restructuring costs were booked in the fourth quarter of 2014. 2) EBITA excluding non–recurring items was EUR 16.2 million or 11.9% of net sales in January–December 2014. The non–recurring items included EUR 2.2 million of restructuring costs booked in the second half of the 2014.
KEY FIGURES
(MEUR) Q4/14 Q4/13 Change FY2014 FY2013 Change
Net sales 33.9 40.8 −16.9% 135.7 153.6 −11.6%
EBITA 3.21) 2.8 13.8% 14.02) 22.0 −36.3%
% of net sales 9.4% 6.9% 10.3%2) 14.3%
Capex 0.8 9.1 −91.4% 14.2 34.5 −58.8%
Personnel 388 460 −15.6% 388 460 −15.6%
Customer
centres 43 43 − 43 43 −
EBITA margin excl. non-
recurring items 10.1%
© 2014 Ramirent 16
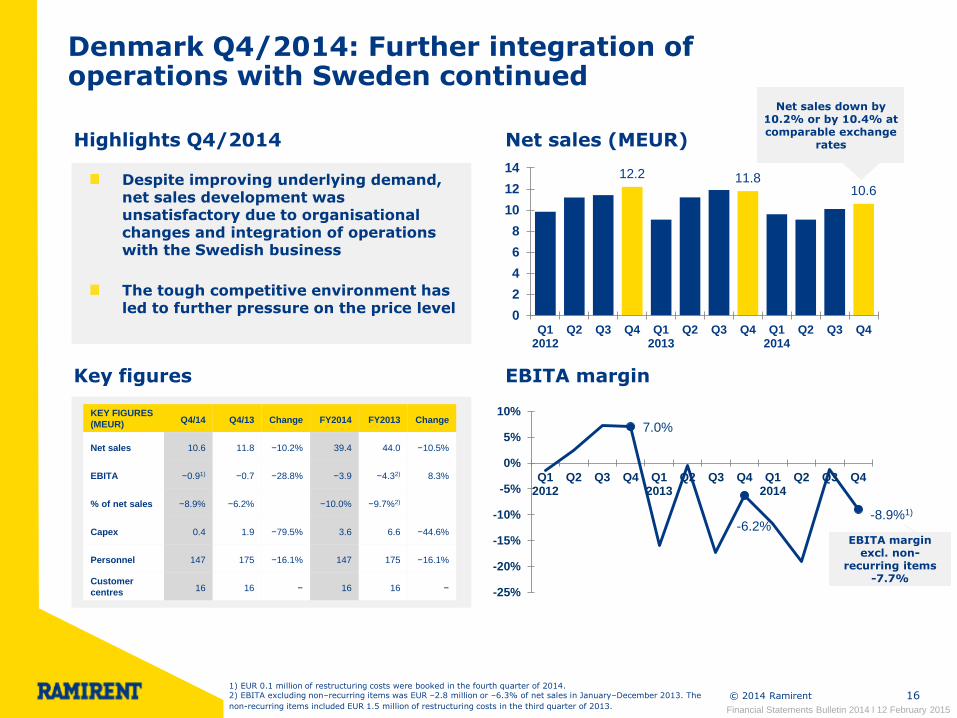
Denmark Q4/2014: Further integration of operations with Sweden continued
7.0%
-6.2% -8.9%1)
-25%
-20%
-15%
-10%
-5%
0%
5%
10%
Q12012
Q2 Q3 Q4 Q12013
Q2 Q3 Q4 Q12014
Q2 Q3 Q4
Net sales (MEUR) Highlights Q4/2014
12.2 11.8 10.6
0
2
4
6
8
10
12
14
Q12012
Q2 Q3 Q4 Q12013
Q2 Q3 Q4 Q12014
Q2 Q3 Q4
EBITA margin Key figures
Despite improving underlying demand, net sales development was unsatisfactory due to organisational changes and integration of operations with the Swedish business
The tough competitive environment has led to further pressure on the price level
Net sales down by 10.2% or by 10.4% at comparable exchange
rates
Financial Statements Bulletin 2014 l 12 February 2015
1) EUR 0.1 million of restructuring costs were booked in the fourth quarter of 2014. 2) EBITA excluding non–recurring items was EUR –2.8 million or –6.3% of net sales in January–December 2013. The
non-recurring items included EUR 1.5 million of restructuring costs in the third quarter of 2013.
KEY FIGURES
(MEUR) Q4/14 Q4/13 Change FY2014 FY2013 Change
Net sales 10.6 11.8 −10.2% 39.4 44.0 −10.5%
EBITA −0.91) −0.7 −28.8% −3.9 −4.32) 8.3%
% of net sales −8.9% −6.2% −10.0% −9.7%2)
Capex 0.4 1.9 −79.5% 3.6 6.6 −44.6%
Personnel 147 175 −16.1% 147 175 −16.1%
Customer
centres 16 16 − 16 16 −
EBITA margin excl. non-
recurring items -7.7%

© 2014 Ramirent 17
Europe East Q4/2014: Strong performance in the Baltics
Net sales (MEUR) Highlights Q4/2014
17.4
8.4 9.2
02468
101214161820
Q12012
Q2 Q3 Q4 Q12013
Q2 Q3 Q4 Q12014
Q2 Q3 Q4
EBITA margin Key figures
Net sales up by 9.4%
113.5%2)
The Baltics
Demand was most favourable in Latvia and Lithuania in the fourth quarter
Profitability strengthened mainly as a result of increased net sales and strict cost control in the Baltics
Fortrent recognised an impairment loss of EUR 0.5 million on all goodwill related to its Ukrainian operations3)
Financial Statements Bulletin 2014 l 12 February 2015
28.9%
32.6%
22.7% 20.1%
27.0%
-5%
0%
5%
10%
15%
20%
25%
30%
35%
40%
Q12012
Q2 Q3 Q4 Q12013
Q2 Q3 Q4 Q12014
Q2 Q3 Q4
KEY FIGURES
(MEUR) Q4/14 Q4/13 Change FY2014 FY2013 Change
Net sales 9.2 8.4 9.4% 33.9 35.5 −4.5%1)
EBITA 2.1 2.7 −23.9% 6.7 17.32) −61.6%
% of net sales 22.7% 32.6% 19.6% 48.8%2)
Capex 1.9 2.7 −31.1% 10.6 9.6 10.3%
Personnel 240 235 2.1% 240 235 2.1%
Customer
centres 42 41 2.4% 42 41 2.4%
1) Adjusted for the transfer of the Russian and Ukrainian operations to Fortrent as of 1 March 2013 the increase in net sales in January–December 2014 was 9.5%. 2) EBITA excluding non–recurring items and EBITA from Russia and Ukraine was EUR 6.0 million or 19.3% of net sales in January–December 2013. The non–recurring items included the non–taxable capital gain of EUR 10.1 million from the formation of Fortrent recorded in the first quarter of 2013. 3) Fortrent recognised an impairment loss on all goodwill related to its Ukrainian operations in the fourth quarter. The impairment had a negative effect of EUR 0.3 million on Ramirent Group.
© 2014 Ramirent 18
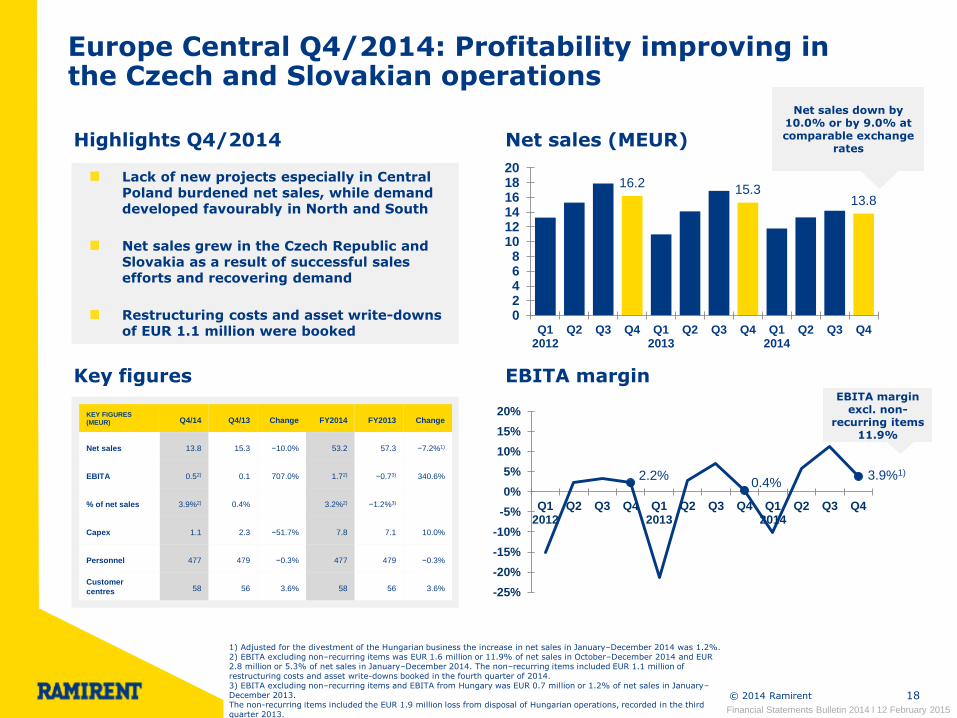
Europe Central Q4/2014: Profitability improving in the Czech and Slovakian operations
2.2% 0.4%
3.9%1)
-25%
-20%
-15%
-10%
-5%
0%
5%
10%
15%
20%
Q12012
Q2 Q3 Q4 Q12013
Q2 Q3 Q4 Q12014
Q2 Q3 Q4
Net sales (MEUR) Highlights Q4/2014
16.2 15.3
13.8
02468
101214161820
Q12012
Q2 Q3 Q4 Q12013
Q2 Q3 Q4 Q12014
Q2 Q3 Q4
EBITA margin Key figures
Net sales down by 10.0% or by 9.0% at comparable exchange
rates
Lack of new projects especially in Central Poland burdened net sales, while demand developed favourably in North and South
Net sales grew in the Czech Republic and Slovakia as a result of successful sales efforts and recovering demand
Restructuring costs and asset write-downs of EUR 1.1 million were booked
Financial Statements Bulletin 2014 l 12 February 2015
KEY FIGURES
(MEUR) Q4/14 Q4/13 Change FY2014 FY2013 Change
Net sales 13.8 15.3 −10.0% 53.2 57.3 −7.2%1)
EBITA 0.52) 0.1 707.0% 1.72) −0.73) 340.6%
% of net sales 3.9%2) 0.4% 3.2%2) −1.2%3)
Capex 1.1 2.3 −51.7% 7.8 7.1 10.0%
Personnel 477 479 −0.3% 477 479 −0.3%
Customer
centres 58 56 3.6% 58 56 3.6%
1) Adjusted for the divestment of the Hungarian business the increase in net sales in January–December 2014 was 1.2%. 2) EBITA excluding non–recurring items was EUR 1.6 million or 11.9% of net sales in October–December 2014 and EUR 2.8 million or 5.3% of net sales in January–December 2014. The non–recurring items included EUR 1.1 million of restructuring costs and asset write-downs booked in the fourth quarter of 2014. 3) EBITA excluding non–recurring items and EBITA from Hungary was EUR 0.7 million or 1.2% of net sales in January–December 2013. The non-recurring items included the EUR 1.9 million loss from disposal of Hungarian operations, recorded in the third quarter 2013.
EBITA margin excl. non-
recurring items 11.9%
© 2014 Ramirent © 2014 Ramirent
Group performance
Segment review
Market outlook
Key figures
Financial position
Company overview
Appendix
19
© 2014 Ramirent 20
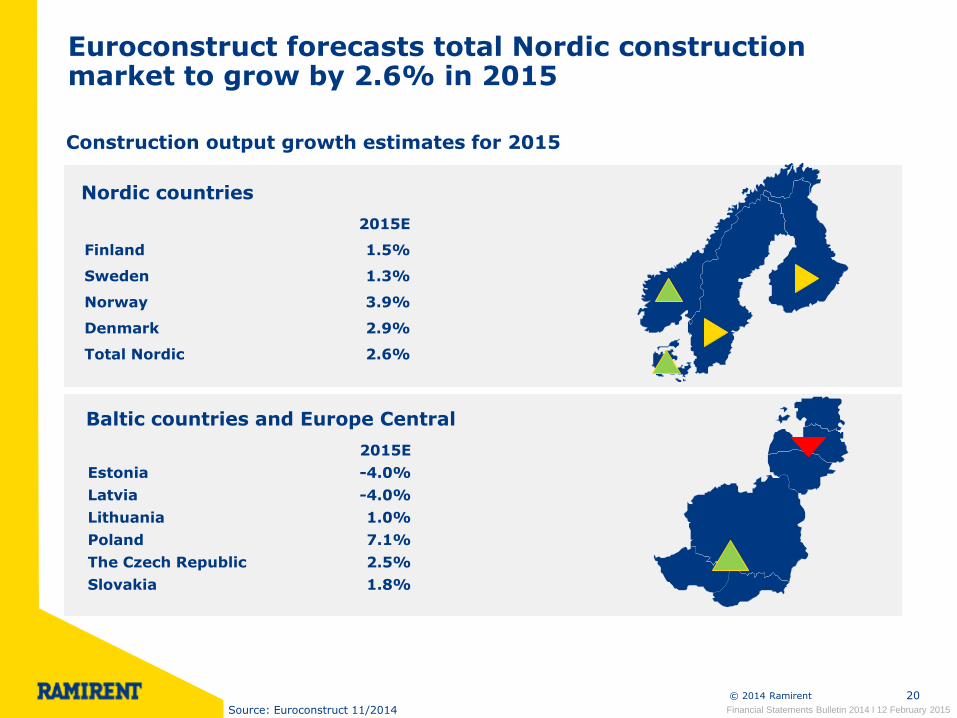
Euroconstruct forecasts total Nordic construction market to grow by 2.6% in 2015
Construction output growth estimates for 2015
Nordic countries
Baltic countries and Europe Central
2015E
Finland 1.5%
Sweden 1.3%
Norway 3.9%
Denmark 2.9%
Total Nordic 2.6%
2015E
Estonia -4.0%
Latvia -4.0%
Lithuania 1.0%
Poland 7.1%
The Czech Republic 2.5%
Slovakia 1.8%
Source: Euroconstruct 11/2014
Financial Statements Bulletin 2014 l 12 February 2015
© 2014 Ramirent 21
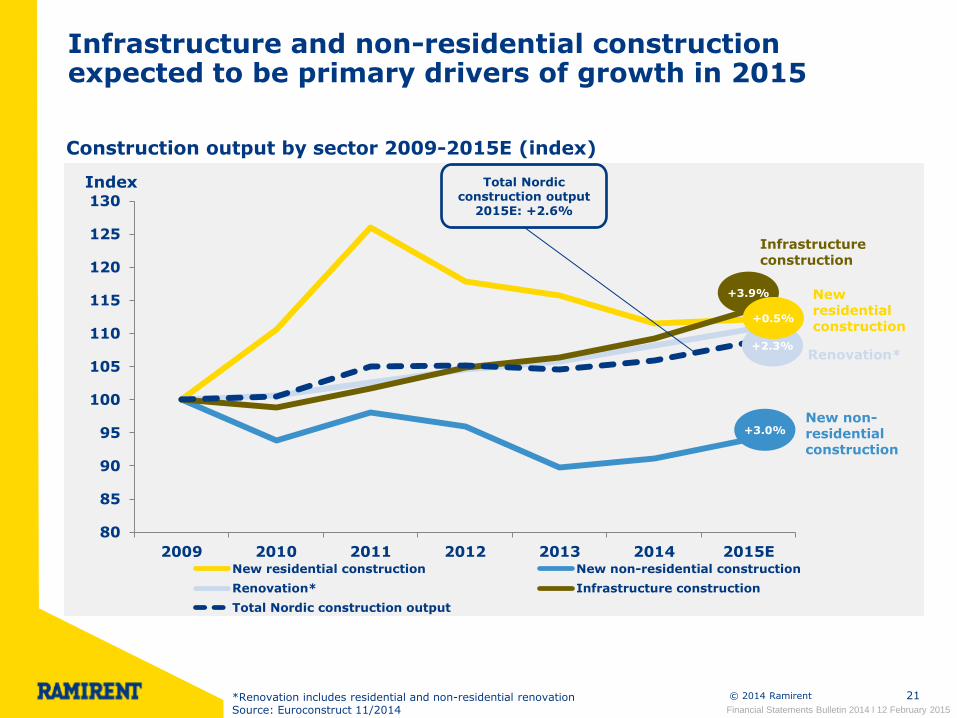
Infrastructure and non-residential construction expected to be primary drivers of growth in 2015
Construction output by sector 2009-2015E (index)
Financial Statements Bulletin 2014 l 12 February 2015
80
85
90
95
100
105
110
115
120
125
130
2009 2010 2011 2012 2013 2014 2015ENew residential construction New non-residential construction
Renovation* Infrastructure construction
Total Nordic construction output
Index
+3.9%
+3.0%
+2.3%
Total Nordic construction output
2015E: +2.6%
New residential construction
Infrastructure construction
Renovation*
New non-residential construction
+0.5%
*Renovation includes residential and non-residential renovation Source: Euroconstruct 11/2014
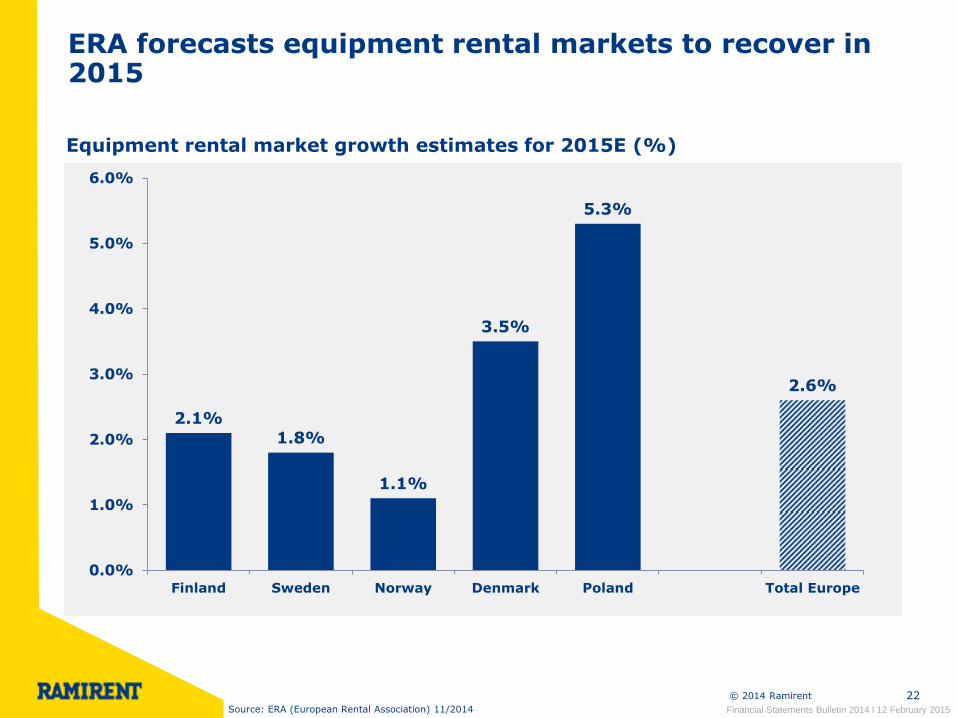
© 2014 Ramirent 22
ERA forecasts equipment rental markets to recover in 2015
Equipment rental market growth estimates for 2015E (%)
2.1%
1.8%
1.1%
3.5%
5.3%
2.6%
0.0%
1.0%
2.0%
3.0%
4.0%
5.0%
6.0%
Finland Sweden Norway Denmark Poland Total Europe
Source: ERA (European Rental Association) 11/2014
Financial Statements Bulletin 2014 l 12 February 2015
© 2014 Ramirent 23
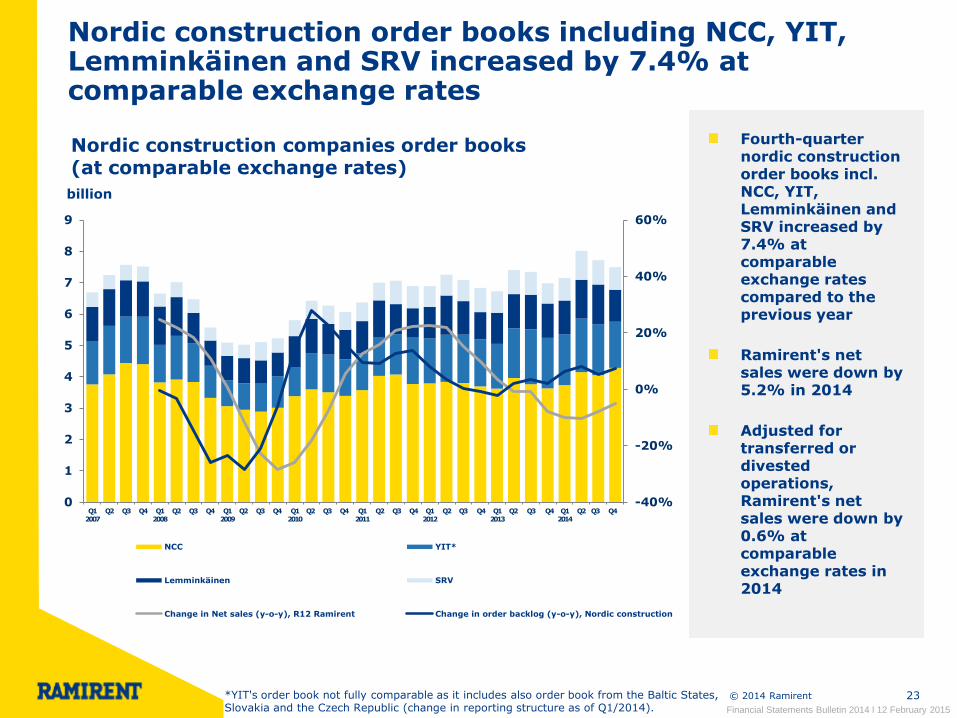
Nordic construction order books including NCC, YIT, Lemminkäinen and SRV increased by 7.4% at comparable exchange rates
Nordic construction companies order books (at comparable exchange rates)
billion
Fourth-quarter nordic construction order books incl. NCC, YIT, Lemminkäinen and SRV increased by 7.4% at comparable exchange rates compared to the previous year
Ramirent's net sales were down by 5.2% in 2014
Adjusted for transferred or divested operations, Ramirent's net sales were down by 0.6% at comparable exchange rates in 2014
*YIT's order book not fully comparable as it includes also order book from the Baltic States, Slovakia and the Czech Republic (change in reporting structure as of Q1/2014).
-40%
-20%
0%
20%
40%
60%
0
1
2
3
4
5
6
7
8
9
Q1 2007
Q2 Q3 Q4 Q1 2008
Q2 Q3 Q4 Q1 2009
Q2 Q3 Q4 Q1 2010
Q2 Q3 Q4 Q1 2011
Q2 Q3 Q4 Q1 2012
Q2 Q3 Q4 Q1 2013
Q2 Q3 Q4 Q1 2014
Q2 Q3 Q4
NCC YIT*
Lemminkäinen SRV
Change in Net sales (y-o-y), R12 Ramirent Change in order backlog (y-o-y), Nordic construction
Financial Statements Bulletin 2014 l 12 February 2015
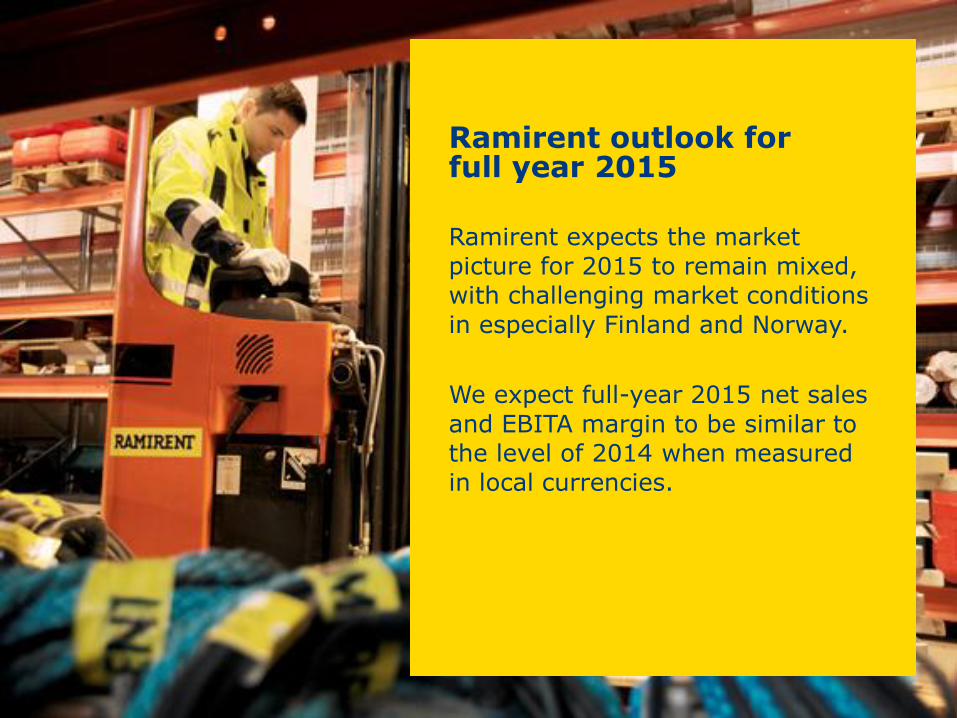
Ramirent expects the market
picture for 2015 to remain mixed,
with challenging market conditions
in especially Finland and Norway.
We expect full-year 2015 net sales
and EBITA margin to be similar to
the level of 2014 when measured
in local currencies.
Ramirent outlook for full year 2015
© 2014 Ramirent © 2014 Ramirent
Group performance
Segment review
Market outlook
Key figures
Financial position
Company overview
Appendix
26
Finland Sweden Norway Denmark Baltics Central
Net
Sale
s
(M
EU
R)
EB
IT
A m
arg
in e
xcl.
n
on
-recu
rrin
g i
tem
s
(%
)
1-12/2013 1-12/2014
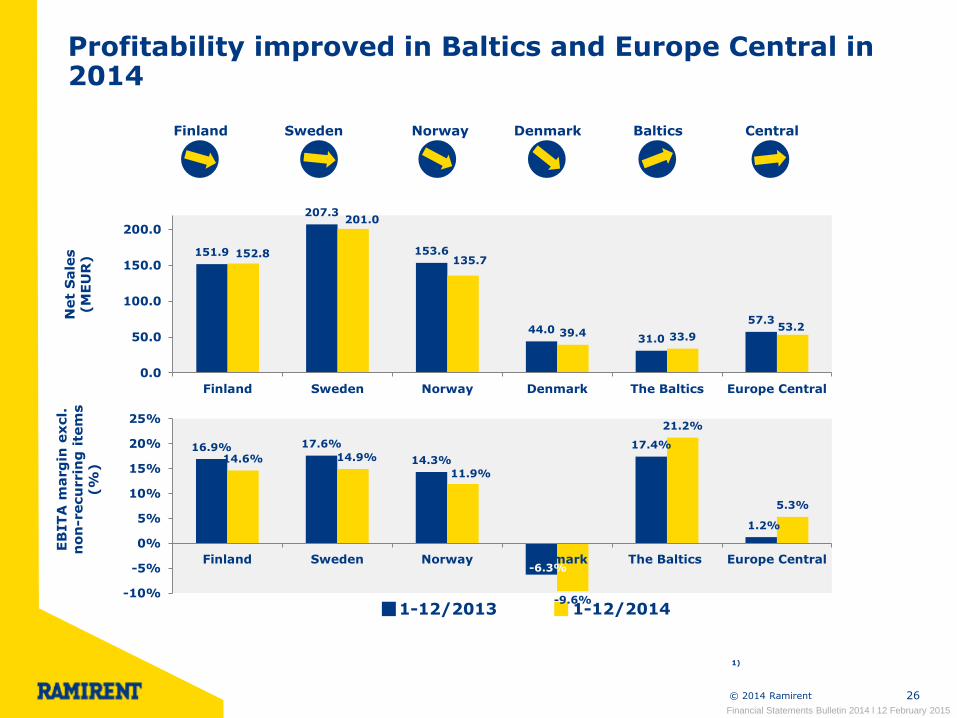
Profitability improved in Baltics and Europe Central in 2014
16.9% 17.6%
14.3%
-6.3%
17.4%
1.2%
14.6% 14.9%
11.9%
-9.6%
21.2%
5.3%
-10%
-5%
0%
5%
10%
15%
20%
25%
Finland Sweden Norway Denmark The Baltics Europe Central
151.9
207.3
153.6
44.0 31.0
57.3
152.8
201.0
135.7
39.4 33.9 53.2
0.0
50.0
100.0
150.0
200.0
Finland Sweden Norway Denmark The Baltics Europe Central
© 2014 Ramirent
1)
Financial Statements Bulletin 2014 l 12 February 2015

© 2014 Ramirent 27
Fourth-quarter sales were impacted by unfavourable changes in foreign exchange rates and lower sales of used equipment
Net sales (MEUR) Breakdown of net sales (MEUR)
104.8 102.8
51.9 50.3
10.8 7.6
0
20
40
60
80
100
120
140
160
180
Q4/2013 Q4/2014
Income from sold equipment
Ancillary income
Rental income
−1.9%
−3.1%
−29.9%
167.5
-4.1 -2.7
160.7
0
20
40
60
80
100
120
140
160
180
Q4/2013reported
Exchange rates Underlyingchange
Q4/2014reported
Weakening of the Swedish krona and Norwegian krone impacted negatively on the net sales in euros
The rapid decline in oil prices led to cautiousness in new investments in the Norwegian oil and gas sector Sales of used equipment were clearly below last year's level in the fourth quarter
Financial Statements Bulletin 2014 l 12 February 2015
© 2014 Ramirent 28
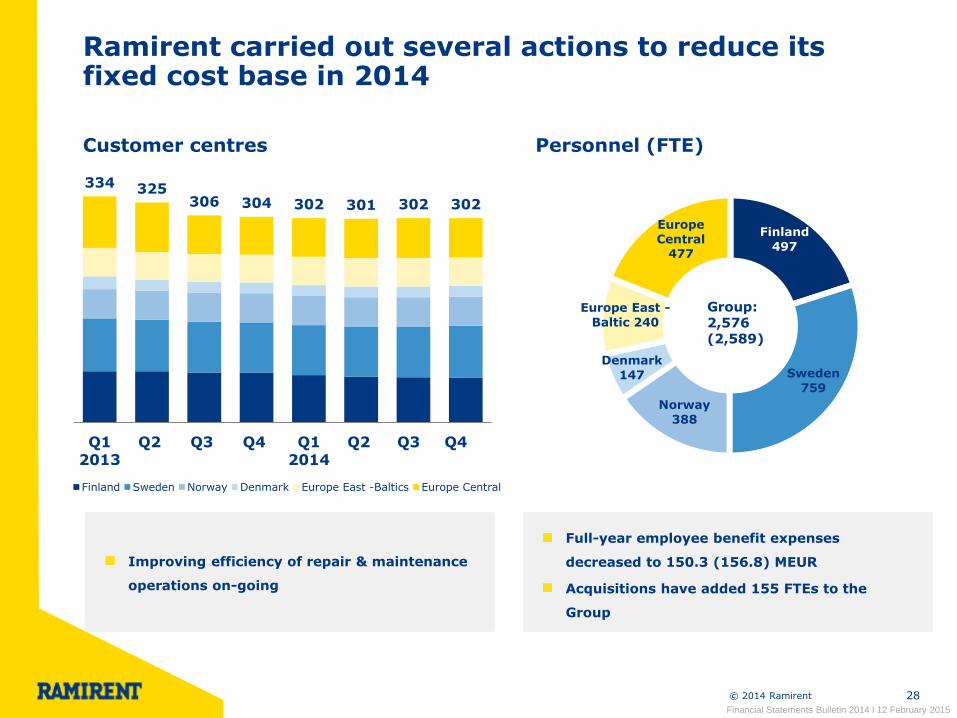
Ramirent carried out several actions to reduce its fixed cost base in 2014
Customer centres Personnel (FTE)
334 325 306 304 302 301 302 302
Q12013
Q2 Q3 Q4 Q12014
Q2 Q3 Q4
Finland Sweden Norway Denmark Europe East -Baltics Europe Central
Improving efficiency of repair & maintenance
operations on-going
Full-year employee benefit expenses
decreased to 150.3 (156.8) MEUR
Acquisitions have added 155 FTEs to the
Group
Financial Statements Bulletin 2014 l 12 February 2015
Finland
497
Sweden
759
Norway
388
Denmark
147
Europe East -
Baltic 240
Europe
Central 477
Group: 2,576 (2,589)
© 2014 Ramirent 29
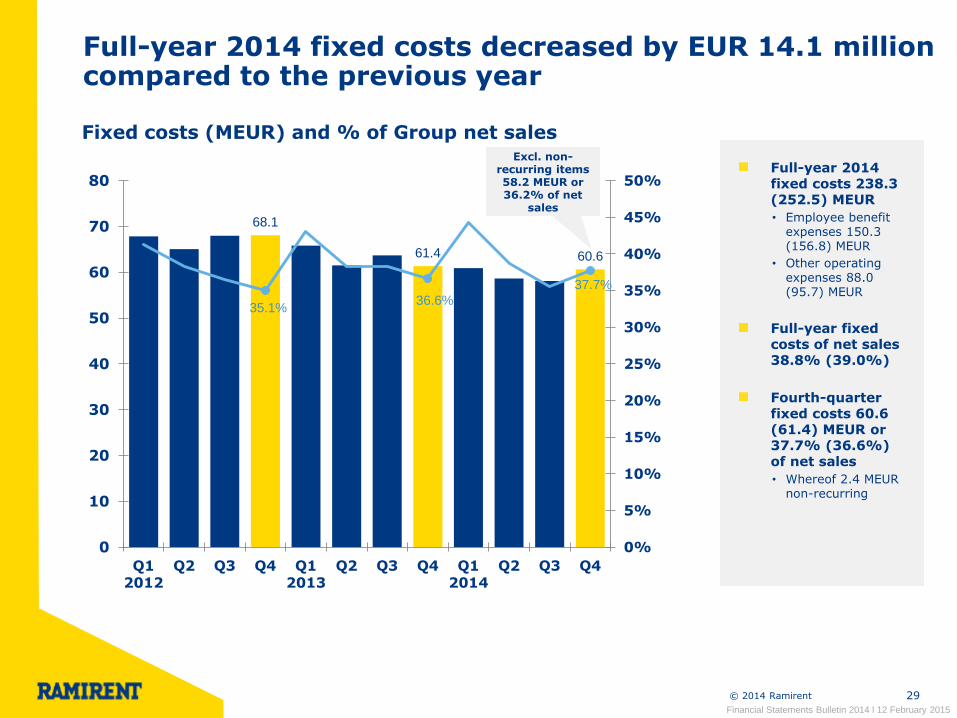
Full-year 2014 fixed costs decreased by EUR 14.1 million compared to the previous year
Fixed costs (MEUR) and % of Group net sales
68.1
61.4 60.6
35.1% 36.6%
37.7%
0%
5%
10%
15%
20%
25%
30%
35%
40%
45%
50%
0
10
20
30
40
50
60
70
80
Q12012
Q2 Q3 Q4 Q12013
Q2 Q3 Q4 Q12014
Q2 Q3 Q4
Full-year 2014 fixed costs 238.3 (252.5) MEUR
• Employee benefit expenses 150.3 (156.8) MEUR
• Other operating expenses 88.0 (95.7) MEUR
Full-year fixed costs of net sales 38.8% (39.0%)
Fourth-quarter fixed costs 60.6 (61.4) MEUR or 37.7% (36.6%) of net sales
• Whereof 2.4 MEUR non-recurring
Financial Statements Bulletin 2014 l 12 February 2015
Excl. non-recurring items 58.2 MEUR or 36.2% of net
sales
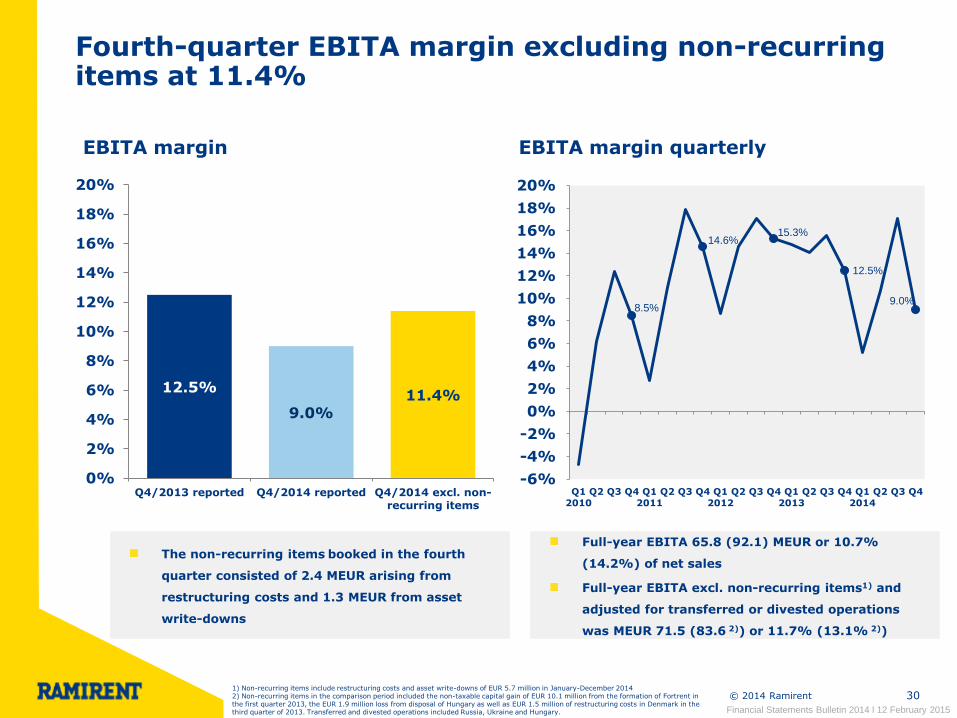
© 2014 Ramirent 30
Fourth-quarter EBITA margin excluding non-recurring items at 11.4%
8.5%
14.6% 15.3%
12.5%
9.0%
-6%
-4%
-2%
0%
2%
4%
6%
8%
10%
12%
14%
16%
18%
20%
Q1
2010
Q2 Q3 Q4 Q1
2011
Q2 Q3 Q4 Q1
2012
Q2 Q3 Q4 Q1
2013
Q2 Q3 Q4 Q1
2014
Q2 Q3 Q4
12.5%
9.0% 11.4%
0%
2%
4%
6%
8%
10%
12%
14%
16%
18%
20%
Q4/2013 reported Q4/2014 reported Q4/2014 excl. non-recurring items
The non-recurring items booked in the fourth
quarter consisted of 2.4 MEUR arising from
restructuring costs and 1.3 MEUR from asset
write-downs
Full-year EBITA 65.8 (92.1) MEUR or 10.7%
(14.2%) of net sales
Full-year EBITA excl. non-recurring items1) and
adjusted for transferred or divested operations
was MEUR 71.5 (83.6 2)) or 11.7% (13.1% 2))
EBITA margin EBITA margin quarterly
Financial Statements Bulletin 2014 l 12 February 2015
1) Non-recurring items include restructuring costs and asset write-downs of EUR 5.7 million in January-December 2014 2) Non-recurring items in the comparison period included the non-taxable capital gain of EUR 10.1 million from the formation of Fortrent in the first quarter 2013, the EUR 1.9 million loss from disposal of Hungary as well as EUR 1.5 million of restructuring costs in Denmark in the third quarter of 2013. Transferred and divested operations included Russia, Ukraine and Hungary.
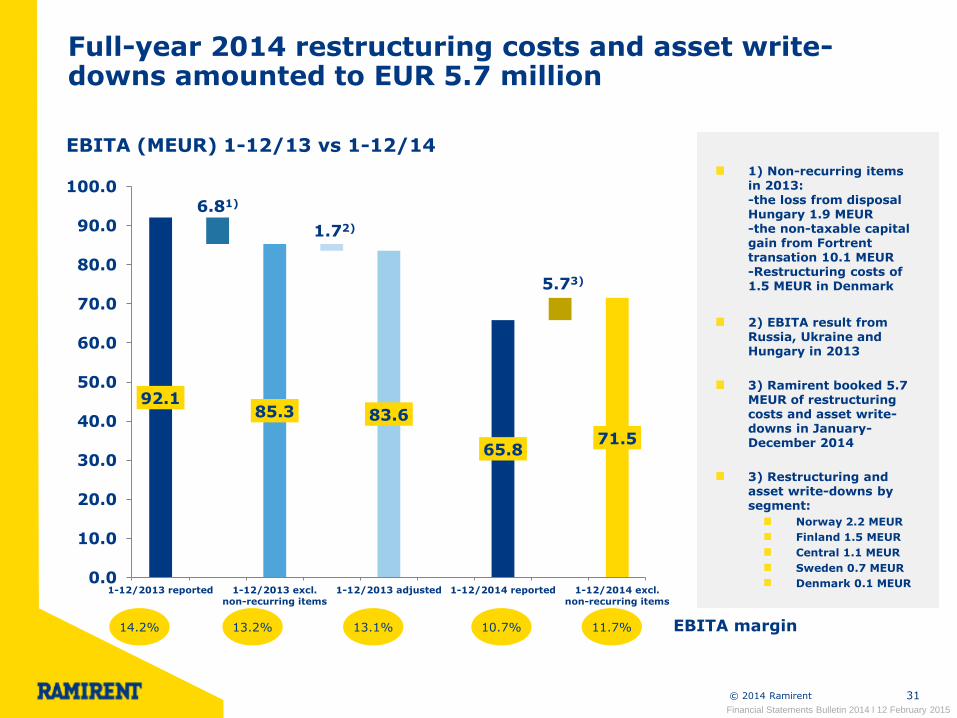
© 2014 Ramirent 31
Full-year 2014 restructuring costs and asset write-downs amounted to EUR 5.7 million
92.1 83.6
65.8
6.81)
85.3
1.72)
71.5
0.0
10.0
20.0
30.0
40.0
50.0
60.0
70.0
80.0
90.0
100.0
1-12/2013 reported 1-12/2013 excl.
non-recurring items
1-12/2013 adjusted 1-12/2014 reported 1-12/2014 excl.
non-recurring items
EBITA (MEUR) 1-12/13 vs 1-12/14
1) Non-recurring items in 2013: -the loss from disposal Hungary 1.9 MEUR -the non-taxable capital gain from Fortrent transation 10.1 MEUR -Restructuring costs of 1.5 MEUR in Denmark
2) EBITA result from Russia, Ukraine and Hungary in 2013
3) Ramirent booked 5.7 MEUR of restructuring costs and asset write-downs in January-December 2014
3) Restructuring and asset write-downs by segment:
Norway 2.2 MEUR
Finland 1.5 MEUR
Central 1.1 MEUR
Sweden 0.7 MEUR
Denmark 0.1 MEUR
14.2% 13.1% 10.7% EBITA margin 13.2% 11.7%
Financial Statements Bulletin 2014 l 12 February 2015
5.73)
© 2014 Ramirent 32
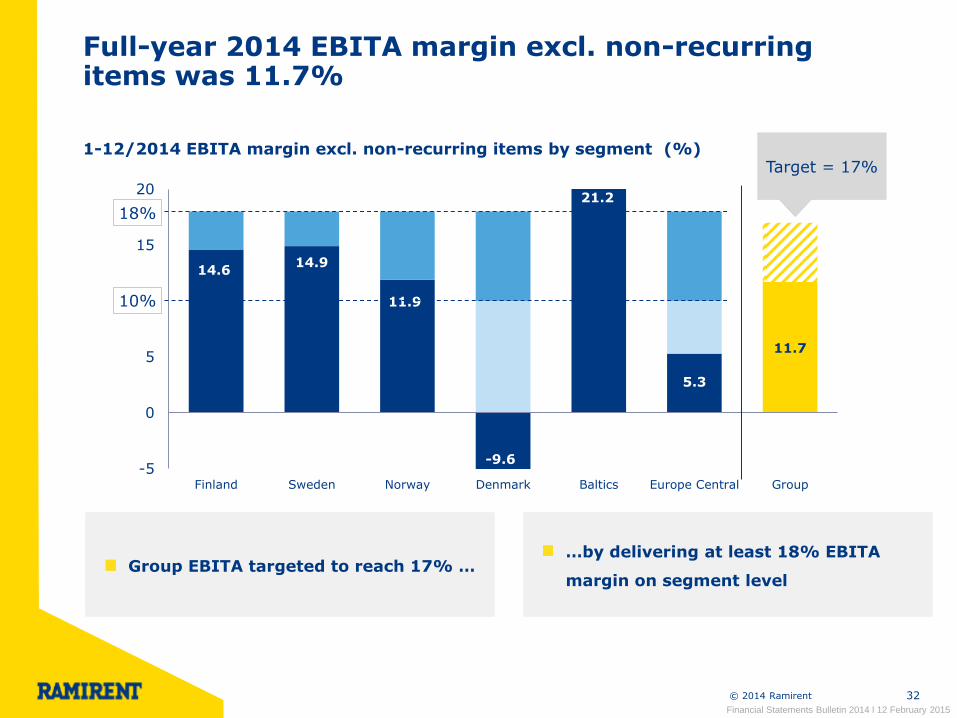
Full-year 2014 EBITA margin excl. non-recurring items was 11.7%
1-12/2014 EBITA margin excl. non-recurring items by segment (%)
14.6 14.9
11.9
-9.6
21.2
5.3
11.7
-5
0
5
10
15
20
Finland Sweden Norway Denmark Baltics Europe Central Group
Group EBITA targeted to reach 17% … …by delivering at least 18% EBITA
margin on segment level
18%
10%
Financial Statements Bulletin 2014 l 12 February 2015
Target = 17%
© 2014 Ramirent 33
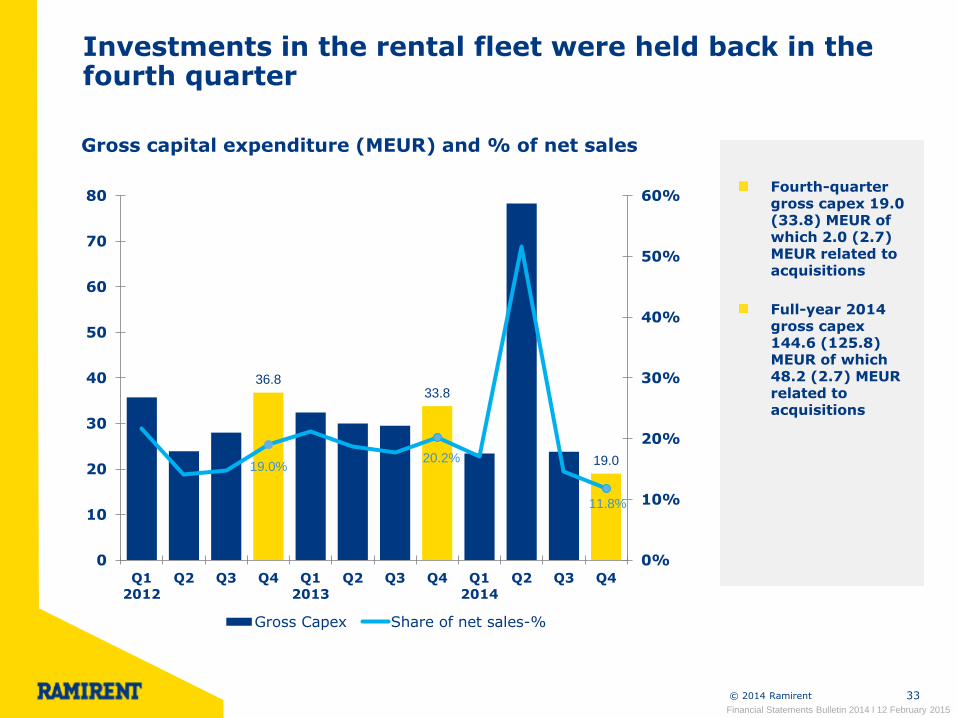
Investments in the rental fleet were held back in the fourth quarter
Gross capital expenditure (MEUR) and % of net sales
36.8 33.8
19.0 19.0% 20.2%
11.8%
0%
10%
20%
30%
40%
50%
60%
0
10
20
30
40
50
60
70
80
Q1
2012
Q2 Q3 Q4 Q1
2013
Q2 Q3 Q4 Q1
2014
Q2 Q3 Q4
Gross Capex Share of net sales-%
Fourth-quarter gross capex 19.0 (33.8) MEUR of which 2.0 (2.7) MEUR related to acquisitions
Full-year 2014 gross capex 144.6 (125.8) MEUR of which 48.2 (2.7) MEUR related to acquisitions
Financial Statements Bulletin 2014 l 12 February 2015
© 2014 Ramirent 34
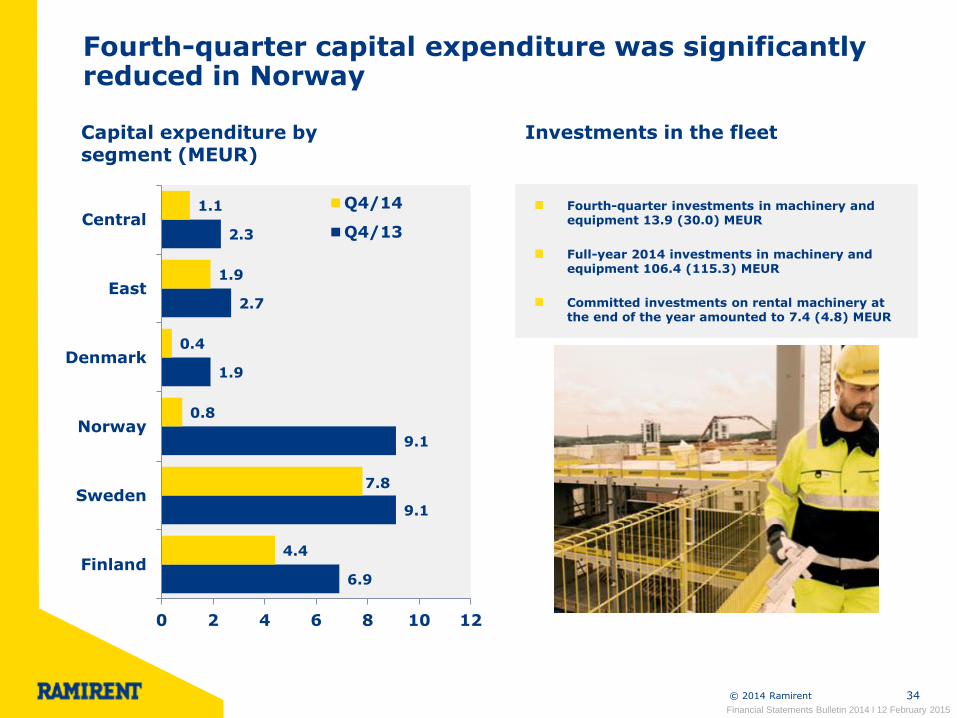
Fourth-quarter capital expenditure was significantly reduced in Norway
Capital expenditure by segment (MEUR)
Investments in the fleet
6.9
9.1
9.1
1.9
2.7
2.3
4.4
7.8
0.8
0.4
1.9
1.1
0 2 4 6 8 10 12
Finland
Sweden
Norway
Denmark
East
CentralQ4/14
Q4/13
Fourth-quarter investments in machinery and equipment 13.9 (30.0) MEUR
Full-year 2014 investments in machinery and equipment 106.4 (115.3) MEUR
Committed investments on rental machinery at the end of the year amounted to 7.4 (4.8) MEUR
Financial Statements Bulletin 2014 l 12 February 2015
© 2014 Ramirent 35
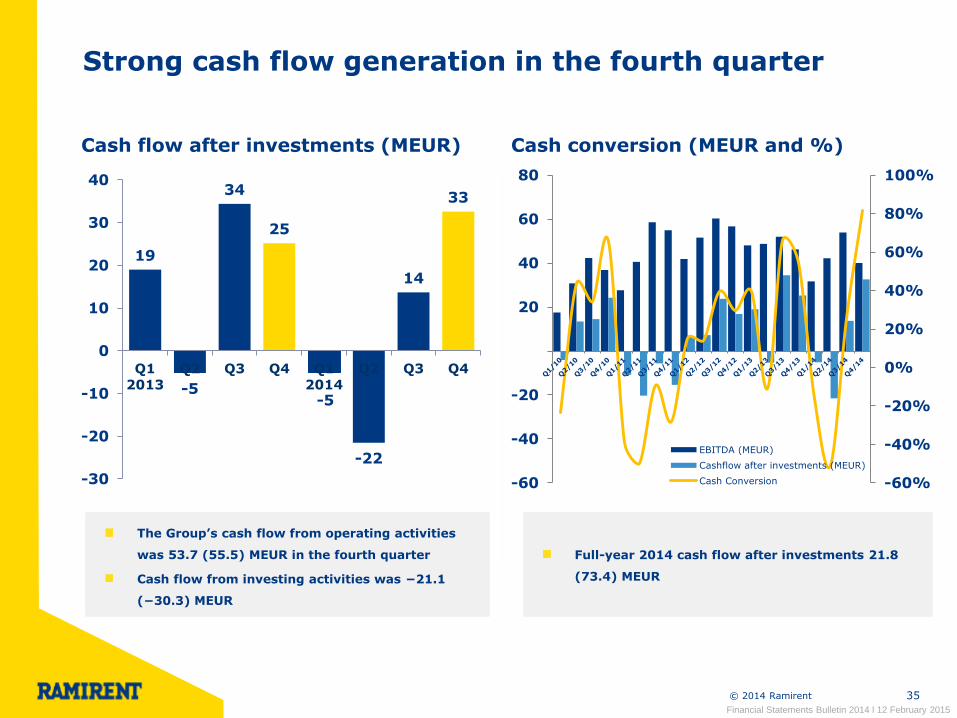
Strong cash flow generation in the fourth quarter
-60%
-40%
-20%
0%
20%
40%
60%
80%
100%
-60
-40
-20
20
40
60
80
EBITDA (MEUR)
Cashflow after investments (MEUR)
Cash Conversion
Cash flow after investments (MEUR) Cash conversion (MEUR and %)
19
-5
34
25
-5
-22
14
33
-30
-20
-10
0
10
20
30
40
Q1
2013
Q2 Q3 Q4 Q1
2014
Q2 Q3 Q4
The Group’s cash flow from operating activities
was 53.7 (55.5) MEUR in the fourth quarter
Cash flow from investing activities was −21.1
(−30.3) MEUR
Full-year 2014 cash flow after investments 21.8
(73.4) MEUR
Financial Statements Bulletin 2014 l 12 February 2015
© 2014 Ramirent 36
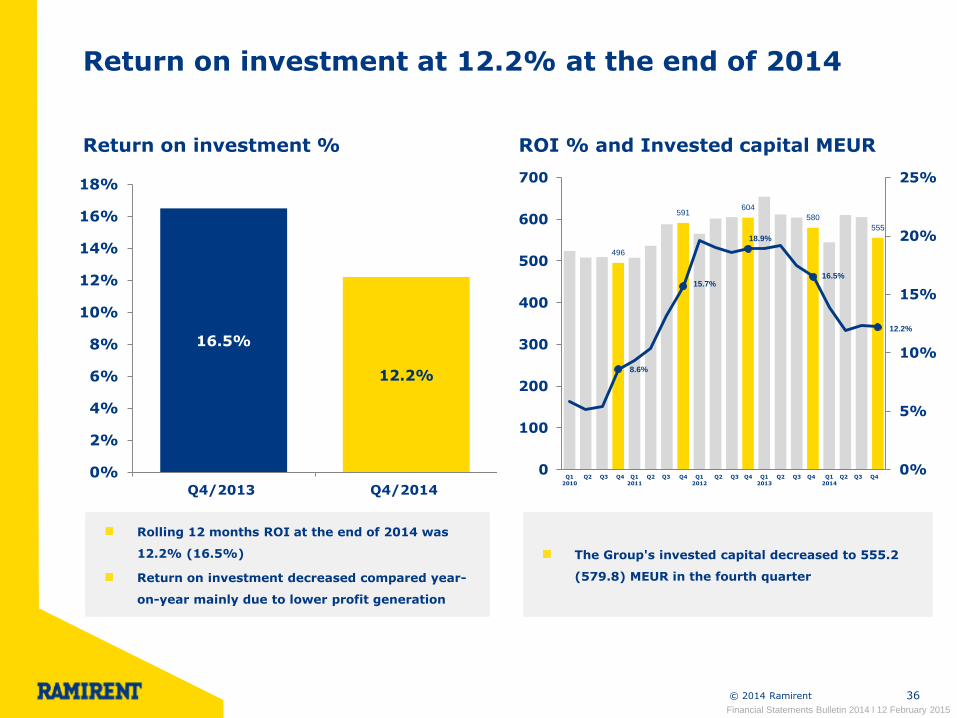
Return on investment at 12.2% at the end of 2014
Return on investment % ROI % and Invested capital MEUR
16.5%
12.2%
0%
2%
4%
6%
8%
10%
12%
14%
16%
18%
Q4/2013 Q4/2014
496
591 604
580
555
8.6%
15.7%
18.9%
16.5%
12.2%
0%
5%
10%
15%
20%
25%
0
100
200
300
400
500
600
700
Q1
2010
Q2 Q3 Q4 Q1
2011
Q2 Q3 Q4 Q1
2012
Q2 Q3 Q4 Q1
2013
Q2 Q3 Q4 Q1
2014
Q2 Q3 Q4
Rolling 12 months ROI at the end of 2014 was
12.2% (16.5%)
Return on investment decreased compared year-
on-year mainly due to lower profit generation
The Group's invested capital decreased to 555.2
(579.8) MEUR in the fourth quarter
Financial Statements Bulletin 2014 l 12 February 2015

© 2014 Ramirent 37
Return on equity at 9.4% at the end of 2014
Return on equity % ROE % and Total equity (MEUR)
14.7%
9.4%
0%
2%
4%
6%
8%
10%
12%
14%
16%
18%
20%
Q4/2013 Q4/2014
318 326
364 371
325
4.7%
13.9%
18.6%
14.7%
9.4%
-5%
0%
5%
10%
15%
20%
25%
0
50
100
150
200
250
300
350
400
Q1
2010
Q2 Q3 Q4 Q1
2011
Q2 Q3 Q4 Q1
2012
Q2 Q3 Q4 Q1
2013
Q2 Q3 Q4 Q1
2014
Q2 Q3 Q4
Rolling 12 months ROE at the end of 2014 was
9.4% (14.7%)
Long-term financial target: ROE of 18% over a
business cycle
The Group's total equity amounted to MEUR 325.0
(371.0) at the end of December
Equity per share was 3.01 (3.44) at the of
December
Target 18%
Financial Statements Bulletin 2014 l 12 February 2015

© 2014 Ramirent © 2014 Ramirent 38
Group performance
Segment review
Market outlook
Key figures
Financial position
Company overview
Appendix
© 2014 Ramirent 39
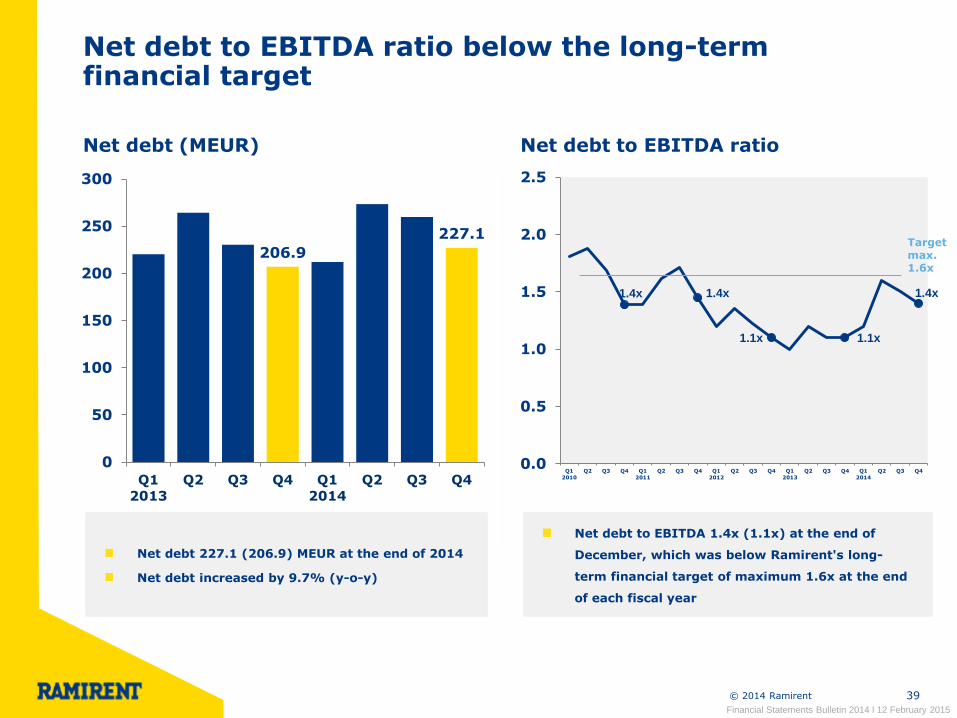
Net debt to EBITDA ratio below the long-term financial target
Net debt (MEUR) Net debt to EBITDA ratio
206.9
227.1
0
50
100
150
200
250
300
Q1
2013
Q2 Q3 Q4 Q1
2014
Q2 Q3 Q4
1.4x 1.4x
1.1x 1.1x
1.4x
0.0
0.5
1.0
1.5
2.0
2.5
Q1
2010
Q2 Q3 Q4 Q1
2011
Q2 Q3 Q4 Q1
2012
Q2 Q3 Q4 Q1
2013
Q2 Q3 Q4 Q1
2014
Q2 Q3 Q4
Net debt 227.1 (206.9) MEUR at the end of 2014
Net debt increased by 9.7% (y-o-y)
Net debt to EBITDA 1.4x (1.1x) at the end of
December, which was below Ramirent's long-
term financial target of maximum 1.6x at the end
of each fiscal year
Financial Statements Bulletin 2014 l 12 February 2015
Target max. 1.6x
© 2014 Ramirent 40
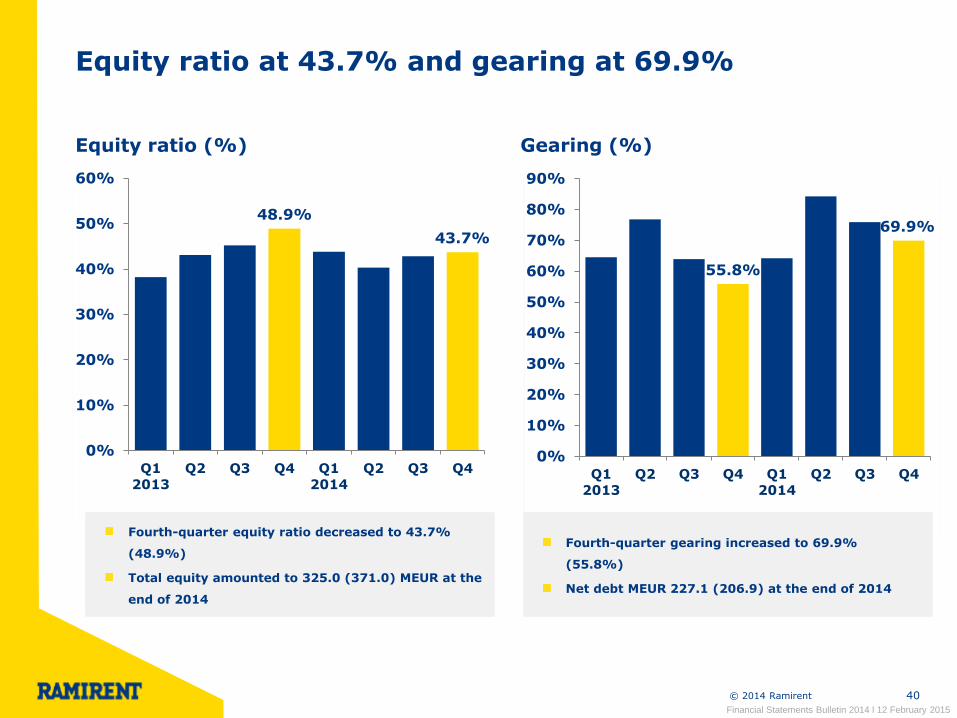
Equity ratio at 43.7% and gearing at 69.9%
Equity ratio (%) Gearing (%)
48.9%
43.7%
0%
10%
20%
30%
40%
50%
60%
Q1
2013
Q2 Q3 Q4 Q1
2014
Q2 Q3 Q4
55.8%
69.9%
0%
10%
20%
30%
40%
50%
60%
70%
80%
90%
Q1
2013
Q2 Q3 Q4 Q1
2014
Q2 Q3 Q4
Fourth-quarter equity ratio decreased to 43.7%
(48.9%)
Total equity amounted to 325.0 (371.0) MEUR at the
end of 2014
Fourth-quarter gearing increased to 69.9%
(55.8%)
Net debt MEUR 227.1 (206.9) at the end of 2014
Financial Statements Bulletin 2014 l 12 February 2015
© 2014 Ramirent 41
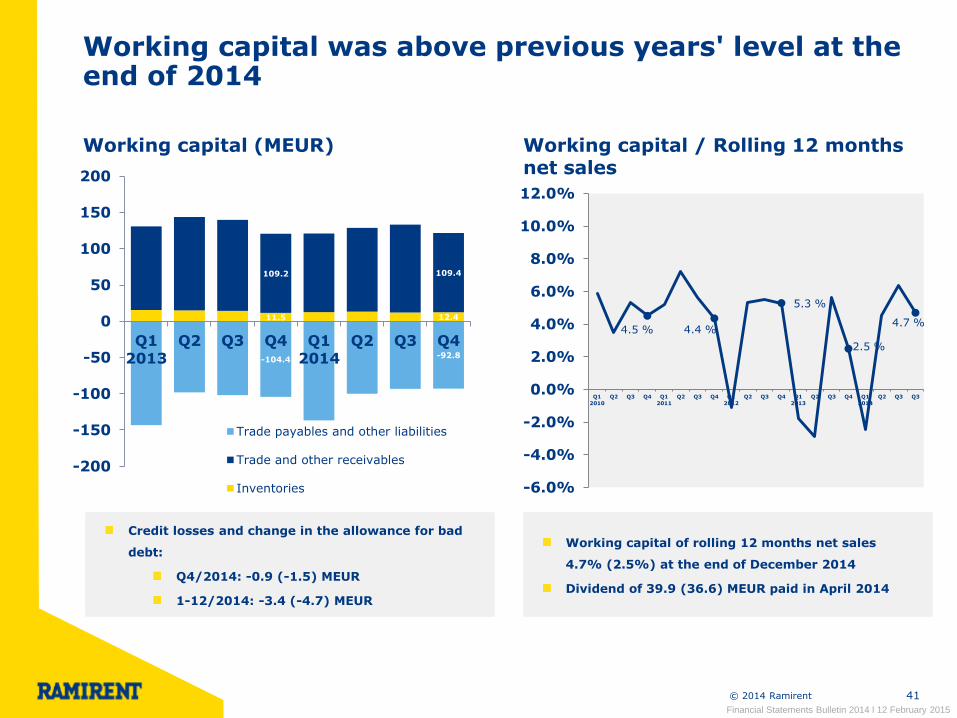
Working capital was above previous years' level at the end of 2014
Working capital (MEUR) Working capital / Rolling 12 months net sales
4.5 % 4.4 %
5.3 %
2.5 %
4.7 %
-6.0%
-4.0%
-2.0%
0.0%
2.0%
4.0%
6.0%
8.0%
10.0%
12.0%
Q1
2010
Q2 Q3 Q4 Q1
2011
Q2 Q3 Q4 Q1
2012
Q2 Q3 Q4 Q1
2013
Q2 Q3 Q4 Q1
2014
Q2 Q3 Q3
11.5 12.4
109.2 109.4
-104.4 -92.8
-200
-150
-100
-50
0
50
100
150
200
Q12013
Q2 Q3 Q4 Q12014
Q2 Q3 Q4
Trade payables and other liabilities
Trade and other receivables
Inventories
Credit losses and change in the allowance for bad
debt:
Q4/2014: -0.9 (-1.5) MEUR
1-12/2014: -3.4 (-4.7) MEUR
Working capital of rolling 12 months net sales
4.7% (2.5%) at the end of December 2014
Dividend of 39.9 (36.6) MEUR paid in April 2014
Financial Statements Bulletin 2014 l 12 February 2015

© 2014 Ramirent 42
At the end of 2014, Ramirent had unused committed back–up loan facilities of EUR 188.7 million
Repayment schedule of interest-bearing liabilities (MEUR) Ramirent had unused committed back-up loan facilities of MEUR 188.7 available at the end of the 2014
The average interest rate of the loan portfolio including interest rate hedges was 3.1% (3.9%) at the end of the 2014
In addition to bank facilities, Ramirent is utilising a domestic commercial paper program of up to EUR 150 million
Net debt EUR 227.1 million
EUR 415.0 million in committed credit facilities
Senior unsecured bond
Financial Statements Bulletin 2014 l 12 February 2015
75
95
100
145
2015 2016 2017 2018 2019 2020
© 2014 Ramirent 43
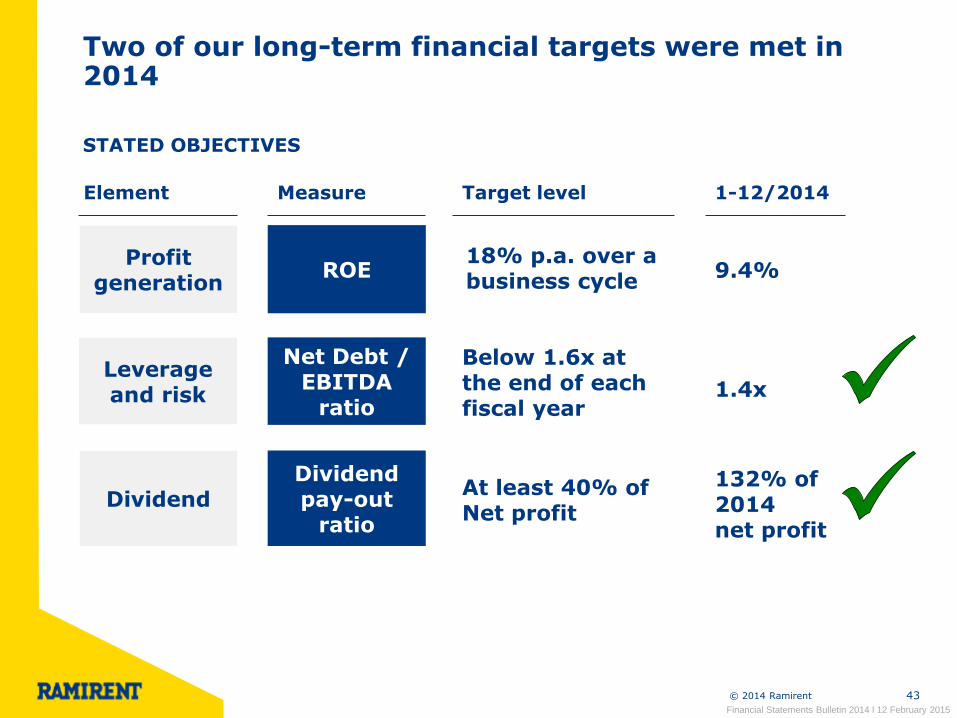
Two of our long-term financial targets were met in 2014
Leverage and risk
Profit generation
Dividend
Element Target level
ROE
Net Debt / EBITDA
ratio
Dividend pay-out
ratio
18% p.a. over a business cycle
Below 1.6x at the end of each fiscal year
At least 40% of Net profit
Measure 1-12/2014
9.4%
1.4x
132% of 2014 net profit
STATED OBJECTIVES
Financial Statements Bulletin 2014 l 12 February 2015

For further information:
Magnus Rosén, President and CEO, tel. +358 20 750 2845 Jonas Söderkvist, CFO, tel. +358 20 750 3248 Franciska Janzon, IR, tel. +358 20 750 2859
www.ramirent.com

© 2014 Ramirent © 2014 Ramirent 45
Group performance
Segment review
Market outlook
Key figures
Financial position
Company overview
Appendix
© 2014 Ramirent
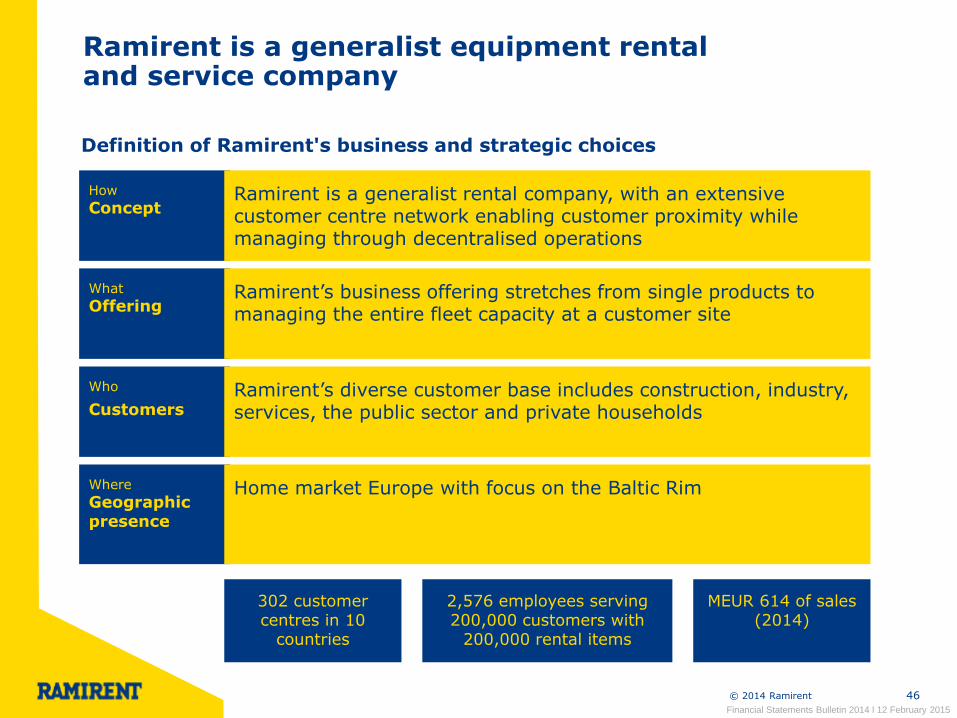
Ramirent is a generalist equipment rental and service company
46
Where
Geographic presence
Home market Europe with focus on the Baltic Rim
How
Concept Ramirent is a generalist rental company, with an extensive customer centre network enabling customer proximity while managing through decentralised operations
What
Offering Ramirent’s business offering stretches from single products to managing the entire fleet capacity at a customer site
Who
Customers Ramirent’s diverse customer base includes construction, industry, services, the public sector and private households
302 customer centres in 10
countries
2,576 employees serving 200,000 customers with
200,000 rental items
MEUR 614 of sales (2014)
Definition of Ramirent's business and strategic choices
Financial Statements Bulletin 2014 l 12 February 2015

© 2014 Ramirent 47
Vision
To be the leading and most progressive equipment rental solutions company in Europe, setting the benchmark for industry performance and customer service
Values Open
Engaged
Progressive
Mission
We simplify business by delivering Dynamic Rental SolutionsTM
Brand promise
More than Machines
Our strategic choices
Financial Statements Bulletin 2014 l 12 February 2015

© 2014 Ramirent 48
Strong market position in core Baltic Rim markets
Europe Central
(PL+CZ+SL)
# 1 58 customer
centres
Finland # 1
66 customer centres
Sweden # 2
77 customer centres
Norway # 1
43 customer centres
Denmark # 1
16 customer centres
Europe East –Baltics
# 2 42 customer
centres
Finland 25%
Sweden 33%
Norway 22%
Denmark 6%
Europe East -Baltics
6%
Europe Central 9%
Sales per customers 1-12/2014
Construction 63% Industrial
17%
Services & Retail 13 %
Public 4%
Private 2%
Current state close to target of 40% non-construction dependent sales
Russia and Ukraine presence through JV Fortrent
Sales per segment 1-12/2014
Financial Statements Bulletin 2014 l 12 February 2015
Fehmarnbelt Solutions Services A/S, JV with Zeppelin Rental
© 2014 Ramirent Event / Name of presentor 49
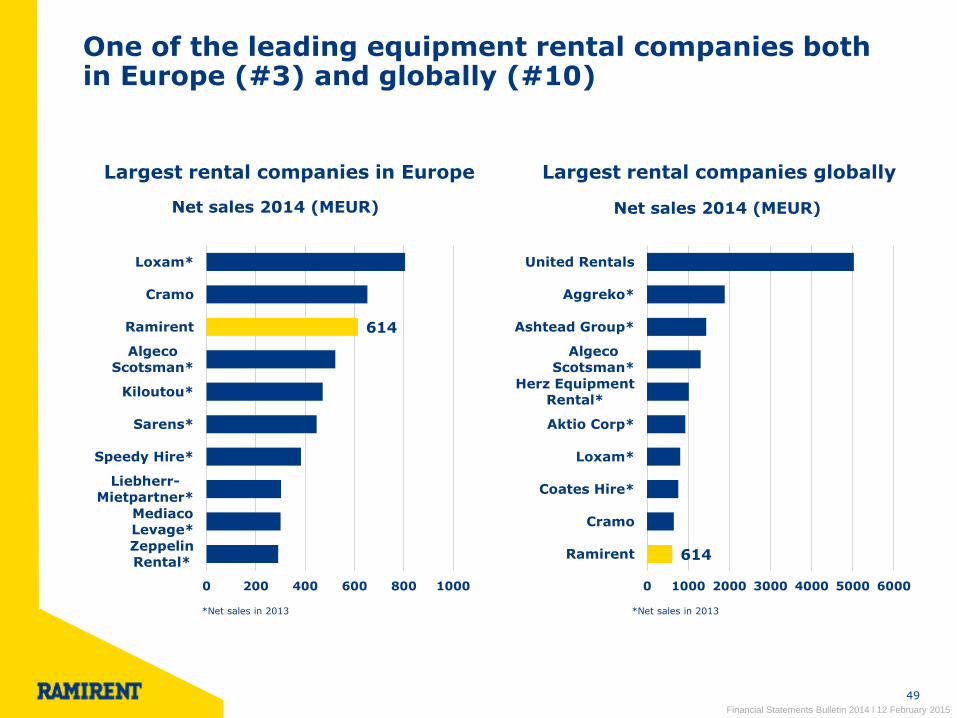
614
0 200 400 600 800 1000
Loxam*
Cramo
Ramirent
Algeco
Scotsman*
Kiloutou*
Sarens*
Speedy Hire*
Liebherr-
Mietpartner*
MediacoLevage*
Zeppelin
Rental*
Net sales 2014 (MEUR) Net sales 2014 (MEUR)
Largest rental companies in Europe Largest rental companies globally
One of the leading equipment rental companies both in Europe (#3) and globally (#10)
614
0 1000 2000 3000 4000 5000 6000
United Rentals
Aggreko*
Ashtead Group*
Algeco
Scotsman*
Herz Equipment
Rental*
Aktio Corp*
Loxam*
Coates Hire*
Cramo
Ramirent
Financial Statements Bulletin 2014 l 12 February 2015
*Net sales in 2013
*Net sales in 2013

© 2014 Ramirent 50
Equipment Services
Rental Business and Sector Knowledge
Benefits Lighter balance sheets, less investments
Benefits More uptime in core operations due to less downtime in equipment, less maintenance costs, right choice of equipment improves efficiency, less product liability risk
Benefits Understanding customer requirements helps to customise product selection and further improve productivity
Heavy Equipment
Access Equipment Lifts, Hoists,
Scaffolding, Tower cranes
Modules and site equipment
Light Equipment Tools, power and heating
equipment
• Planning
• On-site services
• Logistics
• Merchandise sale
• Rental insurance
• Training
• Construction
• Mining
• Paper
• Power generation
• Oil & Gas
• Shipyards
• Retail & Service
• Public sector
• Households
Integrated Solutions
Benefits Easy to buy, reduced number of subcontractors, increased focus on the core business
Ramirent combines the best equipment, services and knowhow into integrated rental solutions
10%
35%
22%
32%
Share of Group equipment rental income (1-12/2014)
Financial Statements Bulletin 2014 l 12 February 2015

51
Our offering
MODULE AND SITE EQUIPMENT
HEAVY MACHINERY ACCESS EQUIPMENT
PLANNING
LIGHT EQUIPMENT
LOGISTICS
ON-SITE SERVICES
RENTAL INSURANCE
TRAINING ACCESSORIES
Ramirent SpaceSolveTM
Ramirent SafeSolveTM
Ramirent EcoSolveTM
Ramirent PowerSolveTM
Ramirent ClimateSolveTM
Ramirent AccessSolveTM
Ramirent TotalSolveTM
MACHINERY AND EQUIPMENT SERVICES
SOLUTION AREAS
Financial Statements Bulletin 2014 l 12 February 2015
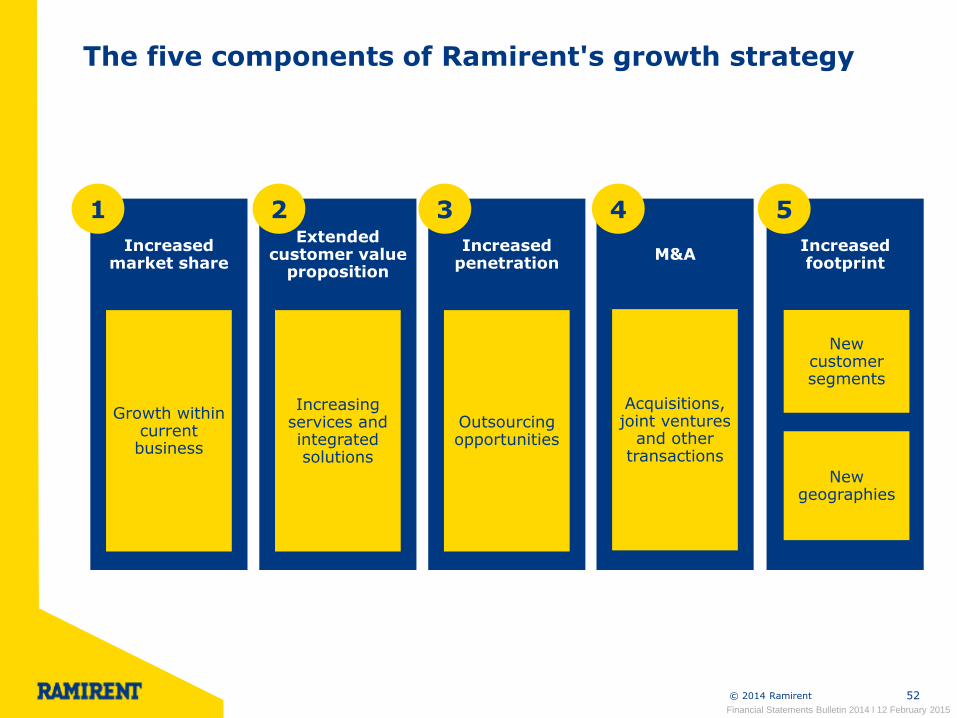
© 2014 Ramirent 52
Increased market share
Growth within current business
Extended customer value
proposition
Increasing services and integrated solutions
Increased penetration
Outsourcing opportunities
Increased footprint
New customer segments
New geographies
M&A
Acquisitions, joint ventures
and other transactions
1 2 3 4 5
The five components of Ramirent's growth strategy
Financial Statements Bulletin 2014 l 12 February 2015
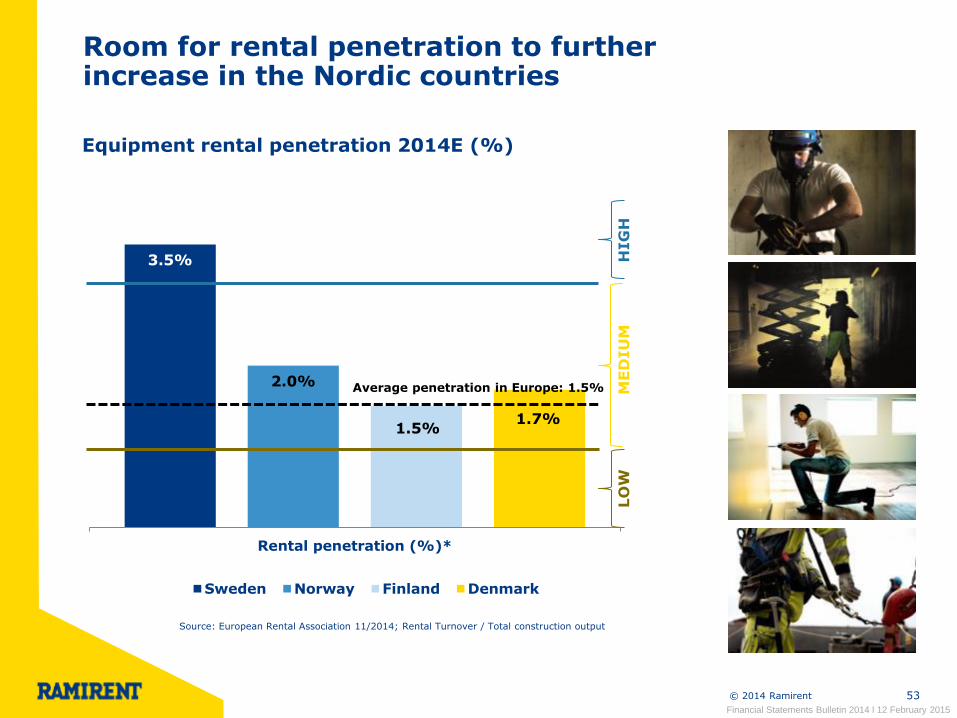
© 2014 Ramirent 53
Room for rental penetration to further increase in the Nordic countries
Equipment rental penetration 2014E (%)
3.5%
2.0%
1.5% 1.7%
Rental penetration (%)*
Sweden Norway Finland Denmark
Source: European Rental Association 11/2014; Rental Turnover / Total construction output
HIG
H
ME
DIU
M
LO
W
Average penetration in Europe: 1.5%
Financial Statements Bulletin 2014 l 12 February 2015
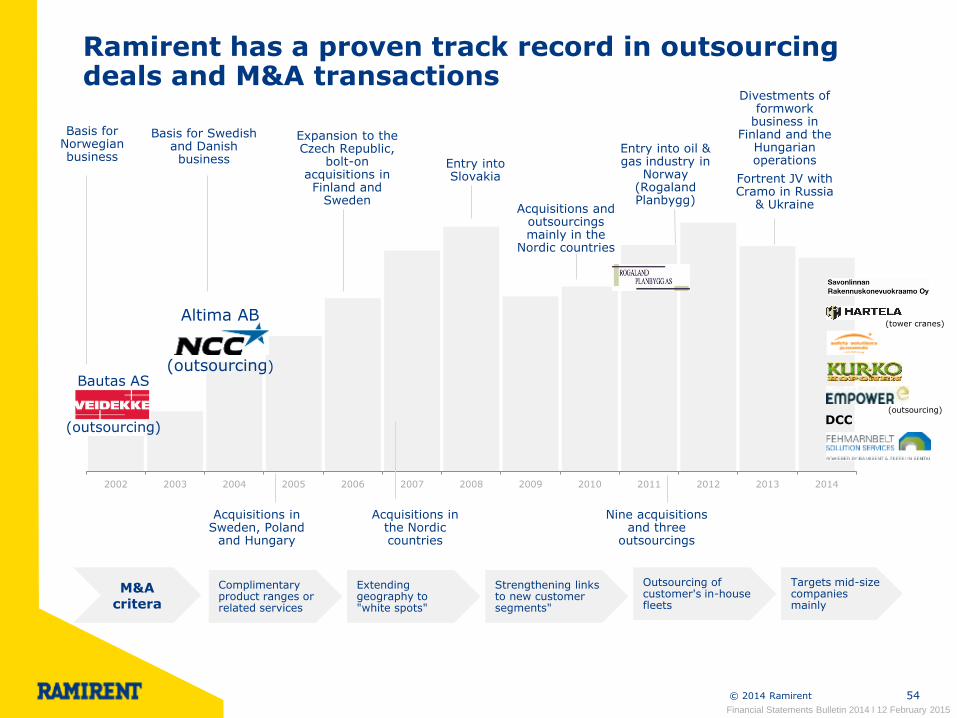
© 2014 Ramirent 54
Ramirent has a proven track record in outsourcing deals and M&A transactions
2002 2003 2004 2005 2006 2007 2008 2009 2010 2011 2012 2013 2014
M&A critera
Complimentary product ranges or related services
Extending geography to "white spots"
Strengthening links to new customer segments"
Outsourcing of customer's in-house fleets
Targets mid-size companies mainly
Bautas AS
(outsourcing)
Altima AB
(outsourcing)
Basis for Norwegian business
Basis for Swedish and Danish business
Acquisitions in Sweden, Poland
and Hungary
Expansion to the Czech Republic,
bolt-on acquisitions in Finland and
Sweden
Acquisitions in the Nordic countries
Entry into Slovakia
Acquisitions and outsourcings mainly in the
Nordic countries
Nine acquisitions and three
outsourcings
Entry into oil & gas industry in
Norway (Rogaland Planbygg)
Divestments of formwork
business in Finland and the
Hungarian operations
DCC
(outsourcing)
(tower cranes)
Financial Statements Bulletin 2014 l 12 February 2015
Fortrent JV with Cramo in Russia
& Ukraine
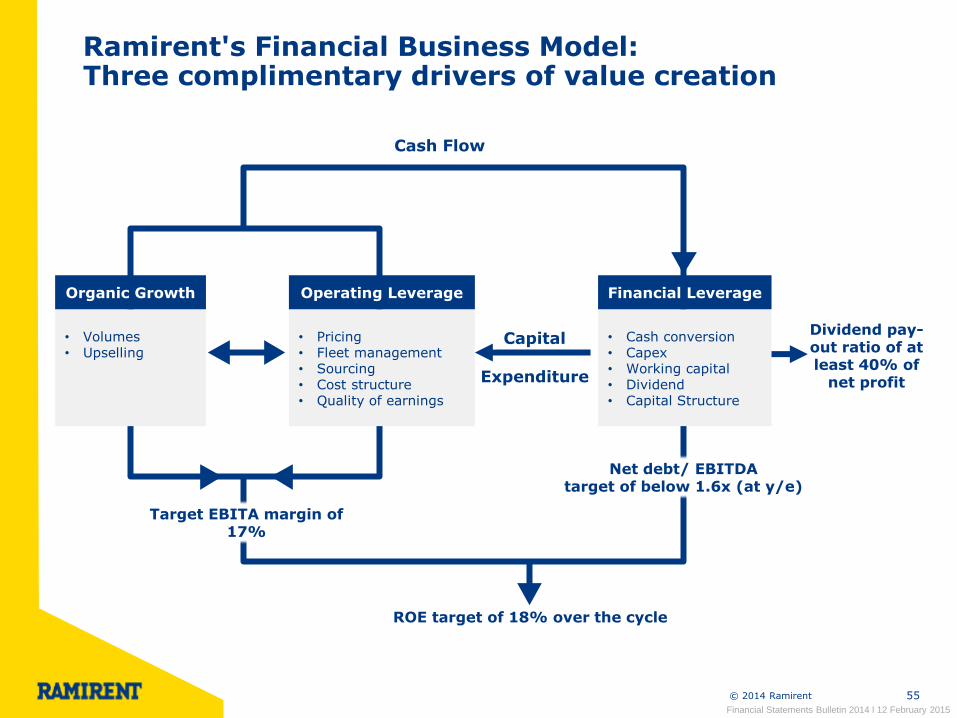
© 2014 Ramirent 55
Ramirent's Financial Business Model: Three complimentary drivers of value creation
• Volumes • Upselling
• Pricing • Fleet management • Sourcing • Cost structure • Quality of earnings
• Cash conversion • Capex • Working capital • Dividend • Capital Structure
Organic Growth Operating Leverage Financial Leverage
Cash Flow
Target EBITA margin of 17%
Net debt/ EBITDA target of below 1.6x (at y/e)
Capital
Expenditure
ROE target of 18% over the cycle
Dividend pay-out ratio of at least 40% of
net profit
Financial Statements Bulletin 2014 l 12 February 2015
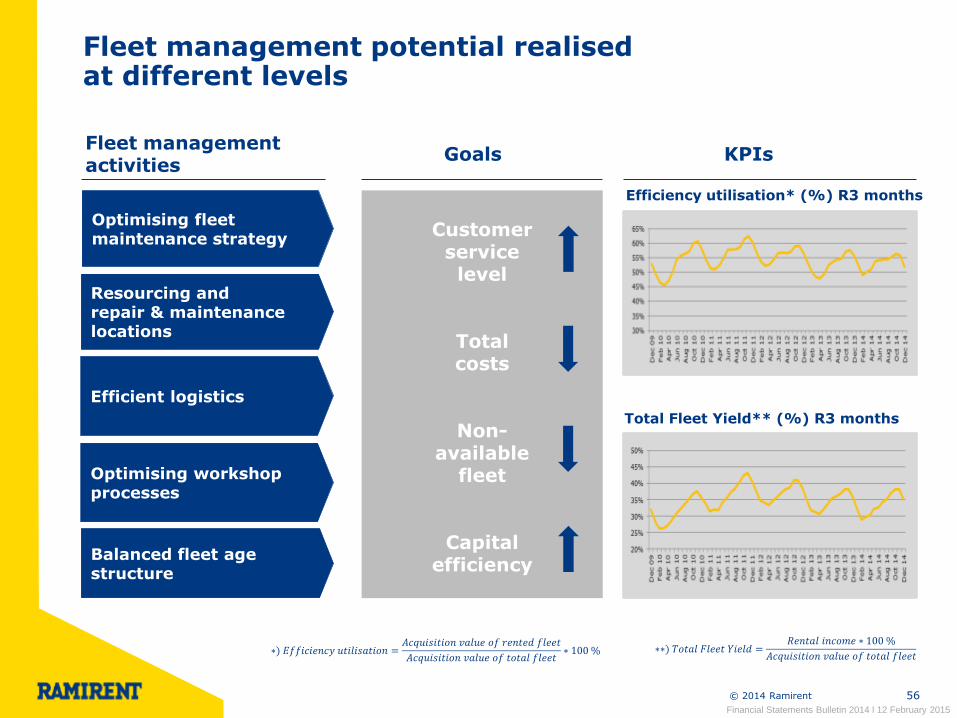
© 2014 Ramirent 56
Customer
service level
Total costs
Non- available
fleet
Capital efficiency
Optimising fleet maintenance strategy
Resourcing and repair & maintenance locations
Optimising workshop processes
Balanced fleet age structure
Fleet management activities
Efficiency utilisation* (%) R3 months
Total Fleet Yield** (%) R3 months
∗) 𝐸𝑓𝑓𝑖𝑐𝑖𝑒𝑛𝑐𝑦 𝑢𝑡𝑖𝑙𝑖𝑠𝑎𝑡𝑖𝑜𝑛 =𝐴𝑐𝑞𝑢𝑖𝑠𝑖𝑡𝑖𝑜𝑛 𝑣𝑎𝑙𝑢𝑒 𝑜𝑓 𝑟𝑒𝑛𝑡𝑒𝑑 𝑓𝑙𝑒𝑒𝑡
𝐴𝑐𝑞𝑢𝑖𝑠𝑖𝑡𝑖𝑜𝑛 𝑣𝑎𝑙𝑢𝑒 𝑜𝑓 𝑡𝑜𝑡𝑎𝑙 𝑓𝑙𝑒𝑒𝑡∗ 100 %
∗∗) 𝑇𝑜𝑡𝑎𝑙 𝐹𝑙𝑒𝑒𝑡 𝑌𝑖𝑒𝑙𝑑 =𝑅𝑒𝑛𝑡𝑎𝑙 𝑖𝑛𝑐𝑜𝑚𝑒 ∗ 100 %
𝐴𝑐𝑞𝑢𝑖𝑠𝑖𝑡𝑖𝑜𝑛 𝑣𝑎𝑙𝑢𝑒 𝑜𝑓 𝑡𝑜𝑡𝑎𝑙 𝑓𝑙𝑒𝑒𝑡
Goals KPIs
Efficient logistics
Fleet management potential realised at different levels
Financial Statements Bulletin 2014 l 12 February 2015
© 2014 Ramirent 57
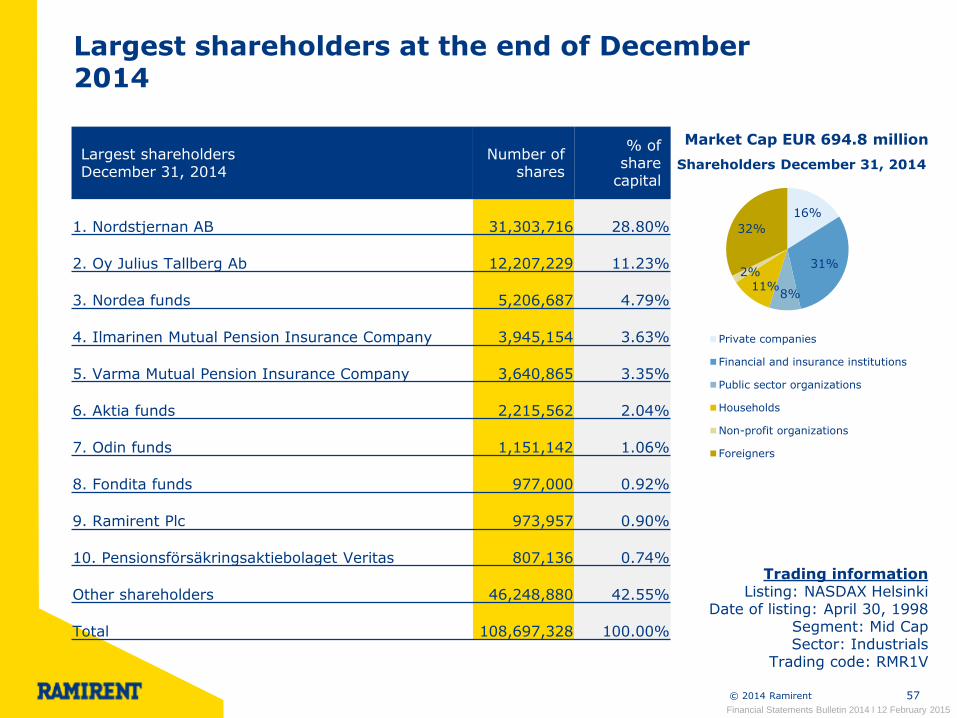
Market Cap EUR 694.8 million
Trading information Listing: NASDAX Helsinki
Date of listing: April 30, 1998 Segment: Mid Cap Sector: Industrials
Trading code: RMR1V
16%
31%
8% 11%
2%
32%
Private companies
Financial and insurance institutions
Public sector organizations
Households
Non-profit organizations
Foreigners
Shareholders December 31, 2014
Largest shareholders December 31, 2014
Number of shares
% of share
capital
1. Nordstjernan AB 31,303,716 28.80%
2. Oy Julius Tallberg Ab 12,207,229 11.23%
3. Nordea funds 5,206,687 4.79%
4. Ilmarinen Mutual Pension Insurance Company 3,945,154 3.63%
5. Varma Mutual Pension Insurance Company 3,640,865 3.35%
6. Aktia funds 2,215,562 2.04%
7. Odin funds 1,151,142 1.06%
8. Fondita funds 977,000 0.92%
9. Ramirent Plc 973,957 0.90%
10. Pensionsförsäkringsaktiebolaget Veritas 807,136 0.74%
Other shareholders 46,248,880 42.55%
Total 108,697,328 100.00%
Largest shareholders at the end of December 2014
Financial Statements Bulletin 2014 l 12 February 2015
© 2014 Ramirent 58
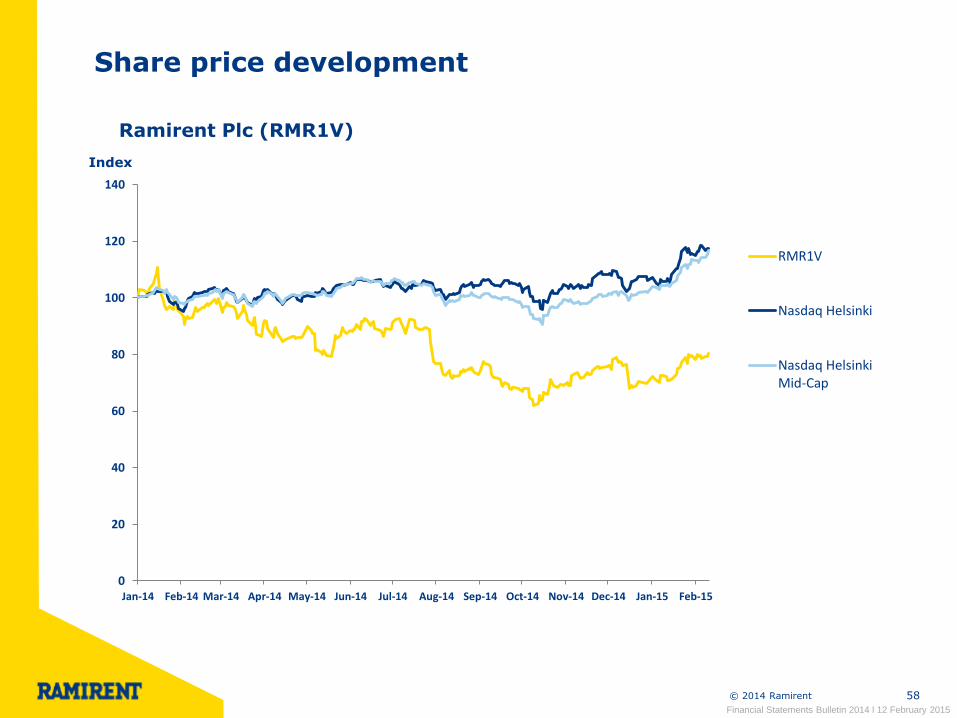
Share price development
Ramirent Plc (RMR1V)
Index
Financial Statements Bulletin 2014 l 12 February 2015
0
20
40
60
80
100
120
140
Jan-14 Feb-14 Mar-14 Apr-14 May-14 Jun-14 Jul-14 Aug-14 Sep-14 Oct-14 Nov-14 Dec-14 Jan-15 Feb-15
RMR1V
Nasdaq Helsinki
Nasdaq HelsinkiMid-Cap
© 2014 Ramirent
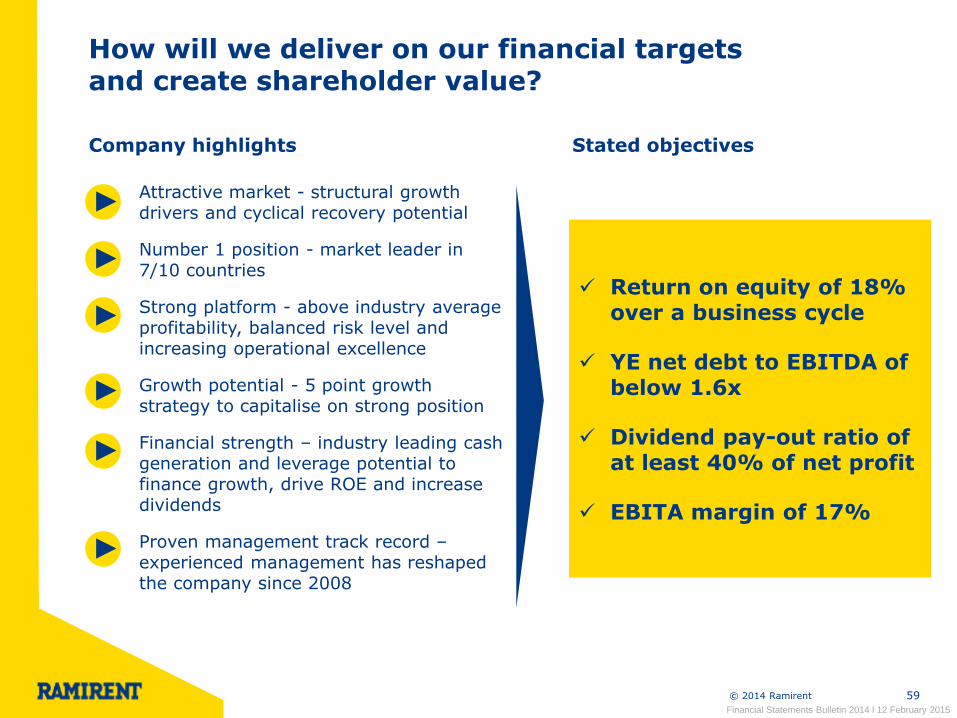
Attractive market - structural growth drivers and cyclical recovery potential
Number 1 position - market leader in 7/10 countries
Strong platform - above industry average profitability, balanced risk level and increasing operational excellence
Growth potential - 5 point growth strategy to capitalise on strong position
Financial strength – industry leading cash generation and leverage potential to finance growth, drive ROE and increase dividends
Proven management track record – experienced management has reshaped the company since 2008
59
Return on equity of 18% over a business cycle
YE net debt to EBITDA of below 1.6x
Dividend pay-out ratio of at least 40% of net profit
EBITA margin of 17%
How will we deliver on our financial targets and create shareholder value?
Company highlights Stated objectives
Financial Statements Bulletin 2014 l 12 February 2015
© 2014 Ramirent © 2014 Ramirent 60
Group performance
Segment review
Market outlook
Key figures
Financial position
Company overview
Appendix
© 2014 Ramirent 61
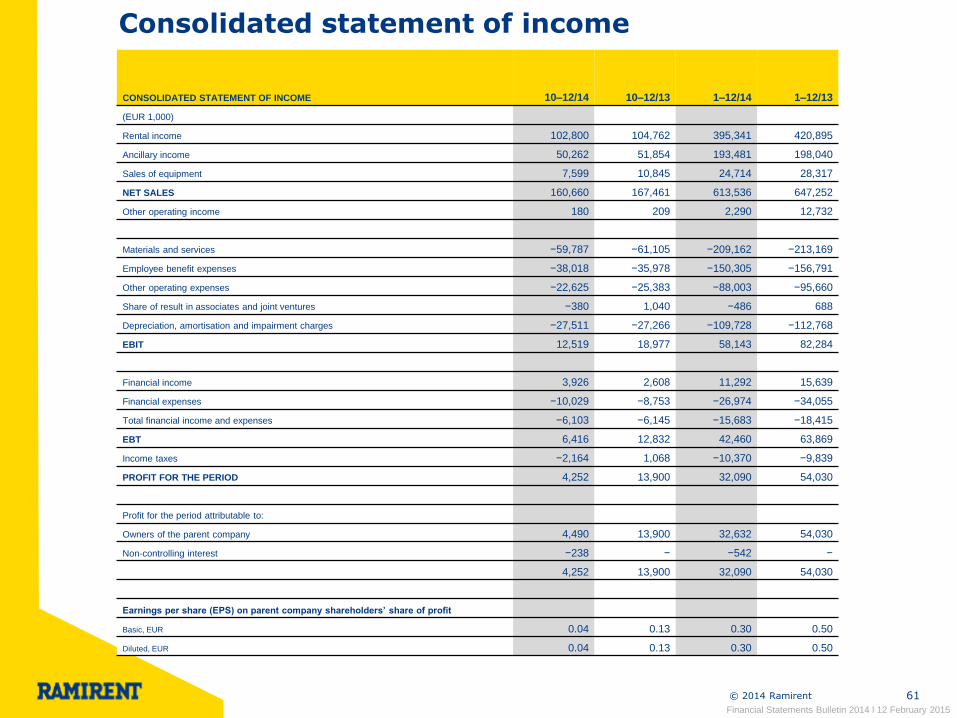
Consolidated statement of income
Financial Statements Bulletin 2014 l 12 February 2015
CONSOLIDATED STATEMENT OF INCOME
10–12/14
10–12/13
1–12/14
1–12/13
(EUR 1,000)
Rental income 102,800 104,762 395,341 420,895
Ancillary income 50,262 51,854 193,481 198,040
Sales of equipment 7,599 10,845 24,714 28,317
NET SALES 160,660 167,461 613,536 647,252
Other operating income 180 209 2,290 12,732
Materials and services −59,787 −61,105 −209,162 −213,169
Employee benefit expenses −38,018 −35,978 −150,305 −156,791
Other operating expenses −22,625 −25,383 −88,003 −95,660
Share of result in associates and joint ventures −380 1,040 −486 688
Depreciation, amortisation and impairment charges −27,511 −27,266 −109,728 −112,768
EBIT 12,519 18,977 58,143 82,284
Financial income 3,926 2,608 11,292 15,639
Financial expenses −10,029 −8,753 −26,974 −34,055
Total financial income and expenses −6,103 −6,145 −15,683 −18,415
EBT 6,416 12,832 42,460 63,869
Income taxes −2,164 1,068 −10,370 −9,839
PROFIT FOR THE PERIOD 4,252 13,900 32,090 54,030
Profit for the period attributable to:
Owners of the parent company 4,490 13,900 32,632 54,030
Non-controlling interest −238 − −542 −
4,252 13,900 32,090 54,030
Earnings per share (EPS) on parent company shareholders’ share of profit
Basic, EUR 0.04 0.13 0.30 0.50
Diluted, EUR 0.04 0.13 0.30 0.50

© 2014 Ramirent 62
Consolidated statement of financial position
Financial Statements Bulletin 2014 l 12 February 2015
CURRENT ASSETS
Inventories 12,431 11,494
Trade and other receivables 109,370 109,207
Current tax assets 2,775 1,495
Cash and cash equivalents 3,129 1,849
TOTAL CURRENT ASSETS 127,705 124,045
TOTAL ASSETS 743,894 759,477
CONSOLIDATED STATEMENT OF FINANCIAL POSITION 31/12/2014
31/12/2013
(EUR 1,000)
ASSETS
NON–CURRENT ASSETS
Goodwill 139,780 124,825
Other intangible assets 46,720 38,427
Property, plant and equipment 406,001 432,232
Investments in associates and joint ventures 5,278 18,524
Non–current loan receivables 17,666 20,261
Available–for–sale investments 139 517
Deferred tax assets 605 647
TOTAL NON–CURRENT ASSETS 616,189 635,432
© 2014 Ramirent 63
CONSOLIDATED STATEMENT OF FINANCIAL POSITION
31/12/2014
31/12/2013
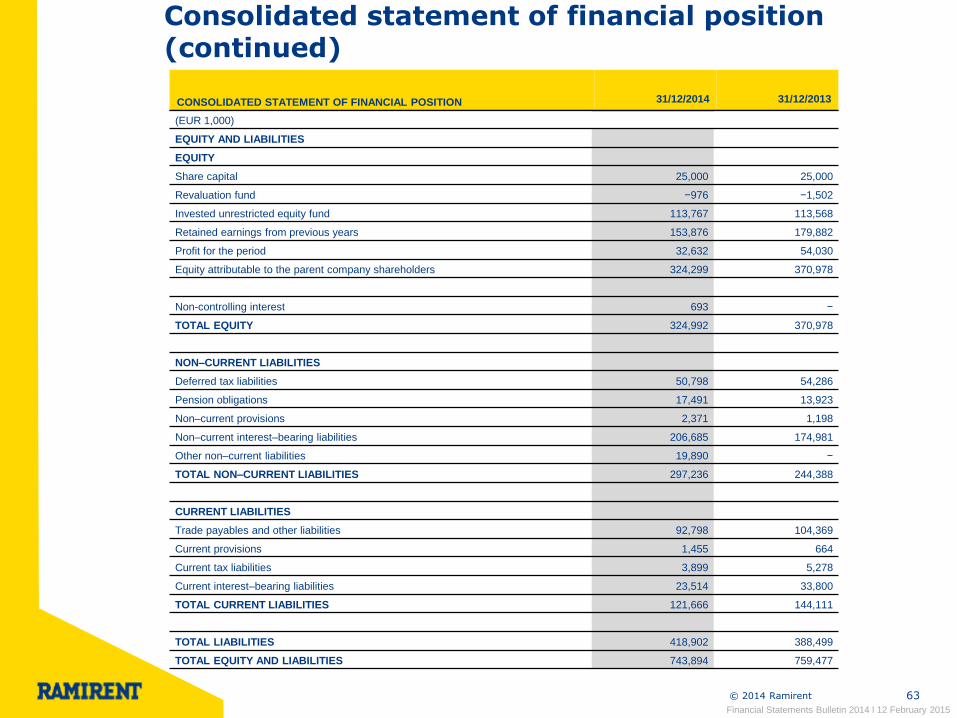
Consolidated statement of financial position (continued)
Financial Statements Bulletin 2014 l 12 February 2015
(EUR 1,000)
EQUITY AND LIABILITIES
EQUITY
Share capital 25,000 25,000
Revaluation fund −976 −1,502
Invested unrestricted equity fund 113,767 113,568
Retained earnings from previous years 153,876 179,882
Profit for the period 32,632 54,030
Equity attributable to the parent company shareholders 324,299 370,978
Non-controlling interest 693 −
TOTAL EQUITY 324,992 370,978
NON–CURRENT LIABILITIES
Deferred tax liabilities 50,798 54,286
Pension obligations 17,491 13,923
Non–current provisions 2,371 1,198
Non–current interest–bearing liabilities 206,685 174,981
Other non–current liabilities 19,890 −
TOTAL NON–CURRENT LIABILITIES 297,236 244,388
CURRENT LIABILITIES
Trade payables and other liabilities 92,798 104,369
Current provisions 1,455 664
Current tax liabilities 3,899 5,278
Current interest–bearing liabilities 23,514 33,800
TOTAL CURRENT LIABILITIES 121,666 144,111
TOTAL LIABILITIES 418,902 388,499
TOTAL EQUITY AND LIABILITIES 743,894 759,477
© 2014 Ramirent 64
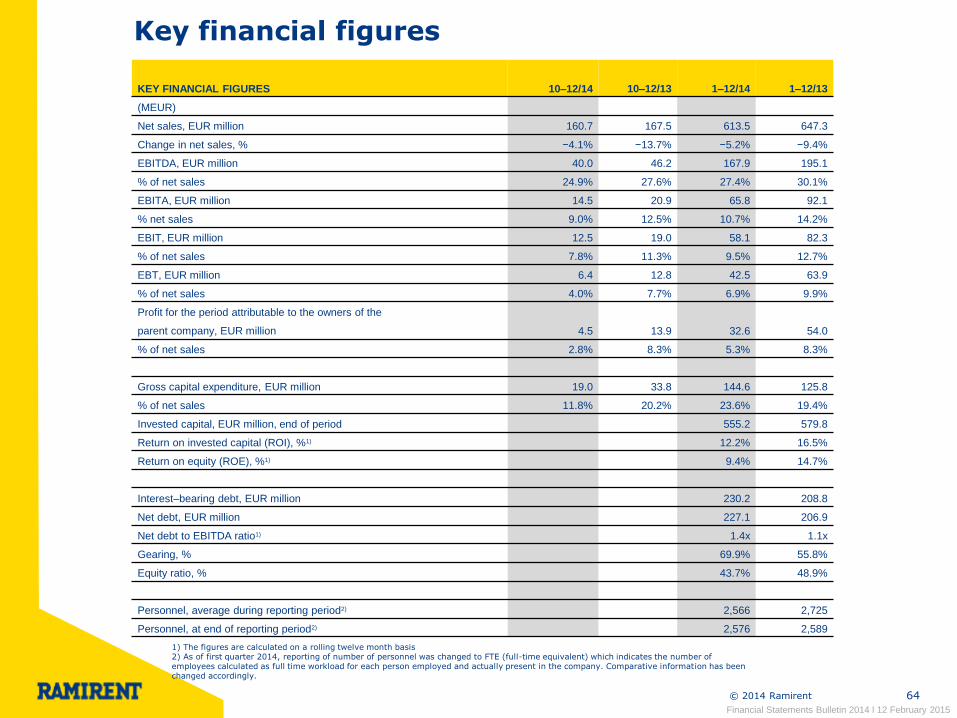
Key financial figures
1) The figures are calculated on a rolling twelve month basis 2) As of first quarter 2014, reporting of number of personnel was changed to FTE (full-time equivalent) which indicates the number of employees calculated as full time workload for each person employed and actually present in the company. Comparative information has been changed accordingly.
Financial Statements Bulletin 2014 l 12 February 2015
KEY FINANCIAL FIGURES 10–12/14
10–12/13
1–12/14
1–12/13
(MEUR)
Net sales, EUR million 160.7 167.5 613.5 647.3
Change in net sales, % −4.1% −13.7% −5.2% −9.4%
EBITDA, EUR million 40.0 46.2 167.9 195.1
% of net sales 24.9% 27.6% 27.4% 30.1%
EBITA, EUR million 14.5 20.9 65.8 92.1
% net sales 9.0% 12.5% 10.7% 14.2%
EBIT, EUR million 12.5 19.0 58.1 82.3
% of net sales 7.8% 11.3% 9.5% 12.7%
EBT, EUR million 6.4 12.8 42.5 63.9
% of net sales 4.0% 7.7% 6.9% 9.9%
Profit for the period attributable to the owners of the
parent company, EUR million 4.5 13.9 32.6 54.0
% of net sales 2.8% 8.3% 5.3% 8.3%
Gross capital expenditure, EUR million 19.0 33.8 144.6 125.8
% of net sales 11.8% 20.2% 23.6% 19.4%
Invested capital, EUR million, end of period 555.2 579.8
Return on invested capital (ROI), %1) 12.2% 16.5%
Return on equity (ROE), %1) 9.4% 14.7%
Interest–bearing debt, EUR million 230.2 208.8
Net debt, EUR million 227.1 206.9
Net debt to EBITDA ratio1) 1.4x 1.1x
Gearing, % 69.9% 55.8%
Equity ratio, % 43.7% 48.9%
Personnel, average during reporting period2) 2,566 2,725
Personnel, at end of reporting period2) 2,576 2,589

© 2014 Ramirent 65
Consolidated cash flow statement
Financial Statements Bulletin 2014 l 12 February 2015
CONSOLIDATED CASH FLOW STATEMENT 10–12/14
10–12/13
1–12/14
1–12/13
(EUR 1,000)
CASH FLOW FROM OPERATING ACTIVITIES
EBT 6,416 12,832 42,460 63,869
Adjustments
Depreciation, amortisation and impairment charges 27,511 27,266 109,728 112,768
Adjustment for proceeds from sale of used rental equipment 3,035 1,272 17,136 8,975
Financial income and expenses 6,103 6,145 15,683 18,415
Adjustment for proceeds from disposals of subsidiaries − − − −15,609
Other adjustments −2,620 −13,459 −6,140 4,735
Cash flow from operating activities before change in working capital 40,445 34,055 178,867 193,153
Change in working capital
Change in trade and other receivables 9,107 9,996 −2,150 18,994
Change in inventories −991 2,298 −1,472 3,114
Change in non–interest–bearing liabilities 8,775 16,693 −12,302 −5,724
Cash flow from operating activities before interest and taxes 57,336 63,041 162,942 209,537
Interest paid −598 −1,796 −10,418 −5,270
Interest received −339 142 620 1,047
Income tax paid −2,693 −5,915 −12,646 −23,068
NET CASH FLOW FROM OPERATING ACTIVITIES 53,707 55,472 140,499 182,245

© 2014 Ramirent 66
Consolidated cash flow statement (continued)
Presentation of the figures in the consolidated cash flow statement for January–June 2014 has been adjusted and consolidated cash flow statement for January–December
2014 has been adjusted accordingly. After adjustment the cash flows reflect better the impact of acquired businesses.
Financial Statements Bulletin 2014 l 12 February 2015
CONSOLIDATED CASH FLOW STATEMENT 10–12/14
10–12/13
1–12/14
1–12/13
CASH FLOW FROM INVESTING ACTIVITIES
Acquisition of businesses and subsidiaries, net of cash −2,600 −2,832 −29,872 −2,832
Investment in tangible non–current asset (rental equipment) −16,326 −24,776 −88,902 −110,115
Investment in other tangible non–current assets 314 −360 −504 −2,825
Investment in intangible non–current assets −3,324 −2,383 −9,680 −6,503
Proceeds from sale of tangible and intangible non–current assets
(excluding used rental equipment) 231 98 7,713 360
Proceeds from sales of other investments − − − 14,681
Loan receivables, increase, decrease and other changes 588 − 2,594 −1,577
NET CASH FLOW FROM INVESTING ACTIVITIES −21,118 −30,252 −118,651 −108,812
CASH FLOW FROM FINANCING ACTIVITIES
Dividends paid − − −39,858 −36,618
Borrowings and repayments of current debt (net) −34,756 −52 22,686 −49,771
Borrowings of non–current debt 2,651 −83 2,651 99,031
Repayments of non–current debt −793 −36,354 −6,047 −85,565
NET CASH FLOW FROM FINANCING ACTIVITIES −32,897 −36,489 −20,567 −72,923
NET CHANGE IN CASH AND CASH EQUIVALENTS
DURING THE FINANCIAL YEAR −307 −11,270 1,281 511
Cash at the beginning of the period 3,436 13,118 1,849 1,338
Translation differences − − − −
Change in cash −307 −11,270 1,281 511
Cash at the end of the period 3,129 1,849 3,129 1,849

© 2014 Ramirent 67
Net sales
Financial Statements Bulletin 2014 l 12 February 2015
NET SALES
10–12/14
10–12/13
1–12/14
1–12/13
(MEUR)
FINLAND
- Net sales (external) 38.4 38.4 151.9 150.9
- Inter–segment sales 0.3 0.3 0.9 1.0
SWEDEN
- Net sales (external) 54.8 52.8 200.4 206.7
- Inter–segment sales 0.2 0.0 0.7 0.6
NORWAY
- Net sales (external) 33.8 40.8 135.1 153.6
- Inter–segment sales 0.1 0.0 0.6 0.0
DENMARK
- Net sales (external) 10.6 11.8 39.4 43.7
- Inter–segment sales − 0.0 − 0.2
EUROPE EAST
- Net sales (external) 9.2 8.4 33.8 35.4
- Inter–segment sales 0.0 0.0 0.1 0.1
EUROPE CENTRAL
- Net sales (external) 13.8 15.2 52.9 56.9
- Inter–segment sales 0.0 0.1 0.3 0.4
Elimination of sales between segments −0.5 −0.4 −2.4 −2.3
GROUP NET SALES 160.7 167.5 613.5 647.3
© 2014 Ramirent 68
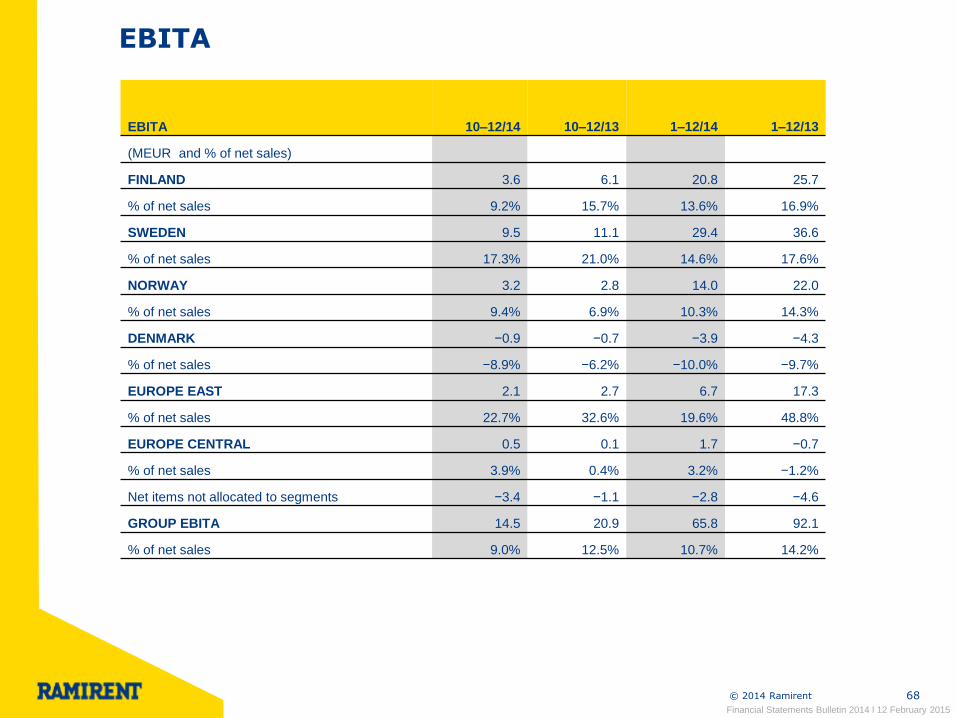
EBITA
Financial Statements Bulletin 2014 l 12 February 2015
EBITA 10–12/14
10–12/13
1–12/14
1–12/13
(MEUR and % of net sales)
FINLAND 3.6 6.1 20.8 25.7
% of net sales 9.2% 15.7% 13.6% 16.9%
SWEDEN 9.5 11.1 29.4 36.6
% of net sales 17.3% 21.0% 14.6% 17.6%
NORWAY 3.2 2.8 14.0 22.0
% of net sales 9.4% 6.9% 10.3% 14.3%
DENMARK −0.9 −0.7 −3.9 −4.3
% of net sales −8.9% −6.2% −10.0% −9.7%
EUROPE EAST 2.1 2.7 6.7 17.3
% of net sales 22.7% 32.6% 19.6% 48.8%
EUROPE CENTRAL 0.5 0.1 1.7 −0.7
% of net sales 3.9% 0.4% 3.2% −1.2%
Net items not allocated to segments −3.4 −1.1 −2.8 −4.6
GROUP EBITA 14.5 20.9 65.8 92.1
% of net sales 9.0% 12.5% 10.7% 14.2%

© 2014 Ramirent 69
January-December 2013 included business in Russia, Ukraine and Hungary
Net sales: Group, Russia & Ukraine, Hungary
EBITA: Group, Russia & Ukraine, Hungary
Net sales, MEUR Q1/2013 Q2/2013 Q3/2013 Q4/2013 Q1/2014 Q2/2014 Q3/2014 Q4/2014
Group as reported 152.8 160.8 166.2 167.5 137.5 151.8 163.6 160.7
Russia & Ukraine 4.6
Hungary 1.5 1.7 1.6
Group (excl. Russia, Ukraine & Hungary) 146.7 159.1 164.6 167.5 137.5 151.8 163.6 160.7
EBITA, MEUR Q1/2013 Q2/2013 Q3/2013 Q4/2013 Q1/2014 Q2/2014 Q3/2014 Q4/2014
Group as reported 22.6 22.7 25.9 20.9 7.1 16.2 28.0 14.5
Russia & Ukraine (incl. capital gain) 11.4
Hungary (incl. capital loss) -0.2 0.1 -1.3
Group (excl. Russia, Ukraine & Hungary) 11.4 22.6 27.3 20.9 7.1 16.2 28.0 14.5
Financial Statements Bulletin 2014 l 12 February 2015

For further information:
Magnus Rosén, President and CEO, tel. +358 20 750 2845 Jonas Söderkvist, CFO, tel. +358 20 750 3248 Franciska Janzon, IR, tel. +358 20 750 2859
www.ramirent.com