rr results q3_2012_final
DESCRIPTION
Ramirent Q3 Interim Report presentationTRANSCRIPT
INTERIM REPORT JANUARY- SEPTEMBER 2012 2 November 2012 CEO Magnus Rosén CFO Jonas Söderkvist

Interim Report January-September 2012 l 2 November 2012
Agenda
Q3 Highlights Segment review Financial Review Events after the review period: Ramirent and Cramo forms a joint venture for their Russian and Ukrainian businesses
2
Interim Report January-September 2012 l 2 November 2012 3
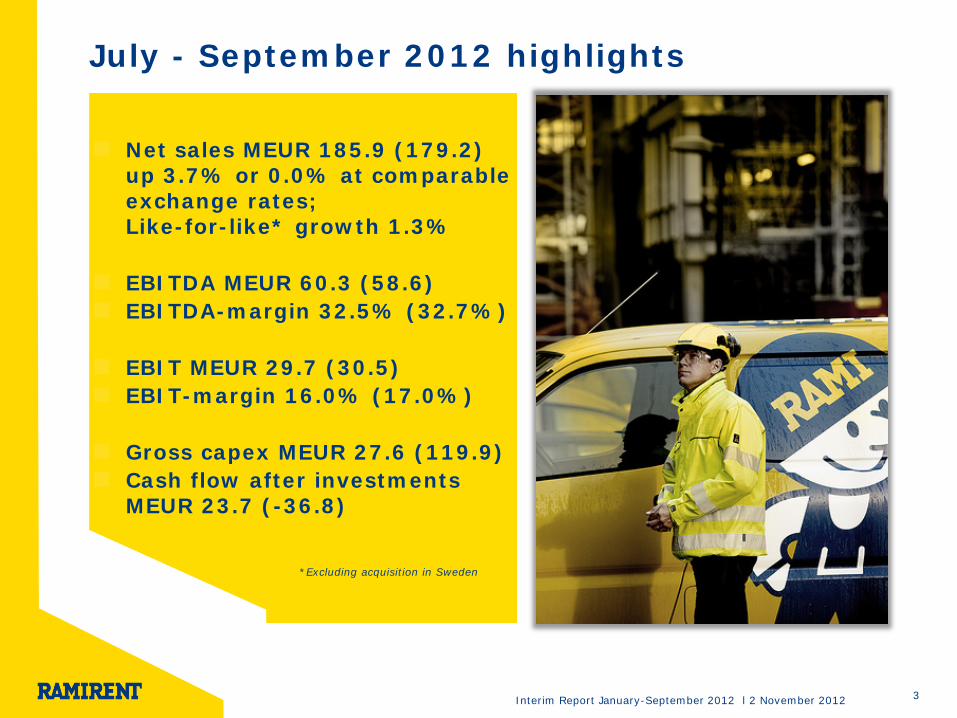
July - September 2012 highlights
*Excluding acquisition in Sweden
Net sales MEUR 185.9 (179.2) up 3.7% or 0.0% at comparable exchange rates; Like-for-like* growth 1.3% EBITDA MEUR 60.3 (58.6) EBITDA-margin 32.5% (32.7%) EBIT MEUR 29.7 (30.5) EBIT-margin 16.0% (17.0%) Gross capex MEUR 27.6 (119.9) Cash flow after investments MEUR 23.7 (-36.8)
Interim Report January-September 2012 l 2 November 2012 4
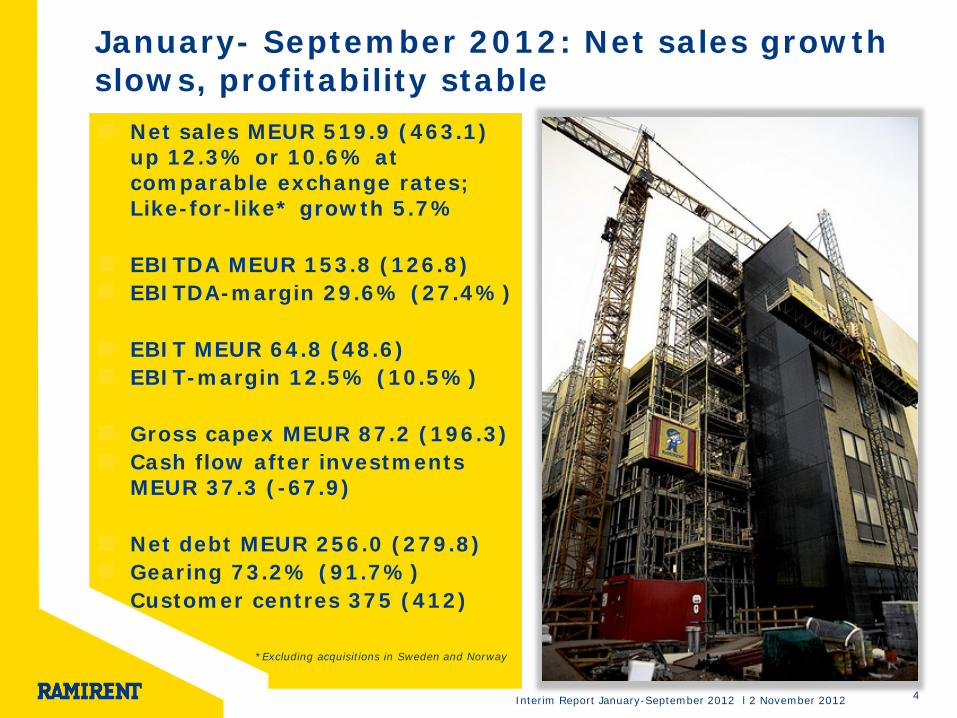
January- September 2012: Net sales growth slows, profitability stable
Net sales MEUR 519.9 (463.1) up 12.3% or 10.6% at comparable exchange rates; Like-for-like* growth 5.7% EBITDA MEUR 153.8 (126.8) EBITDA-margin 29.6% (27.4%) EBIT MEUR 64.8 (48.6) EBIT-margin 12.5% (10.5%) Gross capex MEUR 87.2 (196.3) Cash flow after investments MEUR 37.3 (-67.9) Net debt MEUR 256.0 (279.8) Gearing 73.2% (91.7%)
Customer centres 375 (412)
*Excluding acquisitions in Sweden and Norway

Interim Report January-September 2012 l 2 November 2012
5
4 %
-1 %
17 %
4 % 1 %
9 %
-17 % -20 %
-15 %
-10 %
-5 %
0 %
5 %
10 %
15 %
20 %
YoY Change in net sales , Q3, %
Net sales grew in Q3 in all segments except Europe Central and Finland
12 % 11 %
18 % 20 %
10 %
16 %
-15 % -20 %
-15 %
-10 %
-5 %
0 %
5 %
10 %
15 %
20 %
25 %
YoY Change in net sales, 1-9/12, %
Interim Report January-September 2012 l 2 November 2012
6
16 %
24 %
16 % 16 %
7 %
23 %
2 %
0 %
5 %
10 %
15 %
20 %
25 %
30 %
Q3 2011 Q3 2012
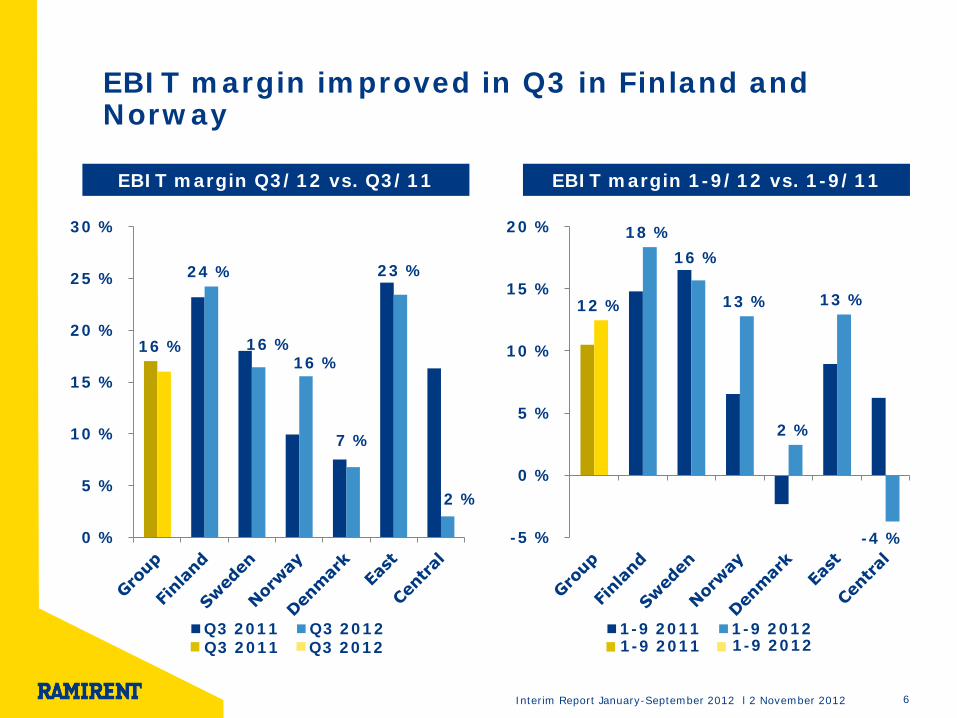
EBIT margin Q3/12 vs. Q3/11
EBIT margin improved in Q3 in Finland and Norway
EBIT margin 1-9/12 vs. 1-9/11
12 %
18 % 16 %
13 %
2 %
13 %
-4 % -5 %
0 %
5 %
10 %
15 %
20 %
1-9 2011 1-9 20121-9 2011 1-9 2012 Q3 2012 Q3 2011
Interim Report January-September 2012 l 2 November 2012
7
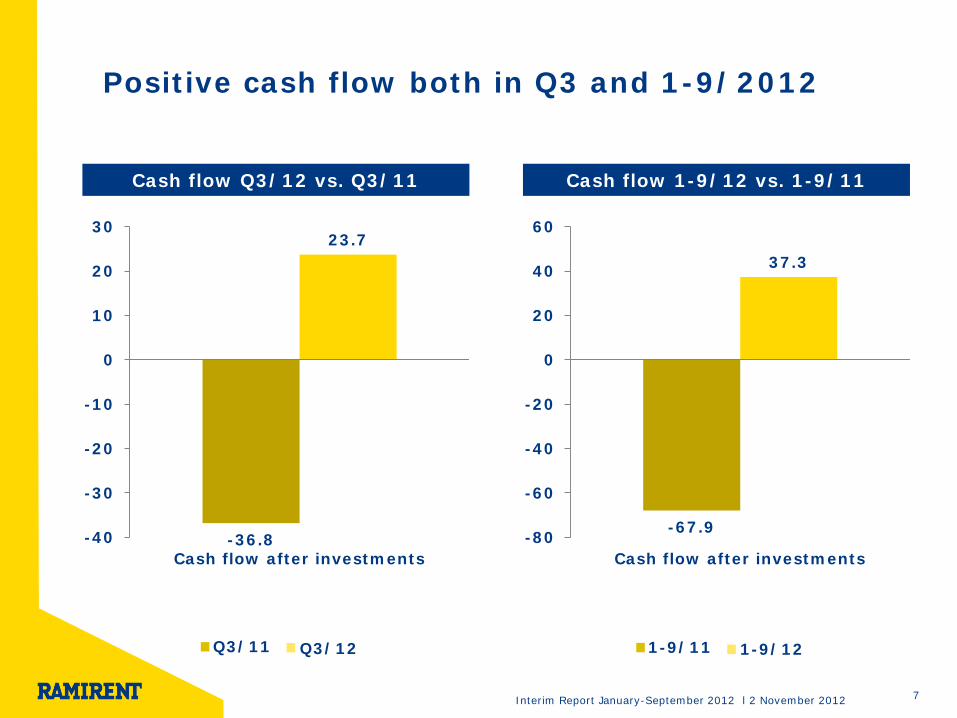
-36.8
23.7
-40
-30
-20
-10
0
10
20
30
Cash flow after investments
Cash flow Q3/12 vs. Q3/11
Positive cash flow both in Q3 and 1-9/2012
Cash flow 1-9/12 vs. 1-9/11
-67.9
37.3
-80
-60
-40
-20
0
20
40
60
Cash flow after investments
1-9/11 1-9/12 Q3/12 Q3/11
Interim Report January-September 2012 l 2 November 2012
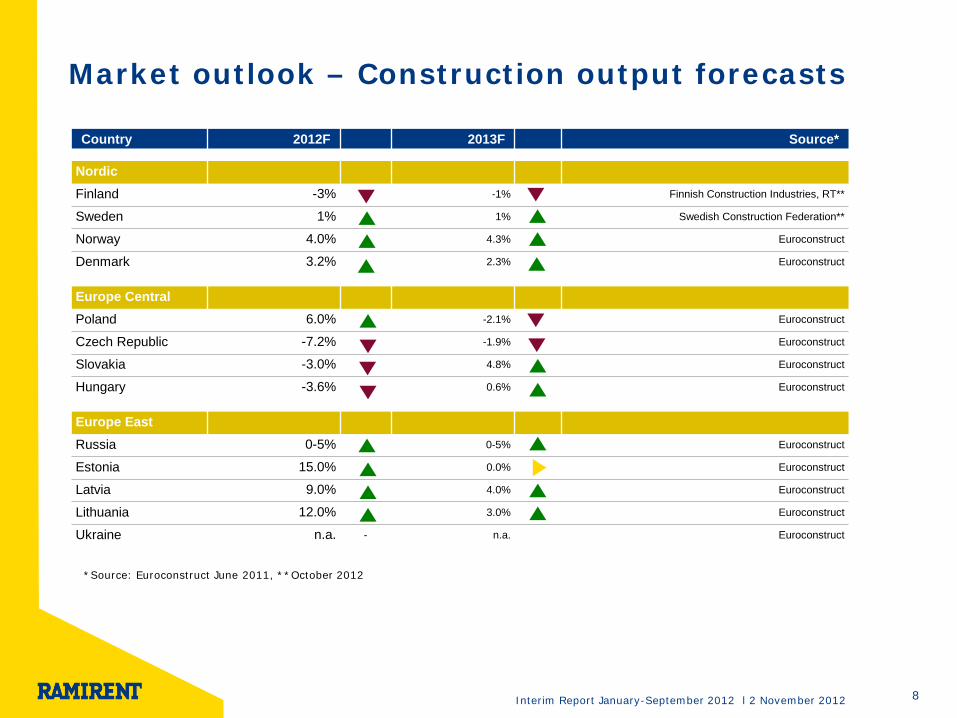
Market outlook – Construction output forecasts
8
Country 2012F 2013F Source*
Nordic Finland -3% - -1% Finnish Construction Industries, RT**
Sweden 1% - 1% Swedish Construction Federation**
Norway 4.0% 4.3% Euroconstruct
Denmark 3.2% 2.3% Euroconstruct
Europe Central Poland 6.0% -2.1% Euroconstruct
Czech Republic -7.2% -1.9% Euroconstruct
Slovakia -3.0% 4.8% Euroconstruct
Hungary -3.6% 0.6% Euroconstruct
Europe East Russia 0-5% 0-5% Euroconstruct
Estonia 15.0% 0.0% Euroconstruct
Latvia 9.0% 4.0% Euroconstruct
Lithuania 12.0% 3.0% Euroconstruct
Ukraine n.a. - n.a. Euroconstruct
*Source: Euroconstruct June 2011, **October 2012
Interim Report January-September 2012 l 2 November 2012
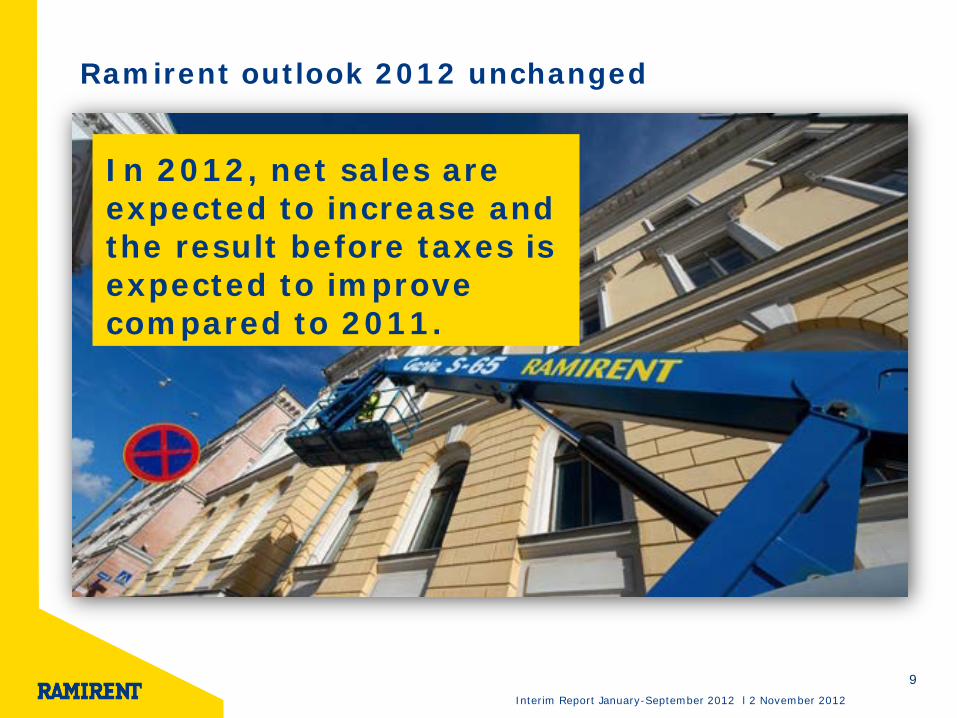
Ramirent outlook 2012 unchanged
In 2012, net sales are expected to increase and the result before taxes is expected to improve compared to 2011.
9

Interim Report January-September 2012 l 2 November 2012 10
Priorities 2012 • We continue to carefully
observe the market activity
• Adjust operations to signs of activity slowing down
• Operating on cautious capital expenditure
• Maintaining focus on cost and risk control
• Improving competitiveness by developing our common Ramirent Platform and providing our customers with enhanced efficiency through integrated solutions.
Interim Report January-September 2012 l 2 November 2012
Interim Report January-September 2012 l 2 November 2012
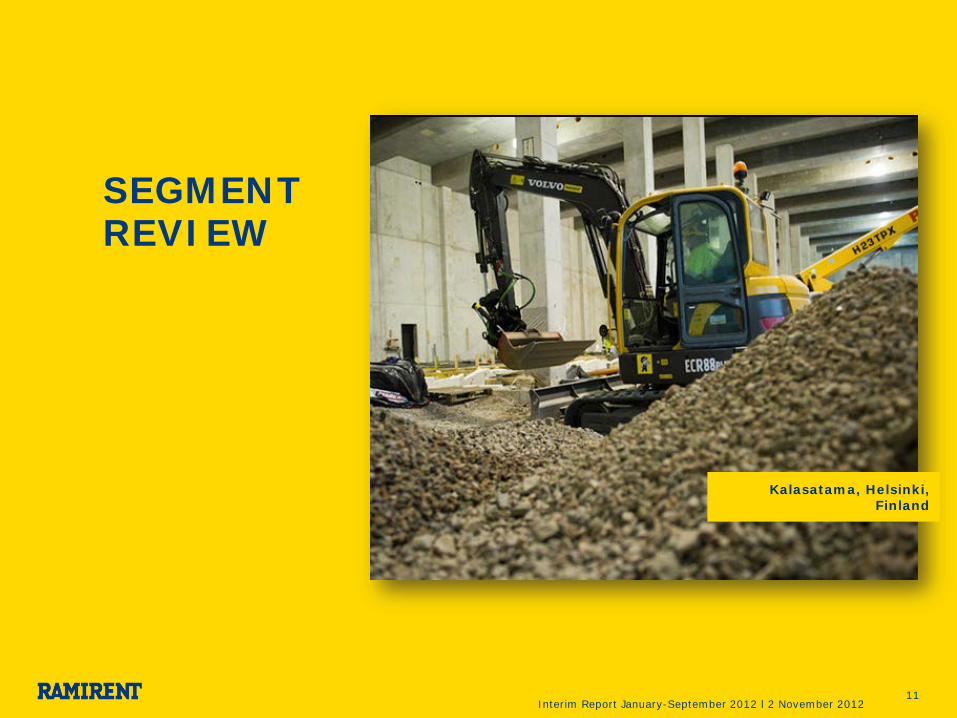
SEGMENT REVIEW
11
Kalasatama, Helsinki, Finland
Interim Report January-September 2012 l 2 November 2012
29 34
41
31 28
36 38 35 30
37
45 42 38
41 45
-5 %
0 %
5 %
10 %
15 %
20 %
25 %
30 %
0
10
20
30
40
50
Q12009
Q2 Q3 Q4 Q12010
Q2 Q3 Q4 Q12011
Q2 Q3 Q4 Q12012
Q2 Q3
Net sales EBIT-%
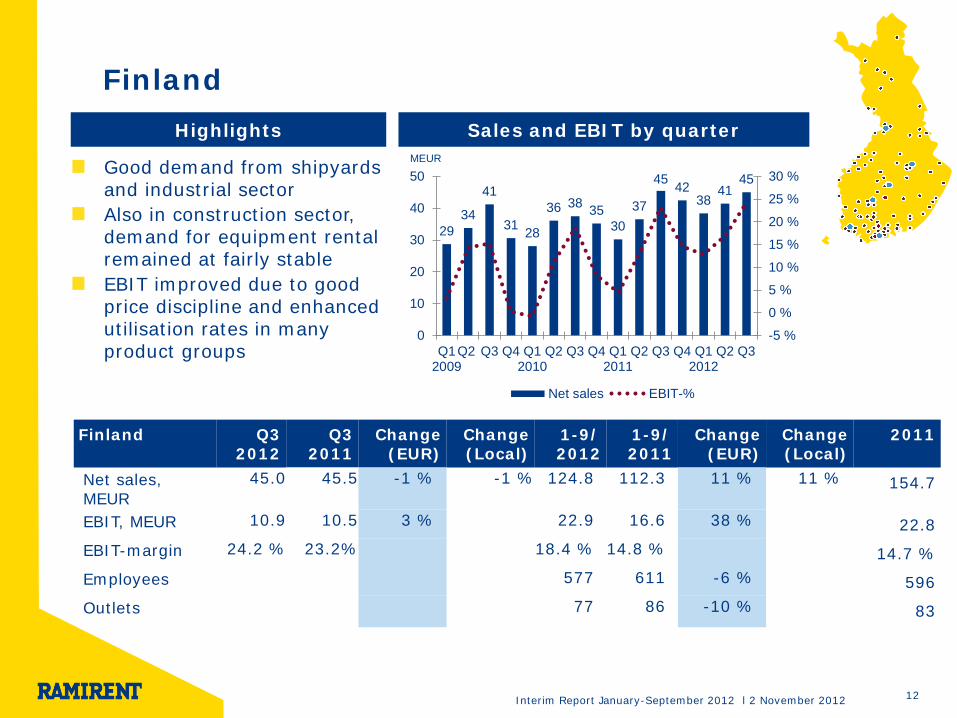
Finland
Good demand from shipyards and industrial sector Also in construction sector, demand for equipment rental remained at fairly stable EBIT improved due to good price discipline and enhanced utilisation rates in many product groups
12
MEUR
Highlights Sales and EBIT by quarter
Finland Q3 2012
Q3 2011
Change (EUR)
Change (Local)
1-9/ 2012
1-9/ 2011
Change (EUR)
Change (Local)
2011
Net sales, MEUR
45.0 45.5 -1 % -1 % 124.8 112.3 11 % 11 % 154.7
EBIT, MEUR 10.9 10.5 3 % 22.9 16.6 38 % 22.8 EBIT-margin 24.2 % 23.2% 18.4 % 14.8 % 14.7 % Employees 577 611 -6 % 596 Outlets 77 86 -10 % 83

Interim Report January-September 2012 l 2 November 2012
Sweden
13
Despite the expectations, activity in construction sector proved to be resilient, with main growth drivers being large industrial projects in Northern Sweden and strong demand in the capital city area and Western Sweden Low activity continued in the southern parts of the country EBIT development stable
32 33 31 32 29 35 36
45 41 42 45
54 48 51 53
0 %
5 %
10 %
15 %
20 %
25 %
0
10
20
30
40
50
60
Q12009
Q2 Q3 Q4 Q12010
Q2 Q3 Q4 Q12011
Q2 Q3 Q4 Q12012
Q2 Q3
Net sales EBIT-%
MEUR
Highlights Sales and EBIT by quarter
Sweden Q3 2012
Q3 2011
Change (EUR)
Change (Local)
1-9/ 2012
1-9/ 2011
Change (EUR)
Change (Local)
2011
Net sales, MEUR 53.0 45.4 17 % 8 % 152.1 128.8 18 % 14 % 182.7
EBIT, MEUR 8.7 8.2 7 % 23.8 21.3 12 % 33.2
EBIT-margin 16.4 % 18.0 % 15.7 % 16.5 % 18.2%
Employees 680 622 9 % 630 Outlets 84 80 5 % 79

Interim Report January-September 2012 l 2 November 2012
Norway
14
In the quarter, Ramirent continued to experience good demand from construction as well as other industrial sectors. EBIT improved on the back of improved operational efficiency, higher utilisation rates and increased price levels in most product groups.
29 25 27 29 28 27 28
31 33 30
40 42 44 38
41
-5 %
0 %
5 %
10 %
15 %
20 %
0
10
20
30
40
50
Q12009
Q2 Q3 Q4 Q12010
Q2 Q3 Q4 Q12011
Q2 Q3 Q4 Q12012
Q2 Q3
Net sales EBIT-%
MEUR
Highlights Sales and EBIT by quarter
Norway Q3 2012
Q3 2011
Change (EUR)
Change (Local)
1-9/ 2012
1-9/ 2011
Change (EUR)
Change (Local)
2011
Net sales, MEUR 41.1 39.7 4 % -2 % 123.0 102.8 20 % 15 % 144.8
EBIT, MEUR 6.4 3.9 62 % 15.7 6.7 134 % 11.2 EBIT-margin 15.6 % 9.9 % 12.8 % 6.5 % 7.7% Employees 465 523 -11 % 486 Outlets 43 44 -2 % 42
Interim Report January-September 2012 l 2 November 2012
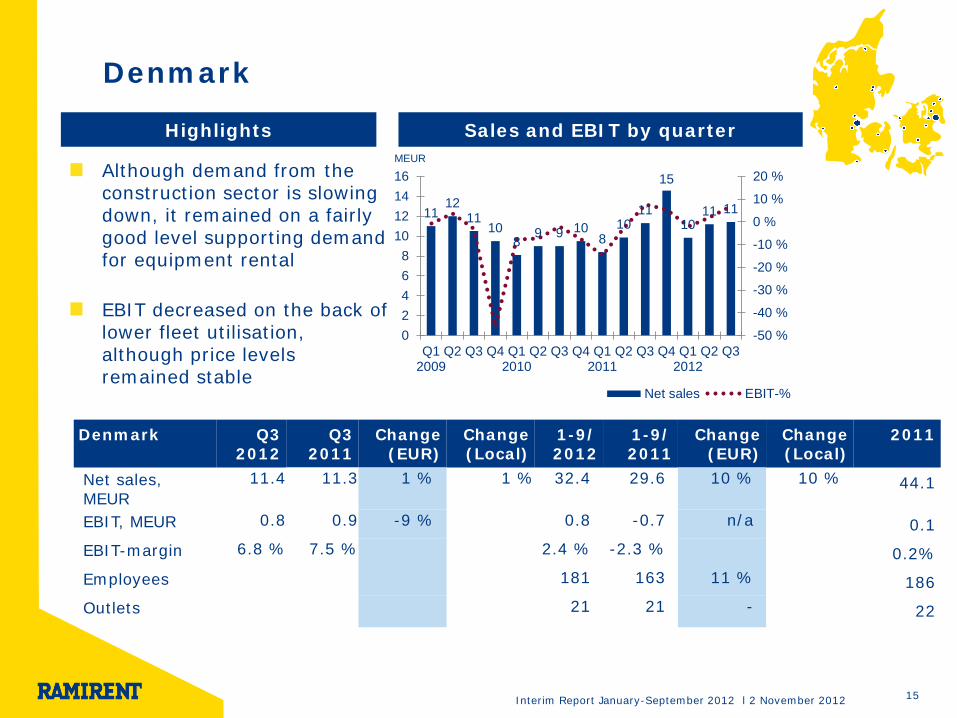
Denmark
15
Although demand from the construction sector is slowing down, it remained on a fairly good level supporting demand for equipment rental EBIT decreased on the back of lower fleet utilisation, although price levels remained stable
11 12
11 10
8 9 9 10
8 10
11
15
10 11 11
-50 %
-40 %
-30 %
-20 %
-10 %
0 %
10 %
20 %
02468
10121416
Q12009
Q2 Q3 Q4 Q12010
Q2 Q3 Q4 Q12011
Q2 Q3 Q4 Q12012
Q2 Q3
Net sales EBIT-%
MEUR
Highlights Sales and EBIT by quarter
Denmark Q3 2012
Q3 2011
Change (EUR)
Change (Local)
1-9/ 2012
1-9/ 2011
Change (EUR)
Change (Local)
2011
Net sales, MEUR
11.4 11.3 1 % 1 % 32.4 29.6 10 % 10 % 44.1
EBIT, MEUR 0.8 0.9 -9 % 0.8 -0.7 n/a 0.1 EBIT-margin 6.8 % 7.5 % 2.4 % -2.3 % 0.2% Employees 181 163 11 % 186 Outlets 21 21 - 22
Interim Report January-September 2012 l 2 November 2012
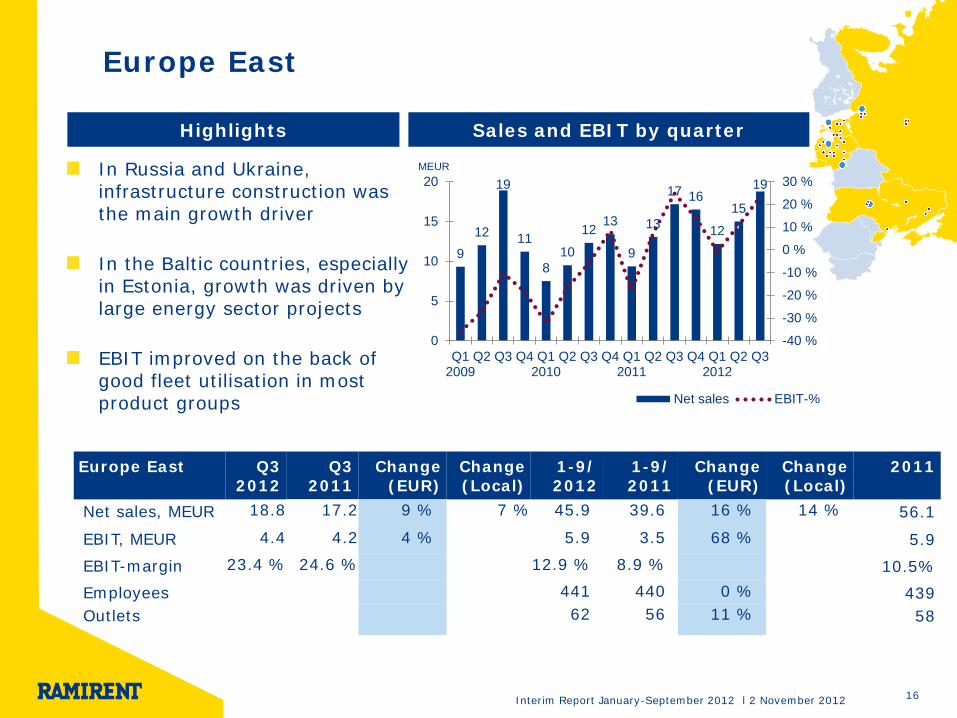
Europe East
16
In Russia and Ukraine, infrastructure construction was the main growth driver In the Baltic countries, especially in Estonia, growth was driven by large energy sector projects EBIT improved on the back of good fleet utilisation in most product groups
9 12
19
11
8 10
12 13
9
13
17 16
12
15
19
-40 %
-30 %
-20 %
-10 %
0 %
10 %
20 %
30 %
0
5
10
15
20
Q12009
Q2 Q3 Q4 Q12010
Q2 Q3 Q4 Q12011
Q2 Q3 Q4 Q12012
Q2 Q3
Net sales EBIT-%
MEUR
Highlights Sales and EBIT by quarter
Europe East Q3 2012
Q3 2011
Change (EUR)
Change (Local)
1-9/ 2012
1-9/ 2011
Change (EUR)
Change (Local)
2011
Net sales, MEUR 18.8 17.2 9 % 7 % 45.9 39.6 16 % 14 % 56.1
EBIT, MEUR 4.4 4.2 4 % 5.9 3.5 68 % 5.9 EBIT-margin 23.4 % 24.6 % 12.9 % 8.9 % 10.5% Employees 441 440 0 % 439 Outlets 62 56 11 % 58
Interim Report January-September 2012 l 2 November 2012
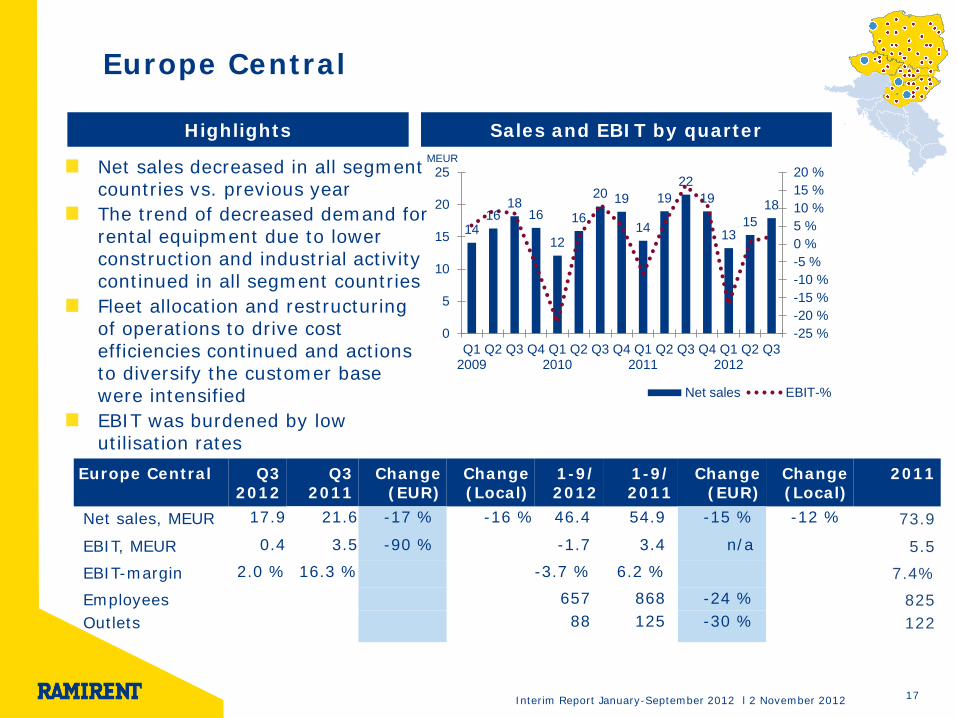
Europe Central
17
Net sales decreased in all segment countries vs. previous year The trend of decreased demand for rental equipment due to lower construction and industrial activity continued in all segment countries Fleet allocation and restructuring of operations to drive cost efficiencies continued and actions to diversify the customer base were intensified EBIT was burdened by low utilisation rates
14 16
18 16
12
16
20 19
14
19 22
19
13 15
18
-25 %-20 %-15 %-10 %-5 %0 %5 %10 %15 %20 %
0
5
10
15
20
25
Q12009
Q2 Q3 Q4 Q12010
Q2 Q3 Q4 Q12011
Q2 Q3 Q4 Q12012
Q2 Q3
Net sales EBIT-%
MEUR
Highlights Sales and EBIT by quarter
Europe Central Q3 2012
Q3 2011
Change (EUR)
Change (Local)
1-9/ 2012
1-9/ 2011
Change (EUR)
Change (Local)
2011
Net sales, MEUR 17.9 21.6 -17 % -16 % 46.4 54.9 -15 % -12 % 73.9
EBIT, MEUR 0.4 3.5 -90 % -1.7 3.4 n/a 5.5 EBIT-margin 2.0 % 16.3 % -3.7 % 6.2 % 7.4% Employees 657 868 -24 % 825 Outlets 88 125 -30 % 122
Interim Report January-September 2012 l 2 November 2012
FINANCIAL REVIEW
18
Kymijoki bridge, Finland

Interim Report January-September 2012 l 2 November 2012
Net sales growth slows, profitability stable
19
Net Sales (MEUR) EBITDA (MEUR)
Cash flow (MEUR) Net debt (MEUR) Gross Capex (MEUR)
EBIT (MEUR)
3 5 3 8 13 22
10 18
32 45
120
46 36
24 28
0 %10 %20 %30 %40 %50 %60 %70 %80 %
0
20
40
60
80
100
120
140
Q12009
Q2Q3Q4Q12010
Q2Q3Q4Q12011
Q2Q3Q4Q12012
Q2Q3
Gross Capex Share of net sales-%281
255 230
207 212 209 197 177 191
238
280 263 258
281 256
0 %
20 %
40 %
60 %
80 %
100 %
120 %
0
50
100
150
200
250
300
Q12009
Q2 Q3Q4Q12010
Q2Q3Q4Q12011
Q2Q3Q4Q12012
Q2Q3
Net debt Gearing-%
7
14 12
-4 -6
7
17 11
3
15
31 25
12
23
30
-10 %
-5 %
0 %
5 %
10 %
15 %
20 %
-10-505
101520253035
Q12009
Q2Q3Q4Q12010
Q2Q3Q4Q12011
Q2Q3Q4Q12012
Q2Q3
EBIT EBIT-%
30 36 37
26 18
31
42 37
28
41
59 55
42
52 60
0 %
5 %
10 %
15 %
20 %
25 %
30 %
35 %
0
10
20
30
40
50
60
70
Q12009
Q2Q3Q4Q12010
Q2Q3Q4Q12011
Q2Q3Q4Q12012
Q2Q3
EBITDA EBITDA-%
122 125 130 126 112
129 141 150
134 150
179 187 164 170
186
-40 %-30 %-20 %-10 %0 %10 %20 %30 %40 %
020406080
100120140160180200
Q12009
Q2Q3Q4Q12010
Q2Q3Q4Q12011
Q2Q3Q4Q12012
Q2Q3
Net sales Y-o-y change-%
18 28
22 20
-4
13 14 24
-11 -20
-37
16 6 7
24
-50-40-30-20-10
010203040
Q12009
Q2 Q3Q4Q12010
Q2Q3Q4Q12011
Q2Q3Q4Q12012
Q2Q3
Cash flow after investments
Interim Report January-September 2012 l 2 November 2012
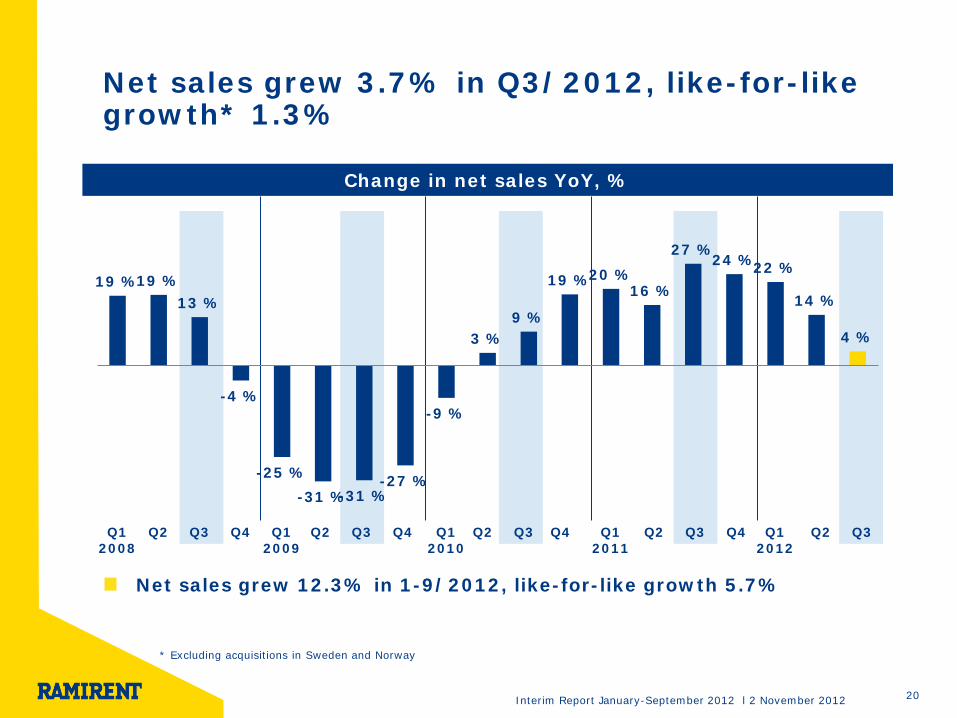
Net sales grew 3.7% in Q3/2012, like-for-like growth* 1.3%
Net sales grew 12.3% in 1-9/2012, like-for-like growth 5.7%
20
Change in net sales YoY, %
* Excluding acquisitions in Sweden and Norway
19 % 19 % 13 %
-4 %
-25 % -31 % -31 %
-27 %
-9 %
3 % 9 %
19 % 20 % 16 %
27 % 24 % 22 %
14 %
4 %
Q12008
Q2 Q3 Q4 Q12009
Q2 Q3 Q4 Q12010
Q2 Q3 Q4 Q12011
Q2 Q3 Q4 Q12012
Q2 Q3
Interim Report January-September 2012 l 2 November 2012 21
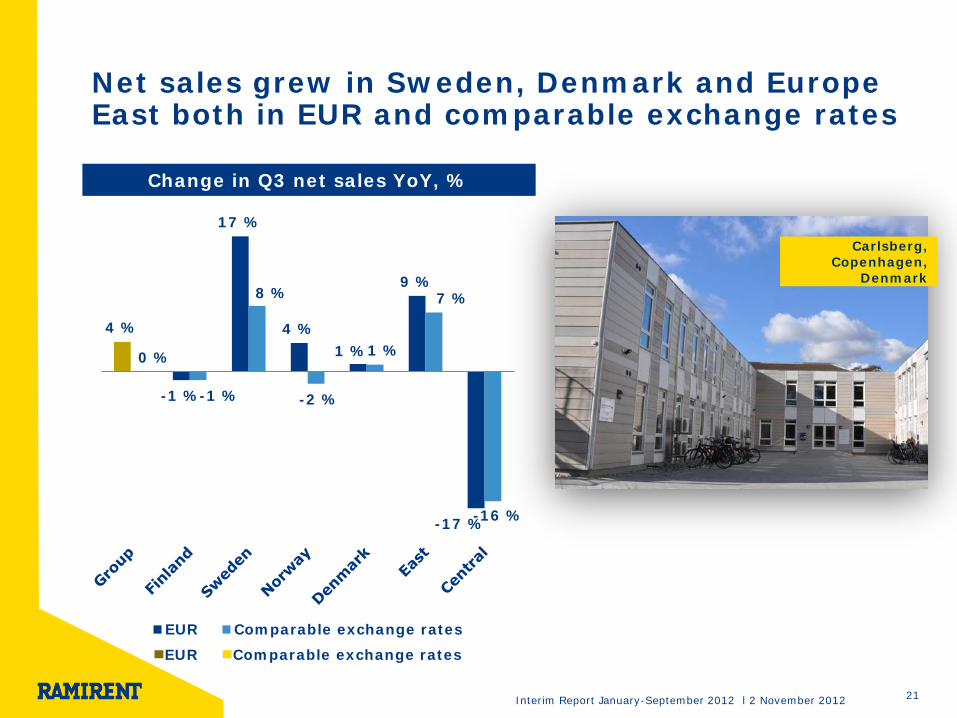
4 %
-1 %
17 %
4 % 1 %
9 %
-17 %
0 %
-1 %
8 %
-2 %
1 %
7 %
-16 %
EUR Comparable exchange rates
Change in Q3 net sales YoY, %
Net sales grew in Sweden, Denmark and Europe East both in EUR and comparable exchange rates
EUR Comparable exchange rates
Carlsberg, Copenhagen,
Denmark
Interim Report January-September 2012 l 2 November 2012
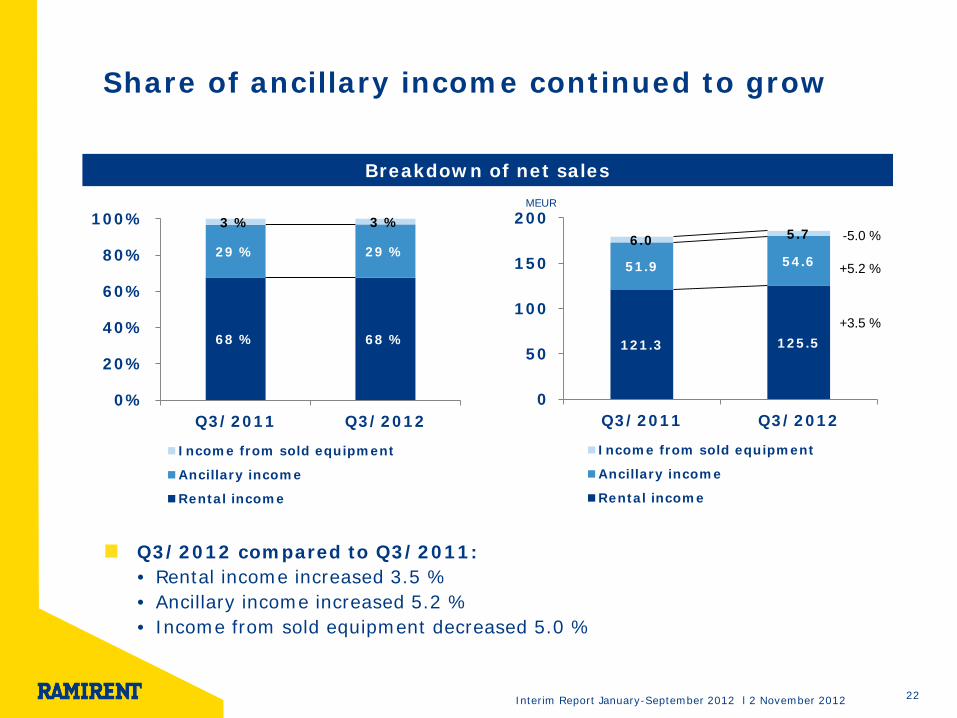
Share of ancillary income continued to grow
Q3/2012 compared to Q3/2011: • Rental income increased 3.5 % • Ancillary income increased 5.2 % • Income from sold equipment decreased 5.0 %
22
68 % 68 %
29 % 29 %
3 % 3 %
0%
20%
40%
60%
80%
100%
Q3/2011 Q3/2012
Income from sold equipment
Ancillary income
Rental income
Breakdown of net sales
121.3 125.5
51.9 54.6 6.0 5.7
0
50
100
150
200
Q3/2011 Q3/2012
Income from sold equipment
Ancillary income
Rental income
MEUR
-5.0 %
+5.2 %
+3.5 %
Interim Report January-September 2012 l 2 November 2012
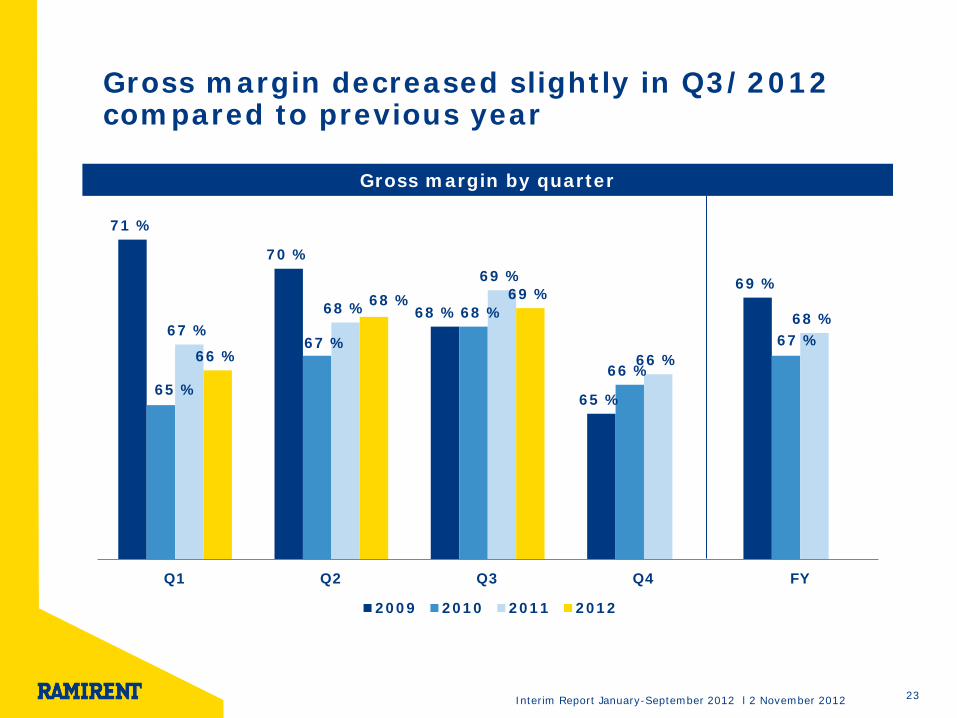
Gross margin decreased slightly in Q3/2012 compared to previous year
23
Gross margin by quarter
71 %
70 %
68 %
65 %
69 %
65 %
67 %
68 %
66 %
67 % 67 % 68 %
69 %
66 %
68 %
66 %
68 % 69 %
Q1 Q2 Q3 Q4 FY
2009 2010 2011 2012
Interim Report January-September 2012 l 2 November 2012
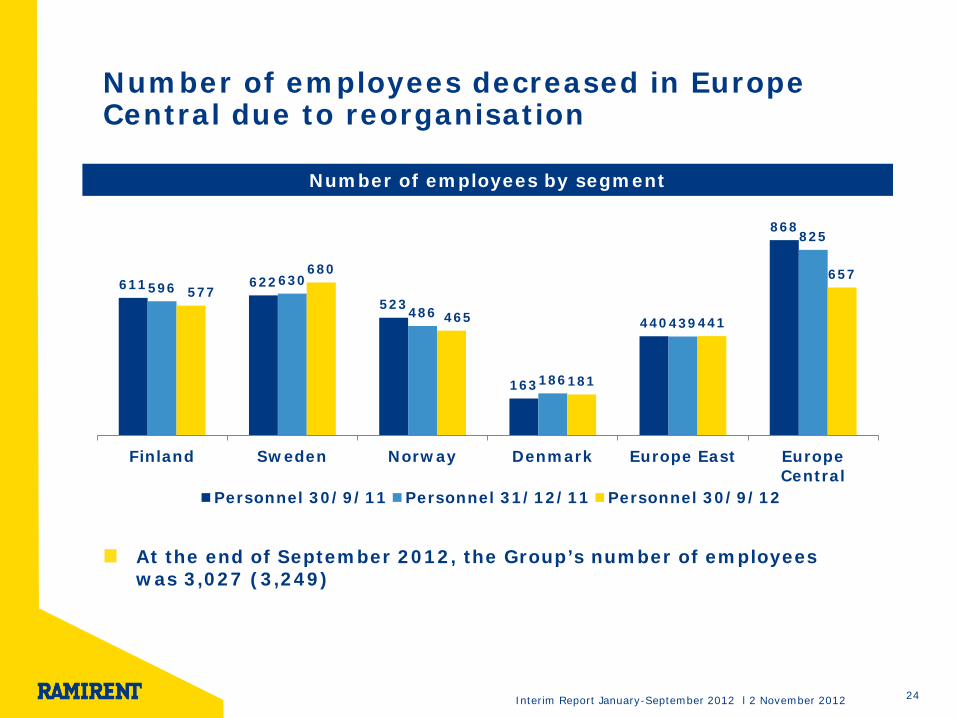
Number of employees decreased in Europe Central due to reorganisation
At the end of September 2012, the Group’s number of employees was 3,027 (3,249)
24
Number of employees by segment
611 622 523
163
440
868
596 630
486
186
439
825
577
680
465
181
441
657
Finland Sweden Norway Denmark Europe East EuropeCentral
Personnel 30/9/11 Personnel 31/12/11 Personnel 30/9/12
Interim Report January-June 2012 l 9 August 2012
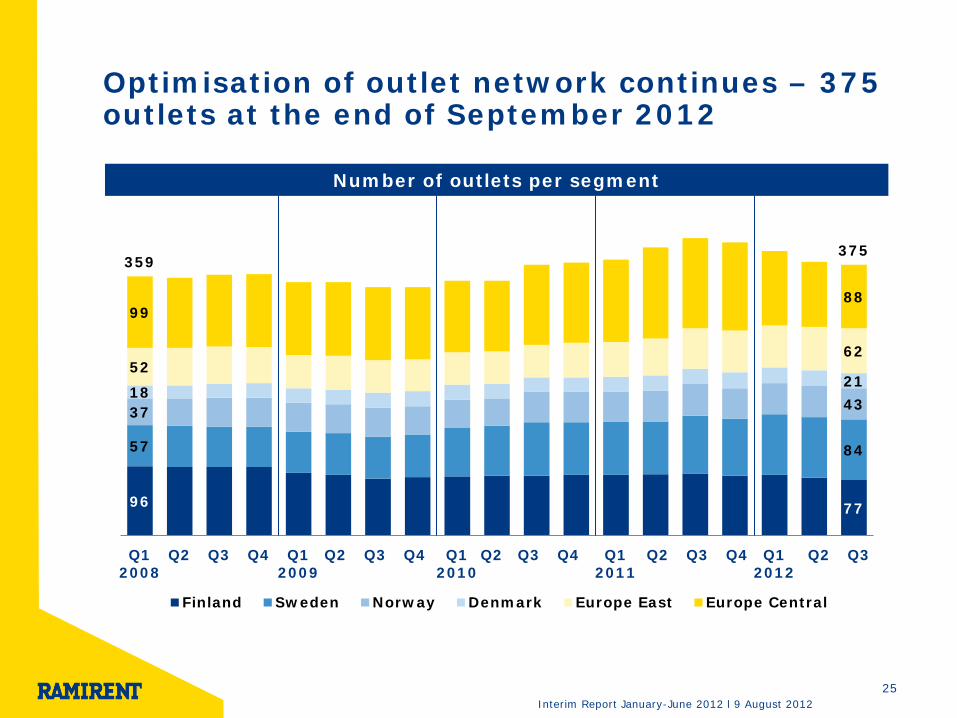
Optimisation of outlet network continues – 375 outlets at the end of September 2012
96 77
57 84
37 43 18
21 52
62
99 88
359 375
Q12008
Q2 Q3 Q4 Q12009
Q2 Q3 Q4 Q12010
Q2 Q3 Q4 Q12011
Q2 Q3 Q4 Q12012
Q2 Q3
Finland Sweden Norway Denmark Europe East Europe Central
25
Number of outlets per segment
Interim Report January-September 2012 l 2 November 2012
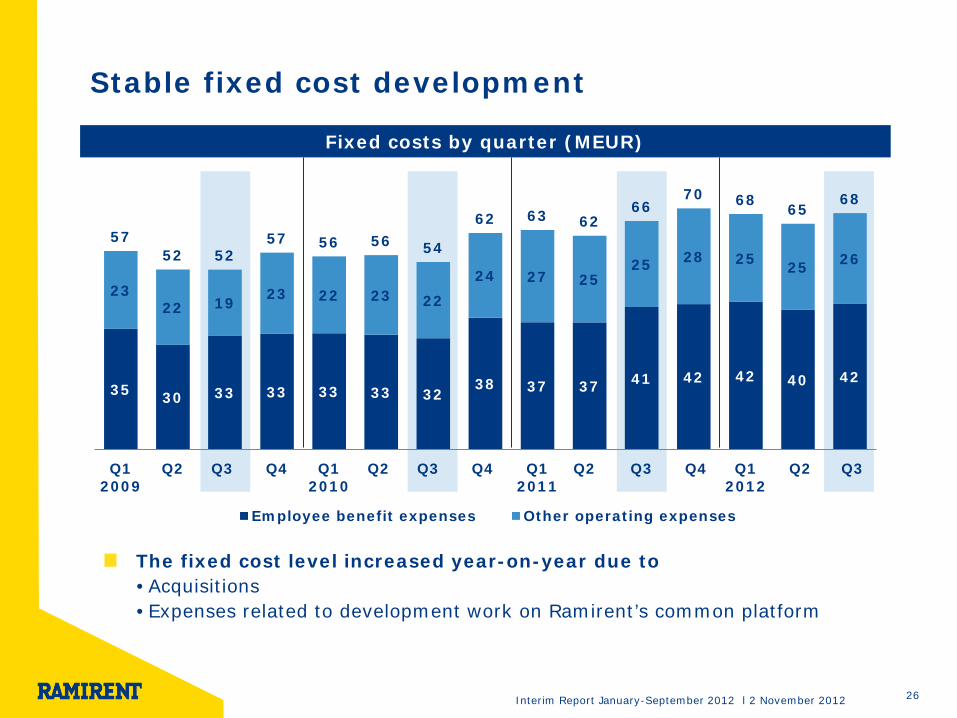
Stable fixed cost development
The fixed cost level increased year-on-year due to • Acquisitions • Expenses related to development work on Ramirent’s common platform
26
Fixed costs by quarter (MEUR)
35 30 33 33 33 33 32 38 37 37 41 42 42 40 42
23 22 19 23 22 23 22
24 27 25 25 28 25 25 26
57 52 52
57 56 56 54
62 63 62 66
70 68 65 68
Q12009
Q2 Q3 Q4 Q12010
Q2 Q3 Q4 Q12011
Q2 Q3 Q4 Q12012
Q2 Q3
Employee benefit expenses Other operating expenses
Interim Report January-September 2012 l 2 November 2012
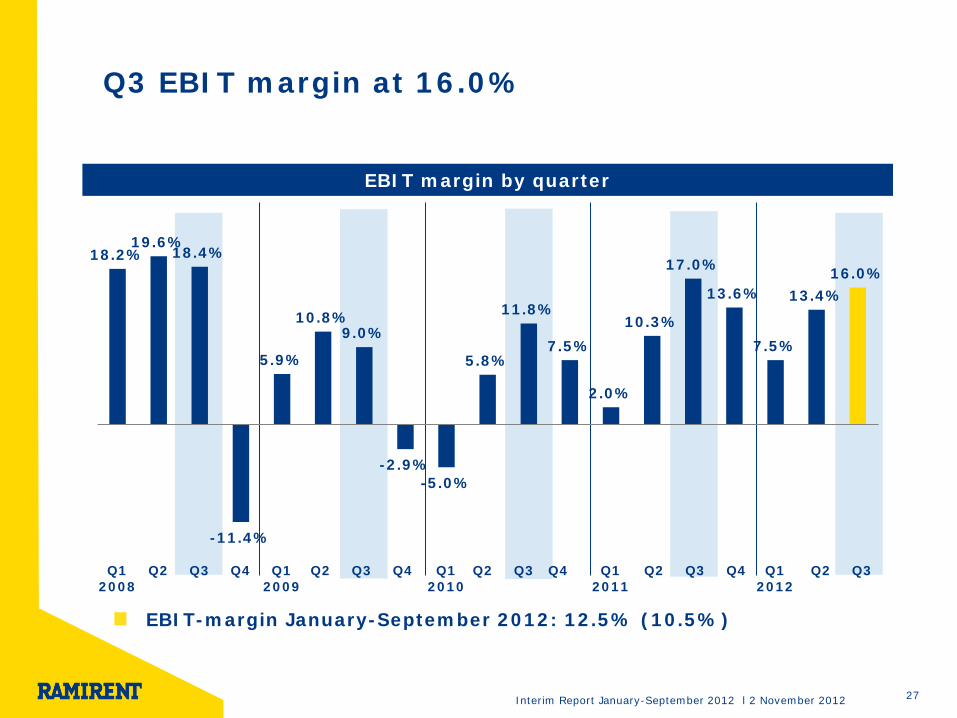
EBIT-margin January-September 2012: 12.5% (10.5%)
Q3 EBIT margin at 16.0%
27
EBIT margin by quarter
18.2% 19.6%
18.4%
-11.4%
5.9%
10.8% 9.0%
-2.9% -5.0%
5.8%
11.8%
7.5%
2.0%
10.3%
17.0%
13.6%
7.5%
13.4% 16.0%
Q12008
Q2 Q3 Q4 Q12009
Q2 Q3 Q4 Q12010
Q2 Q3 Q4 Q12011
Q2 Q3 Q4 Q12012
Q2 Q3
Interim Report January-September 2012 l 2 November 2012
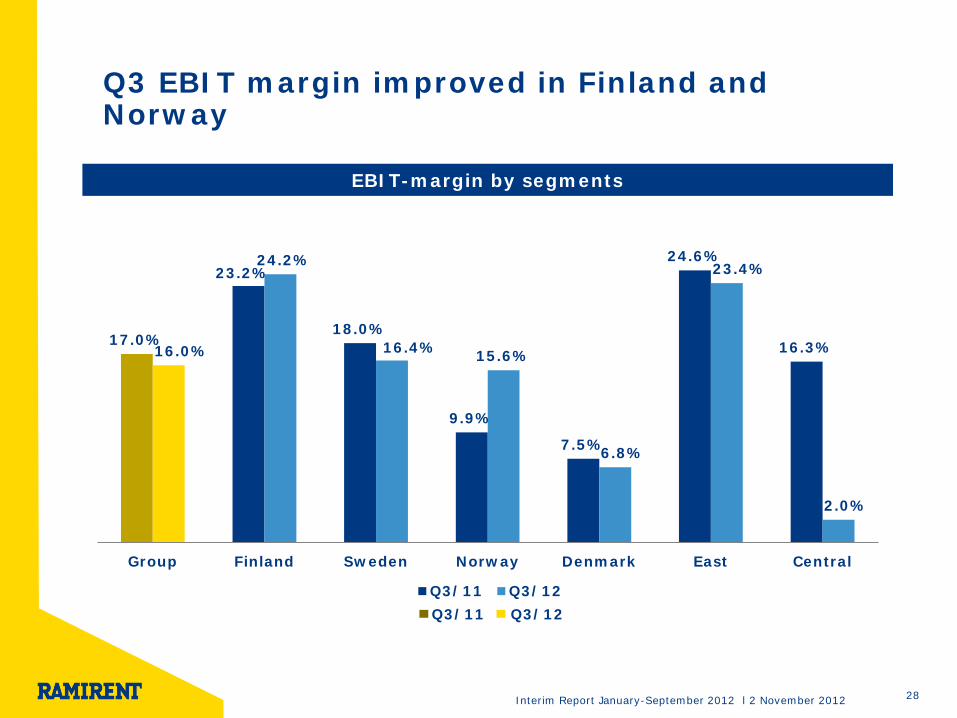
Q3 EBIT margin improved in Finland and Norway
28
17.0%
23.2%
18.0%
9.9%
7.5%
24.6%
16.3% 16.0%
24.2%
16.4% 15.6%
6.8%
23.4%
2.0%
Group Finland Sweden Norway Denmark East Central
Q3/11 Q3/12
EBIT-margin by segments
Q3/11 Q3/12

Interim Report January-September 2012 l 2 November 2012
30
38
67
34
20 22 25
4 5 6 12
8 6 6
Q12011
Q2 Q3 Q4 Q12012
Q2 Q3
Purchased equipment Sold equipment
Q3/2012 rental fleet investments were 25.3 MEUR
In Q3/2012, gross capital expenditure was EUR 27.6 (119.9) million of which EUR 25.3 (66.8) million in rental fleet The value of sold rental equipment was EUR 5.7 (6.0) million Committed investments at the end of quarter were EUR 8.4 (10.6) million
29
Purchased and sold equipment by quarter (MEUR)
Interim Report January-September 2012 l 2 November 2012
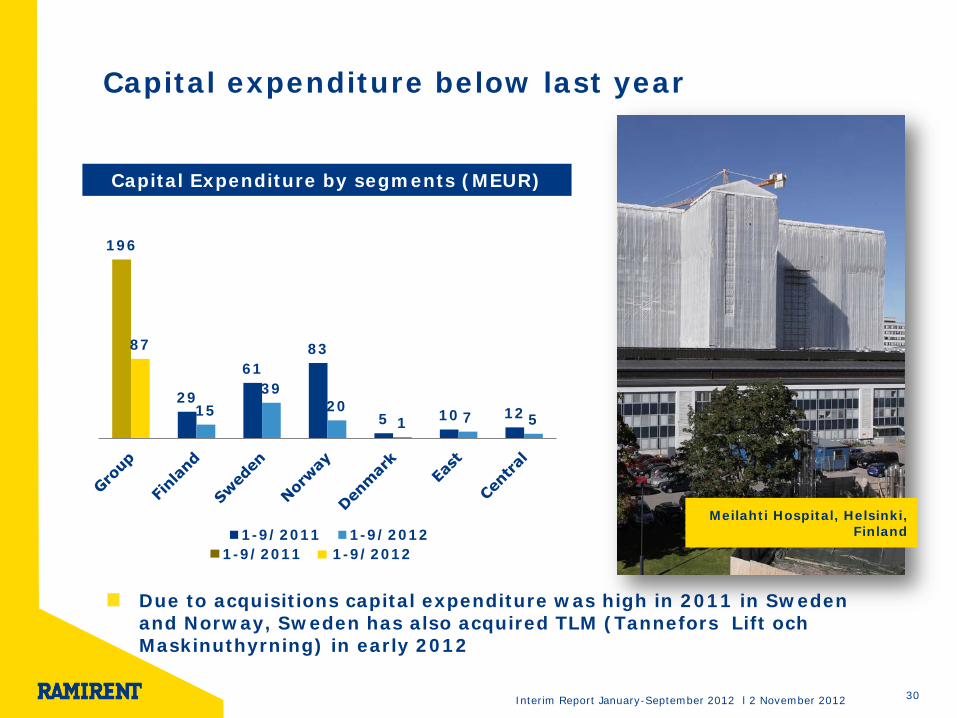
Capital expenditure below last year
Due to acquisitions capital expenditure was high in 2011 in Sweden and Norway, Sweden has also acquired TLM (Tannefors Lift och Maskinuthyrning) in early 2012
30
196
29
61 83
5 10 12
87
15 39
20 1 7 5
1-9/2011 1-9/2012
Capital Expenditure by segments (MEUR)
1-9/2011 1-9/2012
Meilahti Hospital, Helsinki, Finland
Interim Report January-September 2012 l 2 November 2012
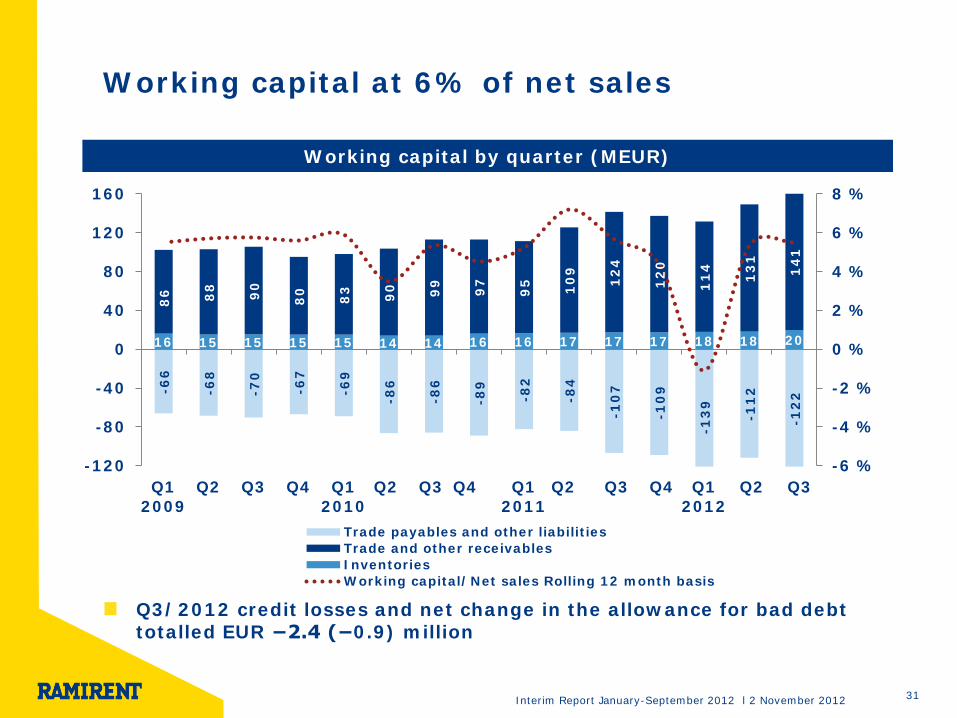
Working capital at 6% of net sales
Q3/2012 credit losses and net change in the allowance for bad debt totalled EUR −2.4 (−0.9) million
31
16 15 15 15 15 14 14 16 16 17 17 17 18 18 20
86
88
90
80
83
90
99
97
95
10
9
12
4
12
0
11
4
13
1
14
1
-66
-68
-70
-67
-69
-86
-86
-89
-82
-84
-10
7
-10
9
-13
9
-11
2
-12
2
-6 %
-4 %
-2 %
0 %
2 %
4 %
6 %
8 %
-120
-80
-40
0
40
80
120
160
Q12009
Q2 Q3 Q4 Q12010
Q2 Q3 Q4 Q12011
Q2 Q3 Q4 Q12012
Q2 Q3
Trade payables and other liabilitiesTrade and other receivablesInventoriesWorking capital/Net sales Rolling 12 month basis
Working capital by quarter (MEUR)
Interim Report January-September 2012 l 2 November 2012
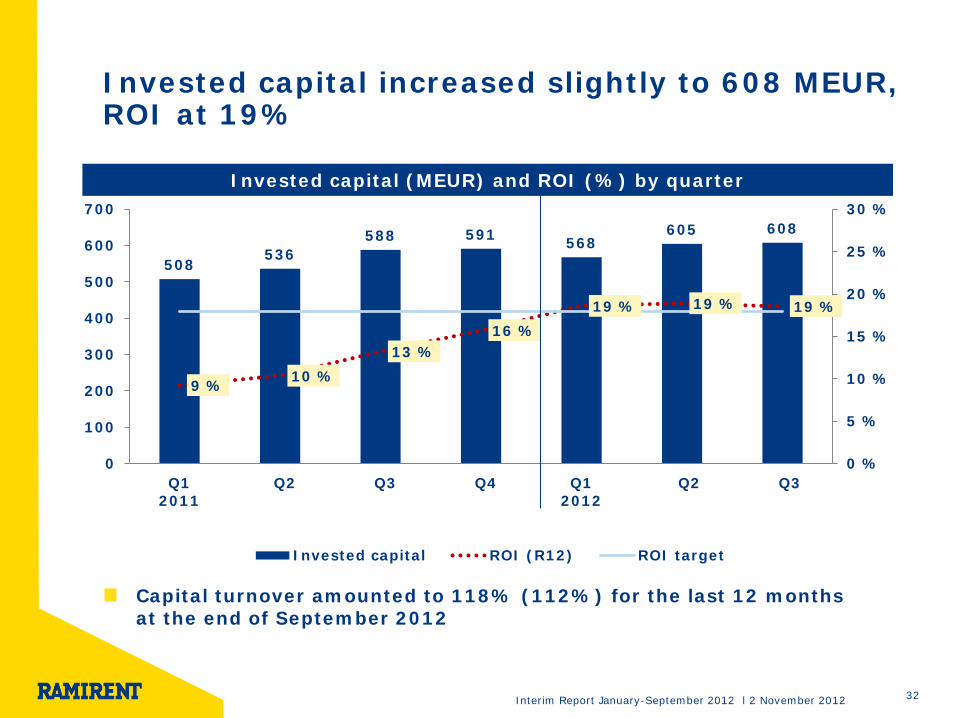
Invested capital increased slightly to 608 MEUR, ROI at 19%
Capital turnover amounted to 118% (112%) for the last 12 months at the end of September 2012
32
508 536
588 591 568 605 608
9 % 10 % 13 %
16 % 19 % 19 % 19 %
0 %
5 %
10 %
15 %
20 %
25 %
30 %
0
100
200
300
400
500
600
700
Q12011
Q2 Q3 Q4 Q12012
Q2 Q3
Invested capital ROI (R12) ROI target
Invested capital (MEUR) and ROI (%) by quarter
Interim Report January-September 2012 l 2 November 2012
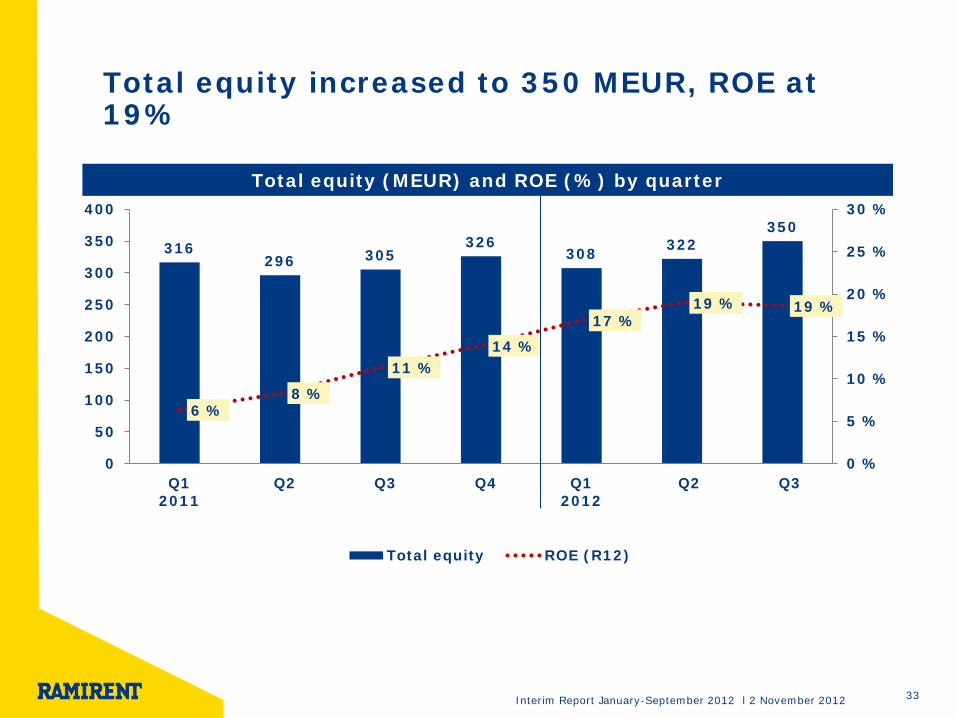
Total equity increased to 350 MEUR, ROE at 19%
33
316 296 305
326 308 322
350
6 % 8 %
11 % 14 %
17 % 19 % 19 %
0 %
5 %
10 %
15 %
20 %
25 %
30 %
0
50
100
150
200
250
300
350
400
Q12011
Q2 Q3 Q4 Q12012
Q2 Q3
Total equity ROE (R12)
Total equity (MEUR) and ROE (%) by quarter
Interim Report January-September 2012 l 2 November 2012
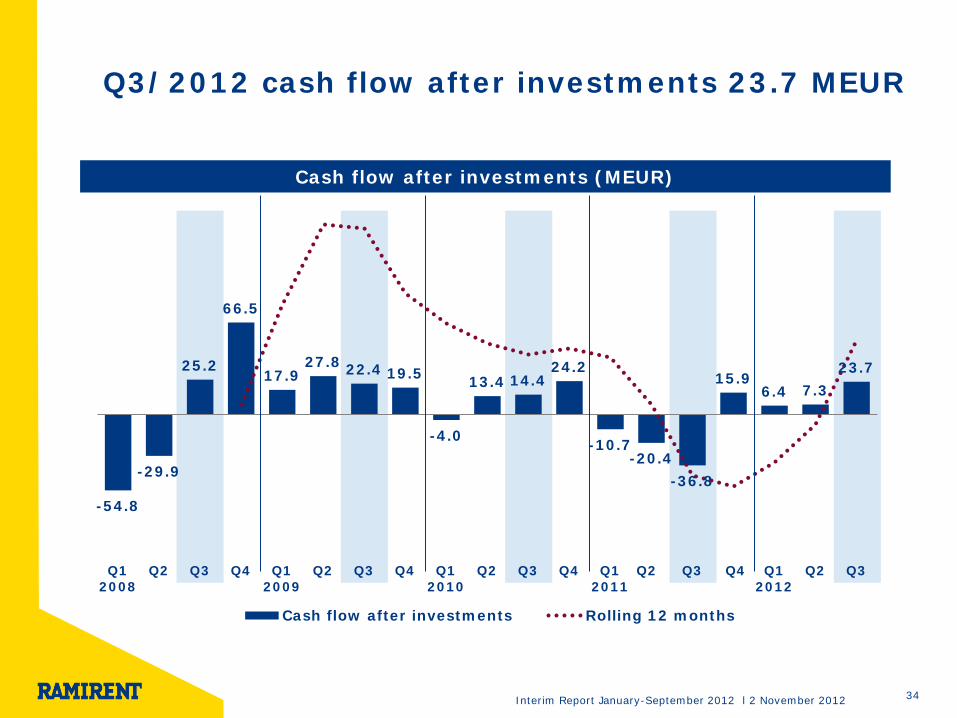
-54.8
-29.9
25.2
66.5
17.9 27.8 22.4 19.5
-4.0
13.4 14.4 24.2
-10.7 -20.4
-36.8
15.9 6.4 7.3
23.7
Q12008
Q2 Q3 Q4 Q12009
Q2 Q3 Q4 Q12010
Q2 Q3 Q4 Q12011
Q2 Q3 Q4 Q12012
Q2 Q3
Cash flow after investments Rolling 12 months
Q3/2012 cash flow after investments 23.7 MEUR
34
Cash flow after investments (MEUR)
Interim Report January-September 2012 l 2 November 2012
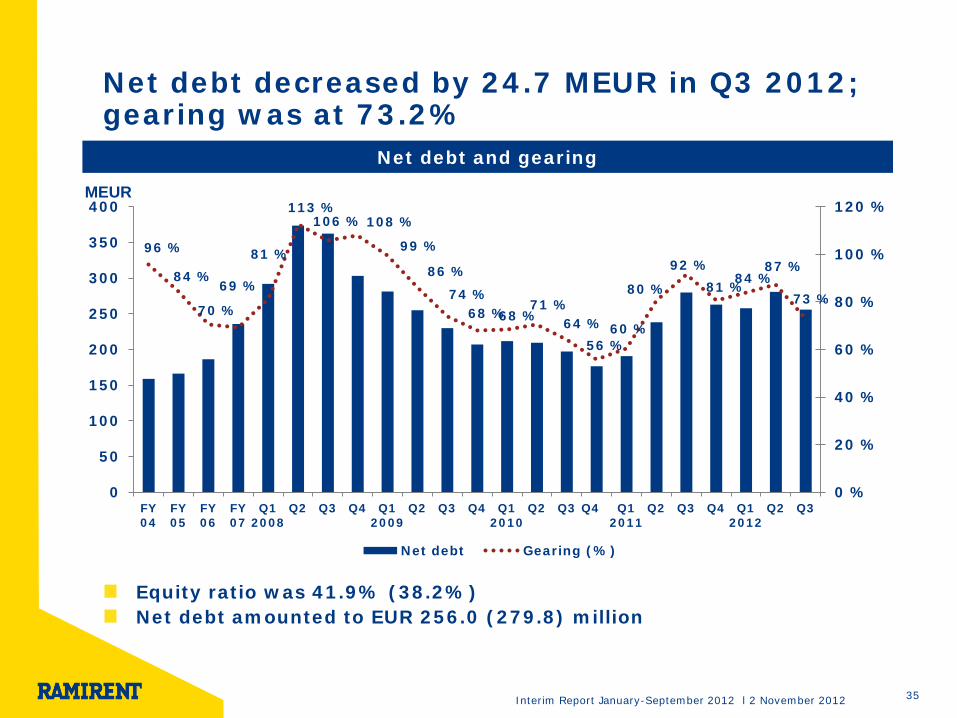
96 %
84 %
70 %
69 %
81 %
113 % 106 % 108 %
99 %
86 %
74 % 68 % 68 %
71 % 64 %
56 % 60 %
80 %
92 % 81 % 84 %
87 %
73 %
0 %
20 %
40 %
60 %
80 %
100 %
120 %
0
50
100
150
200
250
300
350
400
FY04
FY05
FY06
FY07
Q12008
Q2 Q3 Q4 Q12009
Q2 Q3 Q4 Q12010
Q2 Q3 Q4 Q12011
Q2 Q3 Q4 Q12012
Q2 Q3
Net debt Gearing (%)
Net debt decreased by 24.7 MEUR in Q3 2012; gearing was at 73.2%
Equity ratio was 41.9% (38.2%) Net debt amounted to EUR 256.0 (279.8) million
35
Net debt and gearing
MEUR

Interim Report January-September 2012 l 2 November 2012
At end of Q3/12, Ramirent had unused committed back-up facilities of 134.2 MEUR
In addition to bank facilities, Ramirent is utilising a domestic commercial paper program of up to EUR 150 million
36
150
240
2012 2013 2014 2015 2016 2017
Repayment schedule of interest-bearing liabilities (MEUR)
390 MEUR in committed credit facilities
256.0 MEUR in net debt
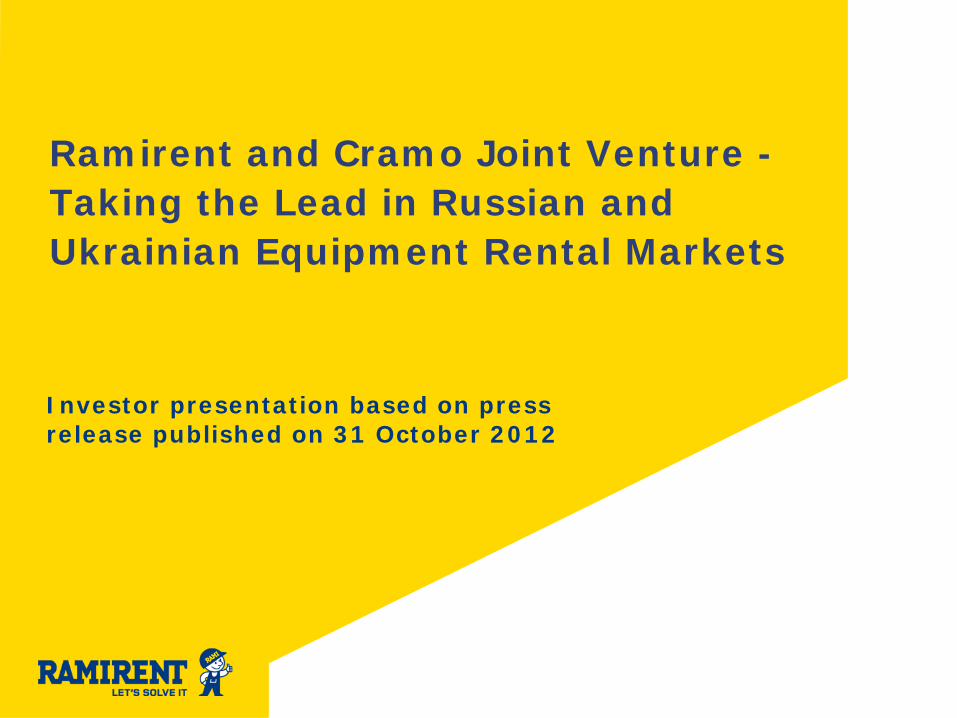
Ramirent and Cramo Joint Venture - Taking the Lead in Russian and Ukrainian Equipment Rental Markets
Investor presentation based on press release published on 31 October 2012
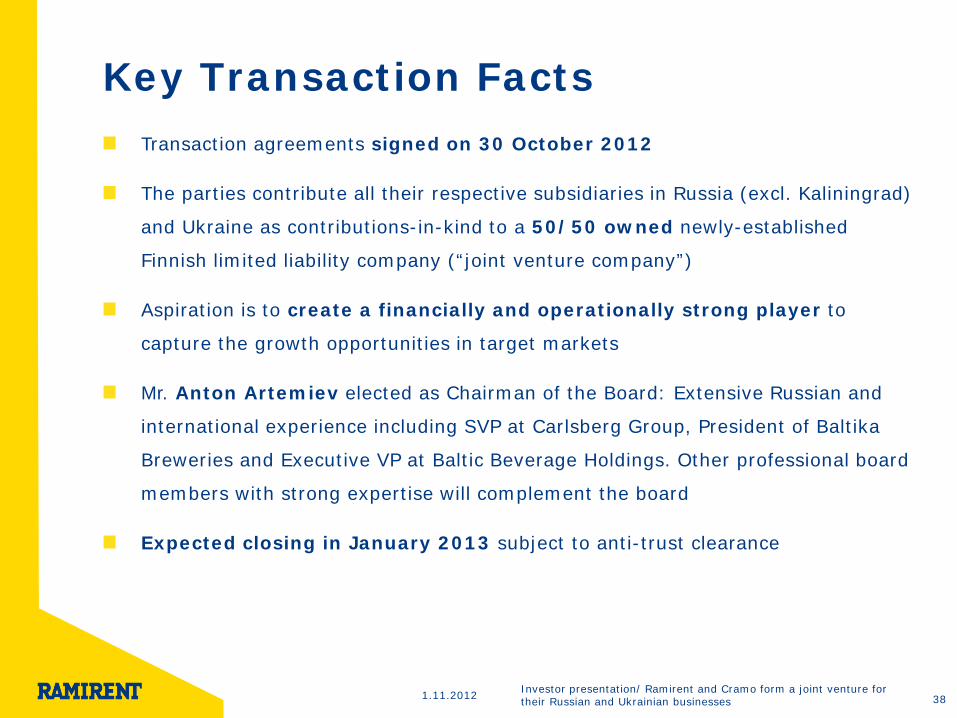
Key Transaction Facts Transaction agreements signed on 30 October 2012
The parties contribute all their respective subsidiaries in Russia (excl. Kaliningrad)
and Ukraine as contributions-in-kind to a 50/50 owned newly-established
Finnish limited liability company (“joint venture company”)
Aspiration is to create a financially and operationally strong player to
capture the growth opportunities in target markets
Mr. Anton Artemiev elected as Chairman of the Board: Extensive Russian and
international experience including SVP at Carlsberg Group, President of Baltika
Breweries and Executive VP at Baltic Beverage Holdings. Other professional board
members with strong expertise will complement the board
Expected closing in January 2013 subject to anti-trust clearance
1.11.2012 38 Investor presentation/ Ramirent and Cramo form a joint venture for their Russian and Ukrainian businesses

Creating the Leading Rental Company in Russia and Ukraine
Key Facts
A stand-alone entity with new corporate identity 50/50 ownership between Cramo and Ramirent 2012E net sales and EBITDA margin of €52 million and ~35%, respectively 400 employees Depot locations: St. Petersburg region 7, Moscow region 6, other regions Russia 3, Ukraine 6 (+ 6 shop-in-shop outlets)
Cramo Group Ramirent Group
UKRAINE
RUSSIA
Combining Forces in Growing Markets… …Creates a Strong Stand-Alone Company
“50/50 JV”
Total Sales 2012E: €52m
50% 50%
Rationale is to create strong player with increased financial resources and excellent organisational capabilities to capture the growth opportunities in target markets
1.11.2012 Investor presentation/ Ramirent and Cramo form a joint venture for their Russian and Ukrainian businesses

Complementary Strengths and Strong Business Foundation
Cramo’s unique strengths
• Fleet and capabilities to
offer modular space to serve construction and industrial customers
• Good presence with international
construction and industrial customers • Existing platform location in Ural region
(Yekaterinburg)
Common strengths
• General rental concept • Broad equipment fleet
• Established presence in St. Petersburg and
Moscow • Strong local management
• Modern way-of-working due to the Western
background
Ramirent’s unique strengths
• Fleet and capabilities in heavy equipment to serve infrastructure construction • Large customer base • Presence in Ukraine
• Existing platform location in South region (Sochi)
• Expanded presence by utilizing sales agents
Combined company: Leading rental company in Russia and Ukraine
+ +
= 1.11.2012 Investor presentation/ Ramirent and Cramo form a joint venture for
their Russian and Ukrainian businesses
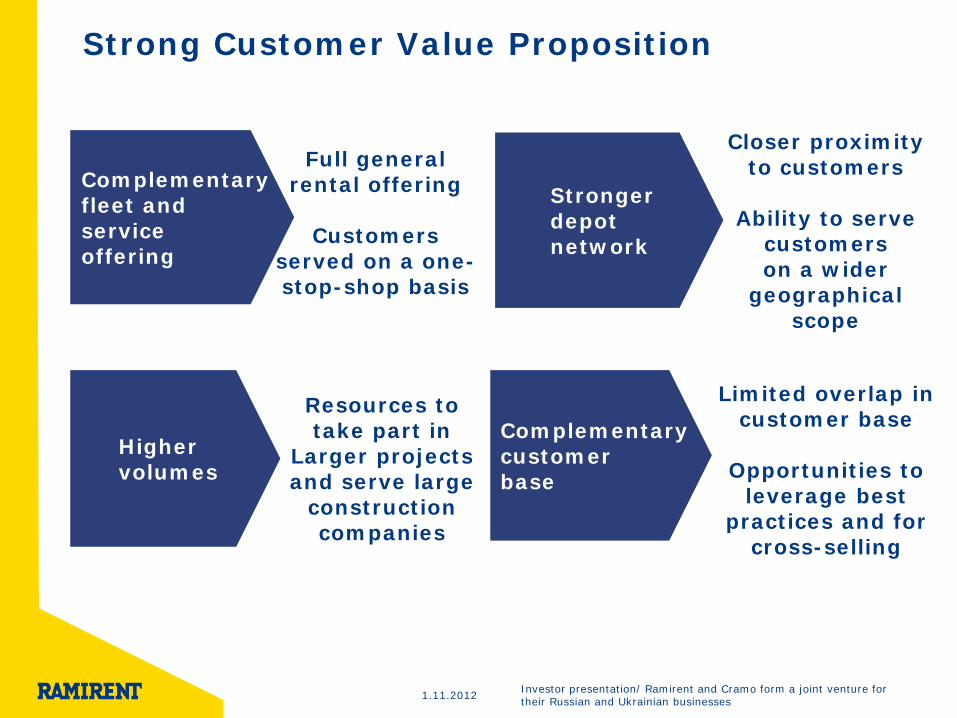
Strong Customer Value Proposition
Higher volumes
Complementary fleet and service offering
Stronger depot network
Complementary customer base
Resources to take part in
Larger projects and serve large
construction companies
Full general rental offering
Customers
served on a one-stop-shop basis
Closer proximity to customers
Ability to serve
customers on a wider
geographical scope
Limited overlap in customer base
Opportunities to
leverage best practices and for
cross-selling
1.11.2012 Investor presentation/ Ramirent and Cramo form a joint venture for their Russian and Ukrainian businesses

Attractive Market Outlook in Russia and Ukraine
Combined platform provides immediate expansion opportunities in the large St. Petersburg and Moscow regions
Improving rental penetration further supports the growth in the rental market
The underlying addressable construction market estimated well over €100bn with forecasted growth of 8% growth p.a.
Russian and Ukrainian rental markets are very fragmented with many players focusing on a single product group
St.P Mow
Strong Growth
Large Market
Clear Focus Opportunity
Leading Rental
Company
Improving Dynamics
Rental Penetration
Increase
Note: Addressable construction market comprises six federal districts in Russia (i.e. the European part) and Ukraine. Estimates regarding market size and growth based on management assessment.
1.11.2012 Investor presentation/ Ramirent and Cramo form a joint venture for their Russian and Ukrainian businesses

Financial Impact of Transaction and Changes in Reporting
Cash Contribution
Cramo will (due to its smaller operations in the said markets) make a payment of €9.2 million to Ramirent in order to reach equal ownership at the time of closing
Earnings impact
The transaction will not affect the revenue or result of Ramirent for 2012. The transaction will result in a non-recurring tax-free capital gain of
approximately EUR 12.3 million The final capital gain will be recorded at closing of the transaction, which
is estimated to take place in January 2013
The ownership in the joint venture will be accounted for in Ramirent’s consolidated financial statements using the equity method
The share of the profit of the joint venture will be booked in the consolidated Group profit and loss statement above EBITDA with one line method
The profit will be reported in the Europe East segment
Reporting
JV 2012E Net sales €52 million EBITDA margin of ~35% 400 employees
1.11.2012 Investor presentation/ Ramirent and Cramo form a joint venture for their Russian and Ukrainian businesses

Interim Report January-September 2012 l 2 November 2012
WELCOME TO RAMIRENT’S CAPITAL MARKET DAY! 27 NOVEMBER 2012 IN VANTAA, FINLAND

For more information: www.ramirent.com Magnus Rosén, CEO +358 20 750 2845 [email protected] Jonas Söderkvist, CFO +358 20 750 3248 [email protected] Franciska Janzon, IR +358 20 750 2859 [email protected]

COMPANY OVERVIEW 2 November 2012
46 Interim Report January-September 2012 l 2 November 2012

Interim Report January-September 2012 l 2 November 2012
Ramirent in brief
47
Leading equipment rental company in Northern, Central and Eastern Europe with net sales of EUR 650 million (2011)
375 rental customer centers located in 13 countries and providing 200 000 rental items
Listed on NASDAQ OMX Helsinki since 1998
3 027 employees serving 100 000 customers
Founded in 1955 and headquartered in Finland
Interim Report January-September 2012 l 2 November 2012
More than 50 years of experience as a supplier to the construction industry
48
Steel Nail shop Rakennusmies founded
The rental business is established
Acquired by Partek and renamed A-rakennusmies
First move outside Finland through JV in Moscow, Russia
Estonia became the third operating country with expansion to Tallinn
MBO by key personnel and capital investors
Enter Latvia
Enter Lithuania
Listed on the Helsinki Stock Exchange
Enter Poland
Renamed Ramirent Plc
Greenfield entry to Hungary
Enter Ukraine
Greenfield entry to Czech Republic
Enter Slovakia
1983 1955 1988 1994 1995 1996 1997 1998 2000 2001 2002 2003 2004 2005 2008 2006
Acquires Bautas in Norway
Acquires Altima in Sweden
Interim Report January-September 2012 l 2 November 2012
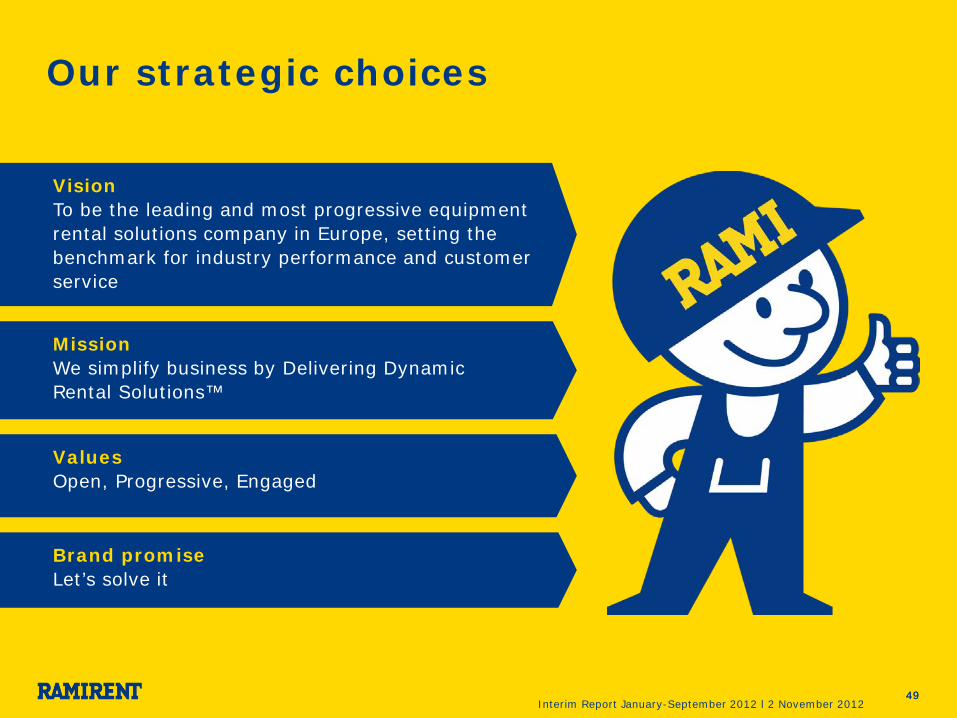
Mission We simplify business by Delivering Dynamic Rental Solutions™
Vision To be the leading and most progressive equipment rental solutions company in Europe, setting the benchmark for industry performance and customer service
49
Our strategic choices
49
Values Open, Progressive, Engaged
Brand promise Let’s solve it
Interim Report January-September 2012 l 2 November 2012
One of the leading equipment rental companies both in Europe (#3) and globally (#13)
0 200 400 600 800 1000
Loxam
Cramo
Ramirent
AlgecoScotsman
Speedy Hire
Sarens
Kiloutou
HKLBaumaschinen
Mediaco Levage
Zeppelin Rental
Source: IRN June 2012
50
Turnover 2011 (MEUR) Turnover 2011 (MEUR)
Largest rental companies in Europe Largest rental companies globally
0 500 1000 1500 2000 2500
Ramirent
Cramo
Nishio Rent All Co
Nikken Corp
Loxam
Hertz Equipment Rental
Aktio Corp
Algeco Scotsman
Coates Hire Ltd
Ashtead Group
RSC Equipment Rental
Aggreko
United Rentals
Interim Report January-September 2012 l 2 November 2012
Leading market position in five of our six geographical segments
51
Finland 77 customer
centres (25 franchises)
Market #1
Europe East 62 customer
centres 10 re-renting
agents Market #1
Norway 43 customer
centres (4 franchises)
Market #1
Denmark 21 customer
centres Market #1
Europe Central 88 customer
centres (24 franchises)
Market #1
Sweden 84 customer
centres (10 franchises)
Market #2
Total 3,027
Finland 577
Sweden 680
Norway 465
Denmark 181
Europe East 441
Europe Central
657
Employees Q3/12
Interim Report January-September 2012 l 2 November 2012
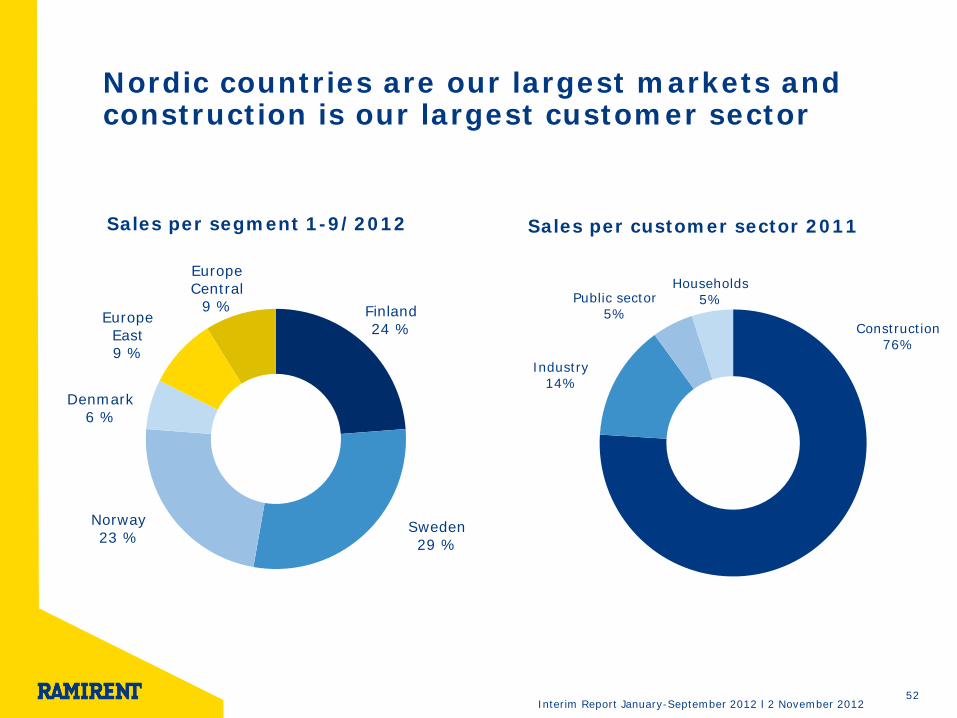
Nordic countries are our largest markets and construction is our largest customer sector
52
Finland 24 %
Sweden 29 %
Norway 23 %
Denmark 6 %
Europe East 9 %
Europe Central
9 %
Sales per segment 1-9/2012
Construction 76%
Industry 14%
Public sector 5%
Households 5%
Sales per customer sector 2011
Interim Report January-September 2012 l 2 November 2012
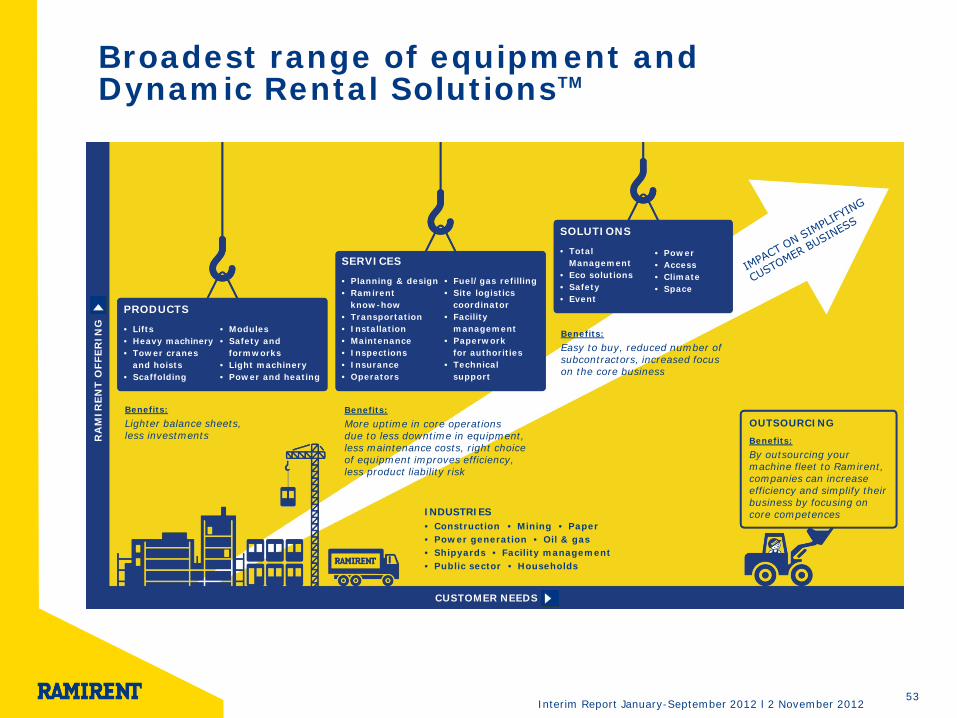
Broadest range of equipment and Dynamic Rental SolutionsTM
53
RA
MIR
ENT
OFF
ERIN
G
CUSTOMER NEEDS
PRODUCTS
• Lifts • Heavy machinery • Tower cranes and hoists • Scaffolding
• Modules • Safety and formworks • Light machinery • Power and heating
SERVICES
• Planning & design • Ramirent know-how • Transportation • Installation • Maintenance • Inspections • Insurance • Operators
• Fuel/gas refilling • Site logistics coordinator • Facility management • Paperwork for authorities • Technical support
SOLUTIONS
• Total Management • Eco solutions • Safety • Event
• Power • Access • Climate • Space
Benefits: Lighter balance sheets, less investments
Benefits: More uptime in core operations due to less downtime in equipment, less maintenance costs, right choice of equipment improves efficiency, less product liability risk
Benefits: Easy to buy, reduced number of subcontractors, increased focus on the core business
OUTSOURCING Benefits: By outsourcing your machine fleet to Ramirent, companies can increase efficiency and simplify their business by focusing on core competences INDUSTRIES
• Construction • Mining • Paper • Power generation • Oil & gas • Shipyards • Facility management • Public sector • Households
Interim Report January-September 2012 l 2 November 2012
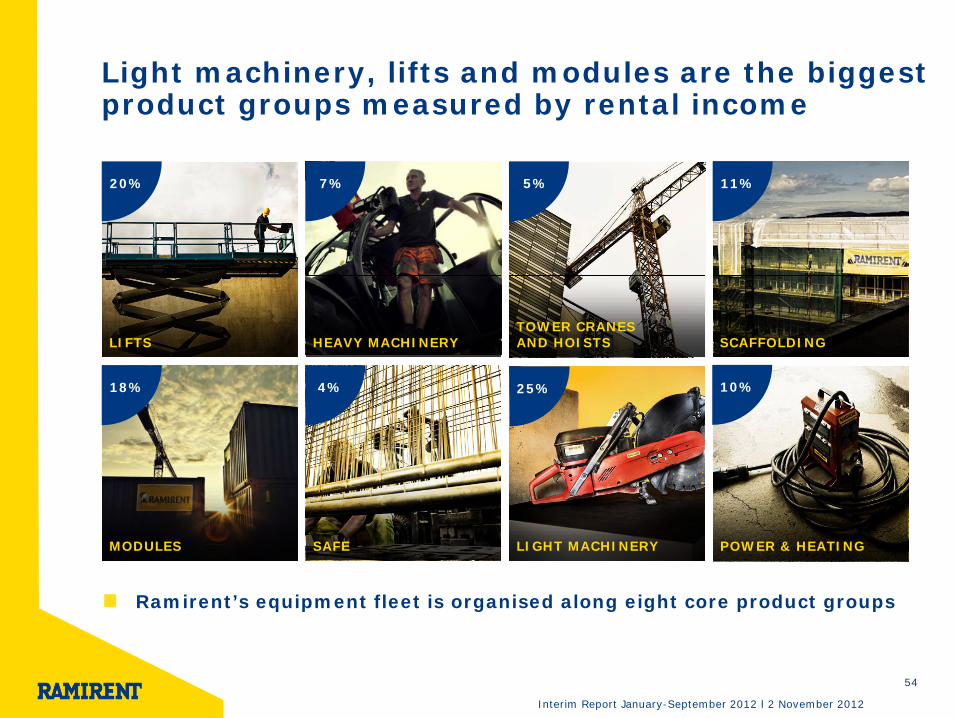
Light machinery, lifts and modules are the biggest product groups measured by rental income
54
MODULES
HEAVY MACHINERY
LIGHT MACHINERY
LIFTS TOWER CRANES AND HOISTS SCAFFOLDING
POWER & HEATING SAFE
20% 7% 5% 11%
18% 4% 25% 10%
Ramirent’s equipment fleet is organised along eight core product groups
Interim Report January-September 2012 l 2 November 2012
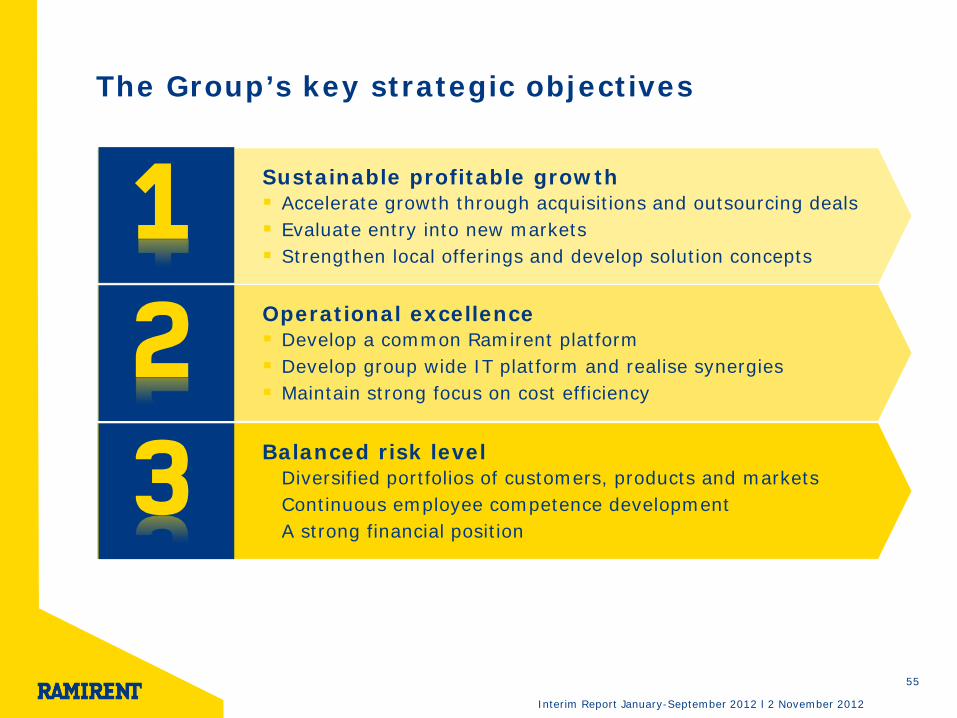
The Group’s key strategic objectives
55
Sustainable profitable growth Accelerate growth through acquisitions and outsourcing deals Evaluate entry into new markets Strengthen local offerings and develop solution concepts
Operational excellence Develop a common Ramirent platform Develop group wide IT platform and realise synergies Maintain strong focus on cost efficiency
Balanced risk level Diversified portfolios of customers, products and markets Continuous employee competence development A strong financial position
Interim Report January-September 2012 l 2 November 2012
RamirentLoxamCramoAlgeco ScotsmanSpeedy HireLiebherr-MietpartnerGAMMediaco LiftingSarensKiloutouHKL BaumschinenOthers
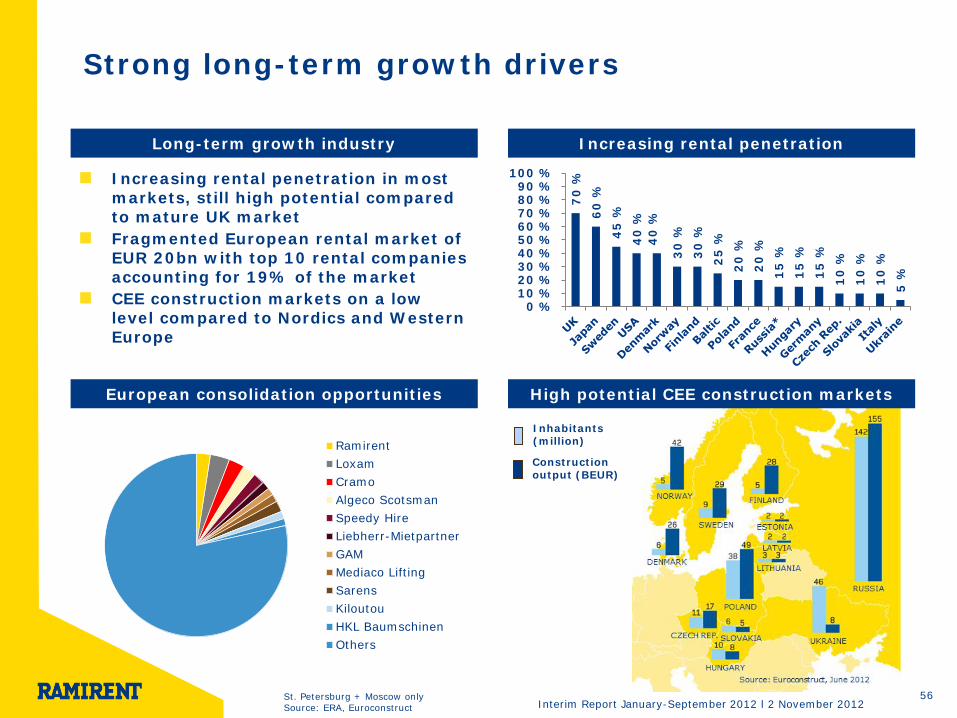
Strong long-term growth drivers
Long-term growth industry
European consolidation opportunities
56
Increasing rental penetration in most markets, still high potential compared to mature UK market Fragmented European rental market of EUR 20bn with top 10 rental companies accounting for 19% of the market CEE construction markets on a low level compared to Nordics and Western Europe
Inhabitants (million)
Construction output (BEUR)
Increasing rental penetration
High potential CEE construction markets
70
%
60
%
45
%
40
%
40
%
30
%
30
%
25
%
20
%
20
%
15
%
15
%
15
%
10
%
10
%
10
%
5 %
0 %10 %20 %30 %40 %50 %60 %70 %80 %90 %
100 %
St. Petersburg + Moscow only Source: ERA, Euroconstruct
Interim Report January-September 2012 l 2 November 2012 57
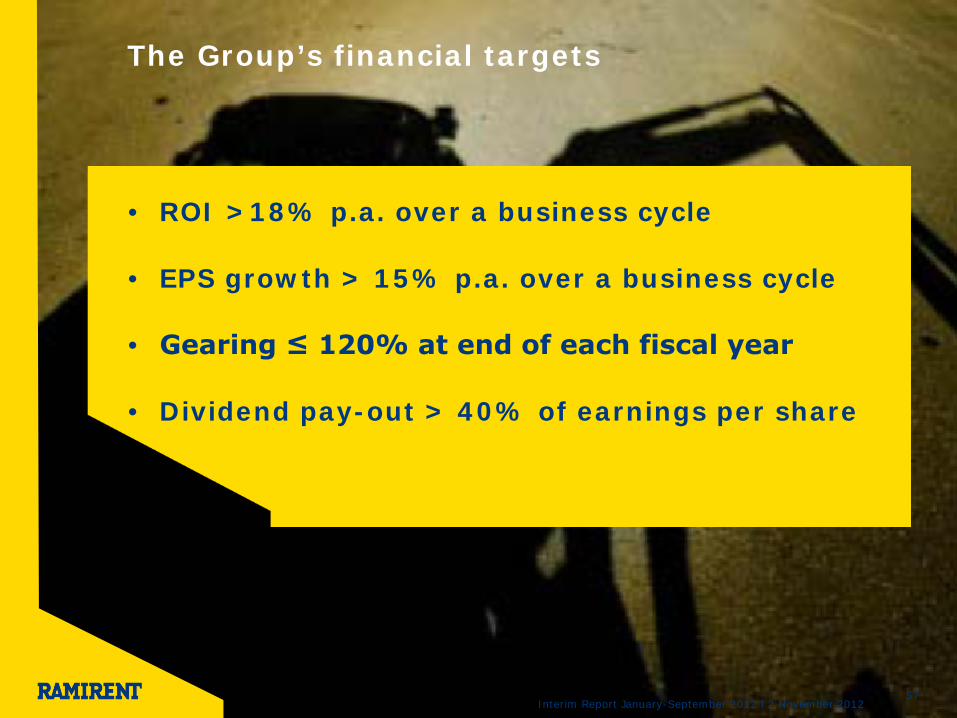
The Group’s financial targets
• ROI >18% p.a. over a business cycle
• EPS growth > 15% p.a. over a business cycle
• Gearing ≤ 120% at end of each fiscal year
• Dividend pay-out > 40% of earnings per share
Interim Report January-September 2012 l 2 November 2012
Largest shareholders
Largets shareholders on 30 September 2012
Number of shares
% of share
capital
1 Nordstjernan AB 31 882 078 29.33
2 Oy Julius Tallberg Ab 11 962 229 11.01
3 Varma Mutual Pension Insurance Company 7 368 799 6.78
4 Ilmarinen Mutual Pension Insurance Company 4 977 059 4.58
5 Odin Funds 4 651 693 4.22
6 Tapiola Mutual Pension Insurance Company 2 407 668 2.22
7 Veritas Pension Insurance Company Ltd 1 410 063 1.30
8 Investment Fund Aktia Capital 1 247 540 1.15
9 Investment Fund Nordea Fennia 1 100 000 1.01
10 Föreningen Konstsamfundet rf 825 000 0.76
Ramirent Plc’s treasury shares 1 030 192 0.95
Nominee registered shares 18 737 457 17.24
Other shareholders 21 097 550 19.45
Total number of shares 108 697 328 100.00
58
34%
17% 40%
9%
Foreign owners
Nominee registered
Finnish companies and organisations Finnish households
Market Cap EUR 672.9 million (exclud. treasury shares)
Trading information Listing: NASDAX OMX Helsinki Date of listing: April 30, 1998
Segment: Mid Cap Sector: Industrials
Trading code: RMR1V
APPENDIX
59
Interim Report January-September 2012 l 2 November 2012
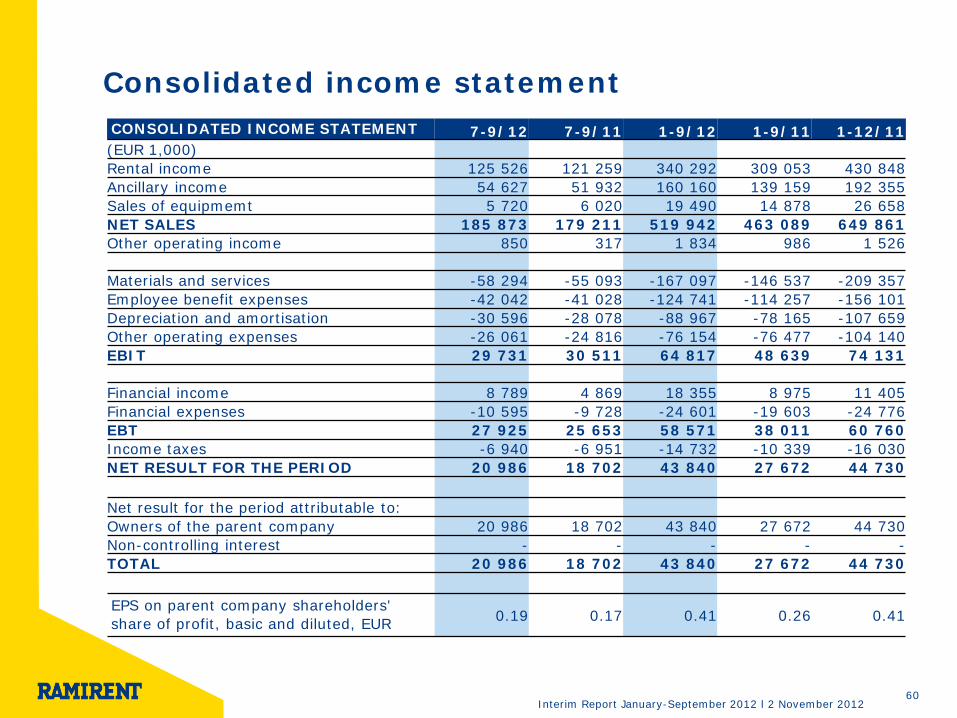
Consolidated income statement
60
CONSOLIDATED INCOME STATEMENT 7-9/12 7-9/11 1-9/12 1-9/11 1-12/11 (EUR 1,000) Rental income 125 526 121 259 340 292 309 053 430 848 Ancillary income 54 627 51 932 160 160 139 159 192 355 Sales of equipmemt 5 720 6 020 19 490 14 878 26 658 NET SALES 185 873 179 211 519 942 463 089 649 861 Other operating income 850 317 1 834 986 1 526 Materials and services -58 294 -55 093 -167 097 -146 537 -209 357 Employee benefit expenses -42 042 -41 028 -124 741 -114 257 -156 101 Depreciation and amortisation -30 596 -28 078 -88 967 -78 165 -107 659 Other operating expenses -26 061 -24 816 -76 154 -76 477 -104 140 EBIT 29 731 30 511 64 817 48 639 74 131 Financial income 8 789 4 869 18 355 8 975 11 405 Financial expenses -10 595 -9 728 -24 601 -19 603 -24 776 EBT 27 925 25 653 58 571 38 011 60 760 Income taxes -6 940 -6 951 -14 732 -10 339 -16 030 NET RESULT FOR THE PERIOD 20 986 18 702 43 840 27 672 44 730
Net result for the period attributable to: Owners of the parent company 20 986 18 702 43 840 27 672 44 730 Non-controlling interest - - - - - TOTAL 20 986 18 702 43 840 27 672 44 730
EPS on parent company shareholders' share of profit, basic and diluted, EUR 0.19 0.17 0.41 0.26 0.41
Interim Report January-September 2012 l 2 November 2012
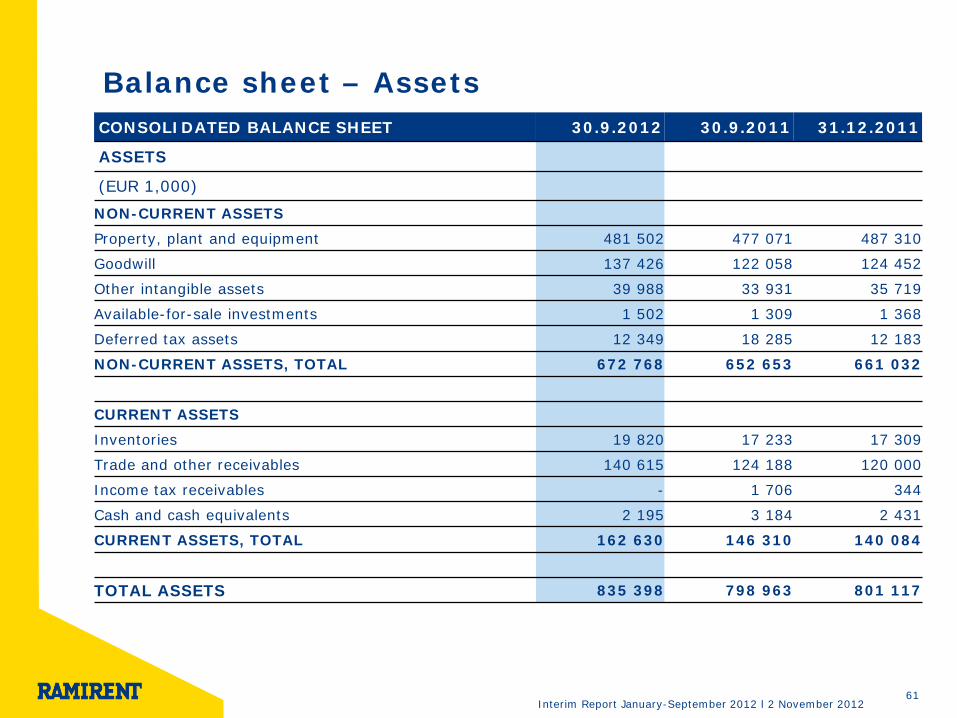
Balance sheet – Assets
61
CONSOLIDATED BALANCE SHEET 30.9.2012 30.9.2011 31.12.2011
ASSETS
(EUR 1,000) NON-CURRENT ASSETS
Property, plant and equipment 481 502 477 071 487 310
Goodwill 137 426 122 058 124 452
Other intangible assets 39 988 33 931 35 719
Available-for-sale investments 1 502 1 309 1 368
Deferred tax assets 12 349 18 285 12 183
NON-CURRENT ASSETS, TOTAL 672 768 652 653 661 032
CURRENT ASSETS
Inventories 19 820 17 233 17 309
Trade and other receivables 140 615 124 188 120 000
Income tax receivables - 1 706 344
Cash and cash equivalents 2 195 3 184 2 431
CURRENT ASSETS, TOTAL 162 630 146 310 140 084
TOTAL ASSETS 835 398 798 963 801 117

Balance sheet – Equity and liabilities
62
EQUITY AND LIABILITIES 30.9.2012 30.9.2011 31.12.2011 (EUR 1,000) EQUITY Share capital 25 000 25 000 25 000 Revaluation fund -5 272 -3 877 -4 192 Invested unrestricted equity fund 113 329 113 329 113 329 Retained earnings 216 726 170 807 191 862 PARENT COMPANY SHAREHOLDERS’ EQUITY 349 783 305 259 326 000 Non-controlling interests - - - EQUITY, TOTAL 349 783 305 259 326 000 NON-CURRENT LIABILITIES Deferred tax liabilities 80 337 71 436 73 690 Pension obligations 6 950 8 546 7 226 Provisions 1 530 1 783 1 553 Interest-bearing liabilities 175 729 211 597 219 773 Other long-term liabilities 9 117 14 181 11 748 NON-CURRENT LIABILITIES, TOTAL 273 662 307 544 313 990 CURRENT LIABILITIES Trade payables and other liabilities 121 612 106 795 109 020 Provisions 1 202 808 1 163 Income tax liabilities 6 687 7 136 5 496 Interest-bearing liabilities 82 451 71 422 45 448 CURRENT LIABILITIES, TOTAL 211 952 186 161 161 127 LIABILITIES, TOTAL 485 615 493 704 475 117 TOTAL EQUITY AND LIABILITIES 835 398 798 963 801 117
Interim Report January-June 2012 l 9 August 2012
Interim Report January-September 2012 l 2 November 2012
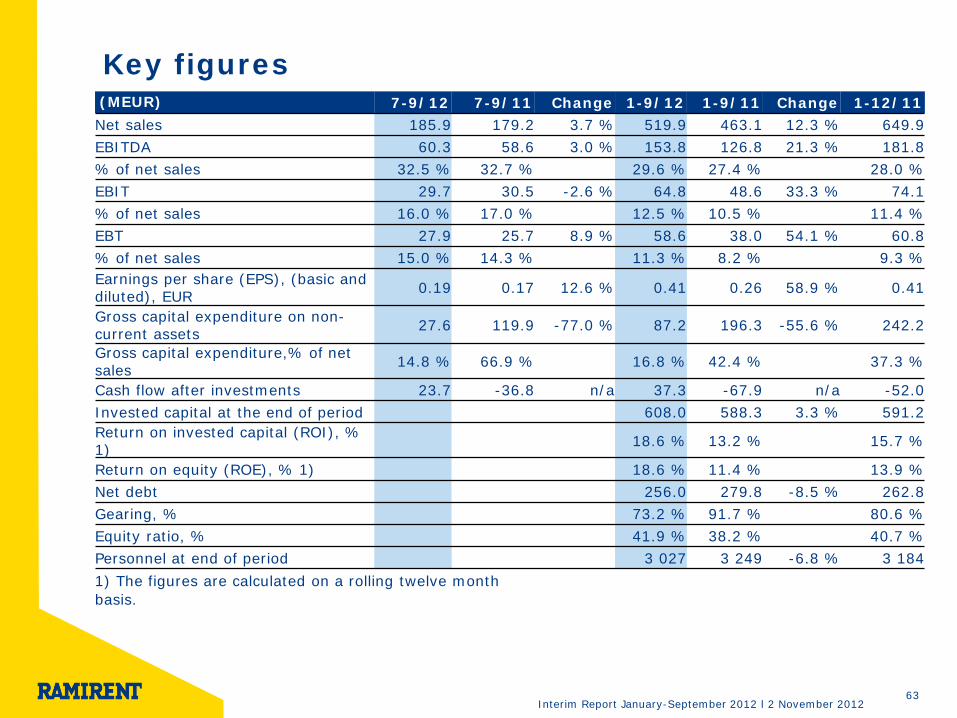
Key figures
63
(MEUR) 7-9/12 7-9/11 Change 1-9/12 1-9/11 Change 1-12/11 Net sales 185.9 179.2 3.7 % 519.9 463.1 12.3 % 649.9 EBITDA 60.3 58.6 3.0 % 153.8 126.8 21.3 % 181.8 % of net sales 32.5 % 32.7 % 29.6 % 27.4 % 28.0 % EBIT 29.7 30.5 -2.6 % 64.8 48.6 33.3 % 74.1 % of net sales 16.0 % 17.0 % 12.5 % 10.5 % 11.4 % EBT 27.9 25.7 8.9 % 58.6 38.0 54.1 % 60.8 % of net sales 15.0 % 14.3 % 11.3 % 8.2 % 9.3 % Earnings per share (EPS), (basic and diluted), EUR 0.19 0.17 12.6 % 0.41 0.26 58.9 % 0.41
Gross capital expenditure on non-current assets 27.6 119.9 -77.0 % 87.2 196.3 -55.6 % 242.2
Gross capital expenditure,% of net sales 14.8 % 66.9 % 16.8 % 42.4 % 37.3 %
Cash flow after investments 23.7 -36.8 n/a 37.3 -67.9 n/a -52.0 Invested capital at the end of period 608.0 588.3 3.3 % 591.2 Return on invested capital (ROI), % 1) 18.6 % 13.2 % 15.7 %
Return on equity (ROE), % 1) 18.6 % 11.4 % 13.9 % Net debt 256.0 279.8 -8.5 % 262.8 Gearing, % 73.2 % 91.7 % 80.6 % Equity ratio, % 41.9 % 38.2 % 40.7 % Personnel at end of period 3 027 3 249 -6.8 % 3 184 1) The figures are calculated on a rolling twelve month basis.
Interim Report January-September 2012 l 2 November 2012
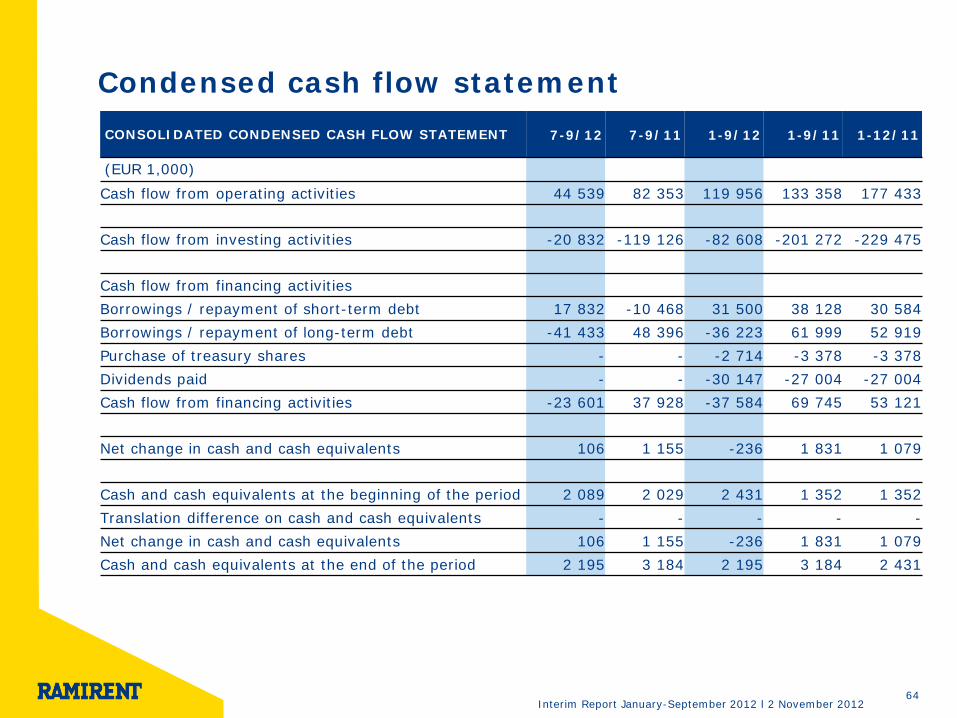
Condensed cash flow statement
64
CONSOLIDATED CONDENSED CASH FLOW STATEMENT 7-9/12 7-9/11 1-9/12 1-9/11 1-12/11
(EUR 1,000) Cash flow from operating activities 44 539 82 353 119 956 133 358 177 433 Cash flow from investing activities -20 832 -119 126 -82 608 -201 272 -229 475 Cash flow from financing activities Borrowings / repayment of short-term debt 17 832 -10 468 31 500 38 128 30 584 Borrowings / repayment of long-term debt -41 433 48 396 -36 223 61 999 52 919 Purchase of treasury shares - - -2 714 -3 378 -3 378 Dividends paid - - -30 147 -27 004 -27 004 Cash flow from financing activities -23 601 37 928 -37 584 69 745 53 121 Net change in cash and cash equivalents 106 1 155 -236 1 831 1 079 Cash and cash equivalents at the beginning of the period 2 089 2 029 2 431 1 352 1 352 Translation difference on cash and cash equivalents - - - - - Net change in cash and cash equivalents 106 1 155 -236 1 831 1 079 Cash and cash equivalents at the end of the period 2 195 3 184 2 195 3 184 2 431
Interim Report January-September 2012 l 2 November 2012
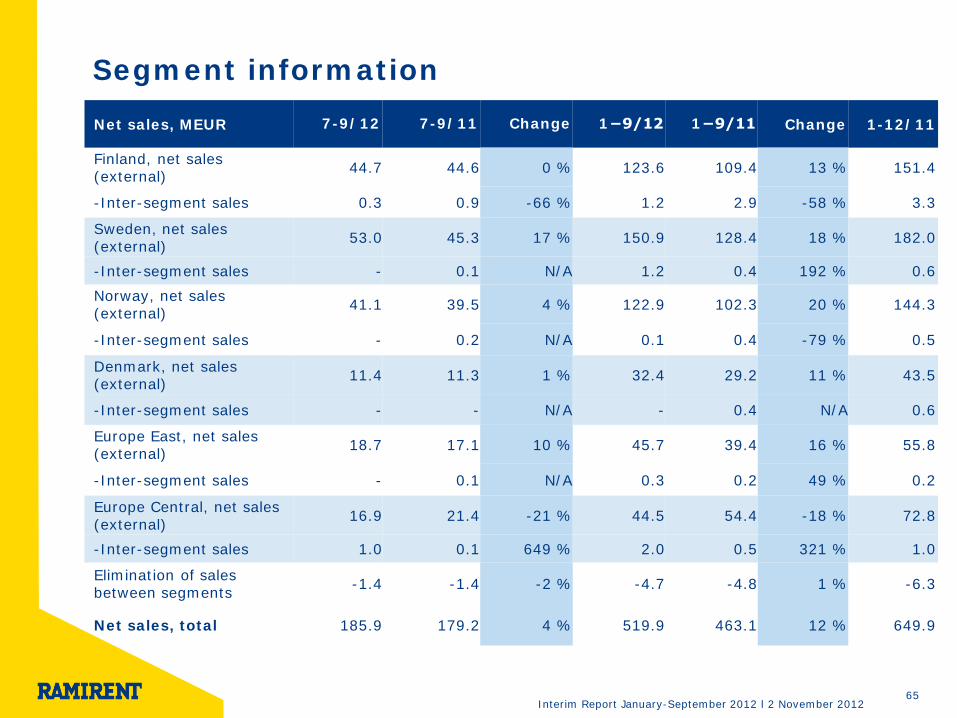
Segment information Net sales, MEUR 7-9/12 7-9/11 Change 1−9/12 1−9/11 Change 1-12/11
Finland, net sales (external) 44.7 44.6 0 % 123.6 109.4 13 % 151.4
-Inter-segment sales 0.3 0.9 -66 % 1.2 2.9 -58 % 3.3
Sweden, net sales (external) 53.0 45.3 17 % 150.9 128.4 18 % 182.0
-Inter-segment sales - 0.1 N/A 1.2 0.4 192 % 0.6 Norway, net sales (external) 41.1 39.5 4 % 122.9 102.3 20 % 144.3
-Inter-segment sales - 0.2 N/A 0.1 0.4 -79 % 0.5
Denmark, net sales (external) 11.4 11.3 1 % 32.4 29.2 11 % 43.5
-Inter-segment sales - - N/A - 0.4 N/A 0.6
Europe East, net sales (external) 18.7 17.1 10 % 45.7 39.4 16 % 55.8
-Inter-segment sales - 0.1 N/A 0.3 0.2 49 % 0.2
Europe Central, net sales (external) 16.9 21.4 -21 % 44.5 54.4 -18 % 72.8
-Inter-segment sales 1.0 0.1 649 % 2.0 0.5 321 % 1.0
Elimination of sales between segments -1.4 -1.4 -2 % -4.7 -4.8 1 % -6.3
Net sales, total 185.9 179.2 4 % 519.9 463.1 12 % 649.9
65
Interim Report January-September 2012 l 2 November 2012
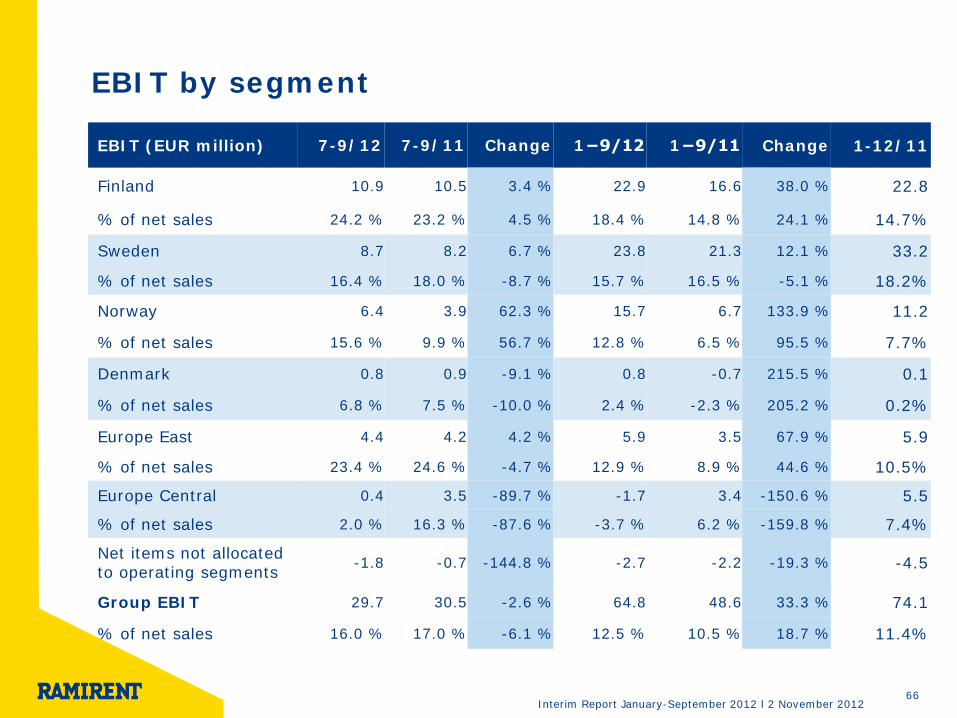
EBIT by segment EBIT (EUR million) 7-9/12 7-9/11 Change 1−9/12 1−9/11 Change 1-12/11
Finland 10.9 10.5 3.4 % 22.9 16.6 38.0 % 22.8
% of net sales 24.2 % 23.2 % 4.5 % 18.4 % 14.8 % 24.1 % 14.7%
Sweden 8.7 8.2 6.7 % 23.8 21.3 12.1 % 33.2
% of net sales 16.4 % 18.0 % -8.7 % 15.7 % 16.5 % -5.1 % 18.2%
Norway 6.4 3.9 62.3 % 15.7 6.7 133.9 % 11.2
% of net sales 15.6 % 9.9 % 56.7 % 12.8 % 6.5 % 95.5 % 7.7%
Denmark 0.8 0.9 -9.1 % 0.8 -0.7 215.5 % 0.1
% of net sales 6.8 % 7.5 % -10.0 % 2.4 % -2.3 % 205.2 % 0.2%
Europe East 4.4 4.2 4.2 % 5.9 3.5 67.9 % 5.9
% of net sales 23.4 % 24.6 % -4.7 % 12.9 % 8.9 % 44.6 % 10.5%
Europe Central 0.4 3.5 -89.7 % -1.7 3.4 -150.6 % 5.5
% of net sales 2.0 % 16.3 % -87.6 % -3.7 % 6.2 % -159.8 % 7.4%
Net items not allocated to operating segments -1.8 -0.7 -144.8 % -2.7 -2.2 -19.3 % -4.5
Group EBIT 29.7 30.5 -2.6 % 64.8 48.6 33.3 % 74.1
% of net sales 16.0 % 17.0 % -6.1 % 12.5 % 10.5 % 18.7 % 11.4%
66

For more information: www.ramirent.com