rr results q1_2016_en_final2
TRANSCRIPT

4 MAY 2016
MAGNUS ROSÉN, PRESIDENT AND CEO PIERRE BRORSSON, CFO
Improvement in sales and profitability
Interim report Q1/2016

• Group performance
• Segment review
• Market outlook
• Key figures
• Financial position
• Appendices
Agenda
2 4/5/2016 Interim report Q1/2016

3
• Net sales 146.0 (140.6) MEUR up by 3.9% or by 5.5% at comparable exchange rates
• EBITA 7.2 (4.1) MEUR up by 75.5%
• EBITA margin 5.0% (2.9%)
• ROCE 10.7% (10.3%)
• ROE 14.6% (9.7%)
• Gross capex 40.4 (18.1) MEUR
• Net debt 287.9 (226.2) MEUR
• Net debt to EBITDA 1.7x (1.4x)
Highlights Q1 2016 – Improvement in sales and profitability
4/5/2016 Interim report Q1/2016

4/5/2016 Interim report Q1/2016 4
• Ramirent signed a cooperation agreement with NCC Roads in Finland
• To serve the customer Ramirent invested in new fleet especially needed in the asphalt business
• The agreement strengthens Ramirent’s position within Finland’s infrastructure construction sector
• Ramirent signed its first frame agreement with JM AB in Sweden
• Three-year agreement for equipment rental and related services includes option for prolongation
• The agreement covers most of Ramirent’s product groups
Important new customer agreements with NCC Roads in Finland and JM in Sweden
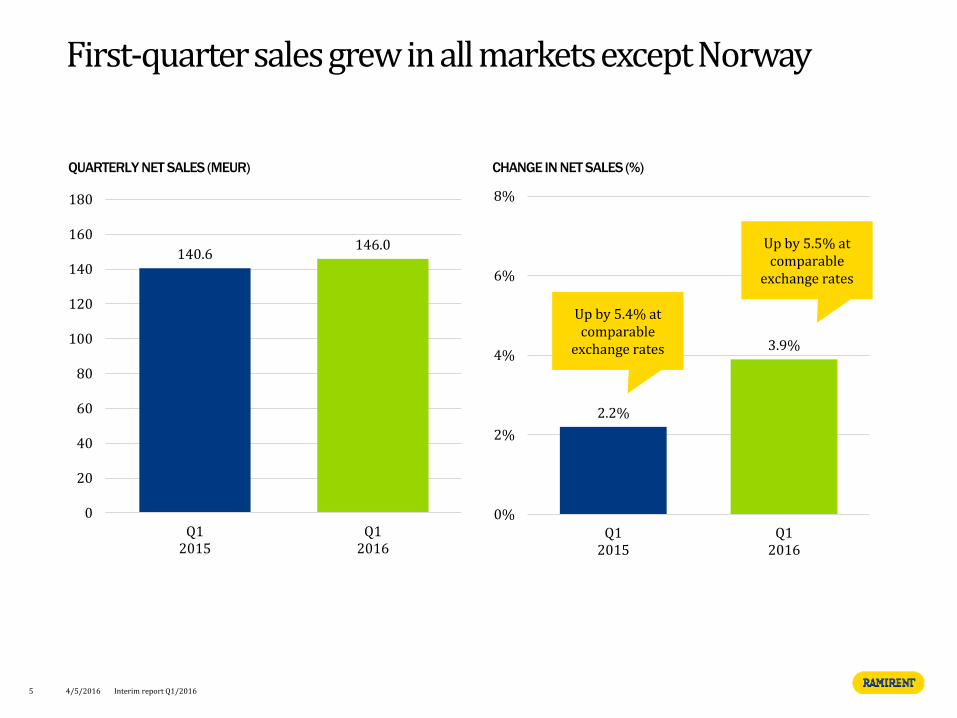
First-quarter sales grew in all markets except Norway
QUARTERLY NET SALES (MEUR) CHANGE IN NET SALES (%)
5 4/5/2016 Interim report Q1/2016
140.6 146.0
0
20
40
60
80
100
120
140
160
180
Q12015
Q12016
2.2%
3.9%
0%
2%
4%
6%
8%
Q12015
Q12016
Up by 5.5% at comparable
exchange rates
Up by 5.4% at comparable
exchange rates

First-quarter EBITA improved based on higher sales and good control of material and services costs
QUARTERLY EBITA (MEUR) QUARTERLY EBITA MARGIN
6 4/5/2016 Interim report Q1/2016
2.9%
5.0%
0%
2%
4%
6%
8%
10%
12%
Q12015
Q12016
4.1
7.2
0
2
4
6
8
10
12
14
Q12015
Q12016

• Sales growth was driven by higher service sales and deliveries to ongoing Total Solutions projects
• Projects mainly in the Nordic countries and in Poland
7
• Sales growth driven mainly by improving market conditions in the Nordic construction and industrial sector
• Demand was weaker in Europe Central and the Baltics due to slow start to the year in construction of new buildings
• Favourable demand in all Nordic countries except Norway, where demand was sluggish mainly due to a weak business climate in the oil & gas sector
• In Sweden demand was strong especially in the public sector
Q1 2016 overview by business area
4/5/2016 Interim report Q1/2016
Share of Group sales
63% 32% 5%

All long-term financial targets were met in Q1 2016
8 4/5/2016 Interim report Q1/2016
*Rolling 12 months net sales growth at comparable exchange rates which was above FY2016 growth target of 4.4% (2.0%-points + 2.4% estimated GDP growth for 2016)
Source: Average of GDP estimates from Nordea, SEB and OP (Weighted by size of the economy)

4/5/2016 Interim report Q1/2016 9
Segment review

HIGHLIGHTS Q1 16
Finland: Strong execution in the first quarter
NET SALES
KEY FIGURES PROFITABILITY
• Sales grew in all Business Areas based on strong execution from our Finnish team supported by improved underlying demand in the market
• In Solutions, especially large construction projects and activity in the industry sector supported growth in the first quarter
• EBITA improvement was mainly driven by higher sales 0
10
20
30
40
50
Q12013
Q2 Q3 Q4 Q12014
Q2 Q3 Q4 Q12015
Q2 Q3 Q4 Q12016
Finland 1–3/16 1–3/15 Change 1–12/15
Net sales 38.1 32.0 19.0% 160.2
EBITA 2.9 0.8 262.6% 21.11)
% of net sales 7.7% 2.5% 13.2%1)
Capital employed 120.6 113.0 6.7% 120.6
ROCE (%)2) 18.8% 14.7% 17.5%
Personnel (FTE) 471 487 -3.3% 455
Customer centres
53 62 -14.5% 56
Net sales up by 19.0%
10
0%
5%
10%
15%
20%
25%
30%
Q12013
Q2 Q3 Q4 Q12014
Q2 Q3 Q4 Q12015
Q2 Q3 Q4 Q12016
EBITA-margin (%) ROCE (%) R12
1) Comparable EBITA was EUR 20.3 million or 12.7% of net sales in January–December 2015. The items affecting comparability included derecognition of a contingent liability and the amount, EUR 0.8 million was recognised in other operating income. 2) Rolling 12 months
4/5/2016 Interim report Q1/2016

HIGHLIGHTS Q1 16
Sweden: Sales grew, EBITA impacted by project write-downs
NET SALES
KEY FIGURES PROFITABILITY
• In General Rental, high sales growth achieved especially among building construction customers and in Solutions, strong service sales and deliveries to Total Solutions projects contributed to growth
• In Temporary Space strong demand continued in the public sector
• Write-downs in solutions projects of 1.1 MEUR hampered the first quarter EBITA
0%
5%
10%
15%
20%
25%
Q12013
Q2 Q3 Q4 Q12014
Q2 Q3 Q4 Q12015
Q2 Q3 Q4 Q12016
EBITA-margin (%) ROCE (%) R12
0
10
20
30
40
50
60
70
Q12013
Q2 Q3 Q4 Q12014
Q2 Q3 Q4 Q12015
Q2 Q3 Q4 Q12016
11
1) Comparable EBITA was EUR 29.4 million or 13.1% in January–December 2015. The items affecting comparability included derecognition of a contingent consideration liability. The amount, EUR 3.8 million, was recognised in other operating income in the second quarter of 2015. A restructuring provision of EUR 0.3 million was recognised in the fourth quarter of 2015. 2) Rolling 12 months 4/5/2016 Interim report Q1/2016
Sweden 1–3/16 1–3/15 Change 1–12/15
Net sales 53.7 51.0 5.3% 225.4
EBITA 4.4 5.1 -13.8% 33.01)
% of net sales 8.2% 10.0% 14.6%1)
Capital employed 199.4 157.4 26.6% 199.0
ROCE (%)2) 15.5% 16.9% 16.1%
Personnel (FTE) 751 760 -1.2% 779
Customer centres
78 80 -2.5% 78
Net sales up by 5.3% or by 4.6% at
comparable exchange rates

HIGHLIGHTS Q1 16 NET SALES
KEY FIGURES PROFITABILITY
• In General Rental and Solutions sales grew slightly in the first quarter
• Improved organisational structures supported performance in General Rental and Solutions
• Temporary space with exposure to oil & gas sector remains a challenge
0%
5%
10%
15%
20%
25%
Q12013
Q2 Q3 Q4 Q12014
Q2 Q3 Q4 Q12015
Q2 Q3 Q4 Q12016
EBITA-margin (%) ROCE (%) R12
05
1015202530354045
Q12013
Q2 Q3 Q4 Q12014
Q2 Q3 Q4 Q12015
Q2 Q3 Q4 Q12016
Net sales down by 10.2% or by 2.0% at
comparable exchange rates
12
1) Comparable EBITA was EUR 7.0 million or 5.8% of net sales in January–December 2015. The items affecting comparability included EUR 0.5 million of restructuring costs recognised in the fourth quarter of 2015. 2) Rolling 12 months
4/5/2016 Interim report Q1/2016
Norway: Improved profitability despite challenges in Temporary space
Norway 1–3/16 1–3/15 Change 1–12/15
Net sales 27.8 31.0 -10.2% 120.7
EBITA 1.3 1.0 33.0% 6.51)
% of net sales 4.8% 3.3% 5.4%1)
Capital employed 125.3 126.1 -0.6% 120.9
ROCE (%)2) 4.0% 7.8% 3.8%
Personnel (FTE) 406 405 0.3% 401
Customer centres
41 43 -4.7% 42

HIGHLIGHTS Q1 16
Denmark: Improved demand and lower cost base improved EBITA
NET SALES
KEY FIGURES PROFITABILITY
• Strong performance by the Danish organisation drove sales growth; In General Rental, volumes grew based on high activity especially in the construction sector and in Solutions, strong service sales contributed to growth
• Sales growth was also supported by higher sales of used equipment in the quarter
• EBITA improvement was driven by strong sales growth and successfully implemented cost reduction measures in 2015 that have resulted in a lower fixed cost base
-25%
-20%
-15%
-10%
-5%
0%
5%
10%
Q12013
Q2 Q3 Q4 Q12014
Q2 Q3 Q4 Q12015
Q2 Q3 Q4 Q12016
EBITA-margin (%) ROCE (%) R12
0
2
4
6
8
10
12
14
Q12013
Q2 Q3 Q4 Q12014
Q2 Q3 Q4 Q12015
Q2 Q3 Q4 Q12016
Net sales increased by 10.7% or by
10.9% at comparable exchange rates
13
1) Comparable EBITA was EUR 0.8 million or 1.8% of net sales in January–December 2015. The items affecting comparability included a EUR 0.5 million of restructuring provision recognised in the third quarter of 2015 2) Rolling 12 months
4/5/2016 Interim report Q1/2016
Denmark 1–3/16 1–3/15 Change 1–12/15
Net sales 10.4 9.4 10.7% 42.3
EBITA 0.4 -1.4 130.3% 0.31)
% of net sales 4.0% -14.8% 0.7%1)
Capital employed 30.5 25.0 22.4% 26.0
ROCE (%)2) 6.1% -16.7% -0.5%
Personnel (FTE) 139 142 -2.3% 139
Customer centres
13 15 -13.3% 13
HIGHLIGHTS Q1 16
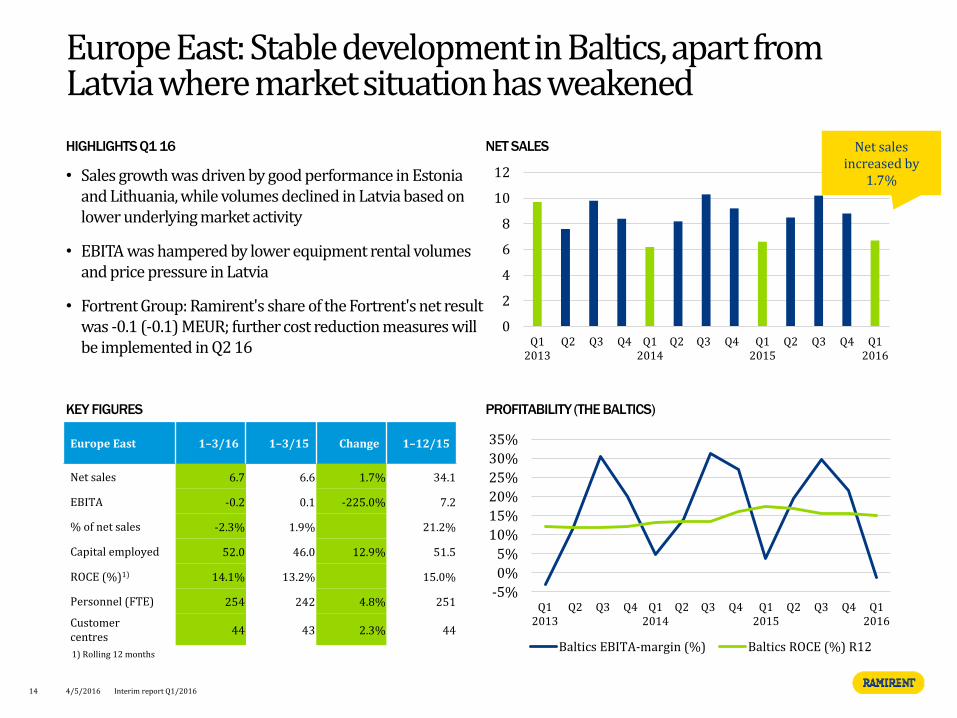
Europe East: Stable development in Baltics, apart from Latvia where market situation has weakened
NET SALES
KEY FIGURES PROFITABILITY (THE BALTICS)
• Sales growth was driven by good performance in Estonia and Lithuania, while volumes declined in Latvia based on lower underlying market activity
• EBITA was hampered by lower equipment rental volumes and price pressure in Latvia
• Fortrent Group: Ramirent's share of the Fortrent's net result was -0.1 (-0.1) MEUR; further cost reduction measures will be implemented in Q2 16
0
2
4
6
8
10
12
Q12013
Q2 Q3 Q4 Q12014
Q2 Q3 Q4 Q12015
Q2 Q3 Q4 Q12016
Net sales increased by
1.7%
-5%
0%
5%
10%
15%
20%
25%
30%
35%
Q12013
Q2 Q3 Q4 Q12014
Q2 Q3 Q4 Q12015
Q2 Q3 Q4 Q12016
Baltics EBITA-margin (%) Baltics ROCE (%) R12
14 4/5/2016 Interim report Q1/2016
Europe East 1–3/16 1–3/15 Change 1–12/15
Net sales 6.7 6.6 1.7% 34.1
EBITA -0.2 0.1 -225.0% 7.2
% of net sales -2.3% 1.9% 21.2%
Capital employed 52.0 46.0 12.9% 51.5
ROCE (%)1) 14.1% 13.2% 15.0%
Personnel (FTE) 254 242 4.8% 251
Customer centres
44 43 2.3% 44
1) Rolling 12 months

HIGHLIGHTS Q1 16
Europe Central: Demand supported by industry projects, slower start to the year in construction activity
NET SALES
KEY FIGURES PROFITABILITY
• Sales growth was supported by good progress in large power plant projects in Poland, whereas activity in the construction sector was slower than expected
• Performance remained good in Slovakia, but was weaker in the Czech Republic due to postponements of construction projects
• EBITA was negatively impacted by a higher share of service sales in the business mix and tough competition in the Polish market
-25%-20%-15%-10%
-5%0%5%
10%15%20%
Q12013
Q2 Q3 Q4 Q12014
Q2 Q3 Q4 Q12015
Q2 Q3 Q4 Q12016
EBITA-margin (%) ROCE (%) R12
15
02468
1012141618
Q12013
Q2 Q3 Q4 Q12014
Q2 Q3 Q4 Q12015
Q2 Q3 Q4 Q12016
4/5/2016 Interim report Q1/2016
Europe Central 1–3/16 1–3/15 Change 1–12/15
Net sales 11.3 11.0 2.5% 55.4
EBITA -0.8 -0.6 -34.8% 3.3
% of net sales -6.7% -5.1% 5.9%
Capital employed 53.6 59.0 -9.1% 54.7
ROCE (%)1) 5.3% 3.7% 5.6%
Personnel (FTE) 510 481 6.1% 493
Customer centres
55 58 -5.2% 55
Net sales up by 2.5% or by 5.4% at comparable
exchange rates
1) Rolling 12 months

16
Market outlook
4/5/2016 Interim report Q1/2016
17
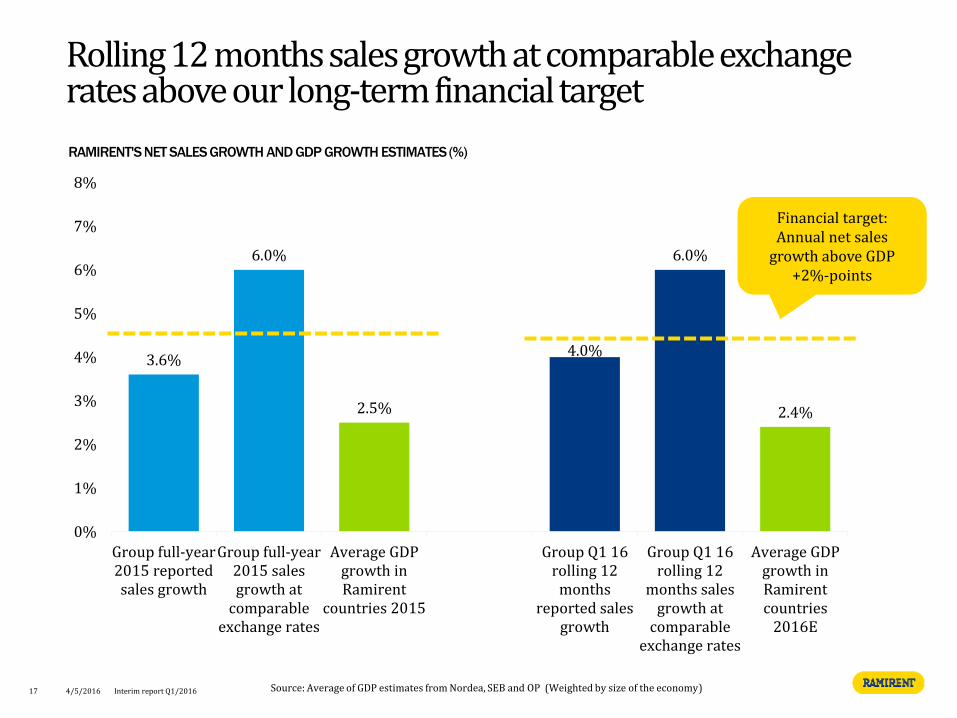
Rolling 12 months sales growth at comparable exchange rates above our long-term financial target
RAMIRENT'S NET SALES GROWTH AND GDP GROWTH ESTIMATES (%)
3.6%
6.0%
2.5%
4.0%
6.0%
2.4%
0%
1%
2%
3%
4%
5%
6%
7%
8%
Group full-year2015 reportedsales growth
Group full-year2015 salesgrowth at
comparableexchange rates
Average GDPgrowth inRamirent
countries 2015
Group Q1 16rolling 12
monthsreported sales
growth
Group Q1 16rolling 12
months salesgrowth at
comparableexchange rates
Average GDPgrowth inRamirentcountries
2016E
Source: Average of GDP estimates from Nordea, SEB and OP (Weighted by size of the economy) 4/5/2016 Interim report Q1/2016
Financial target: Annual net sales
growth above GDP +2%-points

Ramirent expects to see stable and fair overall market conditions in 2016
GDP GROWTH ESTIMATES BY SEGMENT FOR 2016 RAMIRENT'S EXPECTATIONS ON OVERALL DEMAND BY EQUIPMENT RENTAL MARKET
18
Favourable
Stable
Challenging
4/5/2016 Interim report Q1/2016
Sources: Confederation of Finnish Construction Industries (RT) 4/2016, Swedish Construction Federation (BI) 3/2016, Prognosesenteret 3/2016, Danish Construction Industry (DB) 2/2016 and Euroconstruct 12/2015
0.6%
3.7%
1.4% 1.6%
2.6% 3.2%
0%
1%
2%
3%
4%
5%
6%
Finland Sweden Norway Denmark TheBaltics
EuropeCentral
3.5% 4.0% 4.2%
2.7%
1.5%
5.8%
0%
1%
2%
3%
4%
5%
6%
Finland Sweden Norway Denmark TheBaltics
EuropeCentral
CONSTRUCTION VOLUME GROWTH BY SEGMENT FOR 2016
Ramirent outlook for 2016 unchanged
In 2016, Ramirent’s net sales in local currencies and EBITA margin are expected to increase from the level in 2015.
19 4/5/2016 Interim report Q1/2016
4/5/2016 Interim report Q1/2016 20
Key figures
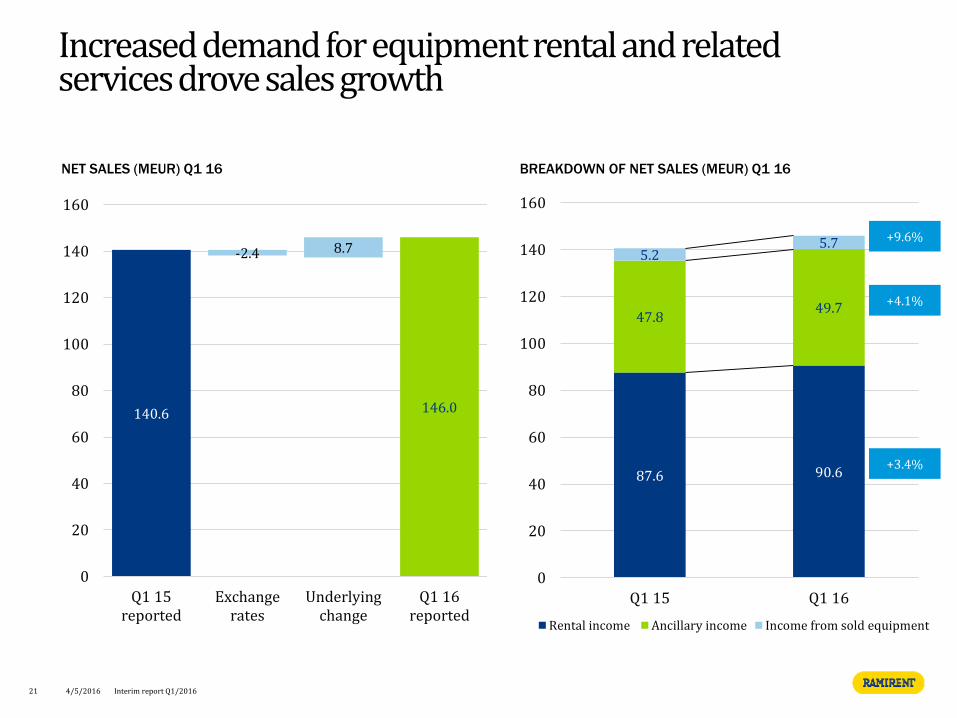
87.6 90.6
47.8 49.7
5.2 5.7
0
20
40
60
80
100
120
140
160
Q1 15 Q1 16
Rental income Ancillary income Income from sold equipment
+3.4%
+4.1%
+9.6%
140.6
-2.4 8.7
146.0
0
20
40
60
80
100
120
140
160
Q1 15reported
Exchangerates
Underlyingchange
Q1 16reported
Increased demand for equipment rental and related services drove sales growth
NET SALES (MEUR) Q1 16 BREAKDOWN OF NET SALES (MEUR) Q1 16
21 4/5/2016 Interim report Q1/2016

2.5%
10.0%
3.3% 3.8%
-5.1%
7.7% 8.2%
4.8% 4.0%
-1.1%
-6.7% -10%
-5%
0%
5%
10%
15%
Finland Sweden Norway Denmark The Baltics Europe Central
First-quarter sales growth at comparable exchange rates, GDP growth and margins by segment
Q1 15 Q1 16
FIRST-QUARTER 2016 SALES GROWTH AT COMPARABLE FX. AND GDP GROWTH ESTIMATES*
FIRST-QUARTER 2016 EBITA MARGIN (%)
22 4/5/2016 Interim report Q1/2016
4.6%
-2.0%
10.9%
1.7%
5.4%
0.6%
3.7%
1.4% 1.6% 2.6%
3.2%
-2%
2%
6%
10%
Finland Sweden Norway Denmark The Baltics Europe Central
At comparable fx. Q1 2016
GDP growth FY2016E
*Source: Average of GDP estimates from Nordea, SEB and OP
-14.8%
19.0%

Sales growth and cost reductions implemented in the previous year driving EBITA
EBITA BRIDGE (MEUR) Q1 15 – Q1 16
4.1
2.1
−0.7 0.3
1.8
−0.3 −0.2 0.0
7.2
0
2
4
6
8
10
EBITA Q12015
Finland Sweden Norway Denmark Europe East EuropeCentral
Items notallocated to
segments
EBITA Q12016
EBITA impacted by write-downs of 1.1 MEUR in Solutions
projects
Improvement driven by higher sales in all
Business Areas
2.5% 10.0% 3.3% −14.8% 1.9% −5.1%
7.7% 8.2% 4.8% 4.0% −2.3% −6.7%
EBITA margin Q1/2015
EBITA margin Q1/2016
23 4/5/2016 Interim report Q1/2016
Strong sales growth and cost reduction measures driving
EBITA

20.3% 21.8%
0%
5%
10%
15%
20%
25%
30%
Q1 15 Q1 16
EBITDA (MEUR)
First-quarter EBITDA margin improved to 21.8% (20.3%)
EBITDA MARGIN
• First-quarter EBITDA margin improved to 21.8% (20.3%) of net sales
• First-quarter EBITDA increased by 11.5% and amounted to 31.9 (28.6) MEUR
24 4/5/2016 Interim report Q1/2016
28.6
31.9
0
5
10
15
20
25
30
35
40
Q1 15 Q1 16
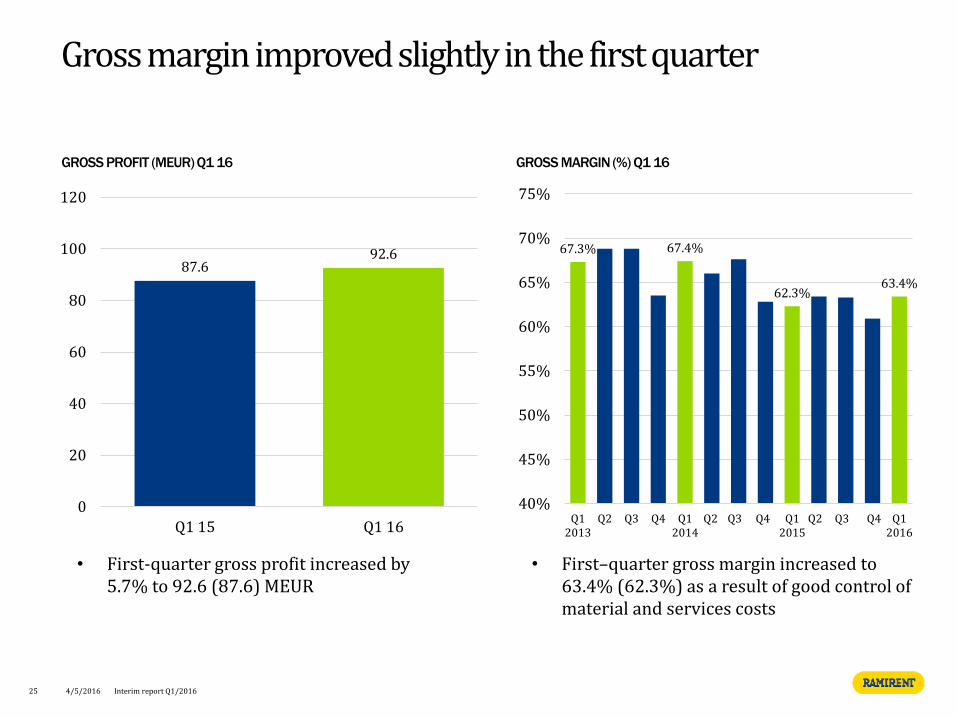
GROSS PROFIT (MEUR) Q1 16
67.3% 67.4%
62.3% 63.4%
40%
45%
50%
55%
60%
65%
70%
75%
Q12013
Q2 Q3 Q4 Q12014
Q2 Q3 Q4 Q12015
Q2 Q3 Q4 Q12016
87.6 92.6
0
20
40
60
80
100
120
Q1 15 Q1 16
GROSS MARGIN (%) Q1 16
• First–quarter gross margin increased to 63.4% (62.3%) as a result of good control of material and services costs
• First-quarter gross profit increased by 5.7% to 92.6 (87.6) MEUR
25
Gross margin improved slightly in the first quarter
4/5/2016 Interim report Q1/2016

FIXED COSTS (MEUR) AND % OF GROUP NET SALES
Good control of fixed costs in the first quarter
• First-quarter fixed costs 61.0 (59.6) MEUR or 41.8% (42.4%) of net sales
• Employee benefit expenses 39.5 (37.8) MEUR
• Other operating expenses 21.5 (21.9) MEUR
• Rolling 12 months fixed costs amounted to 238.2 (237.0) MEUR or 37.2% (38.4%) of net sales
• Rolling 12 months fixed costs excluding items affecting comparability amounted to 237.0 (232.8) MEUR or 37.0% (37.8%) of net sales
65.9
60.9 59.6 61.0
0%
5%
10%
15%
20%
25%
30%
35%
40%
45%
50%
0
10
20
30
40
50
60
70
80
Q12013
Q2 Q3 Q4 Q12014
Q2 Q3 Q4 Q12015
Q2 Q3 Q4 Q12016
26 4/5/2016 Interim report Q1/2016
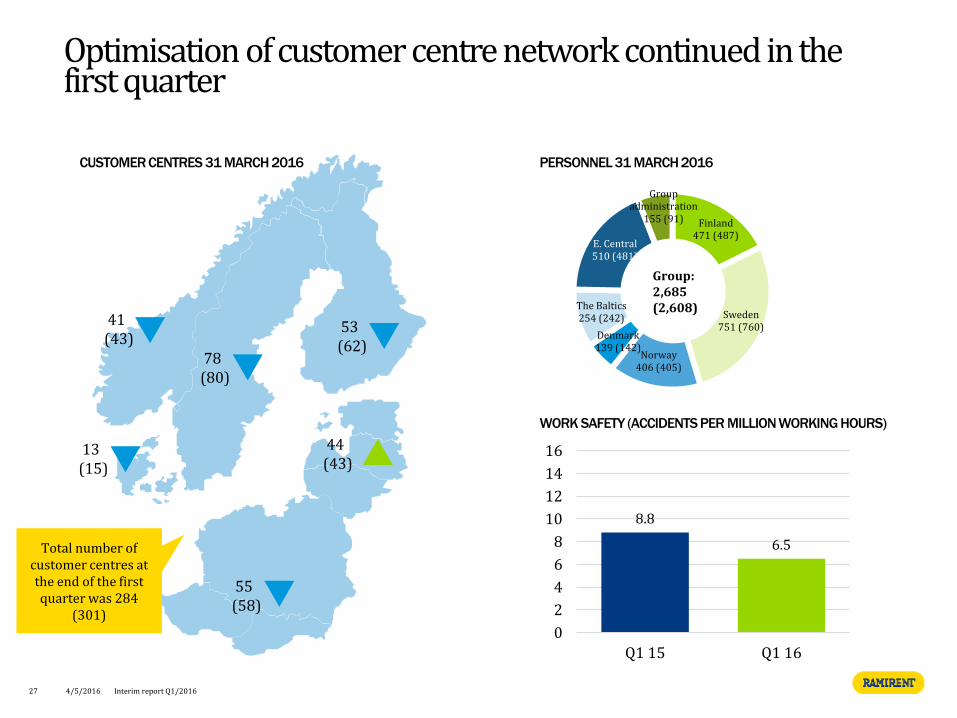
Finland 471 (487)
Sweden 751 (760)
Norway 406 (405)
Denmark 139 (142)
The Baltics 254 (242)
E. Central 510 (481)
Group administration
155 (91)
CUSTOMER CENTRES 31 MARCH 2016 PERSONNEL 31 MARCH 2016
Optimisation of customer centre network continued in the first quarter
Group: 2,685 (2,608)
53 (62)
44 (43)
55 (58)
78 (80)
13 (15)
41 (43)
27 4/5/2016 Interim report Q1/2016
8.8
6.5
0
2
4
6
8
10
12
14
16
Q1 15 Q1 16
WORK SAFETY (ACCIDENTS PER MILLION WORKING HOURS)
Total number of customer centres at the end of the first quarter was 284
(301)
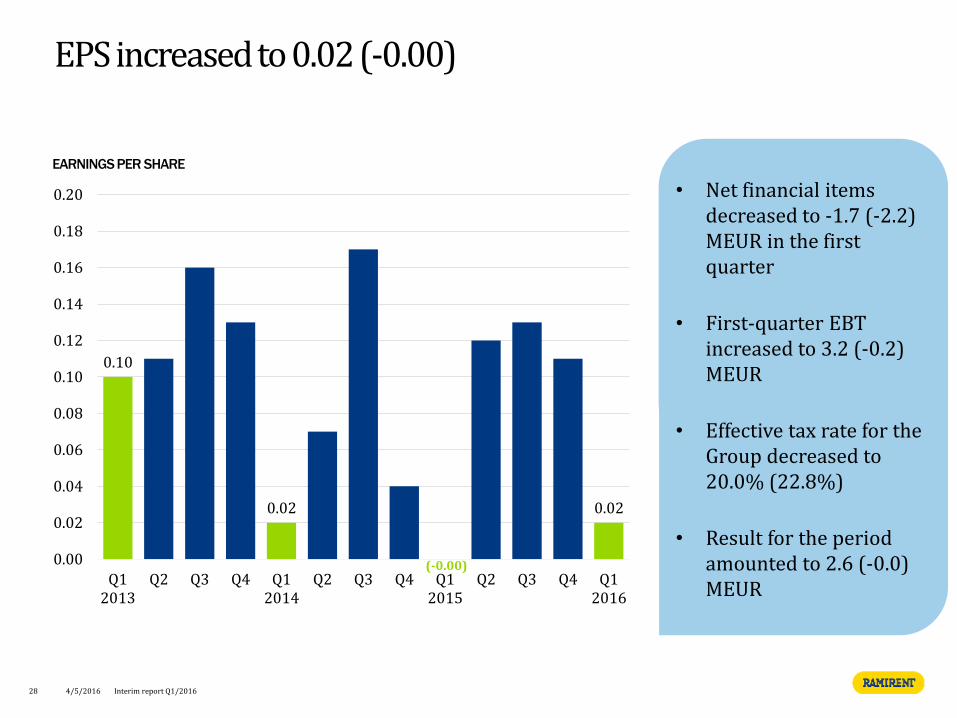
EARNINGS PER SHARE
EPS increased to 0.02 (-0.00)
• Net financial items decreased to -1.7 (-2.2) MEUR in the first quarter
• First-quarter EBT increased to 3.2 (-0.2) MEUR
• Effective tax rate for the Group decreased to 20.0% (22.8%)
• Result for the period amounted to 2.6 (-0.0) MEUR
28
0.10
0.02 0.02
0.00
0.02
0.04
0.06
0.08
0.10
0.12
0.14
0.16
0.18
0.20
Q12013
Q2 Q3 Q4 Q12014
Q2 Q3 Q4 Q12015
Q2 Q3 Q4 Q12016
4/5/2016 Interim report Q1/2016
(-0.00)

CAPITAL EXPENDITURE EXCL. ACQUISITIONS (MEUR) AND % OF NET SALES
Investments in machinery and equipment increased to support growth in all business areas
• Q1 16 Gross capex 40.4 (18.1) MEUR or 27.7% (12.9%) of net sales
• Q1 16 investments in machinery and equipment 35.1 (15.9) MEUR. No acquisitions in the first quarter 2016 nor in 2015.
• Sales of used equipment amounted to 5.7 (5.2) MEUR
• Committed investments in rental machinery 57.0 (42.7) MEUR at the end of the first quarter
29 4/5/2016 Interim report Q1/2016
29.0
22.0
15.9
35.1
0%
5%
10%
15%
20%
25%
30%
35%
40%
0
10
20
30
40
50
60
Q12013
Q2 Q3 Q4 Q12014
Q2 Q3 Q4 Q12015
Q2 Q3 Q4 Q12016
Capex excl. acquisitions Share of net sales-%
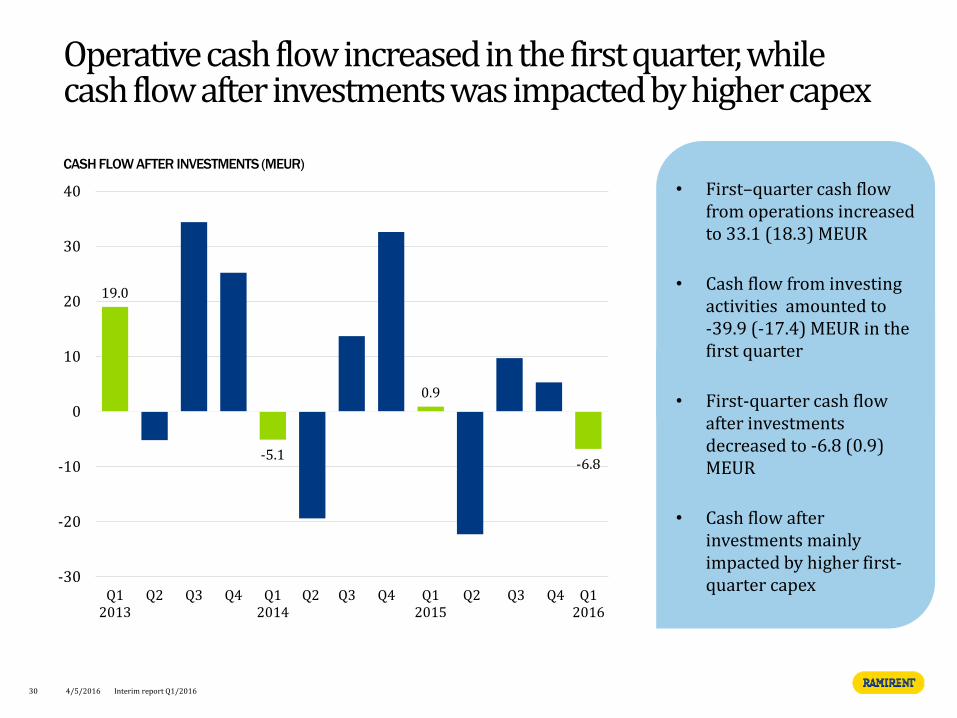
CASH FLOW AFTER INVESTMENTS (MEUR)
Operative cash flow increased in the first quarter, while cash flow after investments was impacted by higher capex
• First–quarter cash flow from operations increased to 33.1 (18.3) MEUR
• Cash flow from investing activities amounted to -39.9 (-17.4) MEUR in the first quarter
• First-quarter cash flow after investments decreased to -6.8 (0.9) MEUR
• Cash flow after investments mainly impacted by higher first-quarter capex
19.0
-5.1
0.9
-6.8
-30
-20
-10
0
10
20
30
40
Q12013
Q2 Q3 Q4 Q12014
Q2 Q3 Q4 Q12015
Q2 Q3 Q4 Q12016
30 4/5/2016 Interim report Q1/2016
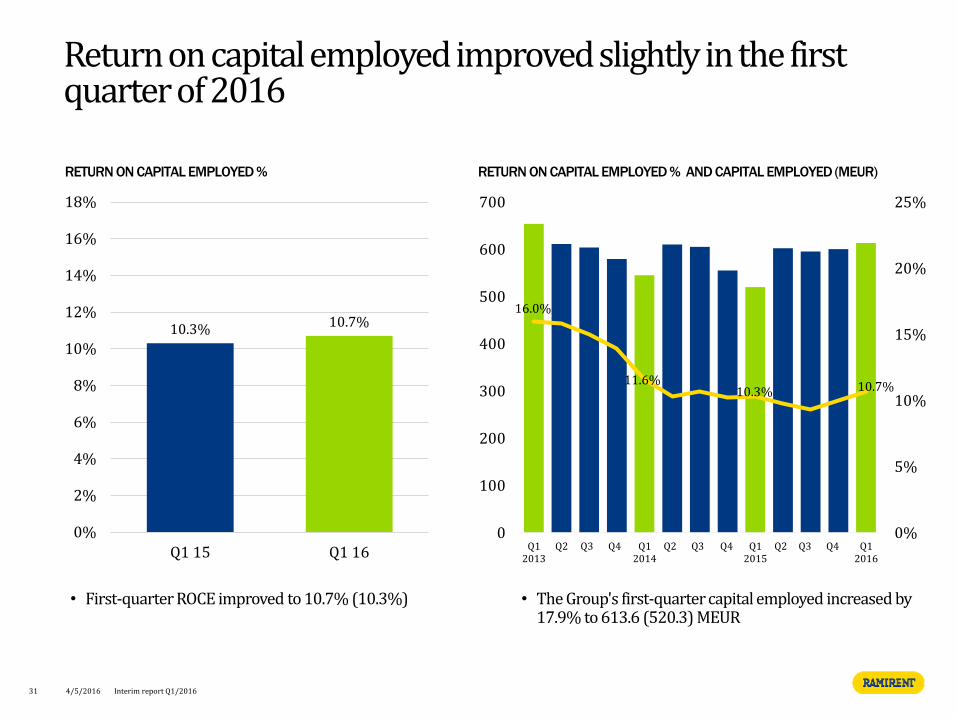
Return on capital employed improved slightly in the first quarter of 2016
RETURN ON CAPITAL EMPLOYED %
10.3% 10.7%
0%
2%
4%
6%
8%
10%
12%
14%
16%
18%
Q1 15 Q1 16
• The Group's first-quarter capital employed increased by 17.9% to 613.6 (520.3) MEUR
RETURN ON CAPITAL EMPLOYED % AND CAPITAL EMPLOYED (MEUR)
31 4/5/2016 Interim report Q1/2016
• First-quarter ROCE improved to 10.7% (10.3%)
16.0%
11.6% 10.3% 10.7%
0%
5%
10%
15%
20%
25%
0
100
200
300
400
500
600
700
Q12013
Q2 Q3 Q4 Q12014
Q2 Q3 Q4 Q12015
Q2 Q3 Q4 Q12016

18.8%
15.5%
4.0% 6.1%
15.0%
5.3%
-20%
-15%
-10%
-5%
0%
5%
10%
15%
20%
25%
Finland Sweden Norway Denmark The Baltics Central
Q1 15 Q2 15 Q3 15 Q4 15 Q1 16
RETURN ON CAPITAL EMPLOYED % (ROLLING 12 MONTHS)
ROCE continued to improve in Finland and Denmark
32 4/5/2016 Interim report Q1/2016
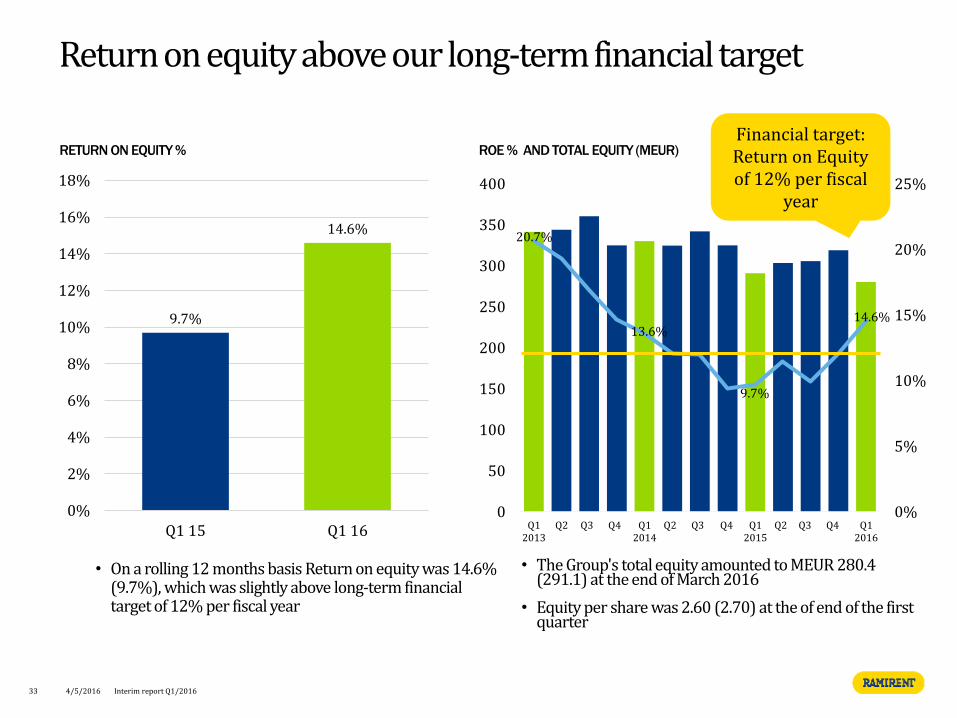
Return on equity above our long-term financial target
RETURN ON EQUITY %
9.7%
14.6%
0%
2%
4%
6%
8%
10%
12%
14%
16%
18%
Q1 15 Q1 16
• The Group's total equity amounted to MEUR 280.4 (291.1) at the end of March 2016
• Equity per share was 2.60 (2.70) at the of end of the first quarter
• On a rolling 12 months basis Return on equity was 14.6% (9.7%), which was slightly above long-term financial target of 12% per fiscal year
ROE % AND TOTAL EQUITY (MEUR)
20.7%
13.6%
9.7%
14.6%
0%
5%
10%
15%
20%
25%
0
50
100
150
200
250
300
350
400
Q12013
Q2 Q3 Q4 Q12014
Q2 Q3 Q4 Q12015
Q2 Q3 Q4 Q12016
33
Financial target: Return on Equity of 12% per fiscal
year
4/5/2016 Interim report Q1/2016

34
Financial position
4/5/2016 Interim report Q1/2016
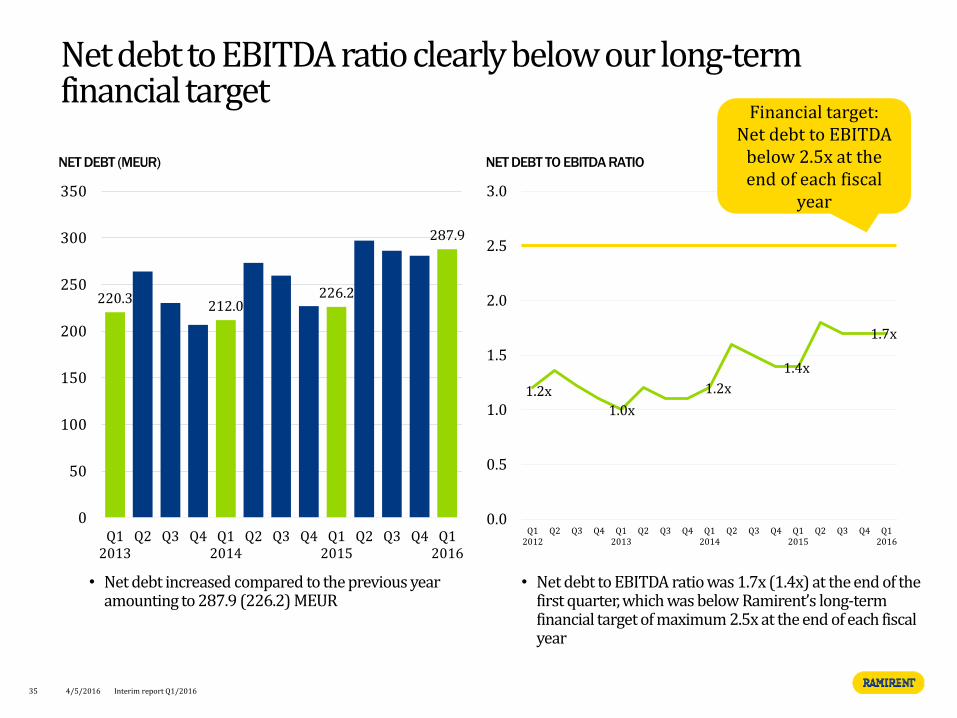
Net debt to EBITDA ratio clearly below our long-term financial target
NET DEBT (MEUR)
• Net debt to EBITDA ratio was 1.7x (1.4x) at the end of the first quarter, which was below Ramirent’s long-term financial target of maximum 2.5x at the end of each fiscal year
• Net debt increased compared to the previous year amounting to 287.9 (226.2) MEUR
NET DEBT TO EBITDA RATIO
1.2x
1.0x
1.2x
1.4x
1.7x
0.0
0.5
1.0
1.5
2.0
2.5
3.0
Q12012
Q2 Q3 Q4 Q12013
Q2 Q3 Q4 Q12014
Q2 Q3 Q4 Q12015
Q2 Q3 Q4 Q12016
35
Financial target: Net debt to EBITDA
below 2.5x at the end of each fiscal
year
4/5/2016 Interim report Q1/2016
220.3 212.0
226.2
287.9
0
50
100
150
200
250
300
350
Q12013
Q2 Q3 Q4 Q12014
Q2 Q3 Q4 Q12015
Q2 Q3 Q4 Q12016
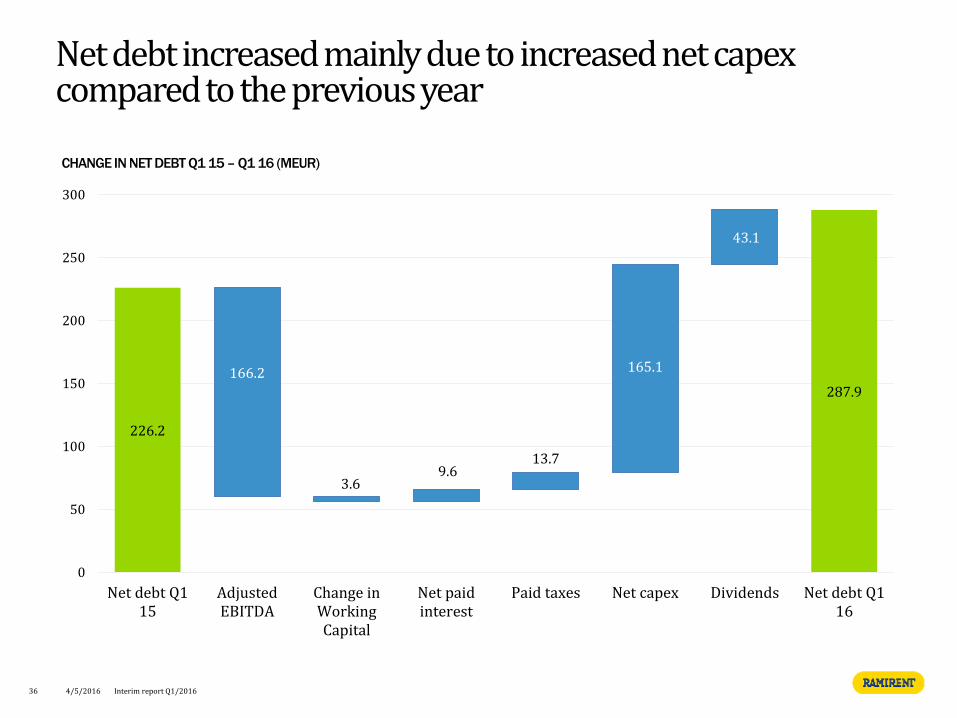
Net debt increased mainly due to increased net capex compared to the previous year
CHANGE IN NET DEBT Q1 15 – Q1 16 (MEUR)
36 4/5/2016 Interim report Q1/2016
226.2
287.9
166.2
3.6 9.6
13.7
165.1
43.1
0
50
100
150
200
250
300
Net debt Q115
AdjustedEBITDA
Change inWorkingCapital
Net paidinterest
Paid taxes Net capex Dividends Net debt Q116
Fixed 50%
Floating 50%
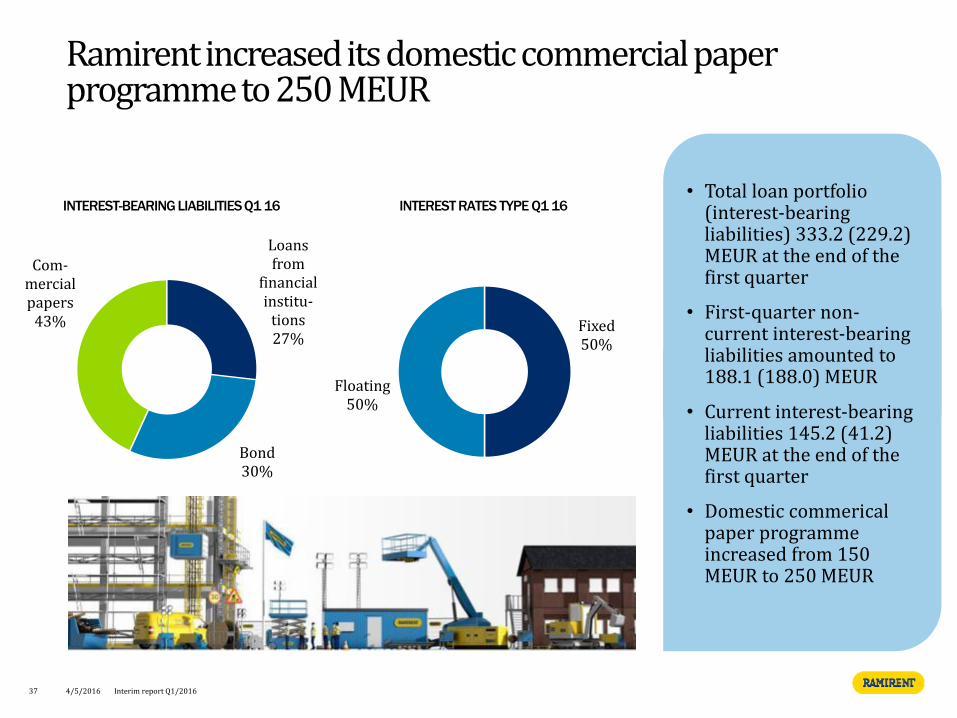
• Total loan portfolio (interest-bearing liabilities) 333.2 (229.2) MEUR at the end of the first quarter
• First-quarter non-current interest-bearing liabilities amounted to 188.1 (188.0) MEUR
• Current interest-bearing liabilities 145.2 (41.2) MEUR at the end of the first quarter
• Domestic commerical paper programme increased from 150 MEUR to 250 MEUR
Ramirent increased its domestic commercial paper programme to 250 MEUR
Loans from
financial institu-
tions 27%
Bond 30%
Com-mercial papers
43%
INTEREST-BEARING LIABILITIES Q1 16 INTEREST RATES TYPE Q1 16
37 4/5/2016 Interim report Q1/2016

REPAYMENT SCHEDULE OF INTEREST-BEARING LIABILITES (MEUR)
At the end of the first quarter, Ramirent had unused committed back–up loan facilities of EUR 127.3
• Ramirent had unused committed back-up loan facilities of 127.3 (189.0) MEUR available at the end of the first quarter
• First-quarter average interest rate of the loan portfolio including interest rate hedges was 2.2% (3.0%)
• In addition to bank facilities, Ramirent is utilising a domestic commercial paper programme of up to 250 MEUR
75
95
100
145
2016 2017 2018 2019 2020
Net debt EUR 287.9 million
EUR 415.0 million in committed credit facilities
38 4/5/2016 Interim report Q1/2016
For further information
4/5/2016 Interim report Q1/2016 39

4/5/2016 Interim report Q1/2016 40
Appendix

• Ramirent is a leading equipment rental solutions group operating in 10 countries with 2015 net sales of EUR 636 million
• Ramirent’s mission is to combine the best equipment, services and know-how into rental solutions that simplify customer’s business
• Ramirent serves a broad range of customer sectors including construction, industry, services, the public sector and households
• Ramirent has 2,685 employees operating from 284 customer centres
• Ramirent was founded in 1955 and is listed on the NASDAQ Helsinki (RMR1V)
Ramirent is a leading equipment rental solutions group serving a large customer base
Russia and Ukraine presence through JV Fortrent
JV Fehmarnbelt Solutions Services A/S, with Zeppelin Rental
NET SALES PER SEGMENT Q1 16
NET SALES BY CUSTOMER SECTOR Q1 16
NET SALES BY BUSINESS AREA Q1 16
Finland 26%
Sweden 36%
Norway 19%
Denmark 7%
Europe East –Baltics 4%
Europe Central 8%
Construction 51%
Industrial 19%
Services & Retail 23%
Public 3%
Other 4%
Private 1%
General Rental 63%
Solutions 32%
Temporary Space 5%
41 4/5/2016 Interim report Q1/2016
42
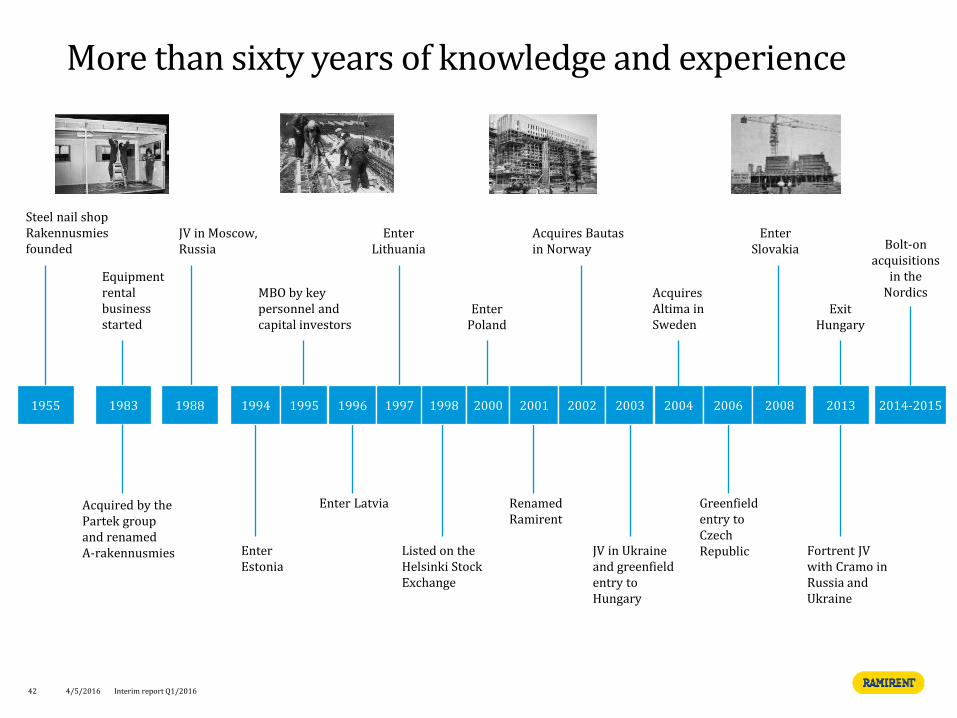
Steel nail shop Rakennusmies founded
Equipment rental business started
JV in Moscow, Russia
Enter Estonia
MBO by key personnel and capital investors
Enter Lithuania
Listed on the Helsinki Stock Exchange
Enter Poland
Enter Slovakia
1983 1955 1988 1994 1995 1996 1997 1998 2000 2001 2002 2003 2004 2006 2013 2008
Acquires Bautas in Norway
Acquires Altima in Sweden
Fortrent JV with Cramo in Russia and Ukraine
Acquired by the Partek group and renamed A-rakennusmies
Enter Latvia Renamed Ramirent
Greenfield entry to Czech Republic JV in Ukraine
and greenfield entry to Hungary
Exit Hungary
2014-2015
Bolt-on acquisitions
in the Nordics
More than sixty years of knowledge and experience
4/5/2016 Interim report Q1/2016

Benefits More uptime in core operations due to less downtime in equipment, less maintenance costs, right choice of equipment improves efficiency, less product liability risk
Planning
On-site services
Logistics
Merchandise sale
Rental insurance
Training
Benefits Lighter balance sheets, less investments
43
Benefits Understanding client requirements helps to customise product and service selection and further improve productivity
Heavy Equipment
Access Equipment Lifts, Hoists,
Scaffolding, Tower cranes
Modules and site equipment
Light Equipment Tools, power and heating
equipment
Integrated rental Solutions
Benefits Easy to buy, reduced number of subcontractors, increased focus on the core business
Ramirent's offering stretches from single equipment rental to solutions
4/5/2016 Interim report Q1/2016

We continue to pursue sustainable profitable growth through five strategic focus themes
Customer facing
Internal
44 4/5/2016 Interim report Q1/2016
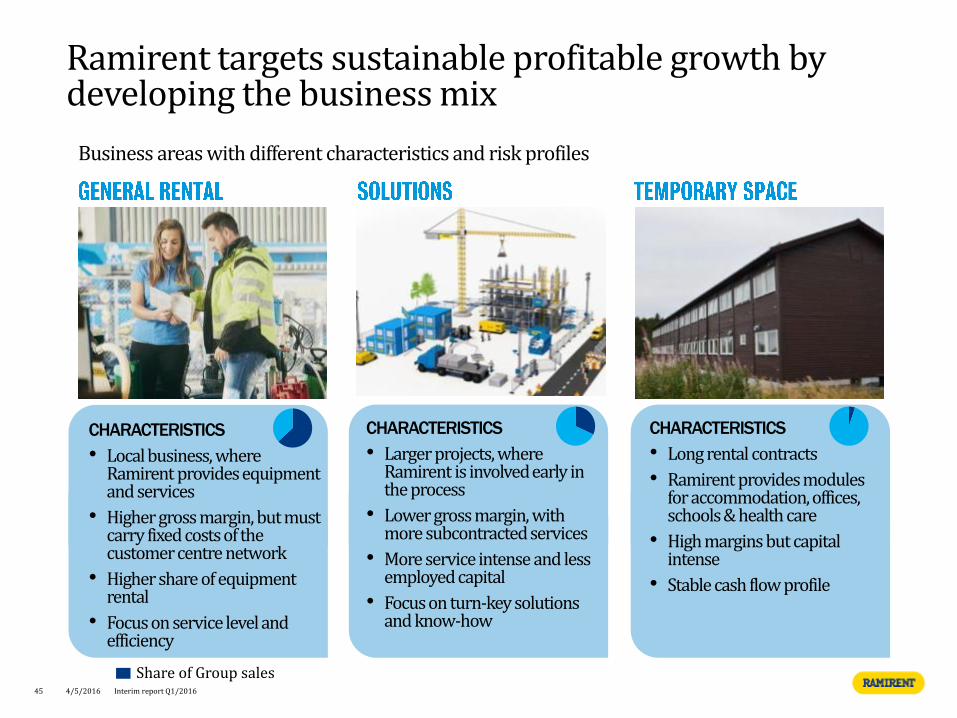
CHARACTERISTICS
• Local business, where Ramirent provides equipment and services
• Higher gross margin, but must carry fixed costs of the customer centre network
• Higher share of equipment rental
• Focus on service level and efficiency
Interim report Q1/2016
CHARACTERISTICS
• Larger projects, where Ramirent is involved early in the process
• Lower gross margin, with more subcontracted services
• More service intense and less employed capital
• Focus on turn-key solutions and know-how
CHARACTERISTICS
• Long rental contracts
• Ramirent provides modules for accommodation, offices, schools & health care
• High margins but capital intense
• Stable cash flow profile
Ramirent targets sustainable profitable growth by developing the business mix
45 4/5/2016
Business areas with different characteristics and risk profiles
Share of Group sales

Ramirent targets a business mix that balances growth opportunities, profitability and risk
GROUP NET SALES SPLIT BY BUSINESS AREA Q1 16
46 Interim report Q1/2016 4/5/2016
Temporary Space
5%
General Rental 63%
Solutions 32%
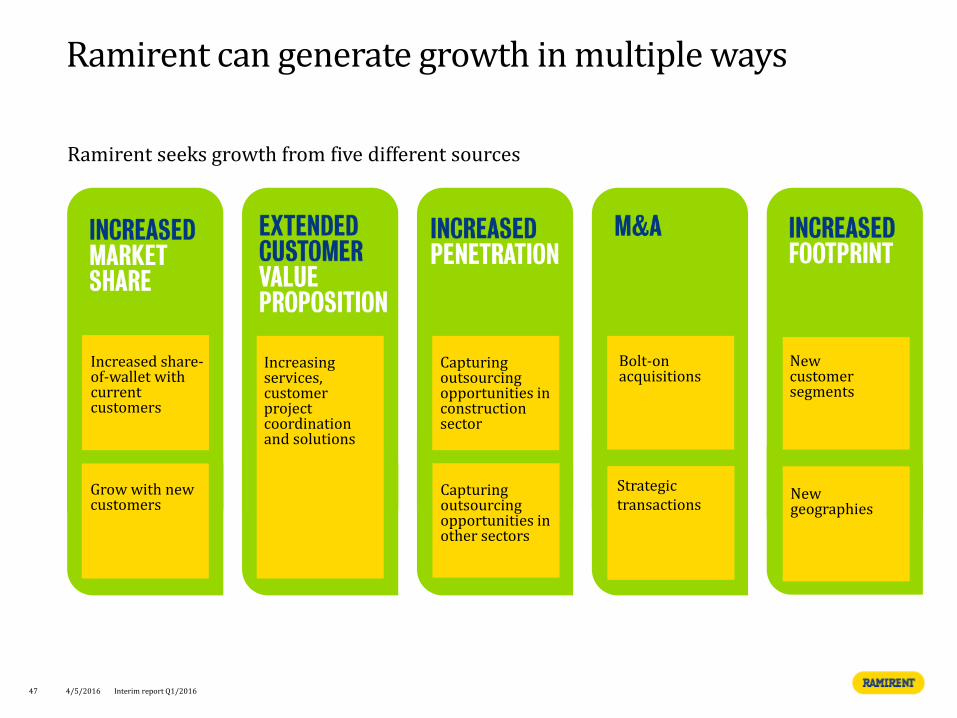
Ramirent can generate growth in multiple ways
Ramirent seeks growth from five different sources
New customer segments
New geographies
Bolt-on acquisitions
Capturing outsourcing opportunities in construction sector
Increasing services, customer project coordination and solutions
Grow with new customers
Increased share-of-wallet with current customers
Strategic transactions
47
Capturing outsourcing opportunities in other sectors
4/5/2016 Interim report Q1/2016
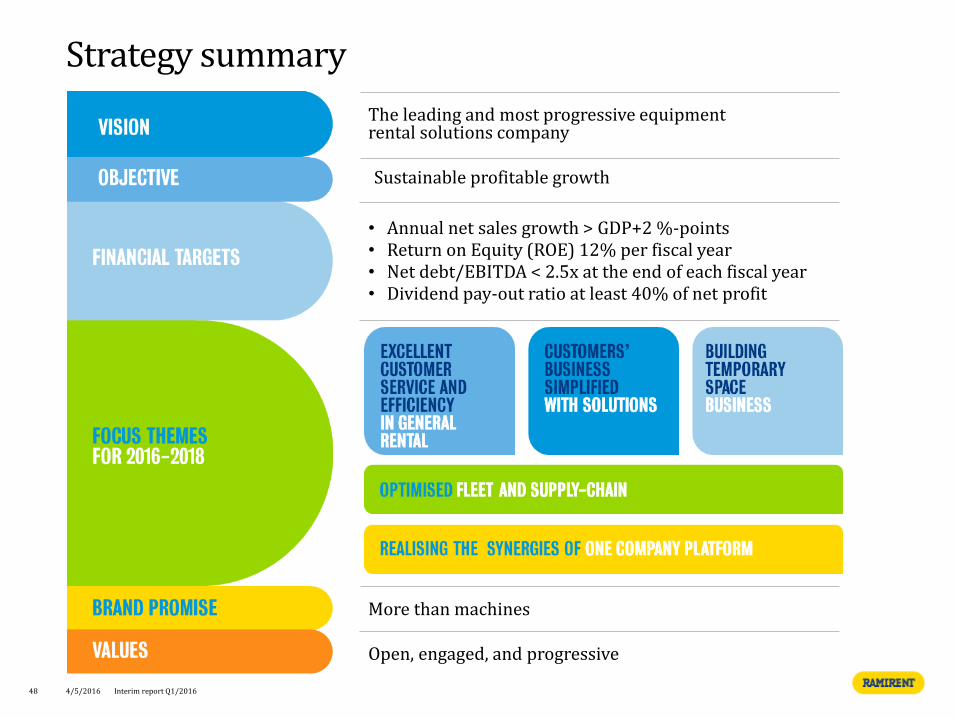
Strategy summary
The leading and most progressive equipment rental solutions company
• Annual net sales growth > GDP+2 %-points • Return on Equity (ROE) 12% per fiscal year • Net debt/EBITDA < 2.5x at the end of each fiscal year • Dividend pay-out ratio at least 40% of net profit
More than machines
Open, engaged, and progressive
Sustainable profitable growth
48 4/5/2016 Interim report Q1/2016
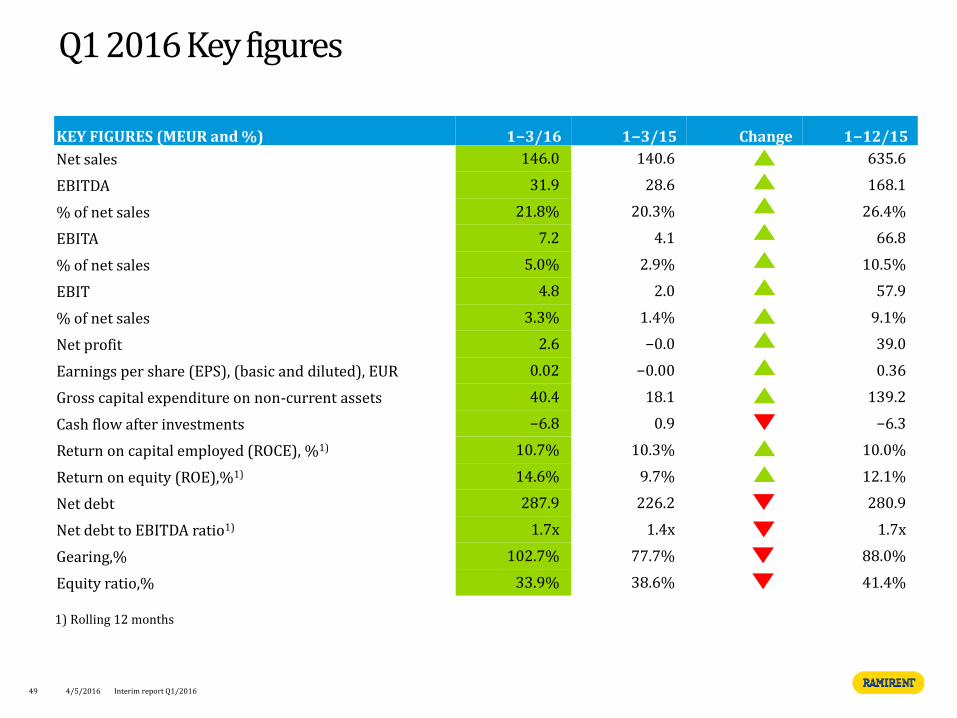
Q1 2016 Key figures
49 4/5/2016
KEY FIGURES (MEUR and %) 1−3/16 1−3/15 Change 1−12/15
Net sales 146.0 140.6 635.6
EBITDA 31.9 28.6 168.1
% of net sales 21.8% 20.3% 26.4%
EBITA 7.2 4.1 66.8
% of net sales 5.0% 2.9% 10.5%
EBIT 4.8 2.0 57.9
% of net sales 3.3% 1.4% 9.1%
Net profit 2.6 −0.0 39.0
Earnings per share (EPS), (basic and diluted), EUR 0.02 −0.00 0.36
Gross capital expenditure on non-current assets 40.4 18.1 139.2
Cash flow after investments −6.8 0.9 −6.3
Return on capital employed (ROCE), %1) 10.7% 10.3% 10.0%
Return on equity (ROE),%1) 14.6% 9.7% 12.1%
Net debt 287.9 226.2 280.9
Net debt to EBITDA ratio1) 1.7x 1.4x 1.7x
Gearing,% 102.7% 77.7% 88.0%
Equity ratio,% 33.9% 38.6% 41.4%
1) Rolling 12 months
Interim report Q1/2016

Return on investment improved slightly in the first quarter
RETURN ON INVESTMENT %
9.7%
10.8%
0%
2%
4%
6%
8%
10%
12%
14%
16%
18%
Q1 15 Q1 16
• The Group's invested capital increased by 17.9% to 613.6 (520.3) MEUR due to investments in the rental fleet to capture growth opportunities in growing business areas
• Comparison figures adjusted accordingly
RETURN ON INVESTMENT % AND INVESTED CAPITAL (MEUR)
16.6%
11.2% 9.7%
10.8%
0%
5%
10%
15%
20%
25%
0
100
200
300
400
500
600
700
Q12013
Q2 Q3 Q4 Q12014
Q2 Q3 Q4 Q12015
Q2 Q3 Q4 Q12016
50 4/5/2016 Interim report Q1/2016
• With the new formula, first-quarter ROI was 10.8% (9.7%)

Calculation of Return on investments (ROI %) has been changed from the beginning of 2016
51 4/5/2016 Interim report Q1/2016
12.9%
-249 basis points 40
basis points
10.8%
0%
2%
4%
6%
8%
10%
12%
14%
16%
ROI Q1 15 (old) Change incalculation
Profitabilityimprovement
ROI Q1 16 (new)
• In the new Return on investment (ROI) calculation, exchange rates are excluded from the nominator in the formula
• The comparative information is adjusted accordingly in the first quarter report
• First-quarter 2016 ROI % with the new formula was 10.8% (9.7%)
• Change in calculation decreased ROI by 249 bps, while improved profitability had a positive impact of 40 bps to the ROI
RETURN ON INVESTMENT (ROI %) BRIDGE Q1 15 – Q1 16
New ROI =
𝑅𝑒𝑠𝑢𝑙𝑡 𝑏𝑒𝑓𝑜𝑟𝑒 𝑡𝑎𝑥𝑒𝑠+𝑖𝑛𝑡𝑒𝑟𝑒𝑠𝑡 𝑎𝑛𝑑 𝑜𝑡ℎ𝑒𝑟 𝑓𝑖𝑛𝑎𝑛𝑐𝑖𝑎𝑙 𝑒𝑥𝑝𝑒𝑛𝑠𝑒𝑠𝑒𝑥𝑐𝑙𝑢𝑑𝑖𝑛𝑔 𝑓𝑥. 𝑑𝑖𝑓𝑓𝑒𝑟𝑒𝑛𝑐𝑒𝑠
𝑇𝑜𝑡𝑎𝑙 𝑎𝑠𝑠𝑒𝑠𝑡 −𝑖𝑛𝑡𝑒𝑟𝑒𝑠𝑡 𝑏𝑒𝑎𝑟𝑖𝑛𝑔 𝑙𝑖𝑎𝑏𝑖𝑙𝑖𝑡𝑖𝑒𝑠 (𝑎𝑣𝑒𝑟𝑎𝑔𝑒 𝑜𝑣𝑒𝑟 𝑡ℎ𝑒 𝑓𝑖𝑛𝑎𝑛𝑐𝑖𝑎𝑙 𝑝𝑒𝑟𝑟𝑖𝑜𝑑)
∗ 100%
Old ROI =
𝑅𝑒𝑠𝑢𝑙𝑡 𝑏𝑒𝑓𝑜𝑟𝑒 𝑡𝑎𝑥𝑒𝑠+𝑖𝑛𝑡𝑒𝑟𝑒𝑠𝑡 𝑎𝑛𝑑 𝑜𝑡ℎ𝑒𝑟 𝑓𝑖𝑛𝑎𝑛𝑐𝑖𝑎𝑙 𝑒𝑥𝑝𝑒𝑛𝑠𝑒𝑠
𝑇𝑜𝑡𝑎𝑙 𝑎𝑠𝑠𝑒𝑠𝑡 −𝑖𝑛𝑡𝑒𝑟𝑒𝑠𝑡 𝑏𝑒𝑎𝑟𝑖𝑛𝑔 𝑙𝑖𝑎𝑏𝑖𝑙𝑖𝑡𝑖𝑒𝑠 (𝑎𝑣𝑒𝑟𝑎𝑔𝑒 𝑜𝑣𝑒𝑟 𝑡ℎ𝑒 𝑓𝑖𝑛𝑎𝑛𝑐𝑖𝑎𝑙 𝑝𝑒𝑟𝑟𝑖𝑜𝑑)
∗ 100%

Ramirent‘s largest shareholders at the end of March 2016
TRADING INFORMATION Listing: NASDAQ HELSINKI Segment: Mid Cap Sector: Industrials Trading code: RMR1V SHARE INFORMATION Q1 16 Closing price 5.75 (6.61) Highest 6.41 (7.45) Lowest 5.05 (6.35) VWAP* 5.86 (6.99)
At the end of March 2016 a total of 52.1% (51.2%) of the company’s shares were owned by nominee-registered and non-Finnish investors
52
LARGEST SHAREHOLDERS 31 MARCH 2016
Largest shareholders Number of
shares % of share
capital
1. Nordstjernan AB 27,513,716 25.31%
2. Oy Julius Tallberg Ab 12,207,229 11.23%
3. Nordea funds 5,384,915 4.95%
4. Varma Mutual Pension Insurance Company 3,640,865 3.35%
5. Ilmarinen Mutual Pension Insurance Company 3,445,154 3.17%
6. Aktia funds 2,055,558 1.89%
7. Ramirent Plc 948,014 0.87%
8. Pensionsförsäkringsaktiebolaget Veritas 708,353 0.65%
9. Föreningen Konstsamfundet R.f 593,500 0.55%
10. The State Pension Fund 532,000 0.49%
Subtotal 10 largest shareholders 57,029,304 52.47%
Other shareholders 51,668,024 47.53%
Total number of shares 108,697,328 100.00%
*VWAP = Volume weighted average trading price
4/5/2016 Interim report Q1/2016

Ramirent's share price development in 2016
53
INDEX
4/5/2016 Interim report Q1/2016
70
80
90
100
110Ramirent
OMX Helsinki
OMX Helsinki Mid Cap
