romania 2013
DESCRIPTION
Raport Cercetare Inovare UE 2013TRANSCRIPT

Research and Innovation performance in
Country Profile
2013
Research and Innovation
Romania

EUROPEAN COMMISSION
Directorate– General for Research and InnovationDirectorate C — Research and InnovationUnit C.6 — Economic analysis and indicators
European CommissionB-1049 Brussels
E– mail : [email protected]
Europe Direct is a service to help you find answers to your questions about the European Union.
Freephone number (*):
00 800 6 7 8 9 10 11(*) The information given is free, as are most calls (though some operators,
phone boxes or hotels may charge you).
LEGAL NOTICE
Neither the European Commission nor any person acting on behalf of the Commission is responsible for the use which
might be made of the following information.
The views expressed in this publication are the sole responsibility of the author and do not necessarily reflect the views
of the European Commission.
More information on the European Union is available on the Internet (http://europa.eu).
Cataloguing data can be found at the end of this publication.
Luxembourg: Publications Office of the European Union, 2013
ISBN 978-92-79-30859-8
doi:10.2777/25094
© European Union, 2013
Reproduction is authorised provided the source is acknowledged.
Cover Images: earth, © #2520287, 2011. Source: Shutterstock.com;
bottom globe, © PaulPaladin #11389806, 2012. Source: Fotolia.com
1I nnovat ion Un ion progress at countr y level
1I nnovat ion Un ion progress at countr y level
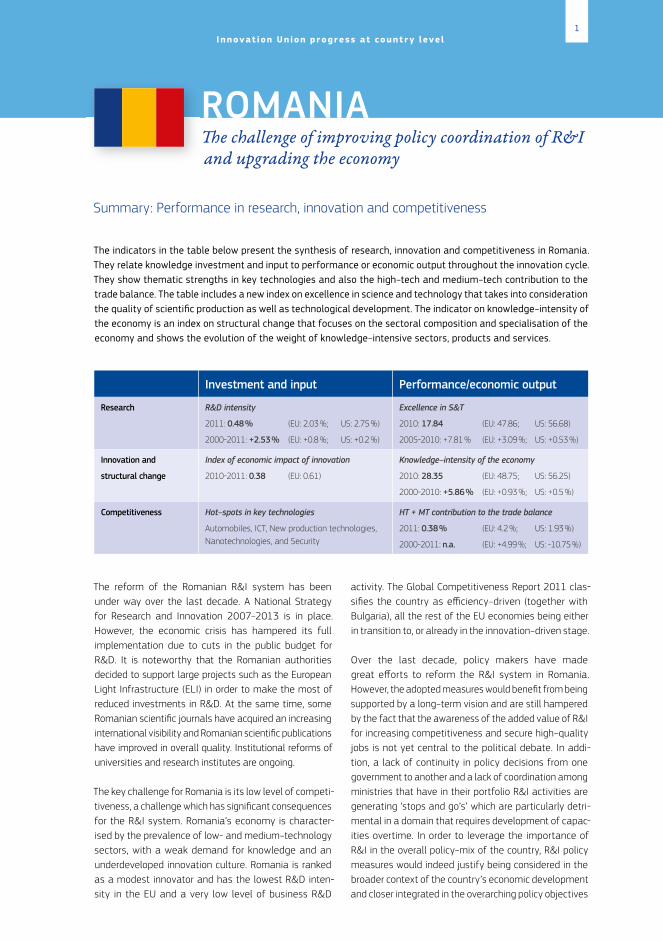
Summary : Performance in research, innovation and competitiveness
The indicators in the table below present the synthesis of research, innovation and competitiveness in Romania. They relate knowledge investment and input to performance or economic output throughout the innovation cycle. They show thematic strengths in key technologies and also the high– tech and medium– tech contribution to the trade balance. The table includes a new index on excellence in science and technology that takes into consideration the quality of scientifi c production as well as technological development. The indicator on knowledge– intensity of the economy is an index on structural change that focuses on the sectoral composition and specialisation of the economy and shows the evolution of the weight of knowledge– intensive sectors, products and services.
Investment and input Performance/economic output
Research R&D intensity
2011 : 0.48 % (EU : 2.03 % ; US : 2.75 %)
2000-2011 : +2.53 % (EU : +0.8 % ; US : +0.2 %)
Excellence in S&T
2010 : 17.84 (EU : 47.86 ; US : 56.68)
2005-2010 : +7.81 % (EU : +3.09 % ; US : +0.53 %)
Innovation and
structural change
Index of economic impact of innovation
2010-2011 : 0.38 (EU : 0.61)
Knowledge– intensity of the economy
2010 : 28.35 (EU : 48.75 ; US : 56.25)
2000-2010 : +5.86 % (EU : +0.93 % ; US : +0.5 %)
Competitiveness Hot– spots in key technologies
Automobiles, ICT, New production technologies, Nanotechnologies, and Security
HT + MT contribution to the trade balance
2011 : 0.38 % (EU : 4.2 % ; US : 1.93 %)
2000-2011 : n.a. (EU : +4.99 % ; US : -10.75 %)
The reform of the Romanian R&I system has been under way over the last decade. A National Strategy for Research and Innovation 2007–2013 is in place. However, the economic crisis has hampered its full implementation due to cuts in the public budget for R&D. It is noteworthy that the Romanian authorities decided to support large projects such as the European Light Infrastructure (ELI) in order to make the most of reduced investments in R&D. At the same time, some Romanian scientifi c journals have acquired an increasing international visibility and Romanian scientifi c publications have improved in overall quality. Institutional reforms of universities and research institutes are ongoing.
The key challenge for Romania is its low level of competi-tiveness, a challenge which has signifi cant consequences for the R&I system. Romania’s economy is character-ised by the prevalence of low- and medium– technology sectors, with a weak demand for knowledge and an underdeveloped innovation culture. Romania is ranked as a modest innovator and has the lowest R&D inten-sity in the EU and a very low level of business R&D
activity. The Global Competitiveness Report 2011 clas-sifi es the country as effi ciency– driven (together with Bulgaria), all the rest of the EU economies being either in transition to, or already in the innovation– driven stage.
Over the last decade, policy makers have made great eff orts to reform the R&I system in Romania. However, the adopted measures would benefi t from being supported by a long– term vision and are still hampered by the fact that the awareness of the added value of R&I for increasing competitiveness and secure high– quality jobs is not yet central to the political debate. In addi-tion, a lack of continuity in policy decisions from one government to another and a lack of coordination among ministries that have in their portfolio R&I activities are generating ‘stops and go’s’ which are particularly detri-mental in a domain that requires development of capac-ities overtime. In order to leverage the importance of R&I in the overall policy– mix of the country, R&I policy measures would indeed justify being considered in the broader context of the country’s economic development and closer integrated in the overarching policy objectives
ROMANIA� e challenge of improving policy coordination of R&I and upgrading the economy

2Research and Innovat ion per formance in EU Member States and Assoc iated countr ies
of the country. For instance, improving the overall func-tioning of institutions would result in a better coordina-tion of R&I policies across various ministries, whereas
an increased focus on competitiveness at political levels would draw the attention of policy makers to the added value of R&I for growth and jobs.
Investing in knowledge
R&D
inte
nsity
(%)
Source: DG Research and Innovation — Economic Analysis Unit Data: DG Research and Innovation, Eurostat, Member StateNotes: (1) The R&D intensity projections based on trends are derived from the average annual growth in R&D intensity for 2000-2011. (2) EU: This projection is based on the R&D intensity target of 3.0 % for 2020. (3) RO: This projection is based on a tentative R&D intensity target of 2.0 % for 2020.
Romania — trend
Romania (3) — target
EU — trend
EU (2) — target
0.0
0.5
1.0
1.5
2.0
2.5
3.0
3.5
Romania — R&D intensity projections, 2000-2020 (1)
2000 2001 2002 2003 2004 2005 2006 2007 2008 2009 2010 2011 2012 2013 2014 2015 2016 2017 2018 2019 2020
Over the last decade, R&D intensity in Romania increased from 0.37 % in 2000 to 0.58 % in 2008, unfortunately only to drop back to 0.48 % in 2011. Romania currently has one of the lowest R&D intensities in the European Union, at a value of less than a quarter of its 2 % target for 2020.
In absolute terms, public R&D funding reached a peak in 2008, following the adoption of the 2007–2013 Strategy for R&D and Innovation. The Strategy has foreseen a gradual increase of the R&D public budget, but the planned increase of the R&D public budget in 2009 did not take place. In absolute terms, government budget appropriations for R&D decreased by 25.4 % in 2009 and by a further 2.6 % in 2010 and then increased by 0.5 % (provisional value) in 2011. Higher education expenditure on R&D suffered a large decrease of 32.2 % in 2009 but increased by 1.4 % in 2010. The Government expressed its intention to increase the public budget by 18.6 % in 2011 and by an additional 12.7 % in 2012 (according to the ERAC Survey, 2012).
In addition, Romania with a value of 0.17 % had one of the lowest business R&D intensities in the EU in 2011 (rank 25 out of 27), with an average annual growth rate of -3.4 % between 2000 and 2011. No Romanian firm is among the top-1000 EU R&D investing firms. The recent trends show that the 2 % R&D intensity target for 2020 is very ambitious and will be difficult to reach, given both the recent low budgetary commitment and the very low level of business R&D activities. This target could be achieved only if the country prioritises R&I in a context of smart fiscal consolidation, whilst implementing without delay key reforms as outlined in the Action Plan for Research and Innovation adopted by the Government in July 2011.
The total number of Romanian participants in the 7th Framework Programme so far is 704 (out of 4888 applicants) ; thereby Romania has received € 96 million. The success rate of participants is 14.4 %, below the EU average success rate of 21.95 %. Romania
3I nnovat ion Un ion progress at countr y level : Romania
receives the 19th largest share in the EU of 7th Framework Programme funding and has most collaborative links with Germany, Italy, the United Kingdom, France and Spain.
Private and public R&D investment also receives support by co– funding from the Structural Funds. Currently, 13.7 % is allocated to research, innovation and entre-preneurship from the total of Structural Funds avail-able to Romania, compared to an overall 25 % at an EU level. A large part of the Structural Funds for R&I
has been focused on programmes for developing R&I infrastructure and human resources which have been developed as complementary to the national R&D programmes. The massive reduction of the R&D budget in 2009, however, hampered this complementarity, whereas the Structural Funds have had an absorp-tion rate of 30 % (rate of approved payments) for the R&I sector, the national R&D budget has been indeed severely cut.
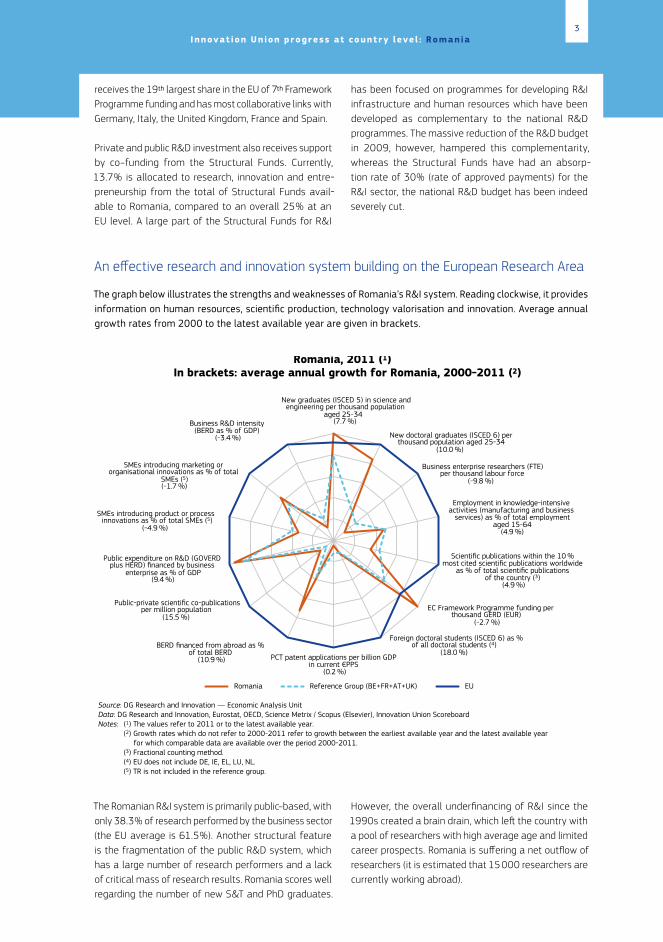
An effective research and innovation system building on the European Research Area
The graph below illustrates the strengths and weaknesses of Romania’s R&I system. Reading clockwise, it provides information on human resources, scientific production, technology valorisation and innovation. Average annual growth rates from 2000 to the latest available year are given in brackets.
New graduates (ISCED 5) in science and engineering per thousand population
aged 25-34 (7.7 %)
New doctoral graduates (ISCED 6) per thousand population aged 25-34
(10.0 %)
Business enterprise researchers (FTE) per thousand labour force
(-9.8 %)
EC Framework Programme funding per thousand GERD (EUR)
(-2.7 %)
Foreign doctoral students (ISCED 6) as % of all doctoral students (4)
(18.0 %)
Public-private scientific co-publications per million population
(15.5 %)
Public expenditure on R&D (GOVERD plus HERD) financed by business
enterprise as % of GDP(9.4 %)
SMEs introducing product or process innovations as % of total SMEs (5)
(-4.9 %)
SMEs introducing marketing or organisational innovations as % of total
SMEs (5)(-1.7 %)
Romania, 2011 (1) In brackets: average annual growth for Romania, 2000-2011 (2)
Romania Reference Group (BE+FR+AT+UK) EU
Source: DG Research and Innovation — Economic Analysis Unit Data: DG Research and Innovation, Eurostat, OECD, Science Metrix / Scopus (Elsevier), Innovation Union ScoreboardNotes: (1) The values refer to 2011 or to the latest available year. (2) Growth rates which do not refer to 2000-2011 refer to growth between the earliest available year and the latest available year for which comparable data are available over the period 2000-2011. (3) Fractional counting method. (4) EU does not include DE, IE, EL, LU, NL. (5) TR is not included in the reference group.
Employment in knowledge-intensive activities (manufacturing and business
services) as % of total employment aged 15-64
(4.9 %)
Scientific publications within the 10 % most cited scientific publications worldwide
as % of total scientific publications of the country (3)
(4.9 %)
PCT patent applications per billion GDP in current €PPS
(0.2 %)
BERD financed from abroad as % of total BERD
(10.9 %)
Business R&D intensity (BERD as % of GDP)
(-3.4 %)
The Romanian R&I system is primarily public– based, with only 38.3 % of research performed by the business sector (the EU average is 61.5 %). Another structural feature is the fragmentation of the public R&D system, which has a large number of research performers and a lack of critical mass of research results. Romania scores well regarding the number of new S&T and PhD graduates.
However, the overall underfinancing of R&I since the 1990s created a brain drain, which left the country with a pool of researchers with high average age and limited career prospects. Romania is suffering a net outflow of researchers (it is estimated that 15 000 researchers are currently working abroad).

4Research and Innovat ion per formance in EU Member States and Assoc iated countr ies
In terms of research excellence, Romanian universities are underperforming in all major international rankings and their scientifi c production and staff composition is less internationalised compared to other Member States. An increase in international scientifi c co– publi-cations and in the share of national scientifi c publications in the top 10 % most cited publications worldwide has nevertheless been noticeable over the last 10 years.
Overall, the number of international co– publications with other European countries is one of the lowest in Europe, suggesting that Romania does not suffi ciently benefi t from the international knowledge fl ows favoured
by the ERA architecture. However, Romanian scien-tifi c and technological cooperation is well distributed across Europe, with France, Germany, Italy, the United Kingdom, and Spain as main co– publication partners and Germany and Ireland as co– patenting partners.
The relative weaknesses of Romanian business sector R&I are striking : low numbers of PCT patent applications and of business enterprise researchers, and a low level of business R&D intensity, on a decreasing trend. The busi-ness sector is not fuelled by collaborative links between public and private sectors (as refl ected by the low number of public– private co– publications).
Romania’s scientifi c and technological strengths
The maps below illustrate six key science and technology areas where Romania has real strengths in a European context. The maps are based on the number of scientifi c publications and patents produced by authors and inventors based in the regions.
Strengths in science and technology at European level
AutomobilesScientifi c production
Source: Compiled by Science-Metrix using data from Scopus (Elsevier)
Number of publications by NUTS2 regions of ERA countriesAutomobiles, 2000-2011
Publications(Fractional Counting)
0.0 - 13.9
13.9 - 39.4
39.4 - 97.1
97.1 - 197.1
197.1 - 321.2
Canary Islands
French Guiana
Azores
Madeira
0 500 1,000 1,500 2,000250Kilometers
Martinique & Guadeloupe
Réunion
Technological production
Information and Communication TechnologiesScientifi c production
Source: Compiled by Science-Metrix using data from Scopus (Elsevier)
Number of publications by NUTS2 regions of ERA countriesInformation and Communication Technologies, 2000-2011
Publications(Fractional Counting)
0.0 - 375.6
375.6 - 1059.2
1059.2 - 2304.5
2304.5 - 4745.1
4745.1 - 13375.5
Canary Islands
French Guiana
Azores
Madeira
0 500 1,000 1,500 2,000250Kilometers
Martinique & Guadeloupe
Réunion
Technological production

5I nnovat ion Un ion progress at countr y level : Romania
New production technologiesScientifi c production
Source: Compiled by Science-Metrix using data from Scopus (Elsevier)
Number of publications by NUTS2 regions of ERA countriesNew Production Technologies, 2000-2011
Publications(Fractional Counting)
0.0 - 96.4
96.4 - 258.8
258.8 - 492.2
492.2 - 962.4
962.4 - 2715.9
Canary Islands
French Guiana
Azores
Madeira
0 500 1,000 1,500 2,000250Kilometers
Martinique & Guadeloupe
Réunion
Technological production
Nanosciences and nanotechnologiesScientifi c production
Source: Compiled by Science-Metrix using data from Scopus (Elsevier)
Number of publications by NUTS2 regions of ERA countriesNanosciences and Nanotechnologies, 2000-2011
Publications(Fractional Counting)
0.0 - 48.3
48.3 - 134.8
134.8 - 267.7
267.7 - 477.0
477.0 - 817.2
Canary Islands
French Guiana
Azores
Madeira
0 500 1,000 1,500 2,000250Kilometers
Martinique & Guadeloupe
Réunion
Technological production
SecurityScientifi c production
Source: Compiled by Science-Metrix using data from Scopus (Elsevier)
Number of publications by NUTS2 regions of ERA countriesSecurity, 2000-2011
Publications(Fractional Counting)
0.0 - 26.3
26.3 - 71.3
71.3 - 148.1
148.1 - 296.8
296.8 - 565.0
Canary Islands
French Guiana
Azores
Madeira
0 500 1,000 1,500 2,000250Kilometers
Martinique & Guadeloupe
Réunion
Technological production
As illustrated by the maps above, in terms of scientifi c and technological capacity, Romania has potential for regional clusters in the fi elds of ICT, nano– sciences and nanotechnologies, automobiles, security and new production technologies.
Romania’s scientifi c specialisation index, citations and impact of scientifi c publications, not visible in the maps
above, reveals that the main scientifi c fi elds are mathe-matics and statistics, physics and astronomy, enabling and strategic technologies, engineering, and informa-tion and computer technologies. Chemistry has had an interesting evolution, being a fi eld with a rather strong specialisation in Romania, but with an overall impact of scientifi c publications that is low compared to the world average. In addition, it is striking that the fi eld
Source : DG Research and Innovation – Economic Analysis UnitData : Science– Metrix using Scopus (Elsevier), 2010 ; European Patent Offi ce, patent applications, 2001–2010
6Research and Innovat ion per formance in EU Member States and Assoc iated countr ies
of agriculture, fisheries and forestry, which has a lot of potential in Romania for economic growth given the existing raw materials, is not supported by a comparable scientific specialisation. The potential that exists in the field of agriculture is additionally confirmed by the fact that the low number of scientific publications are of very good quality, as reflected by their relative impact, which is comparable to the world average.
Patenting activity in Romania is extremely low and does not demonstrate much statistically significant
technological specialisation other than what can be seen in the maps above. In addition, based on data from the mid-2000s, no particular specialised established employment or technology cluster could be identified in Romania. The cluster policy put in place around the European Light Infrastructure project funded from the Structural Funds is expected to lead to the emergence of a specialised cluster in Romania around scientific capa-bilities in the field of physics. Danube– Danube Delta– Black Sea is another large project with cluster potential around it.
Policies and reforms for research and innovation
The country has undertaken a wide range of meas-ures in the R&I field over the last 10 years : the current National R&I Strategy for 2007–2013 was based on a broad consultation (Foresight) exercise ; Romanian scientific journals have been promoted on the interna-tional circuit ; the share of competition– based funding has surpassed the share of institutional funding for research ; measures have been taken to improve science– industry links by grants for projects with industrial part-ners ; innovation vouchers and tax incentives have been introduced. In addition, in August 2011, the Romanian government adopted the Reform Action Plan for R&I in the context of the loan received from the EU. The Action Plan is built around three pillars : governance of the system, management of public research institutes and increase of private sector R&I. Romanian authorities reported on a number of measures related to the Action Plan, either adopted or already implemented. A process of certifica-tion of national R&D institutes is ongoing and the legal framework regarding the funding of these institutes has been amended ; ambitious reform of universities has been conducted, paving the way towards more autonomy and differentiation between research universities and those more oriented towards teaching and local needs.
However, the measures would have a greater impact if supported by a long– term vision. The adopted/planned measures would indeed need to be better related to each other within an overarching reform, in order to improve the overall efficiency of the R&I system. The setting up of an inter– ministerial Council for R&I could be of great help in terms of governance. The creation of this Council was announced in 2002, but it has not really started its activities. It has the potential to steer action both for addressing the lack of coordination of research activi-ties undertaken under the authority of various ministries and for promoting innovation across the economy. It can be expected to raise awareness at the highest political levels on the added value of innovation in various sectors (i.e. innovation in fields such as agriculture, transport, services, etc.), notably if its competencies cover both
R&D and innovation activities and if its articulation with other similar councils is clarified.
The development, together with the main stake-holders, of a common vision for the progress towards a more knowledge– and innovation– based economy would indeed greatly help in increasing synergies and consist-ency between the various policies having an impact on business innovation. For instance, there are two different strategies on SMEs and on business environment, with similar objectives but without clear links between them. In this context, it is somewhat worrying that while a strategy for Competitiveness has been developed it has not yet adopted and it is not clear whether or when it will be.
As a matter of fact, private sector R&I remains underdevel-oped and has been in continuous decline since 2000, and the existing measures to promote private R&I are not fully commensurable with the challenges faced by local inno-vative enterprises, multinationals and start– ups. It might be worth considering whether the system could not benefit from replacing the current interventions of a ‘one size fits all’ type by targeted interventions for innovative enterprises with proven successful track records. In addition, there is an obvious need to address the current mismatch between the skills needed by the knowledge market and the qualifi-cations provided by Academia. Multinationals seem some-what reluctant about setting up R&I facilities in Romania due to the vulnerabilities of the intellectual property rights (IPR) framework, which gives the ownership of an invention/research result to the employees. In this respect, the finali-sation of the national patent law is expected to contribute to an increase in foreign direct investment (FDI) for inno-vative activities, which would ensure an increased level of productivity. A regulation on the ‘employee patent’ is currently under preparation, which may address this issue, while additional fiscal incentives for companies undertaking R&D activities are in place and an innovation voucher was introduced in 2012.

7I nnovat ion Un ion progress at countr y level : Romania
Finally, there is a slow take– off in ‘high– tech’ student start– ups, which would need to be boosted by meas-ures such as financing and mentoring services vouchers. There is a special open operation for innovative start– ups and spin– offs to support the implementation of R&I results. Seed capital is beginning to become avail-able : the Ministry of Economy encourages a network of
business angels (venture connectors) in fields such as ICT. However, high risk business angel investment/venture capital is still at a very low level and could benefit from being more easily matched by funding, for instance from an accelerator/investment fund for medium– high and high– tech ventures.
Economic impact of innovation
The index below is a summary index of the economic impact of innovation composed of five of the Innovation Union Scoreboard’s indicators.1
0.384
0.612
0.321
0.000
0.100
0.200
0.300
0.400
0.500
0.600
0.700
Romania EU Reference Group (BG+PL+RO+HR+TR)
Romania — Index of economic impact of innovation (1)
Source: DG Research and Innovation — Economic Analysis Unit (2013) Data: Innovation Union Scoreboard 2013, EurostatNote: (1) Based on underlying data for 2009, 2010 and 2011.
Romania’s index of economic impact of innovation is lower than the EU average but higher than the level of the reference group of countries with similar economic and research profiles. Even if this value needs to be consid-ered over time and not limited to a single year, it high-lights a real economic stress for transforming knowledge and technology into economic competitiveness. A key strategy is to facilitate the creation of high– growth innovative enterprises, which demands the following three structural challenges : 1) developing an excellent research base focused on sectors where Romania is performing well in terms of international benchmarks and where it has the potential to attract business investment ; 2) nurturing entrepreneurship with the aim of disseminating and fostering research and innovation
in the economy ; and 3) developing appropriate frame-work conditions for innovation based on an overarching strategy supported by stakeholders.
The most problematic factors in relation to doing business have been identified as tax rates, inefficient government bureaucracy, policy instability, access to finance, and corruption. As a result, measures aiming to improve competitiveness and foster structural change in the business sector should encompass a broad set of measures, going beyond purely R&I related policies and dealing with the business environment, improving the infrastructure, enhancing administrative capacity, fighting corruption and fraud, etc.
As in most of Eastern Europe, the public support for the development of an informal venture capital market (both early stage capital and expansion and replacement 1 See methodological notes for the composition of this index.

8Research and Innovat ion per formance in EU Member States and Assoc iated countr ies
phases) is limited. In addition, access to loans for SMEs undertaking R&I activities is practically non– existent, due both to the perception of banks that R&I activities are risky and to the lack of incentives for banks
to grant small loans (the cost of processing a fi le is similar for a small loan taken out by an SME and for a big loan). Patent costs at EPO and other international patent offi ces are unaff ordable for most potential Romanian applicants.
Upgrading the manufacturing sector through research and technologies
The graph below illustrates the upgrading of knowledge in diff erent manufacturing industries. The position on the horizontal axis illustrates the changing weight of each industry sector in value added over the period. The general trend of moving to the lest – hand side refl ects the decrease in manufacturing in the overall economy. The sectors above the x– axis are sectors whose research intensity has increased over time. The size of the bubble represents the share of the sector (in value added) in manufacturing (for all sectors presented in the graph). The red– coloured sectors are high– tech or medium– high– tech sectors.
Source: DG Research and Innovation — Economic Analysis Unit Data: EurostatNotes: (1) High-tech and medium-high-tech sectors are shown in red. 'Other transport equipment' includes high-tech, medium-high-tech
and medium-low-tech.(2) 'Rubber & plastics': 1996-2007; 'Pulp, paper and paper products': 1997-2001; 'Wood and cork (except furniture)': 1997-2002;
'Fabricated metal products': 2002-2008; Office, accounting and computing machinery': 2003-2007; 'Electrical machinery andapparatus', 'Machinery and equipment', 'Medical, precision and optical instruments', 'Motor vehicles', 'Other transportequipment': 2003-2008.
Basic metals
Chemicals & chemical products
Coke, refined petroleum, nuclear fuel
Construction
Electrical machinery & apparatus
Electricity, gas & water
Fabricated metal products
Food products , beverages & tobacco
Machinery & equipment
Medical, precision & optical instruments
Motor vehicles
Office, accounting & computing machinery
Other manufacturing
Other non-metallic mineral products
Other transport equipment
Pulp, paper & paper products
Rubber & plastics
Textiles, wearing apparel & fur, leather products
Wood & cork (except furniture)
-35
-30
-25
-20
-15
-10
-5
0
5
10
15
20
-10 -5 0 5 10 15 20
BERD
inte
nsity
– a
vera
ge a
nnua
l gro
wth
(%),
1996
-200
8 (2
)
Share of value added in total value added – average annual growth (%), 1996-2008 (2)
Romania — Share of value added versus BERD intensity — average annual growth, 1996-2008
Romania’s limited innovation performance is refl ected in its economic structure, which has a prevalence of low- and medium– technology sectors. Demand for knowl-edge is weak and there is an underdeveloped innovation culture. In terms of trade and industry specialisation, Romania is part of the group of lower income countries in the EU (together with Bulgaria, Estonia, Latvia and Lithuania), with lower GDP per person than the EU average
and specialisation in less technologically advanced sectors. Romania is highly specialised in labour– intensive indus-tries (preparation and spinning of textile fi bres, sawmilling, wearing apparel and accessories), in capital– driven industries (cement), and marketing– driven ones (foot-wear). In terms of innovation, Romania is specialised both in low– innovation sectors (wearing apparel, leather) and in medium– high innovation sectors (textiles, basic metals).

9I nnovat ion Un ion progress at countr y level : Romania
In dynamic terms, a certain degree of structural change is shown in the graph above by the increasing added value in technology– driven and innovation sectors (offi ce, accounting and computing machinery and motor vehi-cles, as well as to a lesser extent electrical machinery and apparatus). On the other hand, fi elds with high
knowledge intensity such as medical precision and optical instruments and, to a certain extent, chemical and chemical products have decreasing shares of added value. However, whereas the quality of labour– intensive industries has improved, this is not yet the case for technology– driven ones.
Competitiveness in reaping income of global demand and markets
Investment in knowledge, technology– intensive clusters, innovation and the upgrading of the manufacturing sector are determinants of a country’s competitiveness in global export markets. A positive contribution of high– tech and medium– tech products to the trade balance is an indication of specialisation and competitiveness in these products.
3.75 3.43
1.95 1.35
1.13 0.68
0.32 0.26
0.15 0.15 0.15
0.11 0.09
0.02 0.02 0.01 0.00
0.00 -0.06
-0.10 -0.20 -0.21 -0.24 -0.26
-0.48 -0.97
-2.0 -1.0 0 1.0 2.0 3.0 4.0
Electrical machinery, apparatus & appliancesRoad vehicles
Fabrics (not narrow or special fabrics)Telecommunication, sound-recording & reproducing equipment
General industrial machinery & equipment; machine partsProfessional, scientific & controlling instruments & apparatus
Machinery specialised for particular industriesEssential oils & resinoids; perfume materials
Iron & steelArticles of rubber
Office machines & automatic data-processing machinesPigments, paints, varnishes & related materials
Textile fibres & their wastesPhotographic equipment & supplies; optical goods, watches and clocks
Sanitary, plumbing, heating fixtures & fittingsPlastics in non-primary forms
Arms & ammunitionRadioactive & associated materials
Chemical materials & productsOrganic chemicals
FertilisersOther transport equipment
Metalworking machineryMedicinal & pharmaceutical products
Plastics in primary formsPower-generating machinery & equipment
Source: DG Research and Innovation — Economic Analysis UnitData: COMTRADENotes: The data for "Arms & ammunition" refers to the period 2006-2011.‘Textile fibres & their wastes’ refers only to the following 3-digit subdivisions: 266 and 267.‘Organic chemicals’ refers only to the following 3-digit subdivisions: 512 and 513.‘Essential oils & resinoids; perfume materials’ refers only to the following 3-digit subdivisions: 553 and 554. ‘Chemical materials & products’ refers only to the following 3-digit subdivisions: 591, 593, 597 and 598. ‘Iron & steel’ refers only to the following 3-digit subdivisions: 671, 672 and 679.‘Metalworking machinery’ refers only to the following 3-digit subdivisions: 731, 733 and 737.
Evolution of the contribution of high-tech and medium-tech products to the trade balance for Romania between 2000 and 2011
Change in the contribution to trade balance (in % points)
The trade balance in all high– tech (HT) and medium– tech (MT) products combined was negative in Romania up to 2008 and became positive in 2009 and 2010. This contrasts with the total trade balance, where the positive trend up to 2008 was followed by relative stagnation in 2009 and 2010. The data, therefore, indi-cate both a progressive and encouraging shift towards HT and MT in the trade balance of Romania over the last few years, and the fact this shift was instrumental to coun-terbalance the weaknesses in the rest of the economy.
More precisely, the graph above points to the high– tech and medium– tech industries that have improved their contributions to the Romanian trade balance, in particular road vehicles, electrical machinery, and textiles, and to a certain extent for telecommunication, general indus-trial machinery and machinery specialised for particular industries. In contrast, industries such as power– generating machinery and equipment, plastics, medic-inal and pharmaceutical products, fertilisers and metal working machinery are making decreasing contributions to the trade balance, indicating a possible loss in relative world competitiveness.

10Research and Innovat ion per formance in EU Member States and Assoc iated countr ies
Over the last 15 years, the Romanian economy has gained in world competitiveness ; however, structural change is taking place at a very slow pace. Over the last decade, Romania has had the highest growth of total factor productivity in the EU. Taking 2000 as a refer-ence year, total factor productivity increased by 50 % in 2008 and by 35 % in 2012. The relative decrease
between 2008 and 2012 can be reasonably attributed to the economic and financial crisis. Romania has made good progress on greenhouse emissions, which have fallen, and has also succeeded in increasing the share of renewable energy in gross final energy consump-tion. The employment rate fell from 69.1 in 2000 to 62.8 in 2011.

11I nnovat ion Un ion progress at countr y level : Romania
Key indicators
Source : DG Research and Innovation — Economic Analysis UnitData : Eurostat, DG JRC — ISPRA, DG ECFIN, OECD, Science Metrix / Scopus (Elsevier), Innovation Union ScoreboardNotes : (1) Average annual growth refers to growth between the earliest available year and the latest available year for which compatible data are available over the period 2000-2012.(2) EU average for the latest available year.(3) Venture Capital includes early stage, expansion and replacement for the period 2000-2006 and includes seed, start– up, later stage, growth, replacement and buyout for the period
2007-2011.(4) Venture Capital : EU does not include EE, CY, LV, LT, MT, SI, SK. These Member States were not included in the EU ranking.(5) EU is the weighted average of the values for the Member States.(6) The value is the diff erence between 2012 and 2000.(7) Break in series between 2002 and the previous years. Average annual growth refers to 2002-2011.(8) The value is the diff erence between 2010 and 2000. A negative value means lower emissions.(9) The values for this indicator were ranked from lowest to highest.(10) Values in italics are estimated or provisional.
ROMANIA 2000 2001 2002 2003 2004 2005 2006 2007 2008 2009 2010 2011 2012
Averageannualgrowth (1) (%)
EUaverage
(2)
Rankwithin
EU
ENABLERS
Investment in knowledgeNew doctoral graduates (ISCED 6) per thousand population aged 25-34 : : : 0.72 0.76 1.11 0.92 0.86 0.95 1.35 1.40 : : 10.0 1.69 15
Business enterprise expenditure on R&D (BERD) as % of GDP 0.25 0.24 0.23 0.22 0.21 0.20 0.22 0.22 0.17 0.19 0.18 0.17 : -3.4 1.26 25
Public expenditure on R&D (GOVERD + HERD) as % of GDP 0.11 0.15 0.15 0.16 0.17 0.20 0.23 0.30 0.40 0.28 0.28 0.31 : 9.6 0.74 25
Venture capital (3) as % of GDP 0.04 0.05 0.03 0.11 0.00 0.02 0.07 0.13 0.09 0.07 0.06 0.04 : -1.8 0.35 (4) 17 (4)
S&T excellence and cooperationComposite indicator of research excellence : : : : : 12.2 : : : : 17.8 : : 7.8 47.9 23
Scientifi c publications within the 10 % most cited scientifi c publications worldwide as % of total scientifi c publications of the country
2.6 2.5 3.0 3.1 4.2 3.9 3.9 4.2 3.8 : : : : 4.9 10.9 24
International scientifi c co– publications per million population 44 39 45 66 76 84 89 111 122 133 144 148 : 11.7 300 27
Public– private scientifi c co– publications per million population : : : : : : : 5 5 6 8 8 : 15.5 53 24
FIRM ACTIVITIES AND IMPACT
Innovation contributing to international competitiveness
PCT patent applications per billion GDP in current €PPS 0.2 0.2 0.2 0.2 0.2 0.2 0.2 0.2 0.2 0.2 : : : 0.2 3.9 27
Licence and patent revenues from abroad as % of GDP : : : : 0.01 0.05 0.03 0.02 0.12 0.12 0.28 0.13 : 41.4 0.58 16
Sales of new– to– market and new– to– fi rm innovations as % of turnover : : : : 16.6 : 18.5 : 14.9 : 14.3 : : -2.5 14.4 12
Knowledge– intensive service exports as % total service exports : : : : 22.3 41.0 44.9 43.8 42.0 44.9 43.0 : : 11.6 45.1 7
Contribution of high– tech and medium– tech products to the trade balance as % of total exports plus imports of products -10.69 -9.21 -9.61 -9.30 -8.45 -7.26 -6.00 -4.42 -2.33 0.60 0.25 0.38 : - 4.20 (5) 19
Growth of total factor productivity (total economy) – 2000 = 100 100 105 116 120 130 134 140 144 148 137 133 134 132 32 (6) 103 2
Factors for structural change and addressing societal challengesComposite indicator of structural change 16.0 : : : : 19.0 : : : : 28.3 : : 5.9 48.7 27
Employment in knowledge– intensive activities (manufacturing and business services) as % of total employment aged 15-64 : : : : : : : : 5.6 5.8 6.0 6.5 : 4.9 13.6 27
SMEs introducing product or process innovations as % of SMEs : : : : 17.8 : 19.4 : 18.0 : 13.2 : : -4.9 38.4 27
Environment– related technologies – patent applications to the EPO per billion GDP in current €PPS 0.00 0.00 0.01 0.01 0.01 0.02 0.01 0.01 0.01 : : : : -1.2 0.39 24
Health– related technologies – patent applications to the EPO per billion GDP in current €PPS 0.01 0.02 0.00 0.01 0.03 0.03 0.02 0.01 0.01 : : : : -4.2 0.52 25
Europe 2020 OBJECTIVES FOR GROWTH, JOBS AND SOCIETAL CHALLENGES
Employment rate of the population aged 20-64 (%) 69.1 68.3 63.3 (7) 63.7 63.5 63.6 64.8 64.4 64.4 63.5 63.3 62.8 : -0.1 68.6 22
R&D intensity (GERD as % of GDP) 0.37 0.39 0.38 0.39 0.39 0.41 0.45 0.52 0.58 0.47 0.46 0.48 : 2.5 2.03 26
Greenhouse gas emissions – 1990 = 100 55 56 58 60 59 59 60 59 58 49 48 : : -7 (8) 85 3 (9)
Share of renewable energy in gross fi nal energy consumption (%) : : : : 16.8 17.6 17.1 18.3 20.3 22.4 23.4 : : 5.7 12.5 7
Share of population aged 30-34 who have successfully completed tertiary education (%) 8.9 8.8 9.1 8.9 10.3 11.4 12.4 13.9 16.0 16.8 18.1 20.4 : 7.8 34.6 26
Share of population at risk of poverty or social exclusion (%) : : : : : : : 45.9 44.2 43.1 41.4 40.3 : -3.2 24.2 26 (9)

România Provocări legate de îmbunătățirea modului de coordonare a politicii de C&I și de modernizare a
economiei Rezumat: Performanța în cercetare, inovare și competitivitate Indicatorii din tabelul de mai jos prezintă o sinteză a cercetării, inovării și competitivității în România. Ei pun în relație investiția în cunoaștere și aportul în vederea performanței sau rezultatele economice obținute, pe tot parcursul ciclului inovării. Acești indicatori evidențiază elementele tematice forte în cadrul tehnologiilor cheie, precum și contribuția tehnologiilor de nivel înalt (HT) și mediu (MT) la balanța comercială. Tabelul cuprinde un nou indice privind excelența în știință și tehnologie care ia în considerare calitatea producției științifice, precum și dezvoltarea tehnologică. Indicatorul de intensitate a cunoașterii din economie este un indice privind schimbarea structurală, care se axează pe compoziția și pe specializarea sectorială a economiei și arată evoluția ponderii sectoarelor, produselor și serviciilor bazate pe cunoaștere.
Investment and Input Performance/economic output Research R&D intensity
2011: 0.48% (EU: 2.03%; US: 2.75%) 2000-2011: +2.53% (EU: +0.8%; US: +0.2%)
Excellence in S&T 2010: 17.84 (EU:47.86; US: 56.68) 2005-2010: +7.81% (EU: +3.09%;US: +0.53)
Innovation and Structural change
Index of economic impact of innovation 2010-2011: 0.384 (EU: 0.612)
Knowledge-intensity of the economy 2010:28.35 (EU:48.75; US: 56.25) 2000-2010: +5.86% (EU: +0.93%; US: +0.5%)
Competitiveness Hot-spots in key technologies Automobiles, ICT, New production technologies, Nanotechnologies, and Security
HT + MT contribution to the trade balance 2011: 0.38% (EU: 4.2%; US: 1.93%) 2000-2011: n.a. (EU: +4.99%; US:-10.75%)
Reforma sistemului românesc de C&I este în desfășurare începând de acum zece ani. Există o Strategie națională pentru cercetare și inovare în perioada 2007-2013. Cu toate acestea, criza economică a împiedicat realizarea completă a acesteia din cauza reducerilor ale bugetului de stat pentru C&D. Trebuie menționat că autoritățile române au hotărât să sprijine proiecte de amploare precum „Extreme Light Infrastructure” (ELI) pentru a folosi la maximum investițiile reduse în C&D. În același timp, unele reviste științifice românești au căpătat o vizibilitate internațională tot mai mare, iar publicațiile științifice românești s-au îmbunătățit, în general, sub aspectul calității. Sunt în curs reforme instituționale ale universităților și institutelor de cercetare.
Pentru România, provocarea cheie o constituie nivelul scăzut al competitivității, o provocare cu consecințe semnificative pentru sistemul de C&I. Economia României se caracterizează prin prevalența sectoarelor bazate pe tehnologii de nivel mediu și inferior, cu o cerere de cunoaștere scăzută și o cultură a inovării subdezvoltată. România se clasează modest la capitolul inovare și are cea mai scăzută intensitate a C&D din UE, precum și un nivel foarte scăzut al activității de C&D în întreprinderi. Pentru a completa tabloul slabei inovări, Raportul privind competitivitatea globală în 2011 clasifică țara ca fiind axată pe eficiență (alături de Bulgaria), în timp ce toate celelalte economii din UE sunt fie în tranziție către, fie se află deja în etapa axării pe inovare.
În ultimii zece ani, factorii de decizie au făcut eforturi mari pentru a reforma sistemul C&I din România. Cu toate acestea, măsurile adoptate ar avea de câștigat dacă ar fi susținute de o strategie pe termen lung și sunt încă stânjenite de faptul că, în dezbaterea politică, conștientizarea valorii adăugate a C&I pentru creșterea competitivității și asigurarea de locuri de muncă de înaltă calitate nu ocupă încă un loc central. În plus, lipsa de continuitate, de la o guvernare la alta, a deciziilor privind politica în domeniu și lipsa coordonării între ministerele care au în portofoliu activități de C&I generează o evoluție de tipul „oprit – pornit”, care este cu deosebire nocivă într-un domeniu care necesită dezvoltarea de capacități în timp. Pentru a putea influența ponderea C&I în mixul general de politici naționale, s-ar justifica într-adevăr ca măsurile referitoare la politicile de C&I să fie avute în vedere în contextul mai amplu al dezvoltării economice a țării și să fie mai bine integrate în obiectivele generale

2
de politică la nivel național.. De exemplu, îmbunătățirea funcționării generale a instituțiilor ar duce la o mai bună coordonare a politicilor de C&I între diversele ministere, iar o mai mare axare pe competitivitate la nivel politic ar atrage atenția factorilor de decizie asupra valorii adăugate a C&I pentru creșterea și pentru crearea de locuri de muncă.
Investiția în cunoaștere
Source: DG Research and Innovation - Economic Analysis Unit Data: DG Research and Innovation, Eurostat, Member StateNotes: (1) The R&D intensity projections based on trends are derived from the average annual growth in R&D intensity for 2000-2011. (2) EU: This projection is based on the R&D intensity target of 3.0% for 2020. (3) RO: This projection is based on a tentative R&D intensity target of 2.0% for 2020.
Romania - trend
Romania (3) - target
EU - trend
EU (2) - target
0.0
0.5
1.0
1.5
2.0
2.5
3.0
3.5
2000 2001 2002 2003 2004 2005 2006 2007 2008 2009 2010 2011 2012 2013 2014 2015 2016 2017 2018 2019 2020
R&D
inten
sity (
%)
Romania - R&D intensity projections, 2000-2020 (1)
În ultimul deceniu, intensitatea C&D din România a crescut de la 0,37 % în 2000 la 0,58 % în 2008, pentru ca, din păcate, să scadă din nou până la 0,48 % în 2011. În prezent România are unul dintre cele mai scăzute niveluri de intensitate a C&D din Uniunea Europeană, la o valoare mai mică de un sfert din ținta sa de 2 % pentru anul 2020.
În termeni absoluți, finanțarea publică a C&D a atins un vârf în 2008, după adoptarea Strategiei de cercetare-dezvoltare și inovare pentru perioada 2007-2013. Strategia a prevăzut o creștere treptată a bugetului public pentru C&D, dar creșterea planificată a bugetului pentru C&D nu s-a produs în 2009. În termeni absoluți, creditele acordate din bugetul de stat pentru C&D au scăzut cu 25,4 % în 2009 și cu încă 2,6 % în 2010, iar apoi au crescut cu 0,5 % (valoare provizorie) în 2011. Cheltuielile pentru C&D din învățământul superior au suferit o scădere mare, de 32,2 %, în 2009, dar au crescut cu 1,4 % în 2010. Guvernul și-a exprimat intenția de a crește bugetul public cu 18,6 % în 2011 și cu încă 12,7 % în 2012 (conform Studiului ERAC, 2012).
În plus, România a avut unul dintre cele mai scăzute niveluri de intensitate a activității C&D în întreprinderi din UE, cu o valoare de 0,17 % în 2011 (locul 25 din 27) și cu un ritm de creștere mediu anual de -3,4 % în perioada 2000-2011. Nicio companie românească nu figurează în topul celor 1000 de firme din UE care investesc în C&D. Tendințele recente arată că ținta de 2 % privind intensitatea C&D pentru 2020 este foarte ambițioasă și va fi greu de atins, având în vedere atât recentele angajamente bugetare scăzute, cât și nivelul foarte scăzut al activităților de C&D din întreprinderi. Această țintă ar putea fi atinsă numai în condițiile în care țara ar transforma C&I într-o prioritate, într-un context de consolidare fiscală inteligentă, punând totodată în aplicare, fără întârziere, reformele cheie prezentate în Planul de acțiune pentru cercetare și inovare adoptat de guvern în iulie 2011.
Numărul total de participanți români la cel de-al 7-lea program cadru este până acum de 704 (din 4 888 de solicitanți); în consecință România a primit 96 milioane euro. Procentul de succes al participării este de 14,4 %, sub procentul mediu de succes din UE care este de 21,95 %. România se află pe locul 19 în privința dimensiunii finanțării prin cel de-al 7-lea program cadru al UE și are majoritatea legăturilor de colaborare cu Germania, Italia, Marea Britanie și Spania.
3
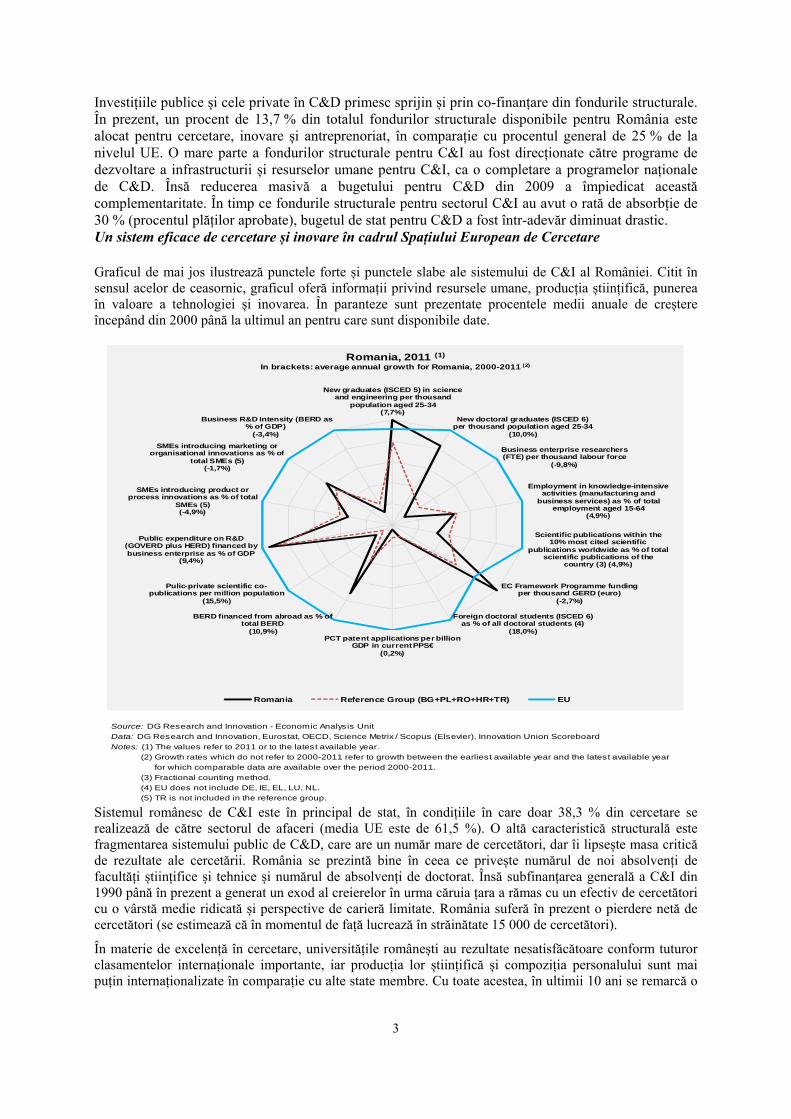
Investițiile publice și cele private în C&D primesc sprijin și prin co-finanțare din fondurile structurale. În prezent, un procent de 13,7 % din totalul fondurilor structurale disponibile pentru România este alocat pentru cercetare, inovare și antreprenoriat, în comparație cu procentul general de 25 % de la nivelul UE. O mare parte a fondurilor structurale pentru C&I au fost direcționate către programe de dezvoltare a infrastructurii și resurselor umane pentru C&I, ca o completare a programelor naționale de C&D. Însă reducerea masivă a bugetului pentru C&D din 2009 a împiedicat această complementaritate. În timp ce fondurile structurale pentru sectorul C&I au avut o rată de absorbție de 30 % (procentul plăților aprobate), bugetul de stat pentru C&D a fost într-adevăr diminuat drastic. Un sistem eficace de cercetare și inovare în cadrul Spațiului European de Cercetare
Graficul de mai jos ilustrează punctele forte și punctele slabe ale sistemului de C&I al României. Citit în sensul acelor de ceasornic, graficul oferă informații privind resursele umane, producția științifică, punerea în valoare a tehnologiei și inovarea. În paranteze sunt prezentate procentele medii anuale de creștere începând din 2000 până la ultimul an pentru care sunt disponibile date.
Source: DG Research and Innovation - Economic Analysis Unit Data: DG Research and Innovation, Eurostat, OECD, Science Metrix / Scopus (Elsevier), Innovation Union ScoreboardNotes: (1) The values refer to 2011 or to the latest available year. (2) Growth rates which do not refer to 2000-2011 refer to growth between the earliest available year and the latest available year for which comparable data are available over the period 2000-2011. (3) Fractional counting method. (4) EU does not include DE, IE, EL, LU, NL. (5) TR is not included in the reference group.
New graduates (ISCED 5) in scienceand engineering per thousand
population aged 25-34(7,7%)
New doctoral graduates (ISCED 6)per thousand population aged 25-34
(10,0%)
Business enterprise researchers(FTE) per thousand labour force
(-9,8%)
Employment in knowledge-intensiveactivities (manufacturing and
business services) as % of totalemployment aged 15-64
(4,9%)
Scientific publications within the10% most cited scientific
publications worldwide as % of totalscientific publications of the
country (3) (4,9%)
EC Framework Programme fundingper thousand GERD (euro)
(-2,7%)
Foreign doctoral students (ISCED 6)as % of all doctoral students (4)
(18,0%)PCT patent applications per billion
GDP in current PPS€(0,2%)
BERD financed from abroad as % oftotal BERD
(10,9%)
Pulic-private scientific co-publications per million population
(15,5%)
Public expenditure on R&D(GOVERD plus HERD) financed bybusiness enterprise as % of GDP
(9,4%)
SMEs introducing product orprocess innovations as % of total
SMEs (5)(-4,9%)
SMEs introducing marketing ororganisational innovations as % of
total SMEs (5)(-1,7%)
Business R&D Intensity (BERD as% of GDP)
(-3,4%)
Romania, 2011 (1)
In brackets: average annual growth for Romania, 2000-2011 (2)
Romania Reference Group (BG+PL+RO+HR+TR) EU
Sistemul românesc de C&I este în principal de stat, în condițiile în care doar 38,3 % din cercetare se realizează de către sectorul de afaceri (media UE este de 61,5 %). O altă caracteristică structurală este fragmentarea sistemului public de C&D, care are un număr mare de cercetători, dar îi lipsește masa critică de rezultate ale cercetării. România se prezintă bine în ceea ce privește numărul de noi absolvenți de facultăți științifice și tehnice și numărul de absolvenți de doctorat. Însă subfinanțarea generală a C&I din 1990 până în prezent a generat un exod al creierelor în urma căruia țara a rămas cu un efectiv de cercetători cu o vârstă medie ridicată și perspective de carieră limitate. România suferă în prezent o pierdere netă de cercetători (se estimează că în momentul de față lucrează în străinătate 15 000 de cercetători).
În materie de excelență în cercetare, universitățile românești au rezultate nesatisfăcătoare conform tuturor clasamentelor internaționale importante, iar producția lor științifică și compoziția personalului sunt mai puțin internaționalizate în comparație cu alte state membre. Cu toate acestea, în ultimii 10 ani se remarcă o

4
creștere a numărului de coautori români în publicațiile științifice internaționale și o proporție mai mare de publicații științifice naționale în topul celor 10 % cele mai citate publicații la nivel mondial.
Per total, numărul de coautori români în publicațiile din alte țări europene este unul dintre cele mai scăzute din Europa, ceea ce sugerează faptul că România nu beneficiază suficient de pe urma fluxurilor internaționale de cunoștințe favorizate de structura SEC. Cu toate acestea, cooperarea științifică și tehnologică românească este bine distribuită în Europa, principalii parteneri ai coautorilor români de publicații fiind din Franța, Germania, Italia, Marea Britanie și Spania, iar principalii coautori de brevete fiind din Germania și Irlanda.
Deficiențele relative ale C&I din sectorul românesc al întreprinderilor sunt izbitoare: un număr foarte mic de cereri de brevete în cadrul Tratatului de cooperare în domeniul brevetelor și un număr foarte mic de cercetători în întreprinderi, precum și un nivel foarte scăzut al intensității C&D în întreprinderi, cu tendințe de scădere. Sectorul de afaceri nu este alimentat de legături de colaborare între sectorul de stat și cel privat (fapt care se reflectă în numărul scăzut de coautori de publicații cu caracter public-privat).
Punctele forte ale României în domeniul științei și tehnologiei Hărțile de mai jos ilustrează șase domenii științifice și tehnologice cheie în care România are puncte forte reale în context european. Hărțile se bazează pe numărul de publicații științifice și brevete produse de autori și inventatori din diferite regiuni. Puncte forte în știință și tehnologie la nivel european
Producția științifică Automobile Producția tehnologică
Producția științifică Tehnologia informației și comunicațiilor Producția tehnologică
Producția științifică Noi tehnologii de producție Producția tehnologică

5
Sursa: DG Cercetare și Inovare – Unitatea de analiză economică Date: Science Metrix cu ajutorul Scopus (Elsevier), 2010; Oficiul European de Brevete, solicitări de brevete, 2001-2010
Producția științifică Nano-științe și nano-tehnologii Producția tehnologică
Producția științifică Securitate Producția tehnologică
După cum ilustrează hărțile de mai sus, în materie de capacitate științifică și tehnologică România are potențial pentru clustere regionale în domeniul TIC, al nanoștiințelor și nanotehnologiilor, al automobilelor, al securității și al noilor tehnologii de producție. Indicele de specializare științifică a României, citările și impactul publicațiilor ei științifice, care nu sunt prezentate în hărțile de mai sus, arată că principalele domenii științifice sunt matematica și statistica, fizica și astronomia, tehnologiile generice și strategice, ingineria și tehnologiile informației și calculatoarelor. Chimia prezintă o evoluție interesantă, fiind o specializare destul de puternică în România, dar cu un impact general al publicațiilor științifice scăzut față de nivelul mediu mondial. În

6
plus, este izbitor faptul că domeniul agriculturii, pescuitului și silviculturii, care are mult potențial de dezvoltare economică în România, având în vedere materiile prime existente, nu este susținut printr-o specializare științifică pe măsură. Potențialul care există în domeniul agriculturii este confirmat o dată în plus de faptul că numărul mic de publicații științifice de profil sunt de foarte bună calitate, ceea ce se reflectă în impactul lor relativ, comparabil cu media mondială. Activitatea de brevetare este extrem de scăzută în România și nu demonstrează o specializare tehnologică foarte semnificativă din punct de vedere statistic, pe lângă ceea ce se poate vedea pe hărțile de mai sus. În plus, pe baza datelor de la mijlocul anilor 2000, nu s-a putut identifica în România nici un cluster stabil specializat în crearea de locuri de muncă sau în tehnologie. Se speră ca politica de creare a unui cluster în legătură cu proiectul „Extreme Light Infrastructure”„, finanțat din fonduri structurale, să conducă la apariția în România a unui cluster specializat având în centru capacitățile științifice din domeniul fizicii. Proiectul Dunăre - Delta Dunării – Marea Neagră este un alt mare proiect care prezintă potențial de formare a unor clustere.
Politici și reforme pentru cercetare și inovare
În ultimii 10 ani, România a întreprins o gamă largă de măsuri în domeniul cercetării și inovării: actuala Strategie națională de cercetare și inovare pentru perioada 2007-2013 a avut la bază o amplă acțiune de consultare (previzională); revistele științifice românești au fost promovate în circuitul internațional; proporția finanțărilor acordate pe bază de concurs a depășit proporția finanțărilor instituționale destinate cercetării; s-au luat măsuri de îmbunătățire a legăturilor dintre știință și industrie prin acordarea de fonduri nerambursabile pentru proiecte cu parteneri industriali; au fost introduse vouchere și stimulente fiscale pentru cercetare. În plus, Guvernul României a adoptat în august 2011 Planul de acțiune pentru reforma în cercetare și inovare, în contextul împrumutului primit de la UE. Planul de acțiune este construit pe trei piloni: guvernanța sistemului, managementul institutelor publice de cercetare și creșterea ponderii activității de cercetare și inovare din sectorul privat. Autoritățile române au prezentat rapoarte privind o serie de măsuri, adoptate sau deja aplicate, legate de Planul de acțiune. Este în curs de desfășurare un proces de certificare a institutelor naționale de cercetare-dezvoltare, iar cadrul legal privind finanțarea acestor institute a fost modificat; se realizează o reformă ambițioasă a universităților, cu scopul de a netezi calea către mai multă autonomie și diferențiere între universitățile de cercetare și cele orientate mai mult către activitatea didactică și nevoile locale.
Cu toate acestea, măsurile ar avea un impact mai mare dacă ar fi susținute de o viziune pe termen lung. Măsurile adoptate/planificate ar trebui într-adevăr să fie mai bine corelate în cadrul unei reforme atotcuprinzătoare, pentru a îmbunătăți eficiența generală a sistemului de cercetare și inovare. Înființarea unui Consiliu interministerial pentru cercetare și inovare ar fi de mare ajutor în materie de guvernanță. Crearea acestui Consiliu a fost anunțată în 2002, dar el nu și-a început încă activitatea în mod real. Consiliul are potențialul să dirijeze măsurile atât pentru a rezolva lipsa de coordonare a activităților de cercetare întreprinse sub autoritatea diverselor ministere, cât și pentru a promova inovarea în întreaga economie. Se poate aștepta ca acest Consiliu să crească conștientizarea la nivelurile politice cele mai înalte în ceea ce privește valoarea adăugată pe care o are inovarea în diverse sectoare (respectiv inovarea în domenii precum agricultura, transportul, serviciile), în special dacă activitatea sa va include atât activitățile de cercetare-dezvoltare, cât și cele de inovare și dacă se vor clarifica competențele sale în comparație cu alte consilii similare.
Elaborarea unei viziuni comune, împreună cu principalele părți interesate, care să vizeze evoluția către o economie bazată în mai mare măsură pe cunoaștere și inovare ar ajuta mult, într-adevăr, la creșterea sinergiilor și a consecvenței diverselor politici cu impact asupra inovării în sectorul economic. De exemplu, există două strategii diferite pentru IMM-uri și pentru mediul de afaceri, cu obiective similare, dar fără legături clare între ele. În acest context, este oarecum îngrijorător că, deși a fost elaborată o strategie pentru competitivitate, aceasta nu este încă adoptată și nu este clar dacă sau când se va întâmpla acest lucru.

7
În fapt, cercetarea și inovarea din sectorul privat rămân la un nivel subdezvoltat și se află în declin continuu începând din anul 2000, iar măsurile existente de promovare a C&I nu sunt în întregime pe măsura provocărilor cu care se confruntă întreprinderile, multinaționalele și noile întreprinderi inovatoare locale. Ar merita poate să se analizeze dacă sistemul nu ar putea beneficia de pe urma înlocuirii actualelor intervenții de tipul „măsură unică” cu intervenții orientate pentru întreprinderile inovatoare care și-au dovedit deja succesul în această direcție. În plus, există o nevoie evidentă de rezolvare a actualei nepotriviri dintre calificările necesitate de piața cunoașterii și calificările oferite de învățământul superior din România. Multinaționalele par oarecum reticente în a crea facilități de C&I în România, din cauza vulnerabilităților pe care le prezintă cadrul referitor la drepturile de proprietate intelectuală (DPI), care atribuie angajaților proprietatea asupra unei invenții/rezultat de cercetare. În acest sens, se speră ca finalizarea legii naționale a brevetelor să contribuie la creșterea investițiilor străine directe (ISD) în activități inovatoare, care să asigure un nivel sporit al productivității. În momentul de față este în curs de pregătire un regulament privind „brevetul angajatului”, care ar putea să rezolve această problemă. Există stimulente fiscale suplimentare pentru companiile care întreprind activități de cercetare-dezvoltare, iar în 2012 s-a introdus un voucher pentru inovare.
În sfârșit, înființarea de către studenți a unor firme noi, „de înaltă tehnologie”, demarează lent și ar trebui să fie impulsionată de măsuri precum vouchere pentru finanțare și pentru servicii de îndrumare. Există o operațiune specială deschisă pentru firme noi și pentru cele rezultate din divizare care are rolul de a sprijini punerea în aplicare a rezultatelor C&I. Începe să devină disponibil capitalul inițial: Ministerul Economiei încurajează o rețea de investitori providențiali (conectori de capital de risc) în domenii precum TIC. Cu toate acestea, investițiile/capitalul de mare risc provenit de la investitori providențiali este încă la un nivel foarte scăzut și ar putea beneficia de pe urma cuplării sale cu finanțări provenite, de exemplu, dintr-un fond accelerator/de investiții pentru întreprinderi din zona tehnologiilor medii și înalte
Impactul economic al inovării Indicele de mai jos este un indice rezumat al impactului economic al inovării, compus din cinci indicatori din tabloul de bord al Uniunii cercetării și inovării1.
Source: DG Research and Innovation - Economic Analysis Unit (2013) Data: Innovation Union Scoreboard 2013, EurostatNote: (1) Based on underlying data for 2009, 2010 and 2011.
0.384
0.612
0.321
0.000
0.100
0.200
0.300
0.400
0.500
0.600
0.700
Romania EU Reference Group(BG+PL+RO+HR+TR)
Romania - Index of economic impact of innovation (1)
1 Vezi nota metodologică pentru compoziția acestui indice.

8
În cazul României, indicele impactului economic al inovării este mai scăzut decât cel mediu din UE, dar mai ridicat decât nivelul grupului de referință al țărilor cu profil economic și de cercetare asemănător. Chiar dacă această valoare trebuie analizată în evoluția ei în timp și nu limitată la un singur an, ea pune în evidență o preocupare economică reală pentru transformarea cunoașterii și tehnologiei în competitivitate economică. Facilitarea creării de întreprinderi inovatoare cu înaltă dezvoltare reprezintă o strategie majoră, care reclamă următoarele trei modificări structurale: 1) dezvoltarea unei baze de cercetare excelente, axate pe acele sectoare in care România are o bună performanță în comparație cu reperele internaționale și în care există potențial de atragere a unor investiții în activități economice; 2) stimularea antreprenoriatului cu scopul diseminării și încurajării cercetării și inovării în economie; și 3) punerea la punct a unor condiții cadru corespunzătoare pentru inovare, bazate pe o strategie cuprinzătoare, sprijinită de părțile interesate. Factorii cei mai problematici în ceea ce privește activitatea întreprinderilor au fost identificați ca fiind ratele de impozitare, birocrația de stat ineficientă, instabilitatea politicilor, accesul la finanțare și corupția. Ca rezultat, măsurile menite să îmbunătățească competitivitatea și să încurajeze modificarea structurală a sectorului de afaceri ar trebui să cuprindă un set amplu de măsuri, care să treacă dincolo de politicile legate strict de C&I și să se ocupe de mediul de afaceri, de îmbunătățirea infrastructurii, de creșterea capacității administrative, de combaterea corupției și a fraudei, etc. La fel ca în majoritatea țărilor din Europa de est, sprijinul public pentru dezvoltarea unei piețe informale de capital de risc (atât capital pentru faza inițială, cât și pentru fazele de extindere și înlocuire) este limitat. În plus, accesul la credite al IMM-urilor care se angajează în activități de C&I este practic inexistent, atât din cauza băncilor care percep activitățile de C&I ca fiind riscante, cât și datorită lipsei de stimulente pentru ca băncile să acorde împrumuturi mici (costul prelucrării unui dosar este același, indiferent dacă este vorba de un credit mic, pentru un IMM, sau de unul mare). Costurile aferente înregistrării brevetelor la OEB și la alte birouri internaționale de brevete este prohibitiv pentru majoritatea solicitanților români potențiali.

9
Modernizarea sectorului industriilor prelucrătoare prin cercetare și tehnologii Graficul de mai jos ilustrează creșterea nivelului cunoașterii în diverse industrii prelucrătoare. Poziția pe axa orizontală ilustrează schimbarea ponderii fiecărui sector industrial pe perioada respectivă în ceea ce privește valoarea adăugată. Tendința generală de deplasare către stânga reflectă scăderea ponderii industriei prelucrătoare în totalul economiei. Sectoarele de deasupra axei x sunt cele a căror intensitate a cercetării a crescut în timp. Dimensiunea cercului reprezintă ponderea sectorului (în valoare adăugată) în industriile prelucrătoare (pentru toate sectoarele reprezentate în grafic). Sectoarele colorate în roșu sunt sectoarele cu tehnologie înaltă sau medie.
Source: DG Research and Innovation - Economic Analysis unit Data: EurostatNotes: (1) High-Tech and Medium-High-Tech sectors are shown in red. 'Other transport equipment' includes High-Tech, Medium-High-Tech and Medium-Low-Tech. (2) 'Rubber & plastics': 1996-2007; 'Pulp, paper and paper products': 1997-2001; 'Wood and cork (except furniture)': 1997-2002; 'Fabricated metal products': 2002-2008; Office, accounting and computing machinery': 2003-2007; 'Electrical machinery and apparatus', 'Machinery and equipment', 'Medical, precision and optical instruments', 'Motor vehicles', 'Other transport equipment': 2003-2008.
Basic metals
Chemicals & chemical products
Coke, refined petroleum, nuclear fuel
Construction
Electrical machinery & apparatus
Electricity, gas & water
Fabricated metal products
Food products , beverages & tobacco
Machinery & equipment
Medical, precision & optical instruments
Motor vehicles
Office, accounting & computing machinery
Other manufacturing
Other non-metallic mineral products
Other transport equipment
Pulp, paper & paper products
Rubber & plastics
Textiles, wearing apparel & fur, leather products
Wood & cork (except furniture)
-35
-30
-25
-20
-15
-10
-5
0
5
10
15
20
-10 -5 0 5 10 15 20
BERD
int
ensi
ty -a
vera
ge an
nual
gro
wth
(%),
1996
-200
8 (2)
Share of value added in total value added - average annual growth (%), 1996-2008 (2)
Romania - Share of value added versus BERD intensity - average annual growth, 1996-2008
Performanța limitată a României în materie de inovare se reflectă în structura ei economică, în care predomină sectoarele cu tehnologie medie și inferioară. Cererea de cunoștințe este slabă, iar cultura inovării este subdezvoltată. În privința specializării comerțului și a industriei, România face parte din grupul țărilor UE cu venit scăzut (la fel ca Bulgaria, Estonia, Letonia și Lituania), cu un PIB mediu pe cap de locuitor mai scăzut decât media europeană și cu specializare în sectoare mai puțin avansate tehnologic. România este foarte specializată în industrii intensive sub aspectul forței de muncă (pregătirea și filatura fibrelor textile, producția de scânduri, confecții și accesorii), în industrii bazate pe capital (ciment), și pe piață (încălțăminte). În materie de inovare, România este specializată în sectoare cu nivel scăzut de inovare (confecții, piele) și în sectoare cu nivel de inovare mediu-înalt (textile, metale de bază). În termeni dinamici, graficul de mai sus indică un oarecare grad de modificare structurală, prin creșterea valorii adăugate în sectoare bazate pe tehnologie și inovare (echipamente de birou, mașini de contabilizat și de calculat, autovehicule și, în mai mică măsură, mașini și aparate electrice). Pe de altă parte, domeniile bazate pe cunoaștere, ca de pildă instrumentele medicale, de precizie și optice, și într-o anumită măsură, substanțele și produsele chimice, înregistrează o scădere a ponderii valorii

10
adăugate. Totuși, în timp ce calitatea industriilor bazate pe forța de muncă s-a îmbunătățit, situația este deocamdată diferită în cazul industriilor bazate pe tehnologie.
Competitivitatea în cadrul cererii și al piețelor mondiale Investițiile în cunoaștere, clusterele bazate pe tehnologie, inovarea și modernizarea industriilor prelucrătoare reprezintă factori determinanți pentru competitivitatea unei țări pe piețele mondiale de export. O contribuție pozitivă a produselor de tehnologie înaltă și medie în cadrul balanței comerciale constituie un indicator al specializării și competitivității în privința acestor produse.
Source: DG Research and Innovation - Economic Analysis unitData: COMTRADENotes: The data for "Arms & ammunition" refers to the period 2006-2011."Textile fibres & their wastes" refers only to the following 3-digits sub-divisions: 266 and 267."Organic chemicals" refers only to the following 3-digits sub-divisions: 512 and 513."Essential oils & resinoids; perfume materials" refers only to the following 3-digits sub-divisions: 553 and 554. "Chemical materials & products" refers only to the following 3-digits sub-divisions: 591, 593, 597 and 598. "Iron & steel" refers only to the following 3-digits sub-divisions: 671, 672 and 679."Metalworking machinery" refers only to the following 3-digits sub-divisions: 731, 733 and 737.
-2.0
-1.0
0.0
1.0
2.0
3.0
4.0
Chan
ge in
the c
ontri
butio
n to
trad
e ba
lanc
e (in
% p
oints
)
Evolution of the contribution of high-tech and medium-tech products to the trade balance for Romania between 2000 and 2011
Balanța comercială a tuturor produselor de tehnologie înaltă (HT) și tehnologie medie (MT) combinate a fost negativă în România până în 2008 și a devenit pozitivă în 2009 și 2010. Aceasta contrastează cu totalul balanței comerciale, în care tendința pozitivă de până în 2008 a fost urmată de o stagnare relativă în 2009 și 2010. Prin urmare, datele indică atât o deplasare treptată și încurajatoare către HT și MT în balanța comercială a României în ultimii câțiva ani, precum și faptul că aceasta a reușit să determine o contrabalansare a deficiențelor din restul economiei. Mai exact, graficul de mai sus scoate în evidență industriile de tehnologie înaltă și tehnologie medie care și-au îmbunătățit contribuția la balanța comercială a României, mai ales autovehiculele, echipamentele electrice și textilele și, într-o anumită măsură, echipamentele de telecomunicații, utilajele industriale generale și cele specializate pentru anumite industrii. Prin contrast, sectoare precum cel al mașinilor și echipamentelor de generare a energiei electrice, cel al maselor plastice, al produselor medicinale și farmaceutice, al îngrășămintelor și al mașinilor de prelucrare a metalelor contribuie tot mai puțin la balanța comercială, ceea ce indică o posibilă scădere a competitivității relative la nivel mondial. În ultimii 15 ani, economia românească a câștigat în competitivitate pe plan mondial; cu toate acestea, modificările structurale au loc într-un ritm foarte lent. În ultimul deceniu, România a avut cea mai înaltă creștere a productivității totale a factorilor din UE. Dacă luăm anul 2000 ca an de referință, productivitatea totală a factorilor a crescut cu 50 % în 2008 și cu 35 % în 2012. Scăderea relativă între

11
2008 și 2012 poate fi atribuită, în mod rezonabil, crizei economice și financiare. România a înregistrat progrese importante în privința emisiilor de gaze cu efect de seră, care au scăzut, și a reușit să crească și ponderea energiei din surse regenerabile în consumul final brut de energie. Rata ocupării forței de muncă a scăzut de la 69,1 în anul 2000 la 62,8 în 2011.
Indicatori cheie pentru România

12
2000 2001 2002 2003 2004 2005 2006 2007 2008 2009 2010 2011 2012 Average EU RankROMANIA annual average (2) within
growth (1) EU(%)
ENABLERSInvestment in knowledge
New doctoral graduates (ISCED 6) per thousand population aged 25-34 : : : 0.72 0.76 1.11 0.92 0.86 0.95 1.35 1.40 : : 10.0 1.69 15
Business enterprise expenditure on R&D (BERD) as % of GDP 0.25 0.24 0.23 0.22 0.21 0.20 0.22 0.22 0.17 0.19 0.18 0.17 : -3.4 1.26 25
Public expenditure on R&D (GOVERD + HERD) as % of GDP 0.11 0.15 0.15 0.16 0.17 0.20 0.23 0.30 0.40 0.28 0.28 0.31 : 9.6 0.74 25
Venture Capital (3) as % of GDP 0.04 0.05 0.03 0.11 0.00 0.02 0.07 0.13 0.09 0.07 0.06 0.04 : -1.8 0,35 (4) 17 (4)
S&T excellence and cooperationComposite indicator of research excellence : : : : : 12.2 : : : : 17.8 : : 7.8 47.9 23Scientific publications within the 10% most cited scientific publications worldwide as % of total scientific publications of the country
2.6 2.5 3.0 3.1 4.2 3.9 3.9 4.2 3.8 : : : : 4.9 10.9 24
International scientific co-publications per million population 44 39 45 66 76 84 89 111 122 133 144 148 : 11.7 300 27
Public-private scientific co-publications per million population : : : : : : : 5 5 6 8 8 : 15.5 53 24
FIRM ACTIVITIES AND IMPACTInnovation contributing to international competitiveness
PCT patent applications per billion GDP in current PPS€ 0.2 0.2 0.2 0.2 0.2 0.2 0.2 0.2 0.2 0.2 : : : 0.2 3.9 27License and patent revenues from abroad as % of GDP : : : : 0.01 0.05 0.03 0.02 0.12 0.12 0.28 0.13 : 41.4 0.58 16Sales of new to market and new to firm innovations as % of turnover : : : : 16.6 : 18.5 : 14.9 : 14.3 : : -2.5 14.4 12
Knowledge-intensive services exports as % total service exports : : : : 22.3 41.0 44.9 43.8 42.0 44.9 43.0 : : 11.6 45.1 7
Contribution of high-tech and medium-tech products to the trade balance as % of total exports plus imports of products
-10.69 -9.21 -9.61 -9.30 -8.45 -7.26 -6.00 -4.42 -2.33 0.60 0.25 0.38 : - 4,20 (5) 19
Growth of total factor productivity (total economy) - 2000 = 100 100 105 116 120 130 134 140 144 148 137 133 134 132 32 (6) 103 2
Factors for structural change and addressing societal challengesComposite indicator of structural change 16.0 : : : : 19.0 : : : : 28.3 : : 5.9 48.7 27Employment in knowledge-intensive activities (manufacturing and business services) as % of total employment aged 15-64
: : : : : : : : 5.6 5.8 6.0 6.5 : 4.9 13.6 27
SMEs introducing product or process innovations as % of SMEs : : : : 17.8 : 19.4 : 18.0 : 13.2 : : -4.9 38.4 27
Environment-related technologies - patent applications to the EPO per billion GDP in current PPS€ 0.00 0.00 0.01 0.01 0.01 0.02 0.01 0.01 0.01 : : : : -1.2 0.39 24
Health-related technologies - patent applications to the EPO per billion GDP in current PPS€ 0.01 0.02 0.00 0.01 0.03 0.03 0.02 0.01 0.01 : : : : -4.2 0.52 25
EUROPE 2020 OBJECTIVES FOR GROWTH, JOBS AND SOCIETAL CHALLENGESEmployment rate of the population aged 20-64 (%) 69.1 68.3 63,3 (7) 63.7 63.5 63.6 64.8 64.4 64.4 63.5 63.3 62.8 : -0.1 68.6 22R&D Intensity (GERD as % of GDP) 0.37 0.39 0.38 0.39 0.39 0.41 0.45 0.52 0.58 0.47 0.46 0.48 : 2.5 2.03 26Greenhouse gas emissions - 1990 = 100 55 56 58 60 59 59 60 59 58 49 48 : : -7 (8) 85 3 (9)
Share of renewable energy in gross final energy consumption (%) : : : : 16.8 17.6 17.1 18.3 20.3 22.4 23.4 : : 5.7 12.5 7
Share of population aged 30-34 who have successfully completed tertiary education (%) 8.9 8.8 9.1 8.9 10.3 11.4 12.4 13.9 16.0 16.8 18.1 20.4 : 7.8 34.6 26
Share of population at risk of poverty or social exclusion (%) : : : : : : : 45.9 44.2 43.1 41.4 40.3 : -3.2 24.2 26 (9)
Source: DG Research and Innovation - Economic Analysis Unit Data: Eurostat, DG JRC - ISPRA, DG ECFIN, OECD, Science Metrix / Scopus (Elsevier), Innovation Union ScoreboardNotes: (1) Average annual growth refers to growth between the earliest available year and the latest available year for which compatible data are available over the period 2000-2012. (2) EU average for the latest available year. (3) Venture Capital includes early-stage, expansion and replacement for the period 2000-2006 and includes seed, start-up, later-stage, growth, replacement, rescue/turnaround and buyout for the period 2007-2011. (4) Venture Capital: EU does not include EE, CY, LV, LT, MT, SI, SK, These Member States were not included in the EU ranking. (5) EU is the weighted average of the values for the Member States. (6) The value is the difference between 2012 and 2000. (7) Break in series between 2002 and the previous years. Average annual growth refers to 2002-2011. (8) The value is the difference between 2010 and 2000. A negative value means lower emissions. (9) The values for this indicator were ranked from lowest to highest. (10) Values in italics are estimated or provisional.
HOw TO ObTAIN EU PUbLICATIONSFree publications :
• via EU Bookshop (http://bookshop.europa.eu) ;• at the European Commission's representations or delegations. You can obtain
their contact details on the internet (http://ec.europa.eu) or by sending a fax to +352 2929–42758.
Priced publications :• via eu bookshop (http://bookshop.europa.eu).
Priced subscriptions (e.g. annual series of the Official Journal of the European Union and reports of cases before the Court of Justice of the European Union) :
• via one of the sales agents of the Publications Office of the European Union (http://publications.europa.eu/others/agents/index_en.htm).
European Commission
Research and Innovation performance in Romania - Country profile
Luxembourg: Publications Office of the European Union
2013 — 25 pp. — 21 × 29.7 cm
ISBN 978-92-79-30859-8doi:10.2777/25094

KI-32-13-169-B
6-N
doi:10.2777/25094
Research and Innovation policy