role of encapsulated amino acids on skeletal muscle …
TRANSCRIPT

ROLE OF ENCAPSULATED AMINO ACIDS ON SKELETAL MUSCLE GROWTH
AND DEVELOPMENT IN FEEDLOT STEERS
by
Jessica Odell Baggerman, B.S.
A THESIS
in
ANIMAL SCIENCE
Submitted to the Graduate Faculty
Of Texas Tech University in
Partial Fulfillment of
the Requirements for
the Degree of
MASTER OF SCIENCE
Bradley J. Johnson, PhD.
Chairperson of the Committee
Sara J. Trojan, PhD.
Ryan J. Rathmann, PhD.
Mark Sheridan
Dean of the Graduate School
December, 2014

Copyright 2014, Jessica O. Baggerman

Texas Tech University, Jessica O. Baggerman, December 2014
ii
ACKNOWLEDGEMENTS
First of all, I would like to thank my parents, Lora and John Mark Baggerman, for
their unconditional love and support. Y’all have given me so many opportunities and
instilled the importance of hard work, humility, integrity, and last but not least knowing
when to ask for help. Ty, thank you for putting up with your stubborn big sister as we
have “grown up.” I know that I only seem to call to check in on my cattle if I haven’t
heard anything in a while, but I really do appreciate everything you do for me. Your
determination and ability to solve any problem that comes your way is such an inspiration
to me, and I know you will be successful as you continue to take more responsibility with
the farm. To my grandfather, aunts, uncles, and cousins, thank you as well for your love
and support. Granny, I know you are watching over me and are that voice in my head
telling me that I can do this.
I wouldn’t be in graduate school today if it wasn’t for the mentorship of Clint
Krehbiel during my undergrad career at OSU. Dr. Krehbiel, thank you so much for
allowing me to work in your lab and having a Freshman Research project, which turned
into a Departmental Research Scholar project, which turned into a Wentz Scholar project
that I was able to present at ASAS JAM in 2012. Those projects opened the world of
research to me when I had “vet school tunnel vision” during my freshman year and
helped me prepare for the research/classwork balancing act that is graduate school. I
cannot thank you enough for those opportunities, as well as the suggestion that I look into
graduate school at Texas Tech.

Texas Tech University, Jessica O. Baggerman, December 2014
iii
Dr. Johnson, thank you for the opportunity to work towards my Masters degree
here at Texas Tech. You have allowed me to learn about areas of animal science that I
had never entertained before. I have gained problem solving skills that I will
undoubtedly hone during my PhD. On that note, thank you for allowing me to continue
my graduate studies towards a PhD. I am excited to go forward on this journey. To Dr.
Trojan and Dr. Rathmann, thank you for your advice and guidance during these past two
years, as well as agreeing to be on my committee.
To my fellow graduate students, thank you for your assistance and friendship.
There is no way I would have been able to do my project without y’alls help, especially
my lab group. Thanks is needed for the feedlot crew as well during my feeding trial. My
friends have been invaluable to me on a daily basis, whether I just want to talk or need to
vent, de-stress, or require an outside voice telling me to slow down and take a break so I
don’t get burned out. All of you have been there for me and been such a blessing that I
can only hope to be there for y’all in the way y’all have been there for me. I can’t forget
my dog, Poot. Coming home after long days is better knowing that you will be so
dadgum excited to see me. We both had some major adjusting to do when I adopted you
when I started graduate school. I know it was difficult at first, but we figured it out! I
think…
Last but not least, I want to thank the Lord above for the blessings in my life. I
know that my path may not be clear to me at the time, but You will guide me on this
journey and not lead me astray.

Texas Tech University, Jessica O. Baggerman, December 2014
iv
TABLE OF CONTENTS
ACKNOWLEDGEMENTS…………………………….……………………………........ii
ABSTRACT……………………………………………………………………………...vi
LIST OF TABLES……………………………………………………………………...viii
LIST OF FIGURES………………………………………………………………………ix
I. INTRODUCTION……………………………………………………………………....1
II. REVIEW OF LITERATURE..……………………………….………………………3
Amino Acids and the Ruminant…………………………………………...………3
Mammalian Target of Rapamycin…………………...……………………………9
Skeletal Muscle Synthesis and Degradation………………………………….….17
Conclusion to Review of Literature….……………….………………………….23
Literature Cited……………………………………………….………………….24
III. THE IMPACT OF ENCAPSULATED AMINO ACIDS ON POST-NATAL
SKELETAL MUSCLE GROWTH AND DEVELOPMENT OF FEEDLOT STEERS..32
Abstract……………………….……………………………………….…………32
Introduction………………….……………………………………………..…….33
Materials and Methods…….……………………………………………………..35
Results and Discussion……………………...…………………………………...45
Literature Cited………………………………….……………………………….65
IV. SATELLITE CELL POPULATIONS IN SKELETAL MUSCLE SHIFT OVER
TIME IN FINISHING CATTLE………………………………………………………...69
Abstract…………………………………..………………………………………69

Texas Tech University, Jessica O. Baggerman, December 2014
v
Introduction…………………………………...………………………………….70
Materials and Methods………………………….………………………………..71
Results and Discussion…………………………...……………………………...77
Literature Cited……………………………………….………………………….90

Texas Tech University, Jessica O. Baggerman, December 2014
vi
ABSTRACT
Post-natal skeletal muscle growth and development is impacted by many factors.
The purpose of experiment 1 was to investigate the effect of encapsulated amino acids on
post-natal skeletal muscle growth and development in feedlot steers during the finishing
period. Continental crossbred steers (n = 20; 457 ± 58 kg) were blocked by weight and
sorted randomly to treatment with 5 head per pen and 2 pens per treatment. Treatments
were 1) 0 grams of encapsulated methionine and 4 grams of encapsulated lysine (0Met),
and 2) 8 grams of encapsulated methionine and 4 grams of encapsulated lysine (8Met).
Longissimus muscle biopsies were performed on d 0, 14, 28, 42, and 56. Muscle samples
were analyzed for muscle growth and mammalian target of rapamycin (mTOR) pathway
signaling via PCR, Western blotting, SDS-PAGE, and immunohistochemistry. Factors
evaluated included AKT, AMP-0Met cattle had a tendency for increased abundance of
eIF4EBP1 mRNA (P = 0.053). There was a day effect on mRNA abundance of AKT,
AMPKα, IGF-I, MHC-I, MHC-IIA, MHC-IIX, and RAGA (P < 0.05). Expression of
AKT protein decreased in 8Met compared with 0Met (P < 0.05). 8Met tended to
decrease abundance of eIF4EBP1 (P = 0.06) and Raptor (P = 0.07). Abundance of
AMPKα, eIF4EBP1, MHC-I, MHC-II, pAMPKα, RAGA, and Raptor protein responded
according to day of biopsy (P < 0.001). Treatment by day interactions were found for
muscle fiber type distribution and cross-sectional area, and Myf5 positive satellite cell
density (P < 0.001). There was a tendency for interaction of treatment and day (P 0 0.08)
for PAX7/Myf5 positive satellite cells, however both treatments had a decrease in density
for d 42 and 56. For both treatments, cross sectional area increased from d 0 to 56. The

Texas Tech University, Jessica O. Baggerman, December 2014
vii
8Met treatment had a greater (P < 0.05) density of PAX7 positive satellite cells. There
was an interaction of day and treatment for both density of total nuclei and myofiber
nuclei (P < 0.05); there was no difference in total nuclei on d 0 and 56 for both
treatments, and nuclei associated with muscle fibers increased for both treatments from d
0 to 56. Supplementation of encapsulated methionine impacted mTOR signaling and
skeletal muscle growth potential. Experiment 2 was performed to evaluate the change in
skeletal muscle and satellite cell populations in living steers during 56 d during the
finishing phase. Ten feedlot steers were biopsied over 56 d as in experiment 1. The
longissimus sample collected via biopsy were evaluated for myosin heavy chain isoforms
and satellite cell populations using PCR, SDS-PAGE, and immunohistochemical staining.
The abundance of MHC-I, IIA, and IIX mRNA increased (P < 0.05) on d 42 and 56.
There was an increase (P < 0.05) of MHC-I and II protein from d 1 to 56. Cross-
sectional area increased (P < 0.05) from d 1 to 56. There was a decrease (P < 0.05) in the
abundance of type I skeletal muscle fibers from d 1 to 56. As days on feed increased, the
density of PAX7-positive satellite cells increased (P < 0.05). The density of PAX7/Myf5
and Myf5 positive satellite cells decreased (P < 0.05) on d 42 and 56 compared with the
earlier biopsy days. There was no difference in the density of total nuclei (P > 0.05) on d
1 and 56, and the density of myofiber nuclei increased (P < 0.05) from d 1 to 56. These
data show that during the 56 d period of the finishing phase, satellite cells fused into
existing skeletal muscle fibers to support the post-natal skeletal muscle hypertrophy that
occurred as days on feed increased.
Texas Tech University, Jessica O. Baggerman, December 2014
viii
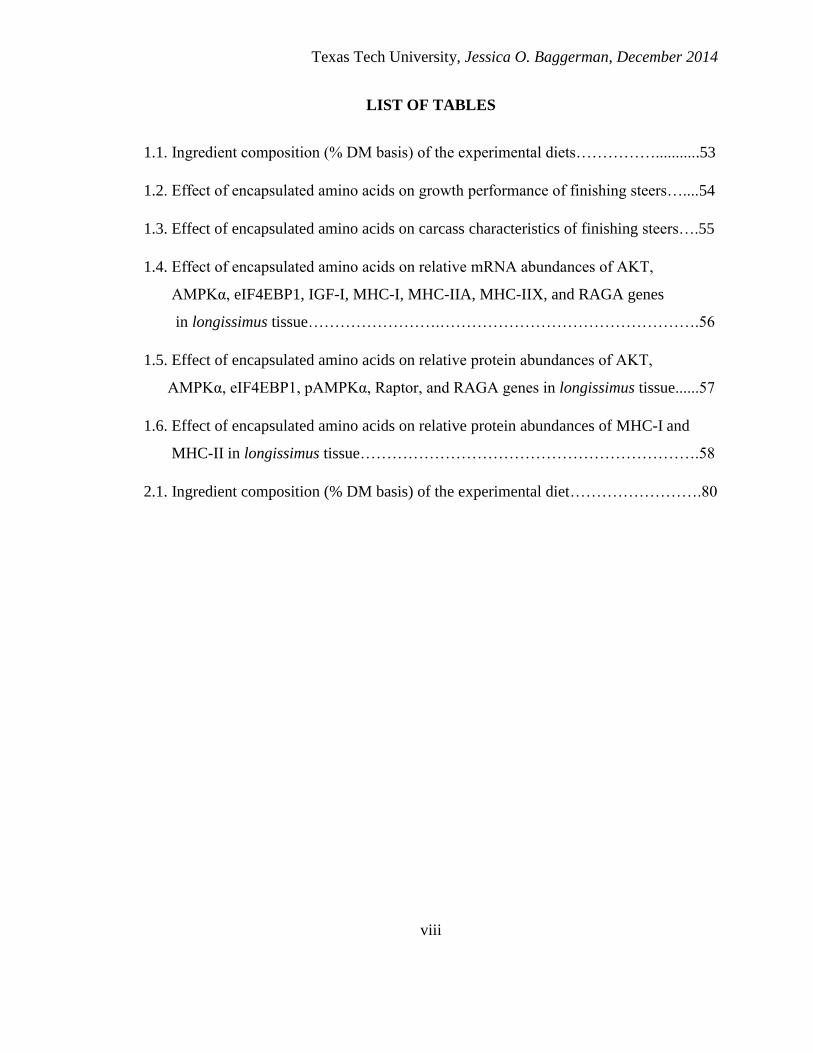
LIST OF TABLES
1.1. Ingredient composition (% DM basis) of the experimental diets……………...........53
1.2. Effect of encapsulated amino acids on growth performance of finishing steers…....54
1.3. Effect of encapsulated amino acids on carcass characteristics of finishing steers….55
1.4. Effect of encapsulated amino acids on relative mRNA abundances of AKT,
AMPKα, eIF4EBP1, IGF-I, MHC-I, MHC-IIA, MHC-IIX, and RAGA genes
in longissimus tissue…………………….………………………………………….56
1.5. Effect of encapsulated amino acids on relative protein abundances of AKT,
AMPKα, eIF4EBP1, pAMPKα, Raptor, and RAGA genes in longissimus tissue......57
1.6. Effect of encapsulated amino acids on relative protein abundances of MHC-I and
MHC-II in longissimus tissue……………………………………………………….58
2.1. Ingredient composition (% DM basis) of the experimental diet…………………….80

Texas Tech University, Jessica O. Baggerman, December 2014
ix
LIST OF FIGURES
1.1. Effect of encapsulated amino acids on distribution of skeletal muscle fiber types…59
1.2. Effect of encapsulated amino acids on cross-sectional area of skeletal muscle
fibers……………………………………………………....………………………..60
1.3. Effect of encapsulated amino acids on satellite cell population densities in skeletal
muscle fibers…...……………...……………………………………………………61
1.4. Effect of encapsulated amino acids on nuclei densities in skeletal muscle fibers......62
1.5. Image of immunohistochemical staining of skeletal muscle fibers from cattle
supplemented with encapsulated amino acids………………………………………63
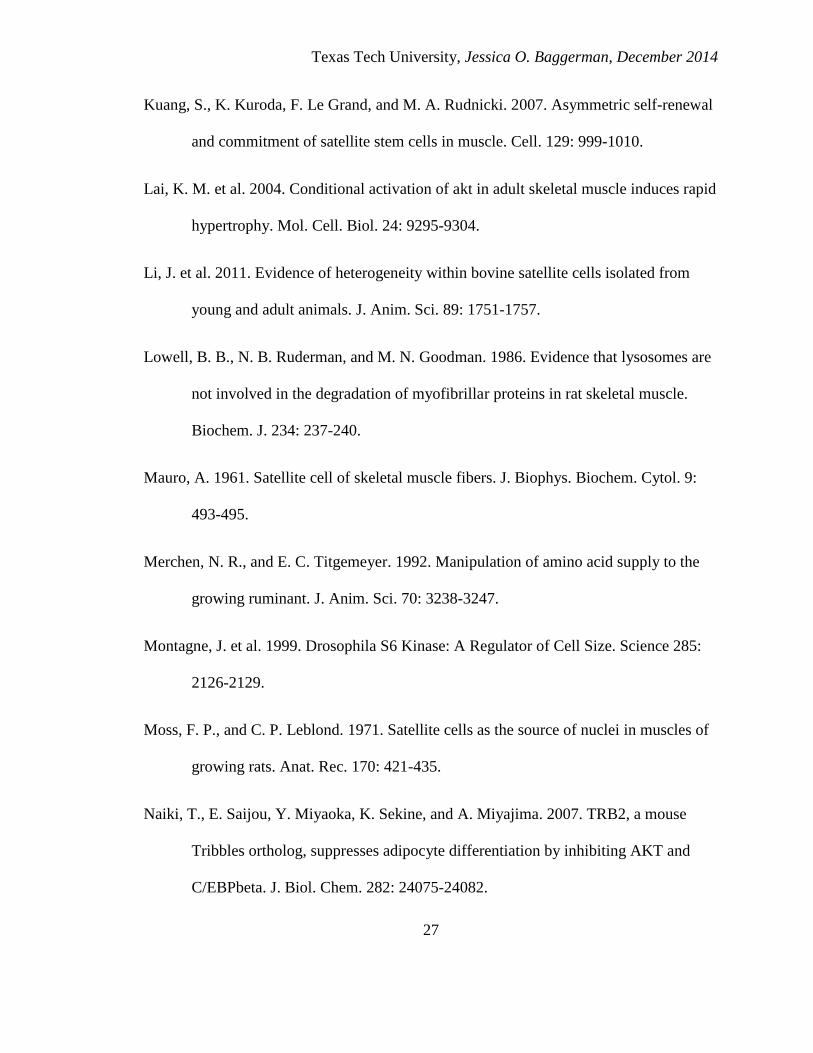
1.6. Image of immunohistochemical staining of satellite cells in skeletal muscle fibers
from cattle supplemented with encapsulated amino acids…………………….……64
2.1. Change in MHC isoform gene abundance over time in feedlot steers….………..…81
2.2. Image of SDS-PAGE of change in MHC isoforms in feedlot steers over time..……82
2.3. Change in MHC isoform protein abundance over time in feedlot steers……………83
2.4. Images of immunohistochemical staining of skeletal muscle fiber changes over
time in feedlot steers………………...……...……………………………………….84
2.5. Change in distribution of skeletal muscle fiber types over time in feedlot steers..…85

Texas Tech University, Jessica O. Baggerman, December 2014
x
2.6. Change in cross-sectional area of skeletal muscle fibers in feedlot steers over
time…………………………………………………………………………………86
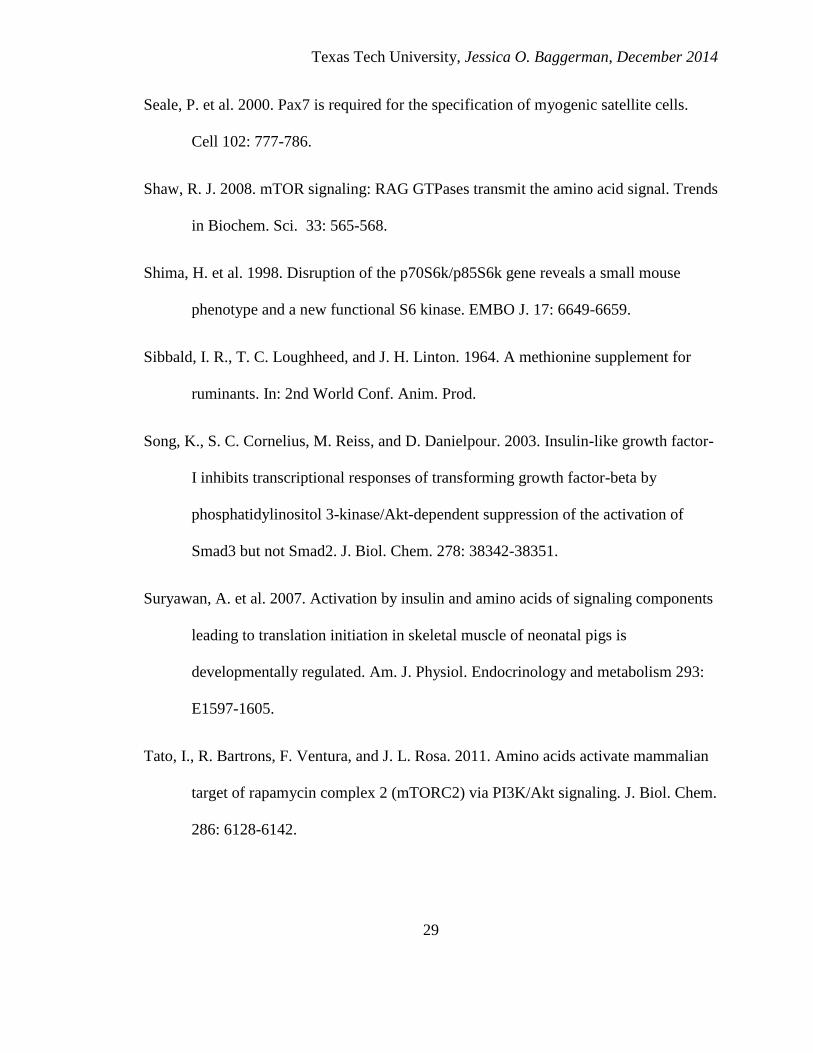
2.7. Images of immunohistochemical staining of changes in satellite cell population
densities over time in feedlot steers…………………...……………………………87
2.8. Change in satellite cell population densities in feedlot steers over time……………88
2.9. Change in nuclei density over time in feedlot steers…...…………………………...89

Texas Tech University, Jessica O. Baggerman, December 2014
1
CHAPTER I
INTRODUCTION
Amino acids, the building blocks of protein, are important biological molecules in
nutrition and skeletal muscle growth and development of livestock species. Cattle utilize
amino acids differently as ruminant animals compared to monogastric animals. When
ruminant animals consume protein, it can be divided into two main fractions- degradable
intake protein and undegradable intake protein. Degradable intake protein is broken
down and utilized by the microorganisms in the rumen that ferment feedstuffs and
produce necessary nutrients that are not provided by the feedstuffs themselves.
Undegradable intake protein is able to bypass fermentation by the rumen microorganisms
to be absorbed in the small intestine of the animal. Protecting amino acids from
degradation in the rumen allows for manipulation of the amino acid profile that reaches
the small intestine. This change in amino acids can influence growth and development of
the animal, as there are amino acids that if reduced in abundance can limit the growth and
development of animals.
An important signaling pathway involved in cellular growth is the mammalian
target of rapamycin pathway. This pathway is influenced by many extracellular signals,
including growth hormones, cytokines, stress, glucose, and amino acids. Through the
influence of signals from extracellular factors, transcription and translation are impacted
through the interaction of the signaling cascade in the pathway. This can lead to changes
in cellular growth and proliferation of skeletal muscle as well as other cell types in the
body.
Texas Tech University, Jessica O. Baggerman, December 2014
2
After birth, skeletal muscle growth and development occurs through muscle fiber
hypertrophy as there is little to no change in the number of muscle fibers during the post-
natal phase (Johnston et al., 1975). This increase in skeletal muscle fiber cross-sectional
area as animals age is important for the production of meat. Skeletal muscle fibers can be
classified by myosin heavy chain isoform presence. As skeletal muscle fibers undergo
hypertrophy, the fiber profile is able to shift from smaller, slow twitch fibers to larger,
fast twitch fibers. To manage the increase in fiber size, additional nuclei must be
incorporated as nuclei associated with skeletal muscle is not able to proliferate (Moss and
Leblond, 1970). These additional nuclei come from satellite cells that lay between the
sarcolemma and basal lamina of the muscle fiber (Mauro, 1961). When satellite cells
come out of quiescence to proliferate and differentiate to fuse into skeletal muscle fibers,
there is a series of myogenic regulatory factors that are expressed. The expression of
these factors allows for identification of satellite cells and the progression from quiescent
cell to fusion into the muscle fiber. Additionally, the expression of these factors allows
satellite cells to fuse into the skeletal muscle fiber to support post-natal skeletal muscle
growth and development.

Texas Tech University, Jessica O. Baggerman, December 2014
3
CHAPTER II
REVIEW OF LITERATURE
Amino Acids and the Ruminant
Amino acids are organic compounds that are the building blocks of proteins and
are important for cellular growth and metabolism. When considering supplemental
amino acids and ruminant nutrition, one must take a unique approach due to the microbial
fermentation that takes place in the rumen. Traditionally, beef cattle nutrition has
focused on meeting crude protein content in feed rations rather than specific limiting
amino acid requirements. As more information becomes available concerning amino acid
requirements and how to meet those requirements in ruminant animals in varied types of
production and stages of growth, there has been an increase in finding ways to provide
specific limiting amino acids in addition to crude protein in feed rations to increase
animal performance.
Amino Acids
While there are over 500 discovered amino acids, a fraction of that number are
naturally occurring, and only 20 are of biochemical importance: alanine, arginine,
asparagine, aspartate, cysteine, glutamine, glutamate, glycine, histidine, isoleucine,
leucine, lysine, methionine, phenylalanine, proline, serine, threonine, tryptophan,
tyrosine, and valine (Wagner and Musso, 1983). Their chiral structure is defined by a
backbone consisting of an amine group and a carboxylic acid group around the α-carbon;
however it should be noted that glycine is not a chiral amino acid. At a physiological pH

Texas Tech University, Jessica O. Baggerman, December 2014
4
of 7.4, both functional groups of the backbone are charged, but the net charge of the
backbone alone is zero. This charged, polar form is called the zwitterion form and is
important as the charge of the backbone affects the function of the amino acid. These 20
amino acids are referred to as L- or α-amino acids due to their stereochemistry. The L-
isoform is the most common in nature, but the D-isoform can be present in bacterial cell
walls (Cava et al., 2011). Some D-isoform amino acids can be converted to the L-
isoform due to enzymes in organisms (Wu, 2009). Also attached to the α-carbon is the
side chain, or R group. The side chain is what differentiates one amino acid from
another. Due to the configuration of atoms as well as which elements are present in the
side chain, each side chain has different properties that define how the amino acid will
act. Side chains are mainly comprised of carbon and hydrogen, however oxygen,
nitrogen, and sulfur also occur in the side chains of the 20 biochemically important amino
acids. Amino acids can be classified by polarity, charge, structure, presence of sulfur, or
whether the amino acid is essential for intake by non-ruminant animals. In livestock
nutrition, there are three main groups of amino acids that are important- branched chain
amino acids: leucine, lysine, and isoleucine; sulfur-containing amino acids: methionine
and cysteine; and the 10 essential amino acids: phenylalanine, valine, threonine,
tryptophan, isoleucine, methionine, histidine, arginine, leucine, and lysine.
Ruminant metabolism of protein and amino acids
While non-ruminant species have nutritional requirements for essential amino
acids for homeostasis or growth, ruminant animals are hosts to microorganisms in the
rumen that are able to ferment feedstuffs and produce necessary nutrients, such as volatile

Texas Tech University, Jessica O. Baggerman, December 2014
5
fatty acids and amino acids not provided in the diet, for the host to utilize (Van Soest,
1994). The microorganisms in the rumen are diverse and vary in type depending on the
ration consumed by the animal, what substrate can be fermented, and the products
produced for the host. Because of this symbiotic relationship of microorganism and host,
feed rations tend to be formulated on a crude protein basis rather than formulating to the
limiting amino acid requirements, such as in swine diets. The crude protein the ruminant
consumes can be divided into three categories: non-protein nitrogen, degradable intake
protein, and undegradable intake protein. Non-protein nitrogen, comprised of substances
such as nucleic acids or urea, can be utilized by nitrogen-fermenting bacteria as long as
sufficient carbon skeletons are also present in the rumen. The degradable intake protein
is broken down into shorter polypeptide chains and amino acids. The microorganisms
that utilize amino acids then ferment the polypeptides and free amino acids in rumen fluid
quickly, resulting in a very low concentration of amino acids available from feedstuffs for
the host to absorb in the small intestine, the primary site of absorption (Chalupa, 1974).
However, these microbes that ferment feedstuffs also contribute to protein available for
the host, as due to ruminal passage rate and turnover microbes travel out of the rumen to
the abomasum and the small intestine where they are broken down into nutrients the host
is able to absorb. Even though microbial cell protein contributes the largest portion of
protein reaching the small intestine to meet the host’s protein requirements, there is
limited control of the type and amount of amino acids available for the host (Chalupa,
1974). Undegradable protein, also referred to as bypass protein, is able to bypass
digestion in the rumen and be broken down for the animal to absorb in the small intestine

Texas Tech University, Jessica O. Baggerman, December 2014
6
and use for cellular processes. By utilizing undegradable protein, there is a greater
amount of control over what amino acids reach the small intestine for the host to absorb
to use for potential growth.
Bypass protein
While there is a portion of the protein present in each feedstuff that will be
undegradable intake protein, there are methods to modify feedstuffs to increase the
amount of protein that will bypass digestion in the rumen and be available for absorption
by the ruminant. One way is to provide analogs or synthetic versions of amino acids
(Papas et al., 1974). Some common feed processing practices affect the amount of
protein available for post-ruminal digestion, such as grinding, steam flaking, and
pelleting. Heat treatment of feedstuffs affects the Maillard reaction between amino acids
and aldehyde sugar groups, which affects the utilization of protein in the rumen. If this
change is kept in check during feed processing by monitoring time and temperature, the
ruminal degradation of intake protein can be reduced, resulting in an increased bypass
protein fraction (Chalupa, 1974). However, if heating protein can result in degradation of
the protein which decreases availability to the animal. Another method of increasing
bypass protein is chemical treatment using various compounds. The goal of chemical
treatment is to protect the protein present in the feed by allowing the protein to form
reversible bonds with the proteins, rendering them indigestible in the rumen environment.
The chemical treatment that has been researched most extensively is formaldehyde.
When formaldehyde is used to protect protein, there is inconsistent results concerning
improvement in animal performance and fecal nitrogen, however the most improvements

Texas Tech University, Jessica O. Baggerman, December 2014
7
were seen with treated casein and forages that were ensiled (Chalupa, 1974).
Encapsulation of amino acids is another way to increase the bypass protein fraction of the
ration and specifically supplement limiting amino acids to growing or high producing
animals. Encapsulation technologies have been researched for several decades. An early
method of encapsulating methionine was with colloidal kaolin and tristearin, forming
beads measuring 300 to 1000 µm in diameter (Sibbald et al., 1964). Tristearin was
proven to protect amino acids from ruminal degradation in subsequent research; however,
while the amino acids were protected from ruminal degradation and had a high bypass
rate, degradation in the abomasum and intestine was limited. When the tristearin was
mixed with an oil or another liquid unsaturated fatty acid, the ruminally protected amino
acids were then able to be digested in the small intestine as there was a high rate of
ruminal bypass as well as intestinal aborption (Grass and Unangst, 1972). The beads
from this method measured 200 to 2000 µm in diameter. Grass and Unangst also
proposed other methods of ruminal protection of amino acids, such as extrusion, spray
congealing, or pan coating to add a matrix to surround the amino acids. As research and
manufacturing methods have advanced, amino acids can be ruminally protected using
other methods such as coating the amino acids with a polymer that protects the amino
acid in the rumen but is broken down in the acidic abomasum and spray freezing. Studies
investigating the effect of ruminally protected amino acids on animal performance
showed no to little improvement when fed a ration with protein sources that provide
sufficient amino acids, but there may be more of a beneficial effect when the ration is

Texas Tech University, Jessica O. Baggerman, December 2014
8
deficient in amino acids or the level of post-ruminal amino acids is low (Klemesrud et al.,
2000; Merchen and Titgemeyer, 1992).
Amino acid requirements of the ruminant
While most beef cattle rations rely on crude protein content to meet the
exogenous needs of the animal, these animals do have a requirement for essential amino
acids (Merchen and Titgemeyer, 1992). The feed type the animal is consuming
determines which amino acids are limiting the animal’s performance. In growing steers
consuming a forage-based diet, methionine is the first limiting amino acid, followed by
lysine and threonine (Richardson and Hatfield, 1978). When steers are fed a corn-based
diet, the most limiting amino acid is lysine, followed by methionine (Titgemeyer et al.,
1988). However, when cattle are infused with a mixture of essential amino acids
including methionine, there is not a clear limiting amino acid and nitrogen retention was
improved compared to no methionine inclusion or methionine alone (Merchen and
Titgemeyer, 1992). When cattle are fed diets comprised of feedstuffs that are high in
ruminally degradable protein, the amino acid profile reaching the small intestine is
similar to the profile of microbial protein alone (Fenderson and Bergen, 1975). This
influences which amino acids are most limiting. Evidence shows that in growing steers,
adding ruminally protected methionine to the ration supplemented with meat and bone
meal improved average daily gain, as did the addition of ruminally protected lysine to the
corn gluten meal supplemented ration (Klemesrud et al., 2000). For steers gaining 0.39
kg/d, it was found the methionine requirement was 11.6 g/d, and the lysine requirement
for steers gaining 0.56 kg/d was 22.5 g/d (Klemesrud et al., 2000). There is a level of

Texas Tech University, Jessica O. Baggerman, December 2014
9
over-supplementation of amino acids where the animal will excrete the excess amino
acids, resulting in wasted resources and money. The level of undegradable protein in the
diet as well as the contribution of microbial cell protein should be considered when
determining the need for supplemental amino acids.
Mammalian Target of Rapamycin
The target of rapamycin, (TOR), discovered to in yeast cell culture following the
isolation of the antifungal rapamycin from the bacteria Streptomyces hygroscopicus in
soil on Easter Island in the 1970s (Weichhart, 2012; Yang et al., 2008). The name
rapamycin is derived from Rapa Nui, the name of Easter Island in the local language
(Wullschleger et al., 2006). It was found that rapamycin inhibited proliferation of cells
and subsequent immune response (Abraham and Wiederrecht, 1996). TOR was then
found to be present in other species and is also known as the mechanical or mammalian
target of rapamycin in mammalian species (mTOR), FRAP, RAFT, and rapamycin and
FKB target. Through the discovery of TOR and subsequently mTOR, an entire signaling
pathway has since been identified that plays a crucial role in cellular metabolism and
growth. The structure of the mTOR signaling pathway, while very complex, is similar
across many types of organisms and is still being evaluated. Most eukaryotes have a
single TOR gene while yeast and fungi have two TOR genes that are homologous (Yang
et al., 2008). This high level of conservation has allowed for TOR research to be applied
across species. In mammals, mTOR forms two main groups of signaling aspects, mTOR
complex 1 (mTORC1) and mTOR complex 2 (mTORC2), with many upstream and
downstream factors which take extracellular and intracellular signals and translate them
Texas Tech University, Jessica O. Baggerman, December 2014
10
into cellular hypertrophy or increase in cell size, hyperplasia or increase in cell number,
and autophagy. The mTOR pathway receives signals from extracellular and intracellular
factors and plays a role in several bodily functions, including muscle mass accretion,
adipose tissue development, mammary gland function, and tumor growth. Due to the
complexity of the mTOR signaling pathway, there are cloudy areas with conflicting
theories of how specific proteins participate in the pathway, including how extracellular
factors affect the pathway (Yang et al., 2008). Subsequently, the information about the
operation of mTOR pathway is constantly evolving as is the pathway’s effects on cell
function and growth.
mTOR complexes
mTORC1 and mTORC2 both have the central protein mTOR. The mTOR protein
is a relatively large protein, weighing 289 kDa and being 2,549 amino acids long (Yang
et al., 2008). Evidence points to both complexes may be multimeric with specific
proteins complexing with mTOR to define mTORC1 and mTORC2 (Wullschleger et al.,
2006). A crucial part of TOR’s ability to form complexes with other proteins is the
HEAT-HEAT-FAT-FRB-kinase-FATC domains (Wullschleger et al., 2006). The FAT
domain at the C-terminus of mTOR allows for the signaling of mTOR and subsequent
activity (Hay and Sonenberg, 2004). Important proteins involved in mTORC1 which
bind to mTOR include regulatory-associative protein of TOR (RAPTOR) which is an
identifying feature of mTORC1, mammalian lethal with SEC13 protein 8 (mLST8) also
known as GβL, and DEP domain-containing mTOR-interacting protein (DEPTOR).
mTORC2 is similar to mTORC1 in the fact that the complex also include mLST8 and

Texas Tech University, Jessica O. Baggerman, December 2014
11
DEPTOR binding to mTOR, but a distinguishing feature of mTORC2 is the presence of
rapamycin-insensitive companion of TOR (RICTOR). RICTOR reduces the sensitivity
of mTORC2 to rapamycin in contrast to mTORC1 being sensitive to rapamycin and
playing a major role in cell growth and metabolism (Weichhart, 2012).
Upstream factors
There are many upstream factors of the mTOR signaling pathway that have
effects on mTORC1 and mTORC2. These factors are stimulated by many ligands: other
signaling factors such as environmental effects like growth factors, hormones, stress, or
nutrients including glucose and amino acids. There are also proteins involved in the
mTOR pathway that are upstream of mTORC1 that play a crucial role in regulation, such
as AKT. More is known about the upstream regulation of mTORC1 than mTORC2.
Insulin and insulin-like growth factor 1 (IGF-1) both have a stimulatory effect on
mTORC1 through the phosphatidyl-inositol 3-kinase pathway (PI3K) (Yang et al., 2008).
The PI3K pathway also upregulates expression of AKT, also known as protein kinase 3,
which eventually targets Raptor and therefore mTORC1 while being downstream of
mTORC2 (Wullschleger et al., 2006). Ribosomal protein S6 kinase (S6K1), a substrate
of mTORC1, is activated by mTORC1 but can send negative feedback to the PI3K
pathway and decrease the sensitivity of the PI3K cascade to IGF-1 and insulin
(Wullschleger et al., 2006). Another group of growth factors affecting mTORC1 are β-
adrenergic agonists. β-adrenergic agonists are synthetic compounds similar to the
endogenous catecholamines epinephrine and norepinephrine and are an important growth
promoting technology used in food animal production. β-adrenergic agonists affect

Texas Tech University, Jessica O. Baggerman, December 2014
12
mTORC1 as the downstream β-adrenergic agonists effects go through the MEK-ERK
pathway which works with mTORC1 to have effects on muscle growth (Gelinas et al.,
2007). The transforming growth factor-β (TGF-β) family is a group of growth factors
that have various effects on cellular growth. Myostatin is a member of the TGF-β family
that inhibits muscle growth and is facilitated by affecting the PI3K pathway, which is
upstream of mTORC1 and subsequent signaling in the mTOR pathway (Song et al.,
2003).
Various forms of stress can impact mTORC1, such as mechanical stress, osmotic
changes, oxidative stress/heat shock, DNA damage, hypoxia, glucocorticoids, and low
energy status (Yang et al., 2008). Regulated in development and DNA responses protein
1 (REDD1), can be stimulated by hypoxia through hypoxia-inducible factor 1,
glucocorticoids, or low energy status, and inhibits mTORC1 signaling by stimulating the
tumor suppressors TSC1 and TSC2 which then affects Ras homolog enriched in brain
(Rheb) and therefore mTORC1 (Ellisen, 2005; Yang et al., 2008). In addition to
stimulating REDD1, low energy status can also stimulate adenosine monophosphate
(AMP)-activated protein kinase, or AMPK, which also inhibits mTORC1 (Reiling and
Sabatini, 2006). It has been suggested that due to the sensitivity of mTORC1 to ATP,
changes in the concentration of ATP from homeostasis can impact mTORC1 activity
(Kimball, 2006). The ratio of ATP to AMP can also lead to changes in mTORC1
expression through the binding of AMP to AMPK if the ratio of AMP to ATP is low
(Kimball, 2006). Activation of AMPK then causes phosphorylation of TSC2 and

Texas Tech University, Jessica O. Baggerman, December 2014
13
therefore inhibits mTORC1. However, inhibition of mTORC1 leads to enhanced
sensitivity of the PI3K pathway due to decreased activity of S6 kinase.
Due to the sensitivity of the mTOR signaling pathway to energy status of the
organism, nutrition plays indirect effects as well as direct effects on cellular and overall
growth of the organism. In addition to the energy status of the organism, the intake of
protein, specifically amino acids, have a substantial effect on mTORC1, however it is
unknown whether amino acids interact with mTOR directly, through Rag GTPases,
through TSC1/2, or through another signaling pathway, however evidence points to Rag
GTPases serving as the intermediate between the amino acid transporters of the cell
membrane and mTORC1 (Owusu-Apenten, 2010; Shaw, 2008). Researchers also
disagree if the mTOR pathway responds to changes from intracellular or extracellular
amino acid concentration, however it has been demonstrated that limitation of amino
acids causes dephosphorylation of the mTORC1 downstream factors S6K1 and
eukaryotic initiation factor 4E (eIF4E) binding protein 1 (eIF4EBP1) and reintroduction
of amino acids into the system allows for mTORC1 mediated phosphorylation of S6K1
and eIF4EBP1 (Hay and Sonenberg, 2004). While there is more data concerning amino
acids activating mTORC1, there is some literature proposing amino acids can also
activate mTORC2 (Tato et al., 2011). The study presents the theory that amino acids can
stimulate S6K1 and S6 protein in vitro after 2-3 hours of amino acid deprivation as well
as stimulating mTORC2.
AKT impacts the mTOR pathway through the PI3K pathway and being upstream
of mTORC1, yet downstream of mTORC2 (Sarbassov et al., 2006). AKT, like most

Texas Tech University, Jessica O. Baggerman, December 2014
14
proteins involved in the mTOR pathway, is highly conserved among animal species.
Mammals have three AKT proteins (AKT1, AKT2, and AKT3) that are similar in
function but coded by separate genetic sequences. This is a crucial protein in cancerous
cell growth due to the increase in cell metabolism, growth, and proliferation as well as
decreased apoptosis that occurs when AKT is hyper-phosphorylated (Hay, 2005). When
the PI3K pathway is blocked with something such as a tumor-suppressing drug, there is a
resulting reduction in AKT activity, which is important in treatment of cancerous tumors.
This property of AKT can be applied in nutrition as well. There is evidence that suggests
addition of amino acids after 2-3 hours of cell starvation can impact mTOR signaling in
cell culture, especially mTORC2, which leads to phosphorylation of AKT and affects cell
hypertrophy (Tato et al., 2011). In adult mice, increased AKT expression due to
transgenic manipulation resulted in greater muscle mass and less adipose tissue compared
to wild-type littermates (Lai et al., 2004). Muscle fiber cross-sectional area was
increased in the transgenic mice compared with wild-type littermates, suggesting
increased AKT expression leads to an increase in protein synthesis and muscle
hypertrophy. The authors suggest that the decrease in adipose tissue was due to increased
energy requirements for the protein accretion resulting in repartitioning of nutrients.
Subsequent investigation shows inhibition of AKT causes a reduction of adipocyte
differentiation (Naiki et al., 2007). AKT has also been shown to play a role in lipolysis
(Sarbassov et al., 2006).
Downstream signaling

Texas Tech University, Jessica O. Baggerman, December 2014
15
The signaling factors downstream of mTORC1 and mTORC2 are what influence
cell proliferation and growth. There are many downstream factors of mTORC1 and
mTORC2; however the major signaling factors are S6 kinases, the eIF4 family, and
eIF4EBPs. Other targets of mTORC1 and mTORC2 which may be relevant to
transcription, translation, and subsequent cell growth and proliferation are still being
investigated (Hay and Sonenberg, 2004).
There are two S6 kinases present in mammalian tissue, S6K1 and S6K2. There is
more literature available concerning S6K1 as it was discovered earlier then S6K2 (Shima
et al., 1998). S6 kinases have a high level of similarity, over 80%, between the two,
including phosphorylation sites (Hay and Sonenberg, 2004; Pende et al., 2004).
mTORC1 up-regulates both S6 kinases through phosphorylation. The phosphorylation of
S6 kinases leads to increased cell growth through mRNA translation (Montagne et al.,
1999). Since the discovery of S6K2, evidence suggests that it may be more abundant in
some cell types such as embryonic fibroblasts and mature muscle and hepatic cells in
mice (Pende et al., 2004). In addition to being highly conserved in sequence, S6K1 and
S6K2 seem to be redundant in that S6K2 transcription was increased in S6K1-knockout
mice (Shima et al., 1998). In Drosophila, knockout of S6 kinase activity leads to a high
level of mortality and delay in physical development of offspring of the surviving adults
(Montagne et al., 1999; Wilhelm and Smibert, 2005). The reduced body size was found
to be due to a reduction in cell size, not cell number. While the S6 kinase knockout has a
lethal effect on Drosophila, homozygous knockout of S6 kinase in mice is not lethal and
leads to reduction in body size by 20% compared with wild-type mice (Shima et al.,

Texas Tech University, Jessica O. Baggerman, December 2014
16
1998). In the same study, heterozygous knockout mice showed 50% reduced activity of
S6 kinase and a non-significant reduction in body size. For both the homozygous
knockout mice and the heterozygous knockout mice, internal organs were found to be
proportional in size to the reduced body size. In U2OS cells treated with rapamycin,
transient transfection with mutant rapamycin-resistant S6K1 was able to diminish the
negative effects on cell size (Fingar et al., 2002). Interestingly, the S6K1 transfected
cells increased in size even when not treated with rapamycin. The reduction in size of
cells in vivo and in vitro that had S6 kinase activity removed agrees with the hypothesis
that S6 kinases plays a role in regulation of cell growth and size.
Another downstream factor in the mTOR pathway that contributes to regulation
of cell growth and size is eIF4. The main components involved in mTOR signaling are
eIF4A, eIF4B, eIF4G, and eIF4E (Hay and Sonenberg, 2004). eIF4A is a DEAD box
helicase involved in translation and can be stimulated synergistically by eIF4EB and
eIF4EG (Andreou and Klostermeier, 2014; Rogers Jr. et al., 2002). eIF4B can serve as a
substitute to S6, the target of S6 kinases, in addition to drawing ribosomes to mRNA
(Hershey and Merrick, 2000). eIF4E is responsible for initiation of 5’ cap-dependent
translation which leads to cell growth and development. However, in order for eIF4E to
have an effect, either eIF4GI or eIF4GII must be present. There are two eIf4G proteins
known to exist in mammals. eIF4G is a structural protein involved in bringing together
the factors of the ribosome initiation complex. This complex includes eIF4G, eIF4E, and
eIF4A (Hay and Sonenberg, 2004). The translation initiation of eIF4 proteins can only
occur through the phosphorylation of eIF4EBPs, inhibitory proteins of eIF4E and eIF4G.

Texas Tech University, Jessica O. Baggerman, December 2014
17
Mammals have three eIF4EBPs that have separate genes to code for them while
Drosophila only has one gene and one eIF4EBP protein (Hay and Sonenberg, 2004;
Wilhelm and Smibert, 2005). The three eIF4EBPs have differing abundances in various
tissues. The level of phosphorylation of eIF4EBP is the defining factor for determining
the level of affinity for eIF4EBP to bind to eIF4E. Hyperphosphorylation of eIF4EBP
reduces the affinity to bind to eIF4E, allowing for initiation of cap-dependent translation.
Conversely, hypophosphorylation increases the affinity of eIF4EBP to bind to eIF4E and
prohibits the initiation of translation and therefore inhibits cell growth. In Drosophila,
eIF4EBP may also aid in localization of mRNA to ribosomes for translation (Wilhelm
and Smibert, 2005). Evidence suggests that in U2OS cells treated with rapamycin
overexpression of eIF4E can somewhat negate the reduction in cell size due to rapamycin
(Fingar et al., 2002). The overexpression of eIF4E was also able to overcome the
naturally limiting level of eIF4E compared to eIF4EBP1. Cells overexpressing eIF4E but
not treated with rapamycin also showed an increase in size compared with cells
producing normal levels of eIF4E expression. When these overexpressing cells also were
caused to express a mutant of eIF4EBP1, the increase in cell size was prevented. When
cells were transfected to have both rapamycin resistant S6K1 and overexpressed eIF4E,
the increase in cell size was additive, suggesting S6 kinase and eIF4E work
independently to affect transcription, translation of mRNA, and resulting cell hypertrophy
and protein synthesis.
Skeletal Muscle Synthesis and Degradation
Texas Tech University, Jessica O. Baggerman, December 2014
18
Muscle growth occurs through two methods: hyperplasia and hypertrophy. An
increase in muscle mass can be due to the natural growth stage of the animal or by some
exogenous influence, such as nutrition or a growth promotant. While the vast majority
muscle hyperplasia occurs in utero as muscle fiber number is fixed at birth, muscle
hypertrophy takes place throughout the lifetime of an animal (Johnson et al., 1998).
Increasing muscle mass can be from increasing fiber length leading to an overlap of
fibers, increasing individual fiber cross-sectional area, or from fiber type transitioning
from a slow twitch myosin isoform fiber with a smaller cross-sectional area to a fast
twitch myosin isoform fiber with a larger cross-sectional area (Wegner et al., 2000).
Muscle goes through an almost constant process of degradation and synthesis that is
impacted in many ways. Additionally, muscle is constantly at risk for injury from trauma
and/or exercise and therefore needs to able to repair itself. Satellite cells contribute to the
growth and repair of muscle (Du and McCormick, 2009). These factors all play a role in
the cycle of synthesis and degradation that is muscle turnover.
Muscle growth
There are many factors that influence the growth of muscle mass. The signaling
processes involved in the increase of muscle growth can be summarized by the regulation
of factors that stimulate transcription of DNA to mRNA and translation of mRNA to
protein (Du and McCormick, 2009). Of particular interest in this review are the mTOR
signaling pathway factors S6 kinase and the eIF4 factor family and associated binding
proteins, which are downstream targets of mTORC1. These downstream factors are
stimulators of transcription and translation, leading to protein synthesis and cell growth.

Texas Tech University, Jessica O. Baggerman, December 2014
19
An associated pathway of the mTOR pathway that is also involved in protein synthesis
and muscle growth is the PI3K/AKT pathway. As previously stated, AKT is a positive
regulator of mTORC1 through the PI3K pathway and also directly influences protein
turnover rates. These pathways can be independently stimulated as insulin and amino
acids cause protein synthesis in muscle tissue by activating the mTOR signaling pathway
through different signaling mechanisms (Suryawan et al., 2007). In the same study,
neither insulin nor amino acid treatment affected phosphorylation of AMPK. AMPK has
been shown to regulate protein synthesis as well as degradation by affecting the PI3K
signaling pathway (Du and McCormick, 2009).
Satellite cells
When there is damage incurred to muscle tissue or an increase in protein synthesis
in muscle fibers occurs, an increase in nuclei is needed to manage the increase in mass.
Cells referred to as satellite cells are the contributors of additional nuclei to
multinucleated muscle fibers. Satellite cells are stem cells located between the
sarcolemma and the basement membrane of muscle fibers (Mauro, 1961). This nuclei
increase occurs either in sync with the fiber size increase or preceding it (Trenkle et al.,
1978). The additional nuclei come from the fusion of satellite cells into the existing
muscle fiber (Chen and Goldhamer, 2003; Mauro, 1961). These cells are mononuclear
and lie dormant until needed for repair or activated by some stimulation for growth where
they are activated and either proliferate or differentiate and fuse into the muscle fiber (Du
and McCormick, 2009). Unlike muscle fibers, satellite cells are able to proliferate as
well as fuse into the existing muscle fibers (Li et al., 2011). As an animal ages, there is a

Texas Tech University, Jessica O. Baggerman, December 2014
20
reduction in the amount of satellite cells, from around 30% of muscle nuclei being
satellite cells in newborn animals to ranging from 2 to 10% in adult animals (Cardasis
and Cooper, 1975). There are several myogenic regulatory factors associated with the
progression of quiescent satellite cell to fusion, differentiation, and maturation: paired
box proteins 3 and 7 (Pax7 and Pax3), myogenic factor 5 (Myf5), myogenic
determination factor 1 (MyoD), and myogenin (Du and McCormick, 2009). Both paired
box proteins are transcription factors that lie upstream of the other myogenic regulatory
factors and are expressed in quiescent satellite cells, and Pax7 has been more extensively
researched than Pax3. Pax7 has been shown to influence the differentiation of satellite
cells into myotubes in vitro (Seale et al., 2000; Zammitt et al., 2006). Myf5 is thought to
have play a role in proliferation, but the exact role of Myf5 is still under scrutiny
(Zammitt et al., 2006). Pax7, Pax3, Myf5, and MyoD seem to be involved in both
proliferation and activation of satellite cells (Du and McCormick, 2009). Pax7 cells
divide and produce both Myf5 negative and positive daughter cells, and satellite cells that
are positive for both Pax7 and Myf5 are thought to be incorporated into the muscle fiber
(Kuang et al., 2007). Once satellite cells begin the fusion process, satellite cells stop
expressing Pax7 (Du and McCormick, 2009). MyoD and myogenin are important in
fusion of satellite cells in to myotubes and muscle fibers. MyoD and myogenin
expressing satellite cells decline as the animal ages, suggesting satellite cells from
younger animals are able to proliferate and differentiate earlier than older animals (Li et
al., 2011). When examining satellite cells and the ability of the cells to proliferate and
differentiate, studies generally look at the expression of Pax7 and/or Myf5.

Texas Tech University, Jessica O. Baggerman, December 2014
21
Muscle fiber type characteristics
Muscle fiber type is defined by the myosin isoform present in the cell. Of the up
to nine identified myosin isoforms, only three are present in bovine skeletal muscle: type
I, type IIA, and type IIX (Chikuni et al., 2004; Fazarinc, 2009; Toniolo et al., 2005).
Type I fibers are slow twitch, oxidative fibers. These fibers tend to be smaller in cross-
sectional area and have an increased lipid content, leading to the classification of “white”
fibers. Type IIX fibers are fast twitch, glycolytic fibers. These fibers are larger in cross-
sectional area and have less lipid within the fiber, so they are also referred to as “red”
fibers. Type IIA are intermediate of type I and type IIX fibers, being fast twitch
oxidative glycolytic fibers. The presence of these three fiber types in skeletal muscle is
largely dependent on the muscle function and age of the animal. In postural muscles,
type I myosin fibers are more prevalent, and in muscles that are used for movement, there
are more type IIA and IIX myosin fibers (Du and McCormick, 2009). However, the
distribution of these myosin isoform types can vary across an individual muscle. When
identifying myosin isoforms in tissue cross-sections, early laboratory methods relied
myoglobin content, color, or ATPase activity. These methods rely on inherent properties
of each myosin isoform to distinguish fiber types. Analysis of abundance of myosin
heavy chain isoform mRNA also is an indicator of fiber type protein expression (Kim et
al., 2008). Another laboratory method to determine fiber type in tissue cross-sections is
immunohistochemistry. This method uses samples that are either cryogenically frozen or
embedded in paraffin wax and identifies the fiber type by using antibodies that bind to
proteins expressed by each isoform. As an animal ages, myosin isoforms can transition

Texas Tech University, Jessica O. Baggerman, December 2014
22
to meet the changing needs of the animal, but there is conflicting research about the
degree of the transition of fiber types (Wegner et al., 2000). When a type I muscle fiber
transitions to a type IIA or IIX fiber, the fiber area increases, which can contribute to an
increase in muscle in an animal.
Muscle degradation and turnover
There is a constant dynamic cycle of muscle turnover in a live organism. This
process of muscle turnover is a delicate balance of muscle synthesis and degradation.
Degradation of skeletal muscle and synthesizing new tissue is a very energetically costly
process. By degrading muscle tissue, an organism is able to “clean out” faultily coded
tissue or tissue containing proteins no longer necessary and to adapt to new environments
by replacing tissue with new muscle that is better suited to current needs (Du and
McCormick, 2009). Another function of skeletal muscle degradation is to provide
necessary amino acids for survival during times of prolonged starvation (Lowell et al.,
1986). The rate of degradation of skeletal muscle is variable and is influenced by many
factors, such as AMPK, plane of nutrition, and signaling factors like AKT. AMPK
affects degradation rate by increasing fatty acid oxidation in mitochondria and also
slowing protein synthesis by inhibiting mTORC1 and its downstream transcription
factors (Sanchez et al., 2012). When feed intake is restricted in cattle, degradation as
well as synthesis is limited compared with cattle fed ad libitum, possibly due to lack of
available energy for the costly turnover process (Jones et al., 1990). When these cattle
were allowed to have ad libitum access to feed, muscle synthesis and degradation was
increased compared to cattle that were allowed to consume feed ad libitum throughout

Texas Tech University, Jessica O. Baggerman, December 2014
23
the trial. This phenomenon might contribute to compensatory growth and is an important
consideration when feeding beef cattle. Another cellular factor of muscle turnover is
AKT. AKT is involved in the mTOR signaling pathway by positively regulating
mTORC1 to stimulate transcription and translation but also has an effect on muscle
degradation by inhibiting glycogen synthase kinase 3, an inhibitor of translation,
therefore inhibiting muscle degradation and altering the rate of muscle turnover (Du and
McCormick, 2009). There are many other factors involved in the regulation of the rate of
turnover of skeletal muscle, some of which are still being evaluated.
Conclusions to Review of Literature
While there is historical data concerning limiting amino acids and encapsulated
amino acids when feeding beef cattle, there is little information concerning growth
performance of beef cattle fed amino acids encapsulated using current technology. There
is also limited knowledge of how amino acids affect the mTOR cascade and subsequent
muscle growth and development, especially in ruminant animals. Therefore, more
research is needed to completely elucidate amino acid requirements in ruminants as well
as how amino acids impact mTOR signaling in skeletal muscle of ruminant animals.
While satellite cell populations have been evaluated at the time of harvest in young cattle
and adult cattle, there is limited research evaluating satellite cell populations throughout
the lifespan of the bovine animal.

Texas Tech University, Jessica O. Baggerman, December 2014
24
Literature Cited
Abraham, R. T., and G. J. Wiederrecht. 1996. Immunopharmacology of rapamycin.
Annu. Rev. Immunol.14: 483-510.
Andreou, A. Z., and D. Klostermeier. 2014. eIF4B and eIF4G jointly stimulate eIF4A
ATPase and unwinding activities by modulation of the eIF4A conformational
cycle. J. Mol. Biol. 426: 51-61.
Cardasis, C. A., and G. W. Cooper. 1975. A method for the chemical isolation of
individual muscle fibers and its application to a study of the effect of denervation
on the number of nuclei per muscle fiber. J. Exp. Zool. 191: 333-346.
Cava, F., H. Lam, M. A. de Pedro, and M. K. Waldor. 2011. Emerging knowledge of
regulatory roles of D-amino acids in bacteria. Cell. Mol. Life Sci. 68: 817-831.
Chalupa, W. 1974. Rumen bypass and protection of proteins and amino acids. J. Dairy
Sci. 58: 1198-1218.
Chen, J. C. J., and D. J. Goldhamer. 2003. Skeletal muscle stem cells. Reprod. Biol.
Endocrinol. 1: 101-107.
Chikuni, K., S. Muroya, and I. Nakajima. 2004. Myosin heavy chain isoforms expressed
in bovine skeletal muscles. Meat Sci. 67: 87-94.
Du, M., and R. J. McCormick (Editors). 2009. Applied Muscle Biology and Meat
Science. CRC Press, Boca Raton, FL.

Texas Tech University, Jessica O. Baggerman, December 2014
25
Ellisen, L. W. 2005. Growth control under stress: mTOR regulation through the REDD1-
TSC pathway. Cell Cycle 4: 1500-1502.
Fazarinc, G. 2009. Enzyme-immunohistochemical aspects of muscle fiber type
classification in mammals. Slov. Vet. Res 46: 61-70.
Fenderson, C. L. and W. G. Bergen. 1975. An assessment of essential amino acid
requirements of growing steers. J. Anim. Sci. 41: 1759.
Fingar, D. C., S. Salama, C. Tsou, E. Harlow, and J. Blenis. 2002. Mammalian cell size is
controlled by mTOR and its downstream targets S6K1 and 4EBP1/eIF4E. Genes
Dev. 16: 1472-1487.
Gelinas, J. N. et al. 2007. ERK and mTOR signaling couple beta-adrenergic receptors to
translation initiation machinery to gate induction of protein synthesis-dependent
long-term potentiation. J. Biol. Chem. 282: 27527-27535.
Grass, G. M., and R. R. Unangst. 1972. Glycerol tristearate and higher fatty acid mixture
for improving digestive absorption. In: U. S. Patent (ed.) No. US3655864 A.
Hay, N. 2005. The Akt-mTOR tango and its relevance to cancer. Cancer cell 8: 179-183.
Hay, N., and N. Sonenberg. 2004. Upstream and downstream of mTOR. Genes Dev. 18:
1926-1945.

Texas Tech University, Jessica O. Baggerman, December 2014
26
Hershey, J. W. B., and W. C. Merrick. 2000. Pathway and mechanism of initiation of
protein synthesis. In: M. B. Mathews (ed.) Translational Control of Gene
Expression. p 33-88. Cold Spring Harbor Laboratory Press, Cold Spring Harbor,
NY.
Johnson, B. J. et al. 1998. Activation state of muscle satellite cells isolated from steers
implanted with a combined trenbolone acetate and estradiol implant. J. Anim. Sci.
76: 2779-2786.
Johnston, D. M., D. F. Stewart, W. G. Moody, J. Boling, and J. D. Kemp. 1975. Effect of
breed and time on feed on the size and distribution of beef muscle fiber types. J.
Anim. Sci. 40: 613-620.
Jones, S. J., D. L. Starkey, C. R. Calkins, and J. D. Crouse. 1990. Myofibrillar protein
turnover in feed-restricted and realimented beef cattle. J. Anim. Sci. 68: 2707-
2715.
Kim, N. K., J. H. Lim, M. J. Song, O. H. Kim, B. Y. Park, M. J. Kim, I. H. Hwang, and
C. S. Lee. 2008. Comparisons of longissimus muscle metabolic enzymes and
muscle fiber types in Korean and western pig breeds. Meat Sci. 78: 455-460.
Kimball, S. R. 2006. Interaction between the AMP-activated protein kinase and mTOR
signaling pathways. Med. Sci. Sports Exerc. 38: 1958-1964.
Klemesrud, M. J., T. J. Klopfenstein, and A. J. Lewis. 2000. Metabolizable methionine
and lysine requirements of growing cattle. J. Anim. Sci. 78: 199-206.
Texas Tech University, Jessica O. Baggerman, December 2014
27
Kuang, S., K. Kuroda, F. Le Grand, and M. A. Rudnicki. 2007. Asymmetric self-renewal
and commitment of satellite stem cells in muscle. Cell. 129: 999-1010.
Lai, K. M. et al. 2004. Conditional activation of akt in adult skeletal muscle induces rapid
hypertrophy. Mol. Cell. Biol. 24: 9295-9304.
Li, J. et al. 2011. Evidence of heterogeneity within bovine satellite cells isolated from
young and adult animals. J. Anim. Sci. 89: 1751-1757.
Lowell, B. B., N. B. Ruderman, and M. N. Goodman. 1986. Evidence that lysosomes are
not involved in the degradation of myofibrillar proteins in rat skeletal muscle.
Biochem. J. 234: 237-240.
Mauro, A. 1961. Satellite cell of skeletal muscle fibers. J. Biophys. Biochem. Cytol. 9:
493-495.
Merchen, N. R., and E. C. Titgemeyer. 1992. Manipulation of amino acid supply to the
growing ruminant. J. Anim. Sci. 70: 3238-3247.
Montagne, J. et al. 1999. Drosophila S6 Kinase: A Regulator of Cell Size. Science 285:
2126-2129.
Moss, F. P., and C. P. Leblond. 1971. Satellite cells as the source of nuclei in muscles of
growing rats. Anat. Rec. 170: 421-435.
Naiki, T., E. Saijou, Y. Miyaoka, K. Sekine, and A. Miyajima. 2007. TRB2, a mouse
Tribbles ortholog, suppresses adipocyte differentiation by inhibiting AKT and
C/EBPbeta. J. Biol. Chem. 282: 24075-24082.

Texas Tech University, Jessica O. Baggerman, December 2014
28
Owusu-Apenten, R. 2010. Bioactive Peptides: Applications for Improving Nutrition and
Health. CRC Press, Boca Raton, FL.
Papas, A. M., C. J. Sniffen, and T. V. Muscato. 1974. Effectiveness of rumen-protected
methionine for delivering methionine postruminally in dairy cows. J. Dairy Sci.
67: 545-552.
Pende, M. et al. 2004. S6K1-/-/S6K2-/- Mice Exhibit Perinatal Lethality and Rapamycin-
Sensitive 5'-Terminal Oligopyrimidine mRNA Translation and Reveal a Mitogen-
Activated Protein Kinase-Dependent S6 Kinase Pathway. Mol. Cell. Biol. 24:
3112-3124.
Reiling, J. H., and D. M. Sabatini. 2006. Stress and mTORture signaling. Oncogene 25:
6373-6383.
Richardson, C. R., and E. E. Hatfield. 1978. The limiting amino acids in growing cattle.
J. Anim. Sci. 46: 740-745.
Rogers Jr., G. W., A. A. Komar, and W. C. Merrick. 2002. eIF4A: The godfather of the
DEAD box helicases. Prog. Nucleic Acid Res. Mol. Biol. 72: 307-331.
Sanchez, A. M. J. et al. 2012. The role of AMP-activated protein kinase in the
coordination of skeletal muscle turnover and energy homeostasis. Am. J. Physiol.
Cell Physiol. 303: C475-C485.
Sarbassov, D. D. et al. 2006. Prolonged rapamycin treatment inhibits mTORC2 assembly
and Akt/PKB. Mol. Cell. 22: 159-168.
Texas Tech University, Jessica O. Baggerman, December 2014
29
Seale, P. et al. 2000. Pax7 is required for the specification of myogenic satellite cells.
Cell 102: 777-786.
Shaw, R. J. 2008. mTOR signaling: RAG GTPases transmit the amino acid signal. Trends
in Biochem. Sci. 33: 565-568.
Shima, H. et al. 1998. Disruption of the p70S6k/p85S6k gene reveals a small mouse
phenotype and a new functional S6 kinase. EMBO J. 17: 6649-6659.
Sibbald, I. R., T. C. Loughheed, and J. H. Linton. 1964. A methionine supplement for
ruminants. In: 2nd World Conf. Anim. Prod.
Song, K., S. C. Cornelius, M. Reiss, and D. Danielpour. 2003. Insulin-like growth factor-
I inhibits transcriptional responses of transforming growth factor-beta by
phosphatidylinositol 3-kinase/Akt-dependent suppression of the activation of
Smad3 but not Smad2. J. Biol. Chem. 278: 38342-38351.
Suryawan, A. et al. 2007. Activation by insulin and amino acids of signaling components
leading to translation initiation in skeletal muscle of neonatal pigs is
developmentally regulated. Am. J. Physiol. Endocrinology and metabolism 293:
E1597-1605.
Tato, I., R. Bartrons, F. Ventura, and J. L. Rosa. 2011. Amino acids activate mammalian
target of rapamycin complex 2 (mTORC2) via PI3K/Akt signaling. J. Biol. Chem.
286: 6128-6142.

Texas Tech University, Jessica O. Baggerman, December 2014
30
Titgemeyer, E. C., N. R. Merchen, and L. L. Berger. 1988. Estimation of lysine and
methionine requirements of growing steers fed corn silage-based or corn-based
diets. J. Dairy Sci. 71: 421-454.
Toniolo, L. et al. 2005. Expression of eight distinct MHC isoforms in bovine striated
muscles: evidence for MHC-2B presence only in extraocular muscles. J. Exp.
Biol. 208: 4243-4253.
Trenkle, A., D. L. DeWitt, and D. G. Topel. 1978. Influence of age, nutrition and
genotype on carcass traits and cellular development of the M. Longissimus of
cattle. J. Anim. Sci. 46: 1597-1603.
Van Soest, P. J. 1994. Nutritional Ecology of the Ruminant. 2nd ed. Cornell University
Press, Ithaca, NY.
Wagner, I., and H. Musso. 1983. New Naturally Occurring Amino Acids. Angewandte
Chemie International Edition in English 22: 816-828.
Wegner, J. et al. 2000. Growth- and breed-related changes of muscle fiber characteristics
in cattle. J. Anim. Sci. 78: 1485-1496.
Weichhart, T. 2012. Mammalian Target of Rapamycin: A Signaling Kinase for Every
Aspect of Cellular Life. In: T. Weichart (ed.) mTOR: Methods and Protocols. p 1-
14. Springer, New York.
Wilhelm, J. E., and C. A. Smibert. 2005. Mechanisms of translational regulation in
Drosophila. Biol Cell. 97: 235-252.

Texas Tech University, Jessica O. Baggerman, December 2014
31
Wu, G. 2009. Amino acids: metabolism, functions, and nutrition. Amino acids 37: 1-17.
Wullschleger, S., R. Loewith, and M. N. Hall. 2006. TOR signaling in growth and
metabolism. Cell 124: 471-484.
Yang, X. et al. 2008. The mammalian target of rapamycin-signaling pathway in
regulating metabolism and growth. J. Anim. Sci. 86: E36-50.
Zammitt, P. S. et al. 2006. Pax7 and myogenic progression in skeletal muscle satellite
cells. J. Cell Sci. 199: 1824-1832.

Texas Tech University, Jessica O. Baggerman, December 2014
32
CHAPTER III
THE IMPACT OF ENCAPSULATED AMINO ACIDS ON POST-NATAL
SKELETAL MUSCLE GROWTH AND DEVELOPMENT IN FEEDLOT STEERS
Abstract
The purpose of the experiment was to evaluate the effect of encapsulated amino
acids on skeletal muscle growth and development in feedlot steers. Continental crossbred
steers (n = 20; 457 ± 58 kg) were stratified by BW and randomly assigned to 4 pens (2
pens/treatment; 2 pens/block; 5 steers/pen). Treatments were 1) 0 grams of encapsulated
methionine and 4 grams of encapsulated lysine (0Met) per head per day, and 2) 8 grams
of encapsulated methionine and 4 grams of encapsulated lysine (8Met) per head per day.
Treatments were topdressed daily at time of feeding. Individual BW, longissimus muscle
biopsies, and feed refusals were collected on d 0, 14, 28, 42, and 56. The muscle biopsies
were analyzed using PCR, Western blotting, SDS-PAGE, and immunohistochemistry.
There was no difference in ADG or feed efficiency for either treatment for the d 0 to d 56
period (P > 0.05). The 8Met carcasses tended to have heavier hot carcass weights (P =
0.091), less 12th rib fat (P = 0.068), and a greater amount of kidney/pelvic/heart fat (P =
0.091). The gene expression of eIF4EBP1 tended to increase in the 8Met treatment (P =
0.053). There was a day effect for expression of AKT, AMPKα, IGF-I, MHC-I, MHC-
IIA, MHC-IIX, and RAGA (P < 0.05). AKT protein expression in the 8Met treatment
was decreased compared with the 0Met group (P < 0.05). 0Met cattle tended to have
increased eIF4EBP1 (P = 0.062) and Raptor (P = 0.070) protein expression. There was a
day effect for AMPKα, eIF4EBP1, MHC-I, MHC-II, pAMPKα, RAGA, and Raptor

Texas Tech University, Jessica O. Baggerman, December 2014
33
protein expression (P < 0.001). Our results indicated treatment by day interactions were
present for muscle fiber type distribution and cross-sectional area, and density of Myf5
positive satellite cells (P < 0.001). Cross-sectional area increased from d 0 to d 56
regardless of treatment. There was a tendency for an interaction for PAX7+Myf5
positive satellite cells (P = 0.076), and both treatments showed a decrease in density on d
42 and 56. We observed a greater density of PAX7 positive satellite cells in 8Met cattle
(P < 0.05). While there was an interaction of treatment and day (P < 0.05), there was no
difference in density of nuclei in either treatment from d 0 to d 56, however density of
nuclei associated with muscle fibers increased from d 0 to 56. Supplementing
encapsulated methionine during the finishing phase had an impact on factors involved in
mTOR signaling and the potential for muscle growth, however the magnitude of this
impact needs further evaluation.
Introduction
There has been much previous research investigating the effects of limiting amino
acids in growing beef cattle (Merchen and Titgemeyer, 1992). These studies suggest that
in cattle fed a concentrate-based diet, lysine is the most limiting amino acid with
methionine the second limiting amino acid, and in a forage based diet, methionine is the
most limiting with lysine the second limiting (Richardson and Hatfield, 1978; Titgemeyer
et al., 1988). When considering supplementing amino acids to growing beef cattle, the
amino acids must be protected in some fashion, such as encapsulation, from ruminal
fermentation and ruminal microbial consumption for the beef animal to be able to absorb
the amino acids to utilize them for potential growth. In addition to being the most

Texas Tech University, Jessica O. Baggerman, December 2014
34
limiting amino acids in cattle, lysine and methionine are also crucial amino acids for
muscle synthesis (Fetuga et al., 1975; Friesen et al., 1994).
The regulation of skeletal muscle growth is a multifaceted, complex process
controlled through many signaling cascades. One major process involved in muscle
growth is the mammalian target of rapamycin (mTOR) signaling pathway. This pathway
is important for cellular growth. While it is understood how many factors, such as IGF-I
through the PI3K signaling pathway, play a role in regulation of mTOR signaling, the
manner in which others, such as amino acids, have an effect on mTOR, specifically
mTOR complex 1 (mTORC1) and its upstream and downstream factors, is still unclear
(Yang et al., 2008). Previous research has suggested that amino acids may regulate
mTORC1 through Rag GTPases (RAG) which stimulate mTORC1. The transcription
factor eIF4E and its binding protein eIF4EBP1, which are downstream of mTORC1, are
then stimulated by mTORC1 (Hay and Sonenberg, 2004; Shaw, 2008). By stimulating
these eIF4E in the mTOR signaling cascade, an increase in transcription can happen. An
increase in eIF4EBP1 can decrease transcription, however phosphorylation of this
binding protein can cause release of eIF4E. Impacting eIF4E and its binding protein can
cause changes in cellular growth.
This increase in growth can cause a shift in muscle fiber types and satellite cell
populations. As an animal ages, muscle fiber cross-sectional area increases, and the
predominant fiber type transitions from smaller, slow twitch, oxidative fiber types to
larger, fast twitch, glycolytic fiber types (Johnston, et at., 1975; Joubert, 1956; Tuma et
al., 1962; Wegner et al., 2000). In order to support this increase in protein, more nuclei

Texas Tech University, Jessica O. Baggerman, December 2014
35
must be incorporated into the muscle fiber to manage the protein to DNA ratio (Moss and
Leblond, 1971). The number of nuclei associated with satellite cells has been shown to
decrease from 30% of total skeletal muscle nuclei in newborn animals to 2 to 10% in
adults (Cardasis and Cooper, 1975). Satellite cells express a series of myogenic
regulatory factors as they leave quiescence and begin the process of proliferation and
differentiation. Among these factors are paired box protein 7 (PAX7) and myogenic
factor 5 (Myf5). It has been found that PAX7 is expressed during differentiation of
satellite cells in vitro and in proliferating satellite cells (Seale et al., 2000; Zammitt et al.,
2006). While it is known that Myf5 is expressed after PAX7 expression begins, less is
known about the role of Myf5 in satellite cells. It is hypothesized that Myf5 is involved
in satellite cell proliferation (Zammitt et al., 2006). These two myogenic regulatory
factors are important in the process of satellite cells fusing into the muscle fiber to
support hypertrophy. While muscle fiber characteristics and satellite cell populations
have been studied at the time of harvest in young cattle and adult cattle (Li et al., 2011),
there is limited research investigating the change of these factors in the same individual
animals over time. The objective of this study was to investigate the role of encapsulated
lysine and methionine supplementation on the mTOR signaling pathway and skeletal
muscle growth and development in feedlot steers over a 56 d period during the finishing
phase.
Materials and Methods
The experimental protocol (IACUC #14008-01) was approved by the Texas Tech
University Animal Care and Use Committee.

Texas Tech University, Jessica O. Baggerman, December 2014
36
Animals
Crossbred beef steers (n = 20, 457 ± 48 kg) were obtained from a commercial
backgrounding facility. Steers were received at the Texas Tech University Beef Center at
New Deal, TX and processed after arrival. Steers were given an individual ear tag for
identification. Steers were adapted to a finishing diet prior to initiation of the trial. The
diet was formulated to meet or exceed the requirements as stated by tabular values
(NRC, 2000) and consisted of steam flaked corn (75.24%), cottonseed hulls (5.95%),
cottonseed meal (4.71%), chopped alfalfa hay (3.93%), cane molasses (3.84%), TTU
mineral supplement (1.97%), fat (1.96%), limestone (1.26%), and chromium propionate
supplement (0.25%) (Table 1.1). The diet was manufactured daily, and supplied once
daily at 0900 h ad libitum throughout the experiment. Trained personnel observed the
animals daily to check for symptoms of illness or lameness, and no animals were
removed from the study.
Experimental Design, Treatments, and Pen Assignment
Steers were weighed 7 d before initiation of the experiment and stratified into 2
blocks based on body weight. Each block had 2 pens (5 steers per pen). Each pen within
block was randomly assigned to treatment: 1) 0 grams of encapsulated methionine (0Met)
and 4 grams of encapsulated lysine per head per day; 2) 8 grams of encapsulated
methionine (8Met) and 4 grams of encapsulated lysine per head per day. To meet the
target dosages, the cattle received 13.30 g of lysine supplement (LysiPEARLTM, Kemin
Amimal Nutrition and Health North America, Des Moines IA), which had 6.4 g of L-
lysine, with an estimated ruminal bypass rate of 50% and 95% digestibility (Rounds,

Texas Tech University, Jessica O. Baggerman, December 2014
37
2011). The 8Met treatment also received 24.48 g of methionine supplement
(MetiPEARLTM, Kemin Animal Nutrition and Health North America), containing 13.4 g
of DL-methionine and having an estimated ruminal bypass rate of 66% and digestibility
of 90% (Rounds, 2011). The treatments were blended with ground corn as a carrier every
28 d, and 0.23 kg/hd/d of the appropriate treatment was topdressed on the ration in the
bunk at time of feeding daily.
On d 0, steers were individually weighed in a certified squeeze chute and a
longissimus muscle biopsy was taken. This procedure was repeated at approximately
0800 h on d 14, 28, 42, and 56. The pen order for the biopsy procedure remained the
same throughout the trial. Feed samples were taken weekly to determine DM diet
composition and composites were shipped to a commercial laboratory for nutrient
analysis. After biopsies were collected, steers were returned to their home pens and the
feed ration with the topdressed treatment was made available. Trained TTU personnel
collected carcass data at the time of slaughter at a commercial facility. The
characteristics measured were hot carcass weight, loin muscle area, 12th rib fat thickness,
KPH fat, UDSA yield grade, and marbling score.
Biopsy Procedure
The biopsy procedures took place in the Burnett Center at the Texas Tech
University New Deal Farm. The animals were secured in a hydraulic squeeze chute,
where their backs were shaved with electric clippers and disposable razors. The site was
washed with water and Betadine surgical scrub (7.5% povidone iodine, Purdue Products,
L.P., Stamford, CT), rinsed with 70% ethanol, shaved with a disposable razor again, and

Texas Tech University, Jessica O. Baggerman, December 2014
38
scrubbed with water and Betadine surgical scrub and rinsed with 70% ethanol for a
second time. A local anesthetic (lidocaine HCl; 20 mg/mL; 8 mL per biopsy) was
injected into the subcutaneous fat layer, in a 6 cm2 diamond-shaped pattern (4 injection
sites, 2 mL lidocaine HCl per site), and was given a minimum of 5 min to numb the area.
The area was rinsed with 70% ethanol and sterile gauze was used to protect the area until
a 1 cm long incision was made with a sterile scalpel. A sterile 4-mm diameter Bergstrom
biopsy needle was then used to collect approximately 2 g of longissimus tissue. The
extracted tissue was placed on a sterile gauze pad in a plastic container with a protective
lid to be taken to the sample preparation area. The incision was then sealed using
VetBond (3M Animal Care Products, St. Paul, MN). The incision site was sprayed with
AluShield (Neogen Corp., Lexington, KY) to protect the incision during the healing
process and prevent infection.
Each sample was then divided into three fractions. One fraction was designated
for gene expression analysis by RT-QPCR and placed in a Whirl-Pak (Nasco, Fort
Atkinson, WI) and snap frozen in LN2. Another fraction for protein analysis by SDS-
PAGE and Western blotting was also placed in a Whirl-Pak (Nasco) and snap frozen in
LN2. These two samples were placed in a cooler with dry ice for storage until
transportation back to Texas Tech University. The third fraction was used for
immunohistochemical staining. The sample was analyzed under a magnifying glass and
muscle fibers were identified in the sample. The fibers were placed parallel to each other
on a 1 cm by 1.5 cm piece of cork board and frozen in clear frozen section compound
(VWR International, West Chester, PA) using isopentane cooled using dry ice. The

Texas Tech University, Jessica O. Baggerman, December 2014
39
samples on the cork pieces were then placed in Whirl-Paks (Nasco) and stored in a cooler
with dry ice until transportation to Texas Tech University, where all samples were stored
at -80°C until processing. Steers were monitored for 72 hours post-biopsy for
inflammation or infection of the incision site. No steers exhibited signs of inflammation
or infection. The biopsy procedure was performed on d 0, 14, 28, 42, and 56, and the
incision site was alternated between both sides of the animal starting approximately at the
11th-12th rib interface and moving anterior to the next rib interface on consecutive biopsy
dates.
RNA Isolation and RT-QPCR
RNA was isolated from the designated longissimus biopsy sample fraction using
ice-chilled TRI-reagent (Sigma, St. Louis, MO). The sample, approximately 0.5 g, was
homogenized in liquid N2 and 3 mL of TRIreagent was added once the N2 evaporated.
When the TRI-reagent came to room temperature, the liquid was split between two
microcentrifuge tubes, forming duplicate samples, and 0.2 mL of chloroform was added
to each tube. The tubes were vortexed and centrifuged at room temperature and 15,000 ×
g for 15 min. The upper aqueous layer was extracted and transferred to a new
microcentrifuge tube. One half mL of cold isopropanol was added to each tube, then
vortexed and centrifuged at 15,000 × g for 10 min at room temperature. The supernatant
was carefully decanted as to not disturb the pellet, and 0.5 mL of 75% ethanol was added
to each tube. Samples were stored at -80°C until further processing. To measure the
concentration of RNA extracted, one microcentrifuge tube was allowed to thaw at room
temperature. The samples were then centrifuged at 15,000 × RPM for 10 min at room

Texas Tech University, Jessica O. Baggerman, December 2014
40
temperature. The 75% ethanol was then carefully poured off and the pellet was allowed
to air dry. The pellet was then dissolved in 20 µL of nuclease-free water and
concentration of RNA was determined by spectrophotometry at an absorbance of 260 nm
with a NanoDrop 1000 (NanoDrop Products, Wilmington, DE). RNA samples were
purified using an Ambion DNA-free kit (Life Technologies, Grand Island, NY). One µg
of total RNA was then used for reverse transcription to form cDNA. Real-time
quantitative polymerase chain reaction (RT-QPCR) was then performed using the cDNA
to measure the relative expression of Rag GTPase A (RAGA), AKT, AMP-activated
protein kinase alpha (AMPKα), insulin like growth factor-I (IGF-I), eukaryotic initiation
factor 4E binding protein 1 (eIF4EBP1), myosin heavy chain I (MHCI), myosin heavy
chain IIA (MHCIIA), and myosin heavy chain IIX (MHCIIX) compared with expression
of RPS9 in total mRNA. RT-QPCR was executed using a GeneAmp 7900HT Sequence
Detection System (Applied Biosystems, Life Technologies, Grand Island, NY) for 40
cycles consisting of 15 s at 95°C and 1 min at 60°C.
Protein Extraction, Western Blotting, and Myosin Heavy Chain SDS-PAGE
The fraction for total protein was processed to isolate total soluble protein using
whole muscle extraction buffer (WMEB; 2% sodium dodecyl sulfate, 10 mM phosphate,
pH 7.0). Five mL of WMEB was added to 1 g of longissimus biopsy sample and
homogenized. The homogenate was then centrifuged at 1,500 × g for 15 min at room
temperature. The middle aqueous layer was pipetted into microcentrifuge tubes.
Concentration of the protein samples was determined using a PierceTM BCATM protein
assay kit (ThermoFisher Scientific) and a NanoDrop 1000 spectrophotometer (NanoDrop

Texas Tech University, Jessica O. Baggerman, December 2014
41
Products). All samples were diluted to the same concentration using WMEB. Western
blot samples were prepared with modified Wangs Tracking Dye, and myosin heavy chain
samples were prepared using Myosin Heavy Chain Tracking Dye and β-mercaptoethanol
to denature the samples.
For Western blotting, samples were loaded into precast Novex 4 to 12% Bis-Tris
gels (Invitrogen, Grand Island, NY) and run for 35 min at 165V and 24 mA to separate
proteins. The proteins were then transferred onto a nitrocellulose membrane (Invitrogen)
for 7 min using an iBlot transfer device (Life Technologies). The membranes were
incubated in a blocking solution of 1X Tris buffered saline (TBS) and 5% non-fat dry
milk (BIO RAD, Herculese, CA) in 1 h at room temperature to block non-specific
antibody binding. After blocking, a solution of TBS-Tween and the appropriate primary
antibody: 1:2000 α-RAGA, rabbit, IgG (Abcam), 1:2500 α-AKT, rabbit, IgG (Abcam,
Cambridge, MA); 1:1000 α-AMPKα, rabbit, IgG (Cell Signaling Technology, Danvers,
MA); 1:1000 α-phosphorylated AMPKα (pAMPKα), rabbit, IgG (Cell Signaling
Technology); 1:2500 α-Raptor, rabbit, IgG (Abcam); or 1:1000 α-eIF4EBP1, rabbit, IgG
(Abcam); and allowed to incubate overnight at 4°C on a rocker plate. The membranes
were then rinsed three times with TBS-Tween for 10 minutes each at room temperature.
Secondary antibody, comprised of 1:2000 goat α-rabbit, IgG, Alexa-Fluor 633
(Invitrogen) in TBS-Tween, was applied and membranes were incubated for in the dark 1
hr at room temperature. The membranes were rinsed three times with TBS-Tween for 10
minutes each in the dark at room temperature. The membranes were then dried in the
dark and imaged using Imager Scanner II and ImageQuant TL software, and

Texas Tech University, Jessica O. Baggerman, December 2014
42
densitometry measurements were taken on the bands corresponding to RAGA, AKT,
AMPKα, pAMPKα, Raptor, and eIF4EBP1 based on a molecular weight standard
reference run alongside the samples (Precision Plus ProteinTM All Blue Standards; BIO
RAD).
To analyze expression of myosin heavy chain protein, 4 to 6% polyacrylamide
gels were cast and allowed to polymerize overnight. The myosin heavy chain protein
samples were incubated at 95°C for 5 min and then loaded into the gel and run for 30 h at
100V. The gels were removed from the cassette and placed in Coomassie® Fluor Orange
(Life Technologies) and incubated for 30 min at room temperature in the dark. The gels
were rinsed in 7.5% acetic acid and then incubated in NanoPure water for 5 min in the
dark at room temperature. Gels were then imaged using Imager Scanner II and
ImageQuant TL software and densitometry measurements were taken on the bands
representing MHC-I and MHC-II.
Immunohistochemical Analysis
Embedded samples for immunohistochemical staining to determine muscle fiber
distribution, area, and satellite cell quantity were moved from -80°C to -20°C to thaw for
24 h. Samples were removed from the cork and cut into 10 µm-thick cross sections at -
20°C with a Leica CM1950 cryostat (Leica Biosystems, Buffalo Grove, IL) and placed
on positively charged glass slides (4 slides per sample, 5 cross sections per slide;
Superfrost Plus, VWR International). Cross sections were fixed with 4%
paraformaldehyde in phosphate buffered saline (PBS) (Thermo Fisher Scientific) for 10
min at room temperature, then rinsed briefly twice in PBS followed by one 10 min rinse

Texas Tech University, Jessica O. Baggerman, December 2014
43
in PBS at room temperature. A blocking solution consisting of 2% bovine serum
albumin (MO Biomedical, Solon, OH), 5% horse serum (Invitrogen), and 0.2% Triton-X
100 (ThermoFisher Scientific) in PBS was then applied to the fixed cross sections and
allowed to incubate for 30 min at room temperature to prevent non-specific antibody
binding. The cross sections were incubated with primary antibodies in blocking solution
for 1 hr at room temperature. The following primary antibodies were used: slide 1- 1:100
α-dystrophin, rabbit, IgG (Thermo Scientific); 1:100 supernatant anti-myosin heavy chain
(MHC) type 1, IgG2b (BA-D5; Developmental Studies Hybridoma Bank, University of
Iowa, Iowa City, IA); and supernatant anti-MHC all but type IIX IgG1 (BF-35,
Developmental Studies Hybridoma Bank); and slide 2- 1:10 supernatant anit-PAX7,
mouse α-chicken (Developmental Studies Hybridoma Bank); 1:100 Myf-5, rabbit, IgG
(Santa Cruz Biotechnology, Dallas, TX). The cross sections were rinsed in PBS for 5
min at room temperature 3 x. The following secondary antibodies in blocking solution
were then applied to the cryosections for 30 min at room temperature in the dark: slide 1:
1:1,000 goat α-rabbit, IgG, Alexa-Fluor 488 (Invitrogen); 1:1,000 goat α-mouse, IgG1,
Alexa-Fluor 546 (Invitrogen); 1:1,000 goat α-mouse, IgG2b, Alexa-Fluor 633
(Invitrogen); and slide 2: 1:1,000 goat α-rabbit, IgG, Alexa-Fluor 488 (Invitrogen);
1:1,000 goat α-mouse, IgG1, Alexa-Fluor 546 (Invitrogen). Following the incubation
period, the slides were rinsed 3 x with PBS for 5 min at room temperature. The slides
used for muscle fiber type and area were then cover-slipped using thin glass cover slips
(VWR International) and ProLong® Gold with 4’6-diamidino-2-phenylindole (DAPI)
mounting media (Life Technologies) and allowed to cure in the dark for 36 h at room

Texas Tech University, Jessica O. Baggerman, December 2014
44
temperature. Slides used for satellite cell abundance were incubated with 1 µg/mL DAPI
(ThermoFisher Scientific) for 1 min then rinsed twice briefly in PBS. The slides were
then cover-slipped with AquaMount mounting media (Lerner Laboratories, Pittsburgh,
PA) and thin glass cover slips (VWR International) and cured for 24 h at 4°C in the dark.
All slides of were imaged within 48 h after curing. The slides were imaged at 200x
magnification with an inverted fluorescence microscope (Nikon Eclipse, Ti-E; Nikon
Instruments Inc., Mellville, NY) using a UV light source (Nikon Intensilight Inc.; C-
HGFIE), and images were taken using a CoolSnap ES2 monochrome camera. The
images were then artificially colored and analyzed with NIS Elements® Imaging
software.
Statistical Analysis
All statistical analysis was performed using SAS version 9.3 (SAS Institute, Inc.,
Cary, NC). For feedlot performance data, pen was experimental unit, block was a
random effect, and treatment was the mixed effect. For all other data, animal served as
the experimental unit, and the random effect of block and fixed effect of treatment were
used. Day was used as a repeated measure for the gene expression, protein expression,
and immunohistochemical analysis data. The Kenward-Roger adjustment was used to
correct the degrees of freedom for all data. The MIXED procedure (PROC MIXED) was
used to analyze feedlot performance, carcass characteristics, gene expression, and protein
expression data. The GLIMMIX procedure (PROC GLIMMIX) was used to analyze the
immunohistochemical data with the LSMEANS procedure and PDIFF option to separate

Texas Tech University, Jessica O. Baggerman, December 2014
45
means. Means were determined to be significantly different when P ≤ 0.05. When P ≤
0.10, a tendency was declared.
Results and Discussion
Live and carcass performance
There was no difference between the treatments for average daily gain (P > 0.05)
for d 0 to d 56, however a significant increase in average daily gain for 8Met cattle
compared with 0Met cattle for the d 42-56 period (P < 0.05) was observed. Feed to gain
followed that pattern, with no difference in feed to gain ratio for the entire feeding period
(P > 0.05), but during d 42 to d 56 the 8Met group tended to have a more efficient feed to
gain ratio (P = 0.09). As shown in Table 1.2, there was no difference in dry matter intake
throughout the feeding trial, and final body weights on d 56 were not different (P > 0.05).
There was a tendency for hot carcass weights to be heavier for the 8Met treatment
(P = 0.06). The 8Met treatment also tended to have less 12th rib fat (P = 0.07) and
increased kidney/pelvic/heart fat (P = 0.09). However, as shown in Table 1.3, there were
no differences among treatments for loin muscle area, USDA yield grade, or marbling
score (P > 0.05).
Gene expression
There were no interactions between treatment and day of biopsy for gene
expression data (Table 1.4), so only main effects will be discussed. For AKT, AMPKα,
IGF-I, MHC-I, MHC-IIA, MHC-IIX, and RAGA, there was a significant day effect (P <
0.05). AKT and RAGA mRNA abundance was greatest on d 42, and abundance of

Texas Tech University, Jessica O. Baggerman, December 2014
46
AMPKα, IGF-I, MHC-I, MHC-IIA, and MHC-IIX mRNA were greatest on d 42 and 56
compared to the other sampling days. The only gene measured that was not affected by
day was eIF4EBP1 (P > 0.05), but eIF4EBP1 was impacted by treatment, with the 8Met
treatment tending to have greater levels of mRNA abundance (P = 0.053).
Protein expression
For protein expression, only main effects will be reported as there was no
interaction between day and treatment. All proteins measured a significant day response
(P < 0.001). In Western blotting (Table 1.5), AKT protein abundance was greatest on d
28; AMPKα levels were greatest for d 0, 14, and 56; eIF4EBP1 levels were greatest on d
14 and 28; pAMPKα abundance was greatest on d 0 and 42; Raptor expression was
greatest on d 42; and RAGA expression was greatest on d 28 and 42. AKT abundance
was significantly altered (P < 0.05) by treatment, with the 8Met treatment having less
AKT protein concentration compared with the 0Met group. There was a tendency for
eIF4EBP1 protein abundance to be greater for the 0Met treatment (P = 0.062) as well as
for Raptor (P = 0.07). As shown in Table 1.6, supplementing with methionine did not
change the amount of MHC-I and MHC-II proteins as measured by SDS-PAGE (P >
0.05).
Immunohistochemistry
Interactions of sampling day and treatment were observed in most of the aspects
studied using immunohistochemistry. There was a significant day by treatment
interaction for the distribution of MHC-I, MHC-IIA, and MHC-IIX fibers (P < 0.05)

Texas Tech University, Jessica O. Baggerman, December 2014
47
(Figure 1.1). The percentage of MHC-I fibers was greatest on d 0 and least on d 42 and
56 for the 0Met group and greatest on d 42 and least on d 56 in the 8Met group. For
MHC-IIA fibers, the 0Met treatment was greatest on d 14 and least on d 28, while the
8Met treatment was greatest on d 42, 14, and 56 and least on d 28. The percentage of
MHC-IIX fibers in the 0Met treatment was greatest on d 56 and least on d14 and for the
8Met treatment greatest on d 56 and least on d 42.
As shown in Figure 1.2, there was a treatment by day interaction for the cross-
sectional area of the muscle fibers (P < 0.001). The cross-sectional area of type I fibers
was greatest on d 56 and least on d 0 for the 0Met treatment and greatest on d 56 and
least on d 28 of the 8Met treatment. For the type IIA fibers, the 0Met treatment had the
greatest cross-sectional area on d 42 and least on d 0 and 14, and the 8Met group had the
greatest cross-sectional area on d 56 and the least on d 28. The 0Met treatment cross-
sectional areas were greatest on d 42 and least on d 0 and 28, while the 8Met treatment
cross-sectional areas were greatest on d 56 and least on d 28.
As shown in Figure 1.3, here was no interaction of day and treatment for the
density of PAX7 positive satellite cells (P > 0.05), but there was both a significant
treatment effect (P < 0.05) and day effect (P < 0.001). The 8Met treatment had a greater
density of PAX7 positive cells compared with the 0Met treatment. The greatest density
of PAX7 satellite cells on d 42 and least on d 0, 14, 28. There was a significant treatment
by day interaction for the density of Myf5 positive satellite cells (P < 0.001). The
greatest density of Myf5 positive cells for the 0Met cattle was on d 0 and 14 and least on
d 42 and 56, and the 8Met group had the greatest density of Myf5 positive cells on d 0

Texas Tech University, Jessica O. Baggerman, December 2014
48
and the least on d 42 and 56. For the density of cells positive for both PAX7 and Myf5,
there was a tendency for an interaction of day and treatment (P = 0.08). The density of
dual positive cells was greatest on d 0 and least on d 42 and 56 for 0Met cattle and
greatest on d 0 and least on d 56 for the 8Met treatment. There was a significant
treatment by day interaction for the density of nuclei (Figure 1.4; P < 0.001); the density
of nuclei on d 0 was not different than on d 56 for both treatments. However the number
of nuclei not associated with satellite cells increased from d 0 to d 56 for the 0Met and
8Met treatments (P = 0.002).
The results from live performance of no overall effect on final BW agree with
others stating there was no impact on performance when complete feedlot rations were
supplemented with ruminally protected lysine and methionine (Hussein and Berger,
1995). This lack of performance improvement could be due to the fact of the experiment
diets were not limiting in lysine and methionine concentration, or that the levels of lysine
and methionine supplemented in the present study were lower than required for a
measurable impact, as levels fed in the present study are lower than previous studies
(Merchen and Titgemeyer, 1992; Titgemeyer et al., 1988). However, we observed a
significant improvement in average daily gain and feed efficiency for 8Met cattle during
the d 0 to 14 period. After d 14, no difference was observed between treatements for
gains or feed efficiency. There was a tendency for an improvement in gains and feed to
gain ratio for the last two weeks of the trial in the 8Met, agreeing with data reporting
cattle supplemented with ruminally-protected amino acids showed similar improvements
in the last 98 d of a 266 d trial (Hussein and Berger, 1995). This suggested that the

Texas Tech University, Jessica O. Baggerman, December 2014
49
experimental period was not long enough to see a significant performance benefit. The
tendency for increased hot carcass weights in the 8Met agrees numerically with Hussein
and Berger (1995), but not with other data showing a numerical decrease in hot carcass
weight as levels of supplemental rumen-protected amino acids increased (Wright and
Loerch, 1988). Previous work from our lab showed an increase in hot carcass weight in
cattle supplemented with 12 g/hd/d of ecapsulated lysine and 4 g/hd/d of encapsulated
methionine for 134 d (Hosford et al., 2014). This once again indicates that the trial
length was not long enough to measure a significant response in hot carcass weight. The
tendency for decreased 12th rib fat for the 8Met cattle yet no difference in USDA yield
grade can be attributed to variation in loin muscle area.
The day effect on mRNA abundance of AKT, AMPKα, IGF-I, MHC-I, MHC-IIA,
MHC-IIA, and RAGA as well as the protein expression of all proteins measured was
expected as days on feed increased. The increase of gene expression of eIF4EBP1 in
8Met cattle suggests methionine is increasing the expression of eIF4EBP1, a regulator of
transcription. Conversely, there is a tendency for decreased expression of eIF4EBP1
protein in 8Met cattle, suggesting there is something blocking the translation of the
protein or that there is possibly a change in the amount of eIF4EBP1 binding to eIF4
family members. eIF4EBP1, downstream of mTORC1, binds to eIF4E to prevent
transcription, and eIF4E is released from its binding protein when eIF4EBP1 is
phosphorylated. In L6 myoblasts, leucine was shown to stimulate the level of
phosphorylation of eIF4EBP1 as well as increase the expression of eIF4E, leading to an
increase in potential for hypertrophy (Kimball, 1999). Raptor expression tended to

Texas Tech University, Jessica O. Baggerman, December 2014
50
decrease in the 8Met group, suggesting a decrease in mTORC1, which could explain the
decrease in eIF4EBP1 with the 8Met treatment. Interestingly, the supplementation of
methionine also led to a decrease in abundance of AKT protein, a positive regulator of
mTORC1 (Hay, 2005). This decrease of AKT can lead to an increase in inhibition of
mTORC1, which could also be a contributing factor for the decrease in eIF4EBP1. In
order to determine the effect of the decrease in protein expression of AKT, eIF4EBP1,
and Raptor due to 8Met treatment, the levels of phosphorylation of these proteins would
need to be determined.
The interaction of day and methionine inclusion makes it difficult to fully
elucidate the effect of methionine on muscle fiber distribution and cross-sectional area.
The change in distribution of muscle fiber types is consistent with the growth curve of
feedlot steers. We observed fewer type I fibers on d 56 than d 0 with an increase of type
IIX fibers on d 56 compared with d 0 for both treatments. When considering fiber cross-
sectional area, there is a general increase from d 0 to d 56 for both treatments, agreeing
with the increased growth as days on feed increased. On d 56, the only significant
difference in fiber cross-sectional area between treatments was an increase in type IIA in
8Met cattle, with numerical differences in types I and IIX. This increase agrees with
previous research that revealed supplementation of 12 g of encapsulated lysine and 4 g of
encapsulated methionine increased area of MHC-IIX fibers (Hergenreder et al., 2013).
The increase in PAX7 positive satellite cells, indicating an increase in satellite cells to be
fused into the fiber, for the 8Met treatment suggests methionine supplementation is
increasing proliferation and subsequent differentiation of satellite cells (Seale et al., 2000;

Texas Tech University, Jessica O. Baggerman, December 2014
51
Zammitt et al., 2006). This in turn could explain the change in muscle hypertrophy. The
interaction of day and treatment for Myf5 positive cells should be considered, however in
both treatments there is a decrease in the density of Myf5 positive cells on d 42 and 56
compared with the previous biopsy dates. Myf5 is considered to be involved in
proliferation of satellite cells (Zammitt et al., 2006). This could be explained by an
increase in satellite cell incorporation into the muscle fiber as days on feed increased.
The increase in expression of dual positive satellite cells on d 42 and d 56 for both
treatments suggests there is an increase of PAX7 positive satellite cells that are dividing
as PAX7 positive satellite cells can produce dual positive daughter satellite cells (Kuang
et al., 2007). The combination of increased satellite cell fusion and proliferation are
indicators of potential muscle hypertrophy, as satellite cells tend to fuse into the muscle
fiber proceeding and concurrently with muscle protein synthesis (Trinkle et al., 1978).
This is supported by the increase in density of nuclei not associated with satellite cells
that have appeared to fuse into the existing muscle fiber to support post-natal skeletal
muscle hypertrophy.
Supplementation of encapsulated methionine over a 56 d period in feedlot steers
did cause changes in factors important for skeletal muscle growth and development,
especially downstream signaling factors of mTORC1 and satellite cell populations.
These changes in expression of the factors involved in mTOR signaling could impact
transcription and translation, affecting skeletal muscle hypertrophy. The evidence of
fusion of satellite cells can indicate the potential for increased rates of skeletal muscle
hypertrophy as well. However, the magnitude of these changes in skeletal muscle cannot

Texas Tech University, Jessica O. Baggerman, December 2014
52
be determined with the present study. Additional work is needed to determine the effects
of supplemental encapsulated amino acids over an extended feeding period as well as
levels of activity of signaling factors involved in skeletal muscle growth in feedlot steers.

Texas Tech University, Jessica O. Baggerman, December 2014
53
Table 1.1. Ingredient composition (%, DM basis) of the
experimental diets1
Ingredients 0Met and 8Met2
Steam-flaked corn 75.24
Cottonseed hulls 5.95
Cottonseed meal 4.71
Alfalfa hay, chopped 3.93
Molasses, cane 3.84
TTU mineral supplement3 1.97
Fat 1.96
Limestone 1.26
Chromium propionate supplement4 0.25
1Diets were formulated to meet or exceed NRC (1996) requirments
for growing – finishing beef cattle.
20Met= 0 grams of encapsulated methionine and 4 grams of
encapsulated lysine per hd/d; 8Met= 8 grams of encapsulated
methionine and 4 grams of encapsulated lysine per hd/d.
3Supplement composition (DM basis): 66.476% cottonseed meal;
15.000% salt; 10.000% potassium chloride; 4.167% ammonium
sulfate; 0.986% zinc sulfate; 0.750% Rumensin (176.4 mg/kg;
Elanco Animal Health, Indianapolis, IN); 0.648% dicalcium
phosphate; 0.563% Tylan (88.2 mg/kg; Elanco Animal Health);
0.500% Endox (Kemin Industries, Des Moines, IA); 0.333%
manganese oxide; 0.196% copper sulfate; 0.158% vitamin E (500
IU/g; DSM Nutritional Products, Inc.); 0.125% selenium premix
(0.2% Se); 0.083% iron sulfate; 0.010% vitamin A (1,000,000 IU/g;
DSM Nutritional Products, Inc., Parsippany, NJ); 0.003%
ethylenediamine dihydroiodide; and 0.002% cobalt carbonate.
Concentrations in parenthesis are expressed on a 90% DM basis.
4KemTraceTM (Kemin Industries, Des Moines, IA)

Texas Tech University, Jessica O. Baggerman, December 2014
54
Table 1.2. Effect of encapsulated amino acids on growth performance of finishing steers.
0Met1 8Met SEM P-Value
Initial BW, kg 454 458 7.8 0.66
Final BW, kg 580 579 10.2 0.91
0 to 14 d
ADG, kg 2.71a 2.33b 0.161 0.03
F:G 3.84b 4.39a 0.229 0.03
14 to 28 d
ADG, kg 1.80 1.56 0.297 0.42
F:G 7.75 8.44 1.926 0.72
28 to 42 d
ADG, kg 2.49 2.22 0.289 0.36
F:G 4.93 5.65 0.805 0.38
42 to 56 d
ADG, kg 1.96b 2.53a 0.235 0.03
F:G 5.04 5.24 0.273 0.48
0 to 56 d
ADG, kg 2.24 2.15 0.122 0.51
F:G 6.42 5.04 0.767 0.09
DMI, D 0-56, kg 11.18 11.16 0.018 0.42
10Met= 0 grams of encapsulated methionine and 4 grams of encapsulated lysine per hd/d; 8Met= 8 grams
of encapsulated methionine and 4 grams of encapsulated lysine per hd/d.

Texas Tech University, Jessica O. Baggerman, December 2014
55
Table 1.3. Effect of encapsulated amino acids on carcass characteristics of
finishing steers.
0Met1 8Met SEM P – Value
HCW, kg 369 398 14.6 0.06
LMA2, cm2 85.54 86.13 3.093 0.85
FT, cm 1.24 0.90 0.170 0.07
KPH, % 1.88 1.90 0.126 0.09
USDA Yield grade 2.71 3.16 0.348 0.21
Marbling score3 455 452 48.9 0.94
10Met = 0 grams of encapsulated methionine and 4 grams of encapsulated
lysine per hd/d; 8Met = 8 grams of encapsulated methionine and 4 grams of
encapsulated lysine per hd/d. 2LMA = loin muscle area 3Small0 = 400, Modest0 = 500

Texas Tech University, Jessica O. Baggerman, December 2014
56
Table 1.4. Effect of encapsulated amino acids on relative mRNA abundances of AKT, AMPKα, eIF4EBP1, IGF-I, MHC-I, MHC-IIA, MHC-IIX, and RAGA
genes in longissimus tissue.1
Treatment3
0Met 8Met P-Value
Gene*2 Day 0 Day 14 Day 28 Day 42 Day 56 Day 0 Day 14 Day 28 Day 42 Day 56 SEM Trt Day Trt*Day
AKT 0.82 1.00 0.52 1.17 1.18 0.64 0.75 0.64 3.33 0.77 0.859 0.440 0.042 0.172
AMPkα 0.33 0.62 0.60 2.20 2.21 0.80 0.70 1.51 1.96 1.81 0.495 0.654 <0.001 0.379
eIF4EBP1 0.85 0.84 0.63 0.54 0.80 0.83 1.13 2.13 2.63 0.67 0.885 0.053 0.571 0.250
IGF-I 0.92 0.84 1.10 5.95 6.12 1.31 0.82 5.10 9.26 4.31 2.030 0.185 <0.001 0.210
MHC-I 2.01 0.86 0.64 3.35 3.22 1.00 0.99 0.81 4.07 3.13 0.769 0.962 <0.001 0.589
MHC-IIA 0.43 0.49 0.44 2.06 2.25 0.48 0.52 0.54 1.95 1.83 0.305 0.589 <0.001 0.728
MHC-IIX 0.42 0.42 0.31 0.96 1.12 0.49 0.47 0.32 1.09 0.94 0.172 0.836 <0.001 0.736
RAGA 1.11 1.13 1.11 1.93 2.97 1.77 1.11 1.10 1.99 2.44 0.040 0.841 <0.001 0.347
a, b, c Means in the same row having different superscripts are significant at P ≤ 0.05 for interaction of treatment and day. *AKT= AKT/protein kinase B, AMPKα = AMP-activated protein kinase alpha, eIF4EBP1= eukaryotic initiation factor 4E binding protein 1, IGF-I= insulin like
growth factor I, MHC-I = myosin heavy chain-I, MHC-IIA = myosin heavy chain-IIA, MHC-IIX = myosin heavy chain-IIX, and RAGA= Rag GTPase A. 1Reported in arbitrary units calibrated using a single sample. 2Relative abundance of the AKT, AMPKα, eIF4EBP1, MHC-I, MHC-IIA, MHC-IIX, and RAGA genes were normalized with the RPS9 endogenous control by
using the change in cycle threshold (ΔCT). 30Met= 0 grams of encapsulated methionine and 4 grams of encapsulated lysine per hd/d; 8Met= 8 grams of encapsulated methionine and 4 grams of
encapsulated lysine per hd/d.

Texas Tech University, Jessica O. Baggerman, December 2014
57
Table 1.5. Effect of encapsulated amino acids on relative protein abundances of AKT, AMPKα, eIF4EBP1, pAMPKα, Raptor, and RAGA proteins in
longissimus tissue.1
Treatment2
0Met 8Met P-Value
Protein* Day 0 Day 14 Day 28 Day 42 Day 56 Day 0 Day 14 Day 28 Day 42 Day 56 SEM Trt Day Trt*Day
AKT 4586.8 3791.5 5712.1 3473.7 3138.3 4097.6 3621.8 5600.4 3225.1 2828.9 263.95 0.026 <0.001 0.873
AMPkα 4372.0 4398.6 4062.7 4043.7 4576.8 4344.5 4192.8 4003.3 3595.2 4533.8 212.36 0.102 <0.001 0.592
eIF4EBP1 5625.1 6718.3 6572.7 5494.4 5755.0 5493.0 6437.7 6338.1 5010.1 5388.5 354.59 0.062 <0.001 0.966
pAMPkα 9106.3 3813.1 5910.2 8655.3 3602.1 6852.9 3976.7 5337.0 8525.7 3781.4 913.17 0.203 <0.001 0.303
Raptor 3182.0 4740.2 2639.4 5699.8 5400.8 3092.0 4587.6 2517.8 5684.0 4933.8 206.59 0.070 <0.001 0.587
RAGA 2907.3 4116.3 5134.5 6013.6 4936.8 2880.5 4098.6 5556.3 5238.9 4639.7 425.07 0.466 <0.001 0.377
a, b, c Means in the same row having different superscripts are significant at P ≤ 0.05 for interaction of treatment and day. *AKT= AKT/protein kinase B, AMPKα = AMP-activated protein kinase alpha, eIF4EBP1= eukaryotic initiation factor 4E binding protein 1, pAMPkα=
phosphorylated AMPkα, Raptor= regulatory protein assosicated with mammalian target of rapamycin complex 1, and RAGA= Rag GTPase A. 1Reported in relative light units per second. 20Met= 0 grams of encapsulated methionine and 4 grams of encapsulated lysine per hd/d; 8Met= 8 grams of encapsulated methionine and 4 grams of
encapsulated lysine per hd/d.

Texas Tech University, Jessica O. Baggerman, December 2014
58
Treatment2
0Met 8Met P-Value
Protein* Day 0 Day 14 Day 28 Day 42 Day 56 Day 0 Day 14 Day 28 Day 42 Day 56 SEM Trt Day Trt*Day
MHC-I 32027 23219 27035 37242 42998 31163 22460 26088 38547 43857 3048.2 0.952 <0.001 0.973
MHC-II 39911 27517 33418 42590 55056 40382 27305 31889 50161 53047 3148.0 0.543 <0.001 0.203
a, b, c Means in the same row having different superscripts are significant at P ≤ 0.05 for interaction of treatment and day. *MHC-I= myosin heavy chain type I, and MHC-II= myosin heavy chain type IIA and IIX.1Reported in relative light units per second. 20Met= 0 grams of encapsulated methionine and 4 grams of encapsulated lysine per hd/d; 8Met= 8 grams of encapsulated methionine and 4 grams of
encapsulated lysine per hd/d.
Table 1.6. Effect of encapsulated amino acids on relative protein abundances of MHC-I and MHC-II in longissimus tissue.1

Texas Tech University, Jessica O. Baggerman, December 2014
59
Figure 1.1. The distribution of skeletal muscle fiber types classified by myosin heavy chain
(MHC) isoform in bovine longissimus tissue biopsy samples collected on d 0, 14, 28, 42, and 56
of the feeding trial (n = 20). Treatments were 0Met (0 g of encapsulated methionine and 4 g of
encapsulated lysine per head per d) and 8Met (8 g of encapsulated methionine and 4 g of
encapsulated lysine per head per d). Cross sections of skeletal muscle samples were stained by
immunohistochemistry for presence of MHC isoforms. Differing superscripts denote means
within MHC isoform differ for a treatment by day interaction (P < 0.05).
0%
10%
20%
30%
40%
50%
60%
70%
80%
90%
100%
0 14 28 42 56 0 14 28 42 56
MHC-IIX
MHC-IIA
MHC-I
0Met 8Met
a b cd
b
cd
b
d
b
d
b
d
b
e
b
e
b
e
b
a ab b b de f cd ef bc g
c a d ab bc d cd e c cd

Texas Tech University, Jessica O. Baggerman, December 2014
60
Figure 1.2. Cross-sectional area of skeletal muscle fibers classified by myosin heavy chain
(MHC) isoform in bovine LM tissue collected by biopsy. Biopsies were collected on d 0, 14, 28,
42, and 56 of the feeding trial (n = 20). Treatments were 0Met (0 g of encapsulated methionine
and 4 g of encapsulated lysine per head per d) and 8Met (8 g of encapsulated methionine and 4 g
of encapsulated lysine per head per d). Immunohistochemical staining was used to identify fiber
types. Error bars represent SEM. Within fiber type, means with different superscripts differ for a
treatment by day interaction (P < 0.05).
0
1000
2000
3000
4000
5000
6000
7000
8000
9000
10000
0 14 28 42 56 0 14 28 42 56 0 14 28 42 56
µm
2
0Met
8Met
MHC-I MHC-IIA MHC-IIX
h
cd bc ef
fg gh
bc
de
ab a e
d d
d e
e
bc ab c
a
e e
cd d
e
f
a
bc bc ab

Texas Tech University, Jessica O. Baggerman, December 2014
61
Figure 1.3. Satellite cell population densities of bovine LM tissue biopsies of finishing steers.
Biopsies were performed on d 0, 14, 28, 42, and 56 of the feeding period (n = 20). Treatments
were 0Met (0 g of encapsulated methionine and 4 g of encapsulated lysine per head per d) and
8Met (8 g of encapsulated methionine and 4 g of encapsulated lysine per head per d).
Immunohistochemical staining was used to identify fiber types. Error bars represent SEM. In
PAX7 satellite cells, treatments with different superscripts differ (P < 0.05). Within Myf5
positive satellite cells, means with different superscripts differ for a treatment by day interaction
(P < 0.05).
0
20
40
60
80
100
120
140
160
180
0 14 28 42 56 0 14 28 42 56 0 14 28 42 56
Cel
ls/m
m2
0Met
8Met
PAX7 Myf5 PAX7*Myf5
a
ab
bc cd cd
d
e e e
e
y y y y y x x x
x x

Texas Tech University, Jessica O. Baggerman, December 2014
62
Figure 1.4. Nuclei densities in bovine LM tissue biopsies collected on d 0, 14, 28, 42, and 56.
Treatments were 0Met (0 g of encapsulated methionine and 4 g of encapsulated lysine per head
per d) and 8Met (8 g of encapsulated methionine and 4 g of encapsulated lysine per head per d) (n
= 20). Nuclei were stained using immunohistochemistry. Myonuclei are nuclei not associated
with satellite cells. Error bars represent SEM. Within nuclei category, means with different
superscripts differ for a treatment by day interaction (P < 0.05).
0
100
200
300
400
500
600
700
0 14 28 42 56 0 14 28 42 56
0Met
8Met
Total Nuclei Myonuclei
b
a
bc bcd cdde
ef ef f f
bc
a
c
a
bc
a
bc
a
a
a b
a c
a
a
a
bc
a
bc
a

Texas Tech University, Jessica O. Baggerman, December 2014
63
Figure 1.5. Immunohistochemical detection of muscle fiber type distribution and cross-
sectional area in longissimus tissue. Top left: 0Met, d 0. Top right: 8Met, d 0. Bottom
left: 0Met, d 56. Bottom right: 8Met, d 56. Red = type I fibers, yellow = type IIA fibers,
gray/no stain = type IIX fibers, green = sarcolemma, blue = nuclei. 0Met = 0 g
encapsulated methionine and 4 g encapsulated lysine per hd/d, 8Met = 8 g encapsulated
methionine and 4 g encapsulated lysine per hd/d.
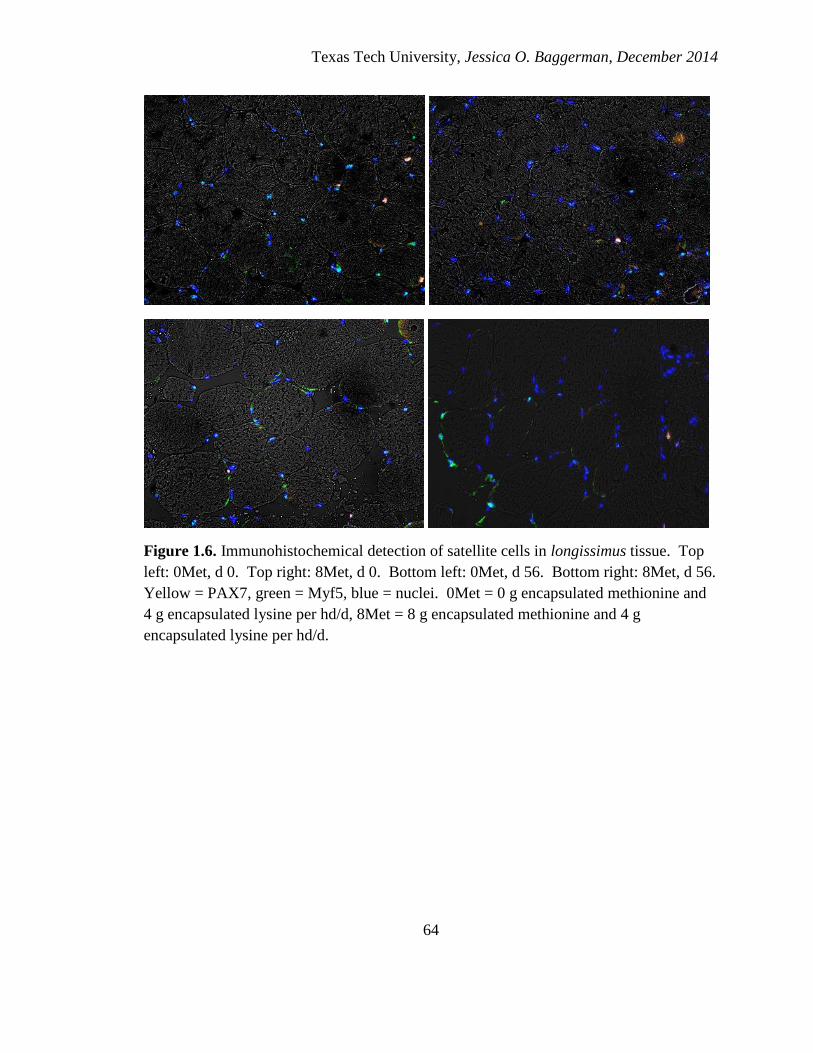
Texas Tech University, Jessica O. Baggerman, December 2014
64
Figure 1.6. Immunohistochemical detection of satellite cells in longissimus tissue. Top
left: 0Met, d 0. Top right: 8Met, d 0. Bottom left: 0Met, d 56. Bottom right: 8Met, d 56.
Yellow = PAX7, green = Myf5, blue = nuclei. 0Met = 0 g encapsulated methionine and
4 g encapsulated lysine per hd/d, 8Met = 8 g encapsulated methionine and 4 g
encapsulated lysine per hd/d.

Texas Tech University, Jessica O. Baggerman, December 2014
65
Literature Cited
Cardasis, C. A., and G. W. Cooper. 1975. A method for the chemical isolation of
individual muscle fibers and its application to a study of the effect of denervation
on the number of nuclei per muscle fiber. J. Exp. Zool. 191: 333-346.
Fetuga, B. L., G. M. Babatunde, and V. A. Oyenuga. 1975. Protein levels in diets for
European pigs in the tropics. 1. The effect of methionine supplementation on the
protein requirement of growing pigs. Anim. Prod. 20: 133-146..
Friesen, K. G., J. L. Nelssen, J. A. Unruh, R. D. Goodband, and M. D. Tokach. 1994.
Effects of the interrelationship between genotype, sex, and dietary lysine on
growth performance and carcass composition in finishing pigs fed to either 104 or
127 kilograms. J. Anim. Sci. 72: 946-954.
Hay, N. 2005. The Akt-mTOR tango and its relevance to cancer. Cancer Cell 8: 179-183.
Hay, N., and N. Sonenberg. 2004. Upstream and downstream of mTOR. Genes Dev. 18:
1926-1945.
Hergenreder, J. E., A. D. Hosford, W. Rounds, and B. J. Johnson. 2013. Effects of
supplementat lysine and methionine in combination with zilpaterol hydrochloride
on muscle fiber type, size, and beta-adrenergic receptors in finishing feedlot
cattle. In: Innovate, Braselton, GA. p 25.

Texas Tech University, Jessica O. Baggerman, December 2014
66
Hosford, A. D., W. Rounds, and B. J. Johnson. 2014. Effects of supplemental lysine and
methionine with zilpaterol hydrochloride on feedlot performance, carcass
characteristics, and tenderness in finishing feedlot cattle. Animal and Food
Sciences. Texas Tech University.
Hussein, H. S., and L. L. Berger. 1995. Feedlot performance and carcass characteristics
of Holstein steers as affected by source of dietary protein and level of ruminally
protected lysine and methionine. J. Anim. Sci. 73: 3503-3509.
Joubert, D. M. 1956. An analysis of factors influencing post-natal growth and
development of the muscle fibre. J. Agric. Sci. 47: 59-102.
Kimball, S. R., L. M. Shantz, R. L. Horetsky, and L. S. Jefferson. 1999. Leucine
regulates translation of specific mRNAs in L6 myoblasts through mTOR-
mediated changes in availability of eIF4E and phosphorylation of ribosomal
protein S6. J. Biol. Chem. 274.
Kuang, S., K. Kuroda, F. Le Grand, and M. A. Rudnicki. 2007. Asymmetric self-renewal
and commitment of satellite stem cells in muscle. Cell 129: 999-1010.
Li, J., J. M. Gonzalez, D. K. Walker, M. J. Hersom, A. D. Ealy, and S. E. Johnson. 2011.
Evidence of heterogeneity within bovine satellite cells isolated from young and
adult animals. J. Anim. Sci. 89: 1751-1757.
Merchen, N. R., and E. C. Titgemeyer. 1992. Manipulation of amino acid supply to the
growing ruminant. J. Anim. Sci. 70: 3238-3247.

Texas Tech University, Jessica O. Baggerman, December 2014
67
Moss, F. P., and C. P. Leblond. 1971. Satellite cells as the source of nuclei in muscles of
growing rats. Anat. Rec. 170: 421-435.
NRC. 2000. Nutrient Requirements of Beef Cattle: Seventh Revised Edition: Update
2000. The National Academies Press.
Richardson, C. R., and E. E. Hatfield. 1978. The limiting amino acids in growing cattle.
J. Anim. Sci. 46: 740-745.
Rounds, W. 2011. Personal communication. In: A. D. Hosford (ed.).
Seale, P. et al. 2000. Pax7 is required for the specification of myogenic satellite cells.
Cell 102: 777-786.
Shaw, R. J. 2008. mTOR signaling: RAG GTPases transmit the amino acid signal. Trends
Biochem. Sci. 33: 565-568.
Titgemeyer, E. C., N. R. Merchen, and L. L. Berger. 1988. Estimation of lysine and
methionine requirements of growing steers fed corn silage-based or corn-based
diets. J. Dairy Sci. 71: 421-454.
Trenkle, A., D. L. DeWitt, and D. G. Topel. 1978. Influence of age, nutrition and
genotype on carcass traits and cellular development of the M. Longissimus of
cattle. J. Anim. Sci. 46: 1597-1603.
Tuma, H. J., J. H. Venable, P. R. Wuthier, and R. L. Henrickson. 1962. Relationship of
fiber diameter to tenderness and meatiness as influenced by age. J. Anim. Sci. 21:
33-36.

Texas Tech University, Jessica O. Baggerman, December 2014
68
Wegner, J. et al. 2000. Growth- and breed-related changes of muscle fiber characteristics
in cattle. J. Anim. Sci. 78: 1485-1496.
Wright, M. D., and S. C. Loerch. 1988. Effects of rumen-protected amino acids on
ruminant nitrogen balance, plasma amino acid concentrations and performance. J.
Anim. Sci. 66: 2014-2027.
Yang, X. et al. 2008. The mammalian target of rapamycin-signaling pathway in
regulating metabolism and growth. J. Anim. Sci. 86: E36-50.
Zammitt, P. S. et al. 2006. Pax7 and myogenic progression in skeletal muscle satellite
cells. J. Cell Sci. 199: 1824-1832.

Texas Tech University, Jessica O. Baggerman, December 2014
69
CHAPTER IV
SATELLITE CELL POPULATIONS IN SKELETAL MUSCLE SHIFT OVER
TIME IN FINISHING CATTLE
Abstract
Satellite cell populations have been observed at the time of harvest in bovine
animals, but not over time in live animals. Skeletal muscle fiber type and satellite cell
populations were examined using longissimus muscle biopsies from 10 feedlot steers
during a 56 d window of the finishing period. Steers were biopsied 5 times every 14 d,
and the longissimus sample that was collected was used to evaluate myosin heavy chain
expression using gene expression analysis and protein expression analysis, as well as
muscle fiber type distribution and cross-sectional area and satellite cell populations via
immunohistochemical staining. There was an increase (P < 0.05) in abundance of
myosin heavy chain (MHC) type I, IIA, and IIX mRNA on d 42 and 56. An increase (P <
0.05) in abundance of MHC-I and II protein isoforms was observed from d 1 to d 56. As
days on feed increased, immunohistochemical staining showed a decrease (P < 0.05) in
the porportion of type I fibers. Skeletal muscle fiber cross-sectional area also increased
(P < 0.05) from d 1 to 56. The density of PAX7-positive satellite cells increased (P <
0.05) as days on feed increased. The density of Myf5 and dual positive satellite cells
decreased (P < 0.05) on d 42 and 56. Total nuclei density was not different (P > 0.05) on
d 1 and 56, but the density of nuclei associated with the muscle fibers increased (P <
0.05) as days on feed increased. These data indicate that during the 56 d window of the
finishing phase in the study, satellite cells fused into muscle fibers to support hypertrophy

Texas Tech University, Jessica O. Baggerman, December 2014
70
of muscle fibers. In addition, this observed change in satellite cell activity was associated
with an increased expression of myosin heavy chain isoforms found in bovine skeletal
muscle.
Introduction
As muscle fiber number in bovine animals is fixed at birth, the increase in muscle
mass observed as the number of days on feed increases is due to muscle fiber
hypertrophy. It is established that skeletal muscle fiber cross-sectional area increases as
animals reach physiological maturity (Joubert, 1956; Tuma et al., 1962; Wegner et al.,
2000). In addition to an increase in cross-sectional area, there is a change of muscle fiber
type from type I slow-twitch oxidative fibers to type IIX fast-twitch glycolytic fibers
(Johnston et al., 1975). Skeletal muscle fibers are multinucleated cells with nuclei that
are not able to proliferate. To accommodate the increase in protein in the muscle fibers,
additional nuclei must fuse into the muscle fiber to maintain the DNA to protein ratio
(Cheek et al., 1971). These additional nuclei come from satellite cells fusing into the
muscle fiber (Chen and Goldhamer, 2003). Satellite cells are muscle pregenitor cells
lying immediately outside the muscle fiber that are able to proliferate as well as
differentiate to fuse into the muscle fiber (Li et al., 2011; Mauro, 1961). This fusion of
satellite cells into the existing muscle fibers can happen prior to or during muscle fiber
hypertrophy (Trenkle et al., 1978).
As a satellite cell comes out of quienscence, there is a series of myogenic
regulatory factors that is expressed as the satellite cell begins to proliferate and/or
differentiate. Two factors that are early in the series are paired box protein 7 (Pax7) and

Texas Tech University, Jessica O. Baggerman, December 2014
71
myogenic factor 5 (Myf5). Pax7 is expressed as satellite cells begin differentiating into
myotubes in vitro as well as in proliferating satellite cells (Seale et al., 2000; Zammitt et
al., 2006). Less is known about Myf5, however it is expressed after Pax7 expression
begins and is thought to be involved in proliferation of satellite cells (Zammitt et al.,
2006). There has been research comparing satellite cell populations in young cattle and
mature cattle and in swine of different ages, but not of the same individual cattle over
time in the finishing phase (Li et al., 2011; Mesires and Doumit, 2002). The objective of
this study was to evaluate changes in skeletal muscle and satellite cell populations of
feedlot steers during 56 d of the finishing phase.
Materials and Methods
The experimental protocol was approved by the Texas Tech University Animal Care and
Use Committee (IACUC #14008-01).
Animals
Yearling Continental crossbred feedlot steers (n = 10; 455 ± 46 kg) were obtained
from a commercial feedlot facility and housed at the Texas Tech University Beef Center
at New Deal, TX. Steers were processed after arrival and given individual identificaiton
ear tags. Animals were adapted to a finishing diet (Table 2.1) prior to trial initiation. The
finishing diet was formulated to meet or exceed NRC (2000) tabular values and
manufactured daily. Steers were fed once daily at 0900 h ad libitum throughout the trial
period. Steers were observed daily for symptoms of lameness, illness, or digestive upset,

Texas Tech University, Jessica O. Baggerman, December 2014
72
and no steers were removed from the study. On d 56 of the study, steers weighed 581 ±
52 kg.
Experimental Design
Individual body weights were obtained 7 d prior to the experimental period.
Steers were stratified into 2 blocks with 1 pen per block and 5 steers per pen.
Longissimus muscle biopsy samples were collected on d 1, 14, 28, 42, and 56. Individual
body weights were also obtained using a certified squeeze chute mounted on load cells on
biopsy days.
Biopsy Procedure
Biopsies were performed at the Burnett Center of the Texas Tech University New
Deal Farm. Steers were secured using a hydraulic squueze chute and prepared for the
biopsy. Their backs were shaved with electric clippers and disposable razors to remove
hair from the biopsy site. Betadine surgical scrub (7.5% povidone iodine, Purdue
Products, L.P., Stamford, CT) and water was used to cleanse the biopsy site, followed by
a 70% ethanol rinse. The area was then shaved with a disposable razor again, scrubbed
with Betadine surgical scrub and water then rinsed with 70% ethanol for a second time.
A local anesthetic (lidocaine HCl; 20 mg/mL; 8 mL per biopsy) was injected around the
biopsy site in a diamond-shaped patten (6 cm2, 4 injection sites, 2 mL lidocaine HCl per
injection site), and allowed to sit for 5 min to numb the biopsy site. The area was rinsed
again with 70% ethanol and protected with sterile gauze until a sterile scapel was used to
make a 1 cm long incision through the skin and subcutaneous fat. A sterile 4-mm

Texas Tech University, Jessica O. Baggerman, December 2014
73
diameter Bergstrom biopsy needle was used to abtain approximately 2 g of tissue from
the longissimus. Extracted tissue was placed in a plastic container on a bed of sterile
guaze to be transported to the sample preparation area. The incision was then sealed with
VetBond (3M Animal Care Products, St. Paul, MN) and AluShield (Neogen Corp.,
Lexington, KY) was sprayed on the site to protect the area during the healing process and
to prevent infection. Biopsies were performed on d 1, 14, 28, 42, and 56. On
consecutive biopsy dates, the incision site alternated sides of the steer and started at the
11th-12th rib interface and moved anterior to the next rib interface. Steers were monitored
for 3 days after each biopsy procedure for inflammation or infection of the biopsy site.
No steers showed signs of inflammation or infection.
The extracted tissue was then divided into three fractions. The fractions to be
used for gene and protein expression analysis were split into 2 labeled Whirl-Pak bags
(Nasco, Fort Atkinson, WI) and snap frozen in liquid N2. These fractions were stored in
a styrofoam cooler with dry ice until transport to the laboratory at Texas Tech University.
The third fraction was designated for immunohistochemical staining. The tissue was
analyzed using a magnifying glass and forceps to identify and isolate portions of the
sample with parallel muscle fibers. The parallel fibers were then grouped together and
placed into clear section compound (VWR International, West Chester, PA) on a 1 cm by
1.5 cm piece of cork sheet. The sample and cork were then frozen in isopentane cooled
by dry ice. Once the section compound was frozen, the sample was placed into a Whirl-
Pak bag and stored in a styrofoam cooler with dry ice until transport back to Texas Tech
University where all samples were stored at -80°C until further processing.

Texas Tech University, Jessica O. Baggerman, December 2014
74
RNA Isolation and RT-qPCR
Total RNA was isolated from the longissimus sample using ice-chilled TRI-
reagent (Sigma, St. Louis, MO). Approximately 0.5 g of longissimus tissue was
homogenized in liquid N2, and once the N2 evaporated 3 mL of TRI-reagent was added.
When the TRI-reagent and sample reached room temperature, the liquid was split
between 2 microcentrifuge tubes and 0.3 mL of chloroform was added to each. The tubes
were vortexed, allowed to sit at room temperature for 5 min, and centrifuged at 15,000 ×
g for 15 min at room temperature. The upper aqueous layer was pipetted off and
transferred to a new microcentrifuge tube, and 0.5 mL of cold isopropanol was added.
The samples were incubated on ice for 15 min then centrifuged at 15,000 × g for 10 min
at room temperature. The supernatant was decanted carefully so the RNA pellet was not
disturbed, and 0.5 mL of 75% ethanol was added to each pellet. Samples were stored at -
80°C until further processing. One microcentrifuge tube per sample was allowed to thaw
on ice and centrifuged for 10 min at 15,000 × RPM at room temperature. The 75%
ethanol was decanted, and the pellets were allowed to completely air dry. Pellets were
triturated in 20 µL of nuclease-free water, and RNA concentration was measured using a
NanoDrop 1000 spectrophotometer (NanoDrop Products, Wilmington, DE) at an
absorbance of 260 nm. The samples were treated with an Ambion DNA-free kit (Life
Technologies, Grand Island, NY) to remove contamination by genomic DNA, and 1 µg
of RNA was then used for reverse transcription to synthesize cDNA. A GeneAmp
7900HT Sequence Detection System (Applied Biosystems, Life Technologies) was used
to perform real-time quantitative polymerase chain reaction (RT-qPCR) using cDNA to

Texas Tech University, Jessica O. Baggerman, December 2014
75
measure the relative abundance of myosin heavy chain I (MHC-I), myosin heavy chain
IIA (MHC-IIA), and myosin heavy chain IIX (MHC-IIX). Gene expression data was
normalized to the housekeeping gene ribosomal protein subunit 9. The RT-qPCR was
run for 40 cycles of 15 s at 95°C and 1 min at 60°C.
Protein Extraction and SDS-PAGE
Total protein was extracted from the longissimus sample designated for protein
analysis using whole muscle extraction buffer (WMEB; 2% sodium dodecyl sulfate, 10
mM phosphate, pH 7.0) in a ratio of 1 g tissue to 5 mL WMEB. The sample and WMEB
were homogenized and centrifuged at 1,500 × g at room temperature for 15 min. The
middle aqueous layer was extracted and pipetted into microcentrifuge tubes. Protein
concentration was quantified using a PierceTM BCATM protein assay kit (ThermoFisher
Scientific, Fairlawn, NJ) and a NanoDrop 1000 spectrophotometer (NanoDrop Products).
Samples were diluted with WMEB to a constant concentration and prepared with Myosin
Heavy Chain Tracking Dye and β-mercaptoethanol to denature the protein. Gels with a
4-6% polyacrylamide gradient were cast and polymerized overnight. The myosin heavy
chain protein samples were heated to 95°C for 5 min and loaded into the gel. Gels were
run at 100V for 30 h. Gels were then removed from the cassette and stained using
Coomassie® Fluor Orange (Life Technologies) at room temperature for 30 min in the
dark. The gels were rinsed with 7.5% acetic acid and then incubated in NanoPure water
for 5 min. Gels were imaged using Imager Scanner II and ImageQuant TL software, and
densitometry measurements were obtained for the bands representing MHC-I and MHC-
IIA/X.

Texas Tech University, Jessica O. Baggerman, December 2014
76
Immunohistochemical Analysis
Samples embedded in section compound were moved from -80°C to -20°C to
thaw for 24h. The samples were removed from the cork, and cross-sections 10 µm-thick
were cut at -20°C using a Leica CM1950 cryostat (Leica Biosystems, Buffalo Grove, IL)
and mounted on positively charged glass slides (Superfrost Plus, VWR International)
with 5 cross-sections per slide and 2 slides per sample. Cross-sections were fixed with
4% paraformaldehyde in phosphate buffered saline (PBS; ThermoFisher Scientific) for
10 min at room temperature, rinsed twice briefly in PBS, and then incubated in PBS for
10 min at room temperature to rehydrate. Blocking solution made of 2% bovine serum
albumin (MO Biomedical, Solon, OH), 5% horse serum (Invitrogen), and 0.2% Triton-X
100 (ThermoFisher Scientific) in PBS was made and slides were incubated with blocking
solution for 30 min at room temperature to prevent non-specific antibody binding.
Primary antibody solution consisting of blocking solution and the appropriate antibodies
for each slide was applied, and slides were incubated for 1 h at room temperature.
Antibodies used were for slide 1- 1:100 α-dystrophin, rabbit, IgG (Thermo Scientific);
1:100 supernatant anti-myosin heavy chain (MHC) type 1, IgG2b (BA-D5;
Developmental Studies Hybridoma Bank, University of Iowa, Iowa City, IA); and
supernatant anti-MHC all but type IIX IgG1 (BF-35, Developmental Studies Hybridoma
Bank); and slide 2- 1:10 supernatant anti-PAX7, mouse α-chicken (Developmental
Studies Hybridoma Bank); 1:100 Myf-5, rabbit, IgG (Santa Cruz Biotechnology, Dallas,
TX). Slides were then rinsed 3 times with PBS for 5 min at room temperature. Slide 1,
stained for fiber type and diameter, was cover-slipped with thin glass cover slips (VWR

Texas Tech University, Jessica O. Baggerman, December 2014
77
International) and ProLong® Gold with 4’6-diamidino-2-phenylindole (DAPI) mounting
media (Life Technologies) and cured for 36 h at room temperature in the dark. Slide 2,
stained for satellite cell density, was incubated with 1 µg/mL DAPI (ThermoFisher
Scientific) for 1 min, rinsed twice briefly in PBS, and then coverslipped with AquaMount
mounting media (Lerner Laboratories, Pittsburgh, PA) and thin glass cover slips (VWR
International). The slides were cured at 4°C for 24 h in the dark. All slides were imaged
within 48 h after curing. Slides were imaged at 200x magnification using an inverted
fluorescence microscope (Nikon Eclipse, Ti-E; Nikon Instruments, Inc., Mellville, NY)
with a UV light source (Nikon Intensilight; C-HGFIE) and a CoolSnap ES2 monochrome
camera. Images were artificially colored and analyzed using NIS Elements® Imaging
software.
Statistical Analysis
For statistical analysis, SAS version 9.3 (SAS Institute, Inc., Cary, NC) was used.
Animal served as experimental unit, block was a considered a random effect, and day was
a fixed effect. The MIXED procedure (PROC MIXED) was used for gene and protein
expression. Immunohistochemical data was analyzed with the GLIMMIX procedure
(PROC GLIMMIX) with the LSMEANS procedure and PDIFF option to separate means.
A significant difference in means was determined when P ≤ 0.05, and a tendency was
declared at P ≤ 0.10.

Texas Tech University, Jessica O. Baggerman, December 2014
78
Results and Discussion
For all three MHC isoforms expressed in bovine skeletal muscle, the abundance
of gene expression was significantly increased on d 42 and 56 compared with d 1, 14, and
28, as shown in Figure 2.1. For both MHC-I and MHC-II, protein abundance was greater
on d 56 than on d 1 (Figure 2.3). As illustrated by the immunohistochemical data in
Figure 2.5, as days on feed increased there was a decrease in the proportion of type I
muscle fibers present and an increase in the combination of type IIA and IIX fibers.
Cross-sectional area showed an increase from d 1 for type I, IIA, and IIX fibers (Figure
2.6). This data agrees that as the number of days on feed increases, skeletal muscle fibers
increase in size as well as transition from type I fibers to type II fibers (Johnston et al.,
1975).
There was an increase in PAX7-positive satellite cells from d 1 to 56, with the
greatest amount of PAX7-positive cells on d 42, suggesting an increase in cells able to
proliferate or begin the differentiation process (Figure 2.8). There was a significant
decrease in the number of Myf5-positive satellite cells on d 42 and 56 compared with d 1,
14, and 28. There was also a similar decrease for cells exhibiting both PAX7 and Myf5
on d 42 and 56 from d 1, 14, and 28. These decreases in Myf5 and dual positive satellite
cells suggest an increase in satellite cells fusing into the muscle fiber to support the
increase in muscle fiber size. As shown in Figure 2.9, while the number of nuclei on d 1
and 56 were not different, the number of nuclei not associated with satellite cells
increased as the number of days on feed increased. It can be hypothesized that these
nuclei not associated with Myf5 or PAX7 positive satellite cells are nuclei that are fused

Texas Tech University, Jessica O. Baggerman, December 2014
79
into the muscle fiber. This data supports the theory of an increase in the number of
satellite cells fusing into the muscle fiber to support post-natal skeletal muscle
hypertrophy.
While satellite cell populations have been investigated in cattle of differing stages
of maturity at time of harvest and in swine of different ages at time of harvest, little work
has been done evaluating satellite cell populations over time in living cattle (Li et al.,
2011; Mesires and Doumit, 2002). The use of muscle biopsy and immunohistochemical
staining has allowed for the present study to do so. The data shows an increase in the
mRNA and protein expression of myosin heavy chain isoforms present in bovine skeletal
muscle as well as an increase in cross-sectional area of muscle fibers as days on feed
increased. This along with the decrease in Myf5-positive and dual positive satellite cells
and an increase in nuclei that appear to have fused into the muscle fiber suggest that as an
animal ages and hypertrophy of muscle fibers occurs, there is an increase in satellite cell
differentiation and fusion into the muscle fibers (Kuang et al., 2007). The increase in
PAX7 positive cells could be due to an increase in proliferation of PAX7 positive cells or
an increase of cells exiting the quiescent state (Seale et al., 2000; Zammitt et al., 2006).
The present study demonstrates as skeletal muscle fibers undergo post-natal hypertrophy,
satellite cells fuse into the skeletal muscle fiber to support this increase in size.

Texas Tech University, Jessica O. Baggerman, December 2014
80
Table 2.1. Ingredient composition (%, DM basis) of the
experimental diets1
Ingredients 0Met and 8Met2
Steam-flaked corn 75.24
Cottonseed hulls 5.95
Cottonseed meal 4.71
Alfalfa hay, chopped 3.93
Molasses, cane 3.84
TTU mineral supplement3 1.97
Fat 1.96
Limestone 1.26
Chromium propionate supplement4 0.25
1Diets were formulated to meet or exceed NRC (1996) requirments
for growing – finishing beef cattle.
20Met= 0 grams of encapsulated methionine and 4 grams of
encapsulated lysine per hd/d; 8Met= 8 grams of encapsulated
methionine and 4 grams of encapsulated lysine per hd/d.
3Supplement composition (DM basis): 66.476% cottonseed meal;
15.000% salt; 10.000% potassium chloride; 4.167% ammonium
sulfate; 0.986% zinc sulfate; 0.750% Rumensin (176.4 mg/kg;
Elanco Animal Health, Indianapolis, IN); 0.648% dicalcium
phosphate; 0.563% Tylan (88.2 mg/kg; Elanco Animal Health);
0.500% Endox (Kemin Industries, Des Moines, IA); 0.333%
manganese oxide; 0.196% copper sulfate; 0.158% vitamin E (500
IU/g; DSM Nutritional Products, Inc.); 0.125% selenium premix
(0.2% Se); 0.083% iron sulfate; 0.010% vitamin A (1,000,000 IU/g;
DSM Nutritional Products, Inc., Parsippany, NJ); 0.003%
ethylenediamine dihydroiodide; and 0.002% cobalt carbonate.
Concentrations in parenthesis are expressed on a 90% DM basis.
4KemTraceTM (Kemin Industries, Des Moines, IA)

Texas Tech University, Jessica O. Baggerman, December 2014
81
Figure 2.1. The myosin heavy chain (MHC) isoform abundance in bovine LM tissue in feedlot
steers on 5 biopsy days. Panel A represents MHC-I, panel B represents MHC-IIA, and panel C
represents MHC-IIX. Biopsy samples were collected at d 1, 14, 28, 42, and 56 of the feeding trial
(n = 10). Total RNA was isolated from skeletal muscle samples and MHC gene expression
relative to ribosomal protein subunit 9 was determined using RT-qPCR. Error bars are SEM.
Within gene, days with differing superscripts are different (P < 0.05).
0
1
2
3
4
5
MHC-I
Rel
ativ
e A
bund
ance
d 1
d 14
d 28
d 42
d 56
0
0.5
1
1.5
2
2.5
3
MHC-IIA
Rel
ativ
e A
bund
ance
d 1
d 14
d 28
d 42
d 56
0
0.2
0.4
0.6
0.8
1
1.2
1.4
MHC-IIX
Rel
ativ
e A
bund
ance
d 1
d 14
d 28
d 42
d 56
a a
b
a
b
a
b
a
b
a
b
a
b
a
a a
b
a
b
a
b
a
a a
A
B
C

Texas Tech University, Jessica O. Baggerman, December 2014
82
Figure 2.2. SDS-PAGE gels of myosin heavy chain (MHC) type I and II abundance in bovine
LM tissue biopsies collected on d 1, 14, 28, 42, and 56. Gels were stained with Coomassie®
Orange. Upper band represents MHC type II and the lower band represents MHC type I.
MHC-II
MHC-I
1 14 28 42 56

Texas Tech University, Jessica O. Baggerman, December 2014
83
Figure 2.3. The abundance of myosin heavy chain (MHC) type I and II in bovine LM tissue in
finishing steers collected via biopsy on 5 days. Biopsies were performed on d 1, 14, 28, 42, and
56 of the feeding trial (n = 10). Total protein was isolated from skeletal muscle tissue samples
and SDS-PAGE was performed to stain bands measured in relative light units per s. Error bars
are SEM. Days with different superscripts differ within protein (P < 0.05).
0
10000
20000
30000
40000
50000
60000
70000
MHC-I MHC-II
RL
U/s
Protein
d 1
d 14
d 28
d 42
d 56
a b
a
a ab
cd d
bc
d
a
b b
c
c
B C

Texas Tech University, Jessica O. Baggerman, December 2014
84
Figure 2.4. Images of immunohistological staining of skeletal muscle fibers from bovine
LM tissue biopsy. Biopsies were performed on d 1, 14, 28, 42, and 56. Panel A) d 1, B)
d 14, C) d 28, D) d 42, and E) d 56. Green represents the membrane surrounding the
muscle fiber, blue represents nuclei, red represents type I fibers, yellow represents type
IIA fibers, and unstained fibers are type IIX.
A
D E
B C

Texas Tech University, Jessica O. Baggerman, December 2014
85
Figure 2.5. The distribution of skeletal muscle fiber types identified by myosin heavy chain
(MHC) isoform in bovine LM tissue in finishing steers collected via biopsy on d 1, 14, 28, 42,
and 56 of the feeding trial (n = 10). Cross sections of skeletal muscle tissue samples were stained
for MHC isoforms using immunohistochemistry. Days within MHC isoform bearing different
superscripts differ (P < 0.05).
0
10
20
30
40
50
60
70
80
90
100
1 14 28 42 56
%
Day
MHC-IIX
MHC-IIA
MHC-I
a b
a
a
ab
b
a
a
b c d
c
c
c
a
c
d
c
ab
c
bc
c
b
c
c
c
a
c
b
c
a

Texas Tech University, Jessica O. Baggerman, December 2014
86
Figure 2.6. Cross sectional area of skeletal muscle fibers by fiber type identified by myosin
heavy chain (MHC) isoform in bovine LB tissue in finishing steers on 5 biopsy days. Biopsies
were collected on d 1, 14, 28, 42, and 56 of the feeding trial (n = 10). Immunohistochemistry was
used to measure cross sectional area by staining MHC isoform and the membrane surrounding the
skeletal muscle fibers. Error bars represent SEM. Within fiber type, days with different
superscripts differ (P < 0.05).
0
1000
2000
3000
4000
5000
6000
7000
8000
9000
10000
MHC-I MHC-IIA MHC-IIX
µm
2
d 1
d 14
d 28
d 42
d 56
a
b
a
a
b
b
a
a
b
b
a
a
c
b
a
a
d
b
a
a
c
b
a
a
b
b
a
a c
b
a
a
a
b
a
a
a
b
a
a
a
b
a
a
b
b
a
a
c
b
a
a
c
b
a
a
b
b
a
a
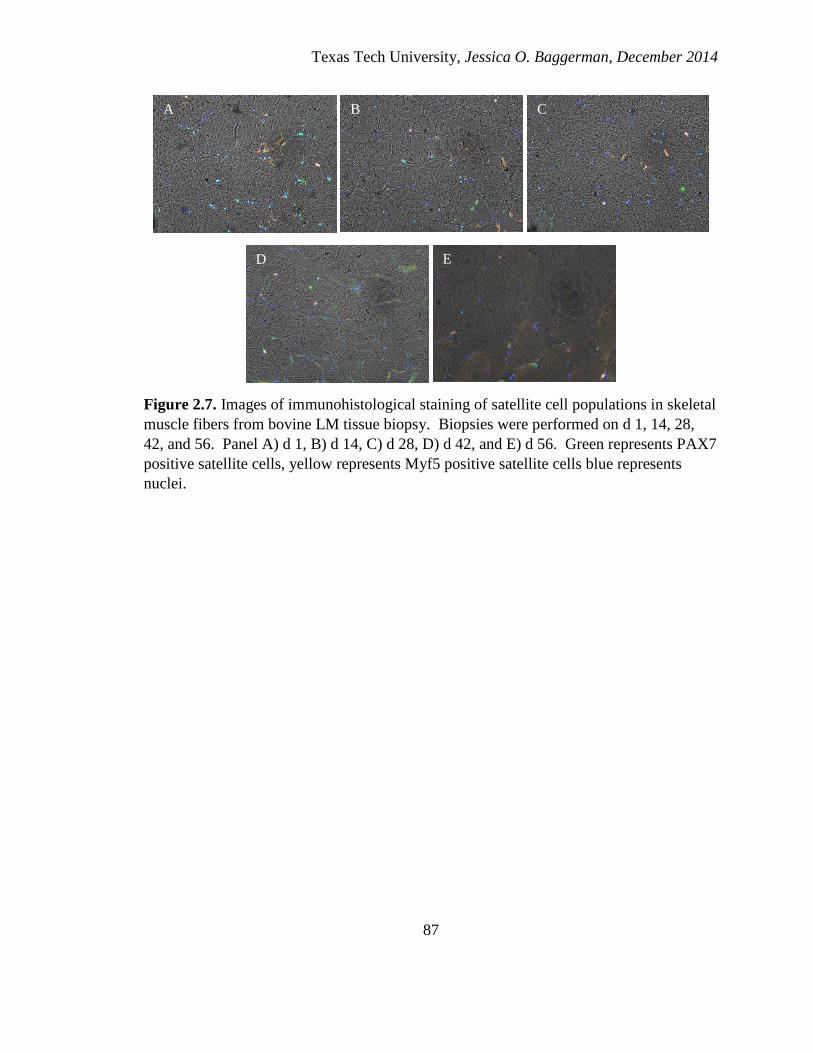
Texas Tech University, Jessica O. Baggerman, December 2014
87
Figure 2.7. Images of immunohistological staining of satellite cell populations in skeletal
muscle fibers from bovine LM tissue biopsy. Biopsies were performed on d 1, 14, 28,
42, and 56. Panel A) d 1, B) d 14, C) d 28, D) d 42, and E) d 56. Green represents PAX7
positive satellite cells, yellow represents Myf5 positive satellite cells blue represents
nuclei.
A B C
D E

Texas Tech University, Jessica O. Baggerman, December 2014
88
Figure 2.8. Satellite cell population density in bovine LB tissue biopsies of finishing steers
collected on d 0, 14, 28, 42, and 56 of the feeding trial (n = 10). Satellite cells were stained for
expression of PAX7 and Myf5 on skeletal muscle cross-sections using immunohistochemistry.
Error bars represent SEM. Within MHC isoform, days with different superscripts differ (P <
0.05).
0
20
40
60
80
100
120
140
160
180
PAX7 Myf5 Both
Cel
ls p
er m
m2 d 1
d 14
d 28
d 42
d 56
a
b
a
a
b
b
a
a
bc
b
a
a
c
b
a
a
c
b
a
a
a
b
a
a
a
b
a
a
b
b
a
a
c
b
a
a
c
b
a
a a
b
a
a
a
b
a
a
a
b
a
a
b
b
a
a
b
b
a
a

Texas Tech University, Jessica O. Baggerman, December 2014
89
Figure 2.9. Total nuclei density in skeletal muscle and nuclei associated with myofibers in bovine
LD biopsy samples. Biopsies were collected on d 0, 14, 28, 42, and 56 of the feeding period (n =
10). Nuclei were stained on skeletal muscle cross-sections using immunohistochemistry. SEM is
represented by error bars. Days differ when superscripts are different (P < 0.05).
0
100
200
300
400
500
600
700
Nuclei Myonuclei
per
mm
2
d 1
d 14
d 28
d 42
d 56
a b
a
a
b b
a
a
b b
a
a
b b
a
a
b b
a
a
a b
a
a
ab
b
a
a
bc
a
cd
a
d

Texas Tech University, Jessica O. Baggerman, December 2014
90
Literature Cited
Cheek, D. B., A. B. Holt, D. E. Hill, and J. L. Talbert. 1971. Skeletal muscle mass and
growth: the concept of the deoxyribonucleic acid unit. Pediat. Res. 5: 312-328.
Chen, J. C. J., and D. J. Goldhamer. 2003. Skeletal muscle stem cells. Reprod. Biol.
Endocrin. 1: 101-107.
Johnson, B. J. et al. 1998. Activation state of muscle satellite cells isolated from steers
implanted with a combined trenbolone acetate and estradiol implant. J. Anim. Sci.
76: 2779-2786.
Johnston, D. M., D. F. Stewart, W. G. Moody, J. Boling, and J. D. Kemp. 1975. Effect of
breed and time on feed on the size and distribution of beef muscle fiber types. J.
Anim. Sci. 40: 613-620.
Joubert, D. M. 1956. An analysis of factors influencing post-natal growth and
development of the muscle fibre. J. Agric. Sci. 47: 59-102.
Kuang, S., K. Kuroda, F. Le Grand, and M. A. Rudnicki. 2007. Asymmetric self-renewal
and commitment of satellite stem cells in muscle. Cell 129: 999-1010.
Li, J. et al. 2011. Evidence of heterogeneity within bovine satellite cells isolated from
young and adult animals. J. Anim. Sci. 89: 1751-1757.
Mauro, A. 1961. Satellite cell of skeletal muscle fibers. J. Biophys. Biochem. Cytol. 9:
493-495.

Texas Tech University, Jessica O. Baggerman, December 2014
91
Mesires, N. T., and M. E. Doumit. 2002. Satellite cell proliferation and differentiation
during postnatal growth of porcine skeletal muscle. Am. J. Physiol. Cell Physiol.
282: C899-C906.
Seale, P. et al. 2000. Pax7 is required for the specification of myogenic satellite cells.
Cell 102: 777-786.
Trenkle, A., D. L. DeWitt, and D. G. Topel. 1978. Influence of age, nutrition and
genotype on carcass traits and cellular development of the M. Longissimus of
cattle. J. Anim. Sci. 46: 1597-1603.
Tuma, H. J., J. H. Venable, P. R. Wuthier, and R. L. Henrickson. 1962. Relationship of
fiber diameter to tenderness and meatiness as influenced by age. J. Anim. Sci. 21:
33-36.
Wegner, J. et al. 2000. Growth- and breed-related changes of muscle fiber characteristics
in cattle. J. Anim. Sci. 78: 1485-1496.
Zammitt, P. S. et al. 2006. Pax7 and myogenic progression in skeletal muscle satellite
cells. J. Cell Sci. 199: 1824-1832.