role of economic policies in achieving mdgs in the asia
TRANSCRIPT
Munich Personal RePEc Archive
Role of Economic Policies in Achieving
MDGs in the Asia-Pacific Region:
Challenges, Gaps and Area of
Interventions
Nagapudi R, Bhanumurthy
National Institute of Public Finance and Policy, New Delhi, India
September 2007
Online at https://mpra.ub.uni-muenchen.de/22885/
MPRA Paper No. 22885, posted 25 May 2010 11:39 UTC
Role of Economic Policies in Achieving MDGs in the Asia-Pacific Region: Challenges, Gaps and
Area of Interventions
By
N R Bhanumurthy National Institute of Public Finance and Policy
New Delhi, India E-mail: [email protected]
Abstract
This paper tries to examine the role of various economic policy measures that are
unveiled in the Asia Pacific region to achieve the MDGs. In do so, in the first stage,
the paper tries to bring out the extent of achievement of MDGs in the region. Further,
it attempts to fix the bench marks for each macro policy variable in relation to MDG
achievement. In the second stage, it undertakes the gap analysis to see the extent of
distance between ‘on-track’ and ‘off-track’ countries and emphasis prioritisation of
policies in the region. The study concludes that Asia Pacific as a whole are close to
the bench mark countries in terms of fiscal and trade policies. But there is a lot more
that needs to be done in the financial and stabilisation policies. Further, the study
concludes that there is a need to emphasis more on the financial and macroeconomic
reforms that helps in domestic resource mobilisation and also in the growth process
that are necessary for achieving development goals in time.
The author would like to thank UN-ESCAP and especially to Dr Hiren Sarkar, Chief, Poverty and Development Division, for his comments on the earlier draft of the report. Any errors and omissions in the report are author’s alone.
Role of Economic Policies in Achieving MDGs: Challenges, Gaps and Area of Interventions
1. Introduction The recent report by UNESCAP-UNDP-ADB shows that the progress in reaching the objective of achieving MDGs by 2015 in many of the Asia Pacific region is mixed in terms of countries and also in terms of the goals. Although the goal of halving the people below the poverty line seems to be achievable across the region, achieving of other goals seems to be rather difficult and needs suitable policy focus. At this juncture, it is important to assess the national policies and identify the gaps that will help the countries to reassess the policy framework. It is well-known that the economic policy of any country would focus on enhancing growth assuming that the output growth is a necessary condition to achieve any development goal such as MDGs as it gives more leverage in terms of availability of finances to cover the developmental expenditure through some focussed action programs. Further, it also expected to enhance employment opportunities. But this is not sufficient as some countries have achieved skewed growth with increase in inequality reflecting skewed redistributive policies. This resulted in the concept of “pro-poor growth” where in the benefits of growth process does not by-pass the poor. Even this concept has been questioned on the basis that achieving pro-poor growth addresses just one goal of the MDG, i.e., goal-1. Hence, there is a need for growth which addresses all MDG goals. In other words, we need to achieve what is called “pro-MDG growth” or “inclusive growth”. For this purpose there is a need for “pro-MDG growth policies”. A number of countries already have or in the process of preparing MDG based national development strategies. Such a MDG based strategy is consistent with ‘right to development’ which is a fundamental human right. In this exercise, the country specific development policies would be examined and see whether these policies are capable of achieving MDG goals. For this purpose, based on the information available from the UNESCAP-UNDP-ADB Report (2006) some on-track (in achieving MDGs) countries’ developmental policies have been bench-marked. Based on these bench marks, the pro-MDG policy index has been estimated for most of the Asia Pacific countries for which reasonable data are available. In this report, broad development indicators have been considered. Compared to the preliminary report, this list and also the number of countries have been expanded1. Further, these indicators are grouped to reflect a specific economic policy. For example, we have estimated financial inclusion index by including various policy indicators namely, liquidity in the system, number of bank branches, domestic credit availability, number of bank accounts per thousand populations etc. These 1 In this report 28 countries are covered with 22 indicators that are broadly falling under six policy
areas namely growth, fiscal, trade, financial sector, investment, health and education. For the list of
countries and the indicators see Appendex-1
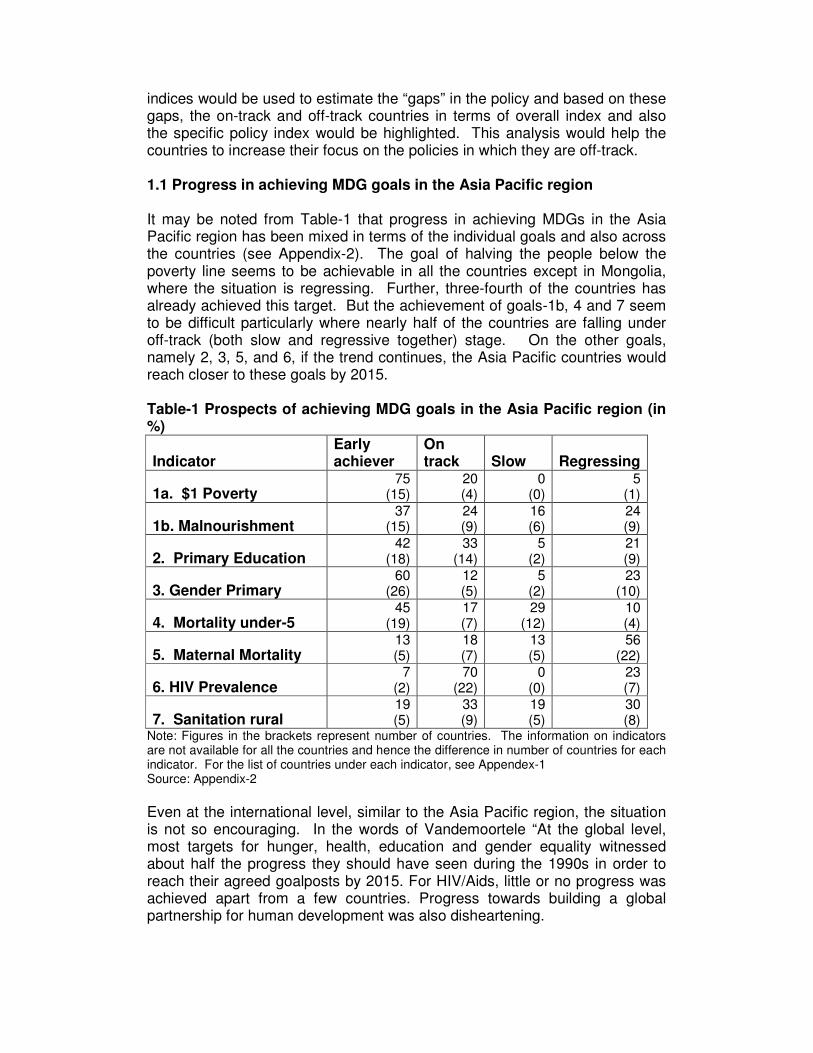
indices would be used to estimate the “gaps” in the policy and based on these gaps, the on-track and off-track countries in terms of overall index and also the specific policy index would be highlighted. This analysis would help the countries to increase their focus on the policies in which they are off-track. 1.1 Progress in achieving MDG goals in the Asia Pacific region It may be noted from Table-1 that progress in achieving MDGs in the Asia Pacific region has been mixed in terms of the individual goals and also across the countries (see Appendix-2). The goal of halving the people below the poverty line seems to be achievable in all the countries except in Mongolia, where the situation is regressing. Further, three-fourth of the countries has already achieved this target. But the achievement of goals-1b, 4 and 7 seem to be difficult particularly where nearly half of the countries are falling under off-track (both slow and regressive together) stage. On the other goals, namely 2, 3, 5, and 6, if the trend continues, the Asia Pacific countries would reach closer to these goals by 2015. Table-1 Prospects of achieving MDG goals in the Asia Pacific region (in %)
Indicator Early achiever
On track Slow Regressing
1a. $1 Poverty 75
(15) 20 (4)
0 (0)
5 (1)
1b. Malnourishment 37
(15) 24 (9)
16 (6)
24 (9)
2. Primary Education 42
(18) 33
(14) 5
(2) 21 (9)
3. Gender Primary 60
(26) 12 (5)
5 (2)
23 (10)
4. Mortality under-5 45
(19) 17 (7)
29 (12)
10 (4)
5. Maternal Mortality 13 (5)
18 (7)
13 (5)
56 (22)
6. HIV Prevalence 7
(2) 70
(22) 0
(0) 23 (7)
7. Sanitation rural 19 (5)
33 (9)
19 (5)
30 (8)
Note: Figures in the brackets represent number of countries. The information on indicators are not available for all the countries and hence the difference in number of countries for each indicator. For the list of countries under each indicator, see Appendex-1 Source: Appendix-2
Even at the international level, similar to the Asia Pacific region, the situation is not so encouraging. In the words of Vandemoortele “At the global level, most targets for hunger, health, education and gender equality witnessed about half the progress they should have seen during the 1990s in order to reach their agreed goalposts by 2015. For HIV/Aids, little or no progress was achieved apart from a few countries. Progress towards building a global partnership for human development was also disheartening.
Perhaps most disappointing was the progress for one of the most important MDG targets—primary education. There is no good reason why universal primary education should not be a practical reality today. Its cost is perfectly affordable; no new technologies are needed; everyone agrees that it makes good economic sense; and basic education is a fundamental human right. If these reasons are not sufficient to ensure success vis-à-vis the education goal, then we can only wonder what it will take to meet the other MDGs. Sadly, the failure to keep the education promise will undermine the chances of reaching the other MDGs, because of the high intrinsic and instrumental value of primary schooling” (Vandemoortele (2003)) At the country specific level, it is found that even some of the countries like China, India, Russian Federation, Malaysia, Republic of Korea, Kazakhstan, etc., who are better performing countries in terms of economic growth, are found to be in the regressing stage in some of the indicators. (For example, China is under regressing stage in achieving goal-1b; Malaysia is in regressing status in achieving goals-2,5, and 6; India in goal-4; Republic of Korea in goals-1b,4 and 5; and so on.) This trend in the fast growing countries shows that growth alone is not sufficient in achieving the MDGs. Further, it is easy to argue that the growth in these countries could have helped in poverty reduction. But, although it is necessary, this is not a sufficient condition to achieve other goals. In other words, the growth may be pro-poor but it may not be pro-MDGs. Now, what is pro-MDG growth? How is this different from pro-poor growth? This is discussed in the next section. 2. The concept of Pro-MDG growth In the literature, the concept of pro poor growth has been discussed widely. In a nutshell, a growth is pro poor if the poverty measure falls. According to the definition of International Poverty Centre, growth is pro-poor if the poorer households increase their incomes (or consumption) proportionally more than the non-poor; i.e., households above the defined poverty line. And in the recessionary situation (when income growth is negative), the growth is called pro-poor if the incomes decrease is proportionally less, on average, for the poorer households than for the non-poor. In other words, the potential sources of pro poor growth are (a) a high rate of average incomes (b) high sensitivity of poverty to growth in average incomes and (c) a poverty reducing pattern of growth in relative income. An operational definition of pro-poor growth has been provided by Pasha (2002). Following Pasha (2007), growth to be poverty reducing, it should
• Occur in sectors where the poor find employment (such as agriculture)
• Occur in sectors whose outputs are consumed by the poor (such as food)
• Occur in areas where the poor live (such as rural areas) • Utilize factor of production which the poor have (such as labor
which is often of unskilled nature)
This can also be explained as pro-poor growth is one when growth occurs for the poor, by the poor and at the poor. Following the above definition, labor intensive sectors using relatively low level of technologies can be identified as pro-poor sectors. Two major examples of such sectors are agriculture and construction. Among these, most of the activities of the agricultural sector also take place in rural areas where the poor live. From a structural point of view, if economic growth is either generated by expansion in outputs of these sectors or induces, through strong linkage effects, expansion in these sectors, the growth is pro-poor.
In the context of achieving the MDGs, reduction in income poverty jointly with hunger is only one goal. Other goals refer to the areas of child health, maternal health, communicable diseases, education, gender, environment and global cooperation. Economic growth, if it is pro-poor, will have very major and direct impact in achieving the income poverty target of goal-1. In fact, reduction of income poverty is, in some sense, tautological; if somebody’s income crosses, the ($1 per day) poverty line the person is no longer poor. However, this is not the situation with other goals (2 to 7). For achieving other goals, a person has to consume a minimum quantity of goods and services. For example, for reducing hunger, a person is required to consume some minimum amount of food. For reducing maternal mortality, a pregnant woman is required to visit medical clinic for check up on a regular basis or in other words consume a minimum (required) quantity of health services. Similar examples of consumption for achieving other goals are: education for goal 2 and 3, health for 4 and 6, water and sanitation for goal 7.
Consumption of goods and services is determined by income level, non income factors and price. For consumption of “MDG goods and services”2, the common non income factors refer to social barriers and customs which prevent people from using many such items despite possessing the required level of income. For example, in many Asia Pacific countries, pregnant women from relatively rich families do not regularly visit medical clinics due to lack of awareness or existence of social customs under which women are not allowed to be checked by male doctors.
Price of goods and services is determined by demand and supply conditions. Very often, severe supply constraints are responsible for high price of the MDG goods and services. There can be both direct and indirect supply constraints. For example, with reference to health services, absence of health clinics/hospitals in the neighbourhood (village, locality, town) will compel a person to walk or hire a transport to go to the next nearest facility. This will increase the implicit price of health services and inhibit consumption. Over and above, absence of proper road infrastructure will further add to the extent of the price increase. Similar examples can be provided for other MDG goods and services e.g. education, safe drinking water etc.
In the background of the above discussion, in addition to the “pro-poor” sectors e.g. agriculture and construction certain key sectors of the economy assume especial importance in achieving the MDGs. These are transport, energy, water, health and education. If outputs of these sectors do not expand
2 Broadly “MDG goods and services” refer to food, clean water and sanitation, health and
education.
MDGs cannot be achieved. A growth can be termed as pro- MDG if it is generated by or generates (through strong linkage effects) expansion of outputs of pro- poor sectors, physical infrastructure sectors and social infrastructure sectors. In a nutshell if economic growth entails income generation for the poor as well as improvement in both physical and social infrastructure which will allow adequate availability of “MDG goods and services” so that a large section of the population (including the poor) is able to consume these in appropriate quantities there is a very good chance that MDGs will be achieved. On the other hand, expansions in the MDG goods and services sector can also act as engines of growth, turning “pro-MDG growth” into “pro-growth MDGs” (see Box-1 on “Pro-MDG economic growth to Pro-growth MDGs”). This is possible through rise in productivity of labour following enhancement in human development. This can happen not only in the agriculture sector but also in other sectors such as industrial and service sectors. In the next section, we discuss the policies that can be classified as pro-MDGs. This section also explains how these policies, theoretically, are linked to various MDGs.
Box 1
Pro-MDG economic growth to pro-economic growth MDGs
Is it possible to turn around and directly link economic growth with achieving MDGs through expansion of MDG sectors? Available evidence point out to the fact that it can, and hence MDG based national development strategies which the countries agreed to prepare and implement represent a win-win situation for both the groups; the groups which think MDGs are essentially soft social/welfare issues and those who possess misgivings about supremacy of economic growth in national policy making. It can be argued that without giving attention to MDG goods and services the growth process will be non inclusive and not sustainable in the long run. On the other hand, appropriate investments in MDG goods and services sectors can, not only act as direct engines of economic growth but also will have strong positive impact on all the sector of the economy and unleash the full growth potential of developing countries. Pro- economic growth MDGs will be a strategy where MDG goods and services sectors will be major sources of growth.
In recent economic and business arena a number of MDG goods and services sector have been designated as “engines of growth”. Examples include the following
Infrastructure and construction led growth
The success story in this area is China. China’s marching ahead with over 10 percent GDP growth rates for over two decades followed a conventional path in transiting from an agricultural economy through building linkages among its agricultural industrial and service sectors. In this endeavour, massive infrastructure development played crucial multiple roles. Infrastructure investment acted as a major source of short term economic growth through boosting construction activities in a very significant manner. The resulting improved infrastructure facilities (roads, airports, ports, electricity and water) enabled manufacturing activity to grow at break- neck speed and contribute to maintenance of high export growth rates. China’s strong export performance is well known. It is also well known that a major determinant of inward FDI flows is high quality of infrastructure. This concept is vindicated by China’s excellent record in this area; $60 billion poured into the country in 2005.
The concept of infrastructure as an engine of growth is further exemplified in the case of China’s hosting the Olympics in 2008. The public and private sector investments towards infrastructure development for preparing for the Olympic are expected to touch $180 billion by 2008. The impact of this will be significant jobs for millions of low income and low skilled workers. Further, hosting the Olympics will help enhance the nations psyche and confidence. China is also using the Olympics to prepare its inefficient state owned
enterprises (SOE) to compete in the global economy, which will have significant positive short, medium and long term impact on economic growth.3
In India, the government aims to boost growth by improving the country’s infrastructure. The country has grown at an average rate of 8 percent during last three years and the government wants to increase that to 10 percent by building better roads, ports and power supplies. Recognizing that infrastructure can be an effective growth engine for the country. India intends to invest $150 billion in the sector in next few years.4
Agriculture led growth
The contribution of agriculture sector in jumpstarting economic growth in China after the country started breaking away from the centrally planned system is well documented. The introduction of household responsibility system which recognized private agriculture activities unleashed the growth potential of the country and it never looked back. India’s green revolution was the backbone of its development strategy in the early years. Agriculture production resulted in a record grain output of 131 million tons in 1978-79 and established India as one of the world’s biggest agriculture producers. Production of agriculture through improved technique needed more water, fertilizer, pesticide and other chemicals. This spurred growth of the manufacturing sector and the resulting industrial growth created new jobs and further contributed to the country’s GDP.
The scenario, however, started changing since 1990 when the country began to implement aggressive economic reform and liberalization programmes and non-agricultural sectors (especially certain service sector) became new engines of growth. Lack of investment in agriculture sector has become apparent in 2005 when, for the first time in decades the country imported wheat as domestic production did not increase in last 10 years.
It is interesting to note that agriculture which seemed to have lost its clout as an engine of growth is re-emerging. India’s countryside has long been regarded as a primary market for domestic business. Indian business now sees the rural agricultural sector as an engine of growth (through both demand and supply side) and a source of tremendous profit. A leading business group is planning to create a thousand of agriculture outlets around the country for stocking agriculture implements produced by both domestic and foreign producers and provide a variety of financial and health services in rural areas. By consolidating services and sales it is possible to improve farmers’ access to inputs and thus unleash a virtuous cycle of increased sales and increased agriculture production; thus contributing to the economic growth. A number of corporate sector led vertically integrated models are being implemented. All these efforts recognize the strong role of agriculture in creating economic growth.5
In the recent period, there is also a large interest in linking the agriculture sector to the industrial sector by encouraging and establishing food
3 http:// www. Advantage China, Frontline (Vol 22, Issue 06, March 12-25, 2005)
4 IDFC sees strong infrastructure led growth, Reuters Hyderabad, May 2006
5 Will agriculture be the next engine of growth in India’s economy? Asia Pacific Bulletin, October 18,
2006
processing industries. This is expected to both create jobs in the rural areas and also generate demand for the food products. This would help the rural economy tremendously and also help in achieving the MDGs in these areas where poor is highly concentrated.
Health and education led growth
Is it a question mark and only a food for thought or there is some reality in the above? As regards to health, recent research done at the Harvard School of Public Health (HSPH) suggests that for the two “Asian Giants” improvements in health and the changes in the size and age profile of the population that followed, were major factors propelling the two countries’ take offs. The motion of “health led growth” i.e., health improvements boosting developing economies under which health programmes e.g. preventive health care (eg. inoculation) strengthened overtime and increased number of healthy children which matured to a “bulge generation” and represented a potent economic force. The resulting “demographic dividend” significantly contributed to the success of the “Asian Tiger Economics” in the post World War II period.
There are other direct examples of health sector acting as an engine of growth. The recent emphasis of health tourism in countries like India and Thailand (see box), growing domestic health market as well as increase in various forms of care giving industries (including those in developed countries which can be exploited by developing Asia Pacific countries) are areas capable of attracting significant investment (private, public, public-private). Investment in modern health sector which has strong linkages with industrial, construction and service sectors is capable of promoting widespread economic activities and growth.
On the other hand, from a growth perspective public resources allocated for the provision of educational services can generate growth. The benefit of investing in “knowledge generation sectors” which are central to endogenous growth as brought forward by Robert Lucas, Barro and others (Endogenous Growth School) amply justifies such actions. However, similar to health, examples of direct contribution of education as a generator of growth are also abundant.
2.1 Pro-MDG economic policies Economic policies, which will enable a pro-MDG economic growth process to take place, can be classified under four broad groups; structural adjustment policies, macroeconomic stabilization policies, sectoral policies, and re-distributive policies.
2.1.1 Structural adjustment policies: The standard sets of measures which are applied to stimulate growth in developing countries under the rubric of economic reform are privatization, deregulation, trade and financial sector liberalization and capital account convertibility. These measures are expected to unleash the entrepreneurship and dynamic forces of private sector, both domestic and foreign, and thereby enhancing competition and efficiency; exploit the comparative advantage of the country in increasing exports; attract foreign capital especially in the form
of direct foreign investment and significantly contribute to the economic growth.
Although the above measures were able to enhance GDP growth rates in several Asia Pacific regions, especially East and Southeast Asian countries quite significantly, a single minded adherence to this approach in many circumstances could not guarantee that the growth was adequately contributing to the achievement of MDGs in a sustained manner. In fact the well-known sequencing problems that led to the 1997 financial and economic crisis and adverse employment impact of privatization are some of the negative side of the above mentioned policies.
Most of the Asia Pacific countries have undertaken these structural adjustment policies to enhance the productivity and market access. In this direction, many countries have brought down their tariff levels and QRs (quantitative restrictions) and worked for investor friendly environment to attract both trade and the financial resources. In the recent period, particularly after the stalling of Doha talks on world trade, many countries in the region have gone for FTAs (Free Trade Agreements) and BTAs (Bilateral Trade Agreements) to enhance trade relations. In addition to these, there are also some regional groups such ASEAN, SAARC, BIMSTEC etc that helps in improving trade. Given that the Asia Pacific region holds largest foreign exchange reserves, to optimally utilise these resources, there are efforts to develop the Asian Bond market to help each other in this region.
2.1.2 Macroeconomic stabilization policies The centrepiece of macroeconomic stabilization is ensuring a low inflation regime through fiscal and monetary discipline i.e. reducing fiscal deficit and thereby current account deficit. A low inflation regime is congenial for boosting both consumer and investor confidence, keeping real exchange rate and interest rate moderate and thus contributing to the generation and maintenance of an enabling atmosphere where economic activities and growth can flourish. However, the traditional Washington Consensus interpretation of macroeconomic stabilization, in many circumstances, overemphasis the virtues of low inflation which is often achieved through demand management at the expense of growth and development. For example, reduction of fiscal deficit which is a major instrument to control inflation, if achieved through reducing public expenditure especially on physical and social infrastructure can easily retard the process of growth itself in the short and medium run.
2.1.3 Sectoral Policies A major sector, whose growth ensures poverty reduction, is agriculture. Agriculture sector utilizes substantial labor input, a factor which the poor possess. The activities take place in rural areas where many of the poor live. The experience with agricultural growth suggests strong correlation with investments in rural infrastructure; irrigation networks, farm to market roads, and rural electrification. Adequate infrastructure, as argued before, will not only contribute to the increase the income of the rural poor and achieving goal 1 but also to the achievement of other goals.
Another pro poor sector is construction. The benefit in rapid growth of construction is two fold; it is labor intensive and can absorb a large portion of unskilled labor. In many South-East Asian countries, growth in construction was instrumental in relocating workers from low wage agriculture sector where they are underemployed to relatively well paid non agricultural sector. Construction activities in urban slums and squatters as well as in public works programme for rural infrastructure creation are pursued in many countries to provide income to the seasonally unemployed agriculture workers and thus, act as an “insurance” against their slipping back to poverty. In a large number of Asia Pacific developing countries, demand for infrastructure services such as transport, energy and water outstrips supply (output) by a wide margin. Outputs of these sectors are not only consumed directly (which also, as discussed before, contributes to the achievement of many MDGs) but also are crucial intermediate inputs for all other economic activities. The opportunity cost of infrastructure constraint could be very large in terms of lost economic growth and non-achievement of MDGs. Investing in infrastructure sectors is crucial for improving the situation. Similar situation is also observed in social infrastructure sectors namely health and education. Expansions of output (supply) of these sectors are crucial for enhancing economic growth as well as for achieving MDGs. Adequate investment in theses sectors are needed for creating required capacities.
2.1.4 Redistributive Policies These policies can be the essential ingredient for achieving a MDG-friendly economic growth process. One key area of implementing this policy for achieving MDGs is altering the quota and allocation of public resources through changing pattern of taxes and expenditures so as to lessen burden on the poor and increase availability of “MDG goods and services”. Measures taken to correct the existing subsides and pricing policies, tax restructuring, restructuring of public expenditure and reallocation of bank credit to priority sectors would contribute to the improvement of situation. Given this discussion on the pro-MDG policies, in Table-2, we try to see what policies that have bearing on each MDG goals and targets. It may be noted that many of these goals can be addressed under fiscal policy through different sectoral expenditures such as on health, education etc...
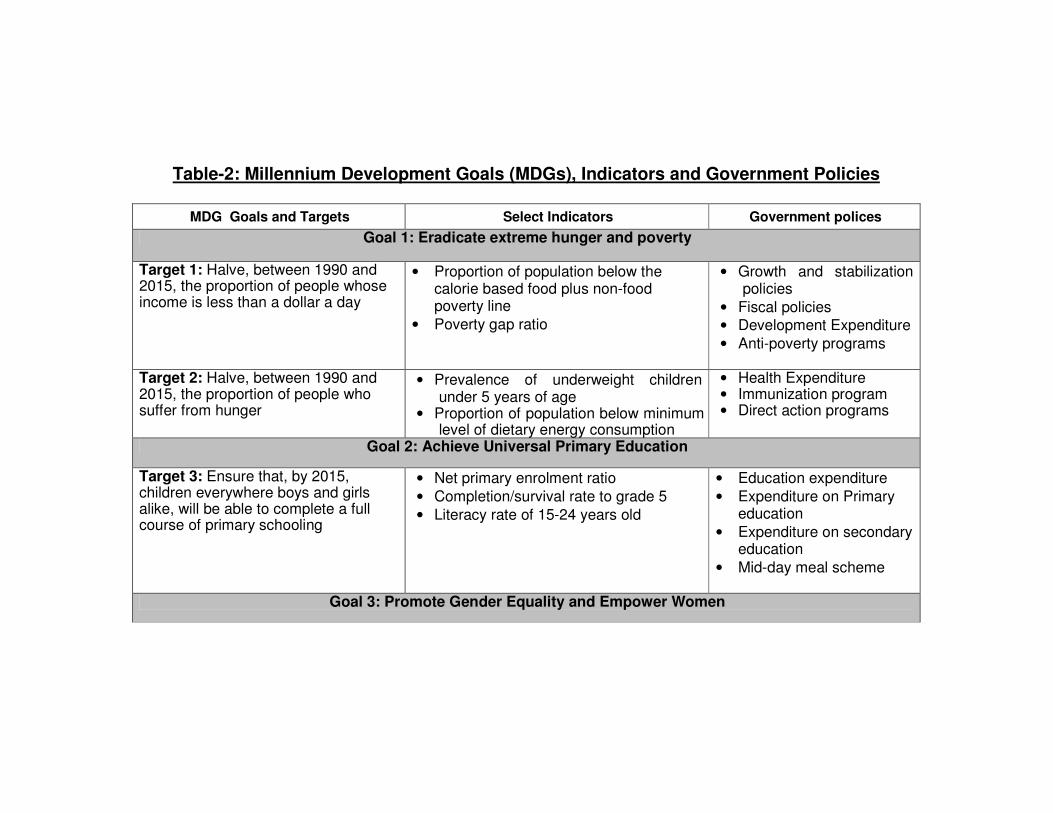
Table-2: Millennium Development Goals (MDGs), Indicators and Government Policies
MDG Goals and Targets Select Indicators Government polices
Goal 1: Eradicate extreme hunger and poverty
Target 1: Halve, between 1990 and 2015, the proportion of people whose income is less than a dollar a day
• Proportion of population below the calorie based food plus non-food poverty line
• Poverty gap ratio
• Growth and stabilization policies
• Fiscal policies • Development Expenditure • Anti-poverty programs
Target 2: Halve, between 1990 and 2015, the proportion of people who suffer from hunger
• Prevalence of underweight children under 5 years of age
• Proportion of population below minimum level of dietary energy consumption
• Health Expenditure • Immunization program • Direct action programs
Goal 2: Achieve Universal Primary Education
Target 3: Ensure that, by 2015, children everywhere boys and girls alike, will be able to complete a full course of primary schooling
• Net primary enrolment ratio • Completion/survival rate to grade 5 • Literacy rate of 15-24 years old
• Education expenditure • Expenditure on Primary
education • Expenditure on secondary
education • Mid-day meal scheme
Goal 3: Promote Gender Equality and Empower Women
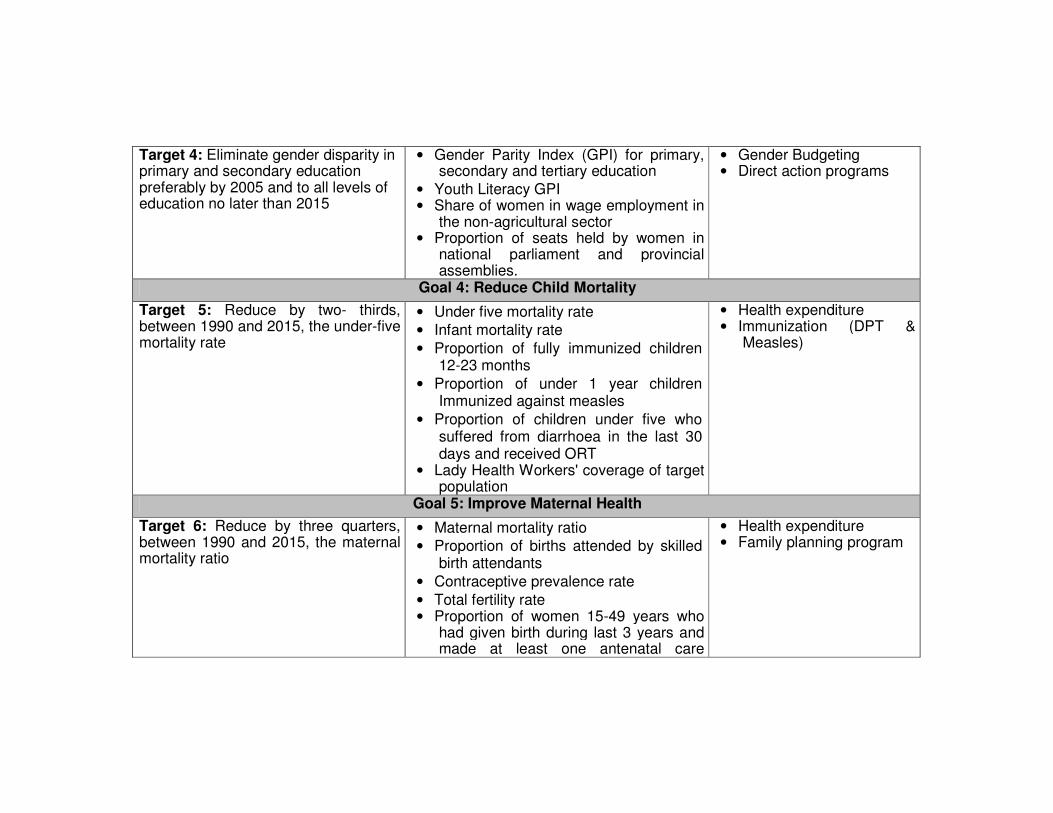
Target 4: Eliminate gender disparity in primary and secondary education preferably by 2005 and to all levels of education no later than 2015
• Gender Parity Index (GPI) for primary, secondary and tertiary education
• Youth Literacy GPI • Share of women in wage employment in
the non-agricultural sector • Proportion of seats held by women in
national parliament and provincial assemblies.
• Gender Budgeting • Direct action programs
Goal 4: Reduce Child Mortality
Target 5: Reduce by two- thirds, between 1990 and 2015, the under-five mortality rate
• Under five mortality rate • Infant mortality rate • Proportion of fully immunized children
12-23 months • Proportion of under 1 year children
Immunized against measles • Proportion of children under five who
suffered from diarrhoea in the last 30 days and received ORT
• Lady Health Workers' coverage of target population
• Health expenditure • Immunization (DPT &
Measles)
Goal 5: Improve Maternal Health
Target 6: Reduce by three quarters, between 1990 and 2015, the maternal mortality ratio
• Maternal mortality ratio • Proportion of births attended by skilled
birth attendants • Contraceptive prevalence rate • Total fertility rate • Proportion of women 15-49 years who
had given birth during last 3 years and made at least one antenatal care
• Health expenditure • Family planning program
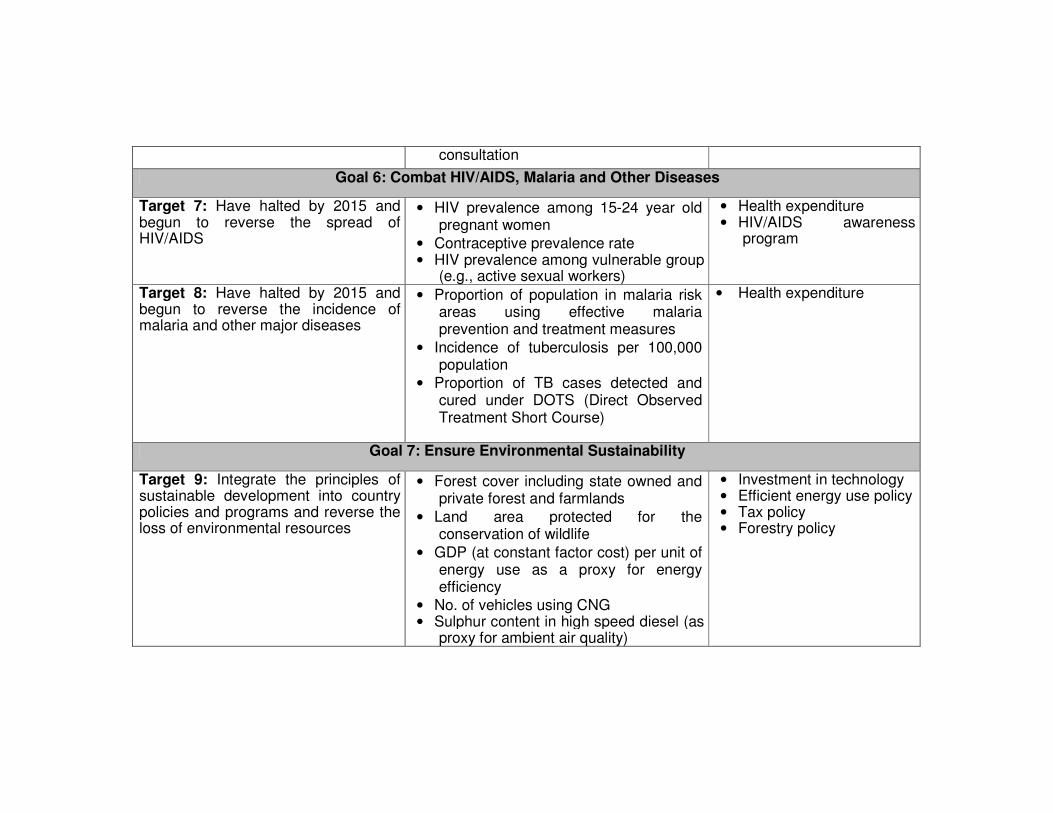
consultation
Goal 6: Combat HIV/AIDS, Malaria and Other Diseases
Target 7: Have halted by 2015 and begun to reverse the spread of HIV/AIDS
• HIV prevalence among 15-24 year old pregnant women
• Contraceptive prevalence rate • HIV prevalence among vulnerable group
(e.g., active sexual workers)
• Health expenditure • HIV/AIDS awareness
program
Target 8: Have halted by 2015 and begun to reverse the incidence of malaria and other major diseases
• Proportion of population in malaria risk areas using effective malaria prevention and treatment measures
• Incidence of tuberculosis per 100,000 population
• Proportion of TB cases detected and cured under DOTS (Direct Observed Treatment Short Course)
• Health expenditure
Goal 7: Ensure Environmental Sustainability
Target 9: Integrate the principles of sustainable development into country policies and programs and reverse the loss of environmental resources
• Forest cover including state owned and private forest and farmlands
• Land area protected for the conservation of wildlife
• GDP (at constant factor cost) per unit of energy use as a proxy for energy efficiency
• No. of vehicles using CNG • Sulphur content in high speed diesel (as
proxy for ambient air quality)
• Investment in technology • Efficient energy use policy • Tax policy • Forestry policy
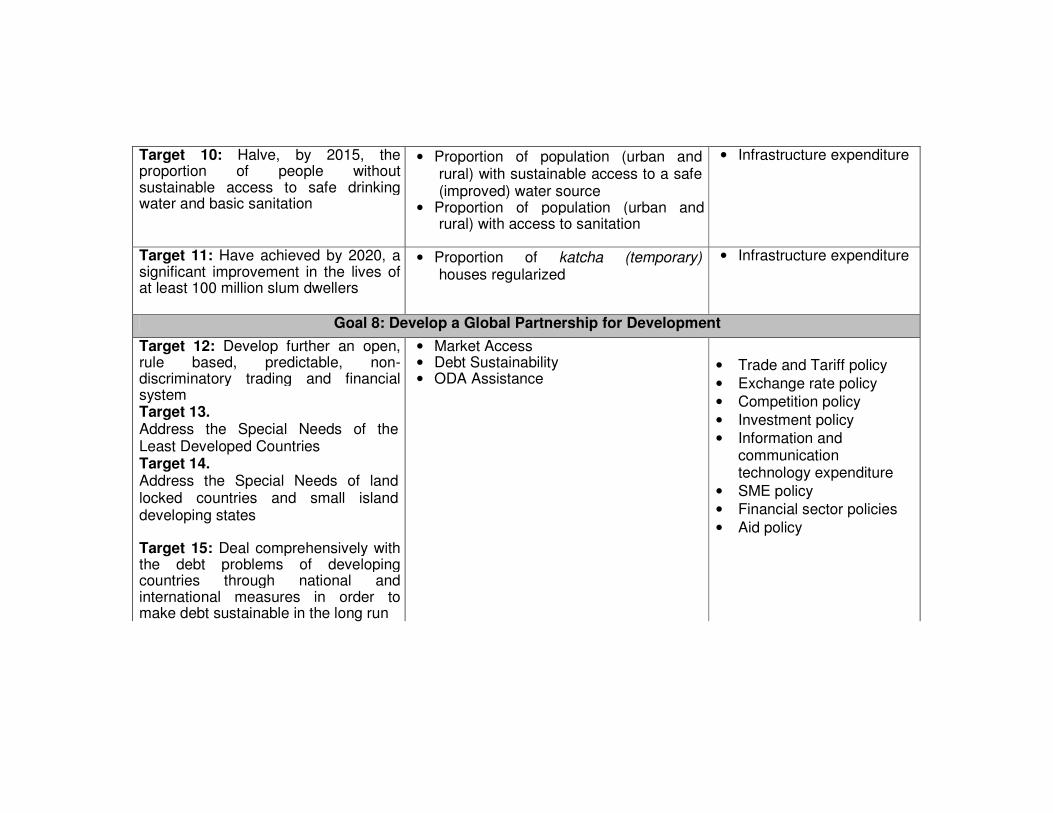
Target 10: Halve, by 2015, the proportion of people without sustainable access to safe drinking water and basic sanitation
• Proportion of population (urban and rural) with sustainable access to a safe (improved) water source
• Proportion of population (urban and rural) with access to sanitation
• Infrastructure expenditure
Target 11: Have achieved by 2020, a significant improvement in the lives of at least 100 million slum dwellers
• Proportion of katcha (temporary) houses regularized
• Infrastructure expenditure
Goal 8: Develop a Global Partnership for Development
Target 12: Develop further an open, rule based, predictable, non-discriminatory trading and financial system Target 13. Address the Special Needs of the Least Developed Countries Target 14. Address the Special Needs of land locked countries and small island developing states Target 15: Deal comprehensively with the debt problems of developing countries through national and international measures in order to make debt sustainable in the long run
• Market Access • Debt Sustainability • ODA Assistance
• Trade and Tariff policy • Exchange rate policy • Competition policy • Investment policy • Information and
communication technology expenditure
• SME policy • Financial sector policies • Aid policy

Target 16: In cooperation with developing countries, develop and implement strategies for decent and productive work for youth
• Unemployment rate of young people aged 15-24 years of age by sex and total
Target 17: In cooperation with pharmaceutical companies, provide access to affordable essential drugs in developing countries
• Proportion of population with access to affordable essential drugs in developing countries
Target 18: In cooperation with the private sector, make available the benefits of new technologies, especially information and communications
• Telephone lines and cellular subscribers per 100 population
• Personal computers in use per 100 population and internet users per 100 population
Source: First two columns of this table are taken from UNDP, Pakistan. (www.undp.pk).
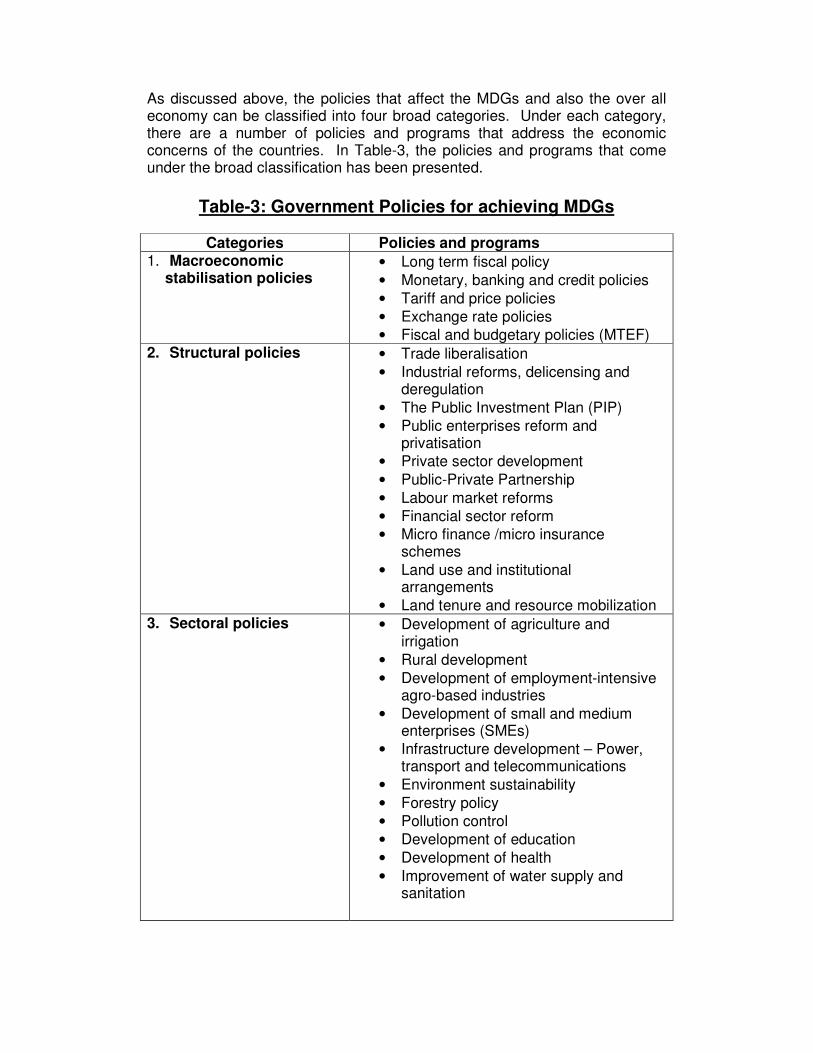
As discussed above, the policies that affect the MDGs and also the over all economy can be classified into four broad categories. Under each category, there are a number of policies and programs that address the economic concerns of the countries. In Table-3, the policies and programs that come under the broad classification has been presented.
Table-3: Government Policies for achieving MDGs
Categories Policies and programs
1. Macroeconomic stabilisation policies
• Long term fiscal policy • Monetary, banking and credit policies • Tariff and price policies • Exchange rate policies • Fiscal and budgetary policies (MTEF)
2. Structural policies
• Trade liberalisation • Industrial reforms, delicensing and
deregulation • The Public Investment Plan (PIP) • Public enterprises reform and
privatisation • Private sector development • Public-Private Partnership • Labour market reforms • Financial sector reform • Micro finance /micro insurance
schemes • Land use and institutional
arrangements • Land tenure and resource mobilization
3. Sectoral policies
• Development of agriculture and irrigation
• Rural development • Development of employment-intensive
agro-based industries • Development of small and medium
enterprises (SMEs) • Infrastructure development – Power,
transport and telecommunications • Environment sustainability • Forestry policy • Pollution control • Development of education • Development of health • Improvement of water supply and
sanitation

4. Redistributive policies • Employment generation programs
• Social inclusion policies • Food for works programs, public
works programs for revitalizing local communities
• Mainstreaming women and the excluded groups
• Targeted programs • Funding for targeted programs • Social deprivation and anti-poverty
programs
From Table-3, to undertake the estimation of gap analysis, we have taken some of the important policy indicators that falls in four broad sub-categories. The list of indicators considered in the analysis is presented in Appendix-1. In the next section, we discuss the methodology in estimating the ‘gaps’ in the policies that needs to be addressed for achieving the MDGs. 3. Estimation of performance of pro-MDG policies through a gap analysis of the indicators Good or bad performance of pro MDG economic policies are responsible for the quality (good or bad) of the track record in being on the track for achieving MDGs by 2015 or before by generating a pro MDG growth process. Based on the discussions of the previous chapters it is possible to identify indicators which can measure the effectiveness of economic policies (stabilization, structural adjustment, sectoral and redistributive) in transforming the growth process into a pro-MDG one. For example, infrastructure investment to GDP ratio, the increment of which (with a lag) will signify expanded availability of infrastructure which in its turn will facilitate consumption of MDG goods and services can be an example of such an indicator. Ideally all the identified indicators can be studied and their behaviour analysed. However, availability of information can be a constraint. Under this situation, it may be required to select a subset of the indicators for actual quantification for selected countries which are commonly turned as “off (MDG) track” countries and compare the values with these for good (MDG) performing “on track countries”. The exercise would involve identifying and computing the indicators for the selected (off and on track) countries with data compiled various sources, check the consistency of the data and performing the required calculations. The difference between the values of the selected indicators between “off track” and “on track countries” and their behavior over time can be computed which are expected to provide guidance for needed possible changes in priority areas. In this paper such as exercise undertaken in a very limited scale is reported to illustrate the methodology, results and the types of conclusions which can be derived and their possible use.
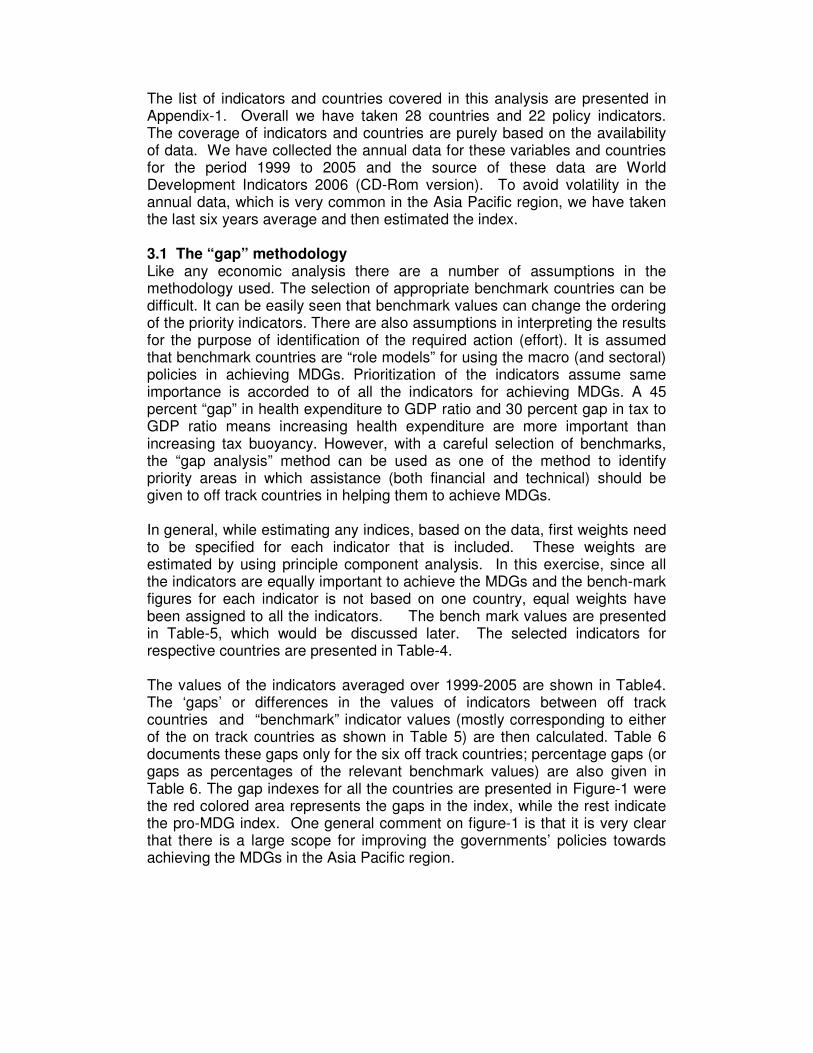
The list of indicators and countries covered in this analysis are presented in Appendix-1. Overall we have taken 28 countries and 22 policy indicators. The coverage of indicators and countries are purely based on the availability of data. We have collected the annual data for these variables and countries for the period 1999 to 2005 and the source of these data are World Development Indicators 2006 (CD-Rom version). To avoid volatility in the annual data, which is very common in the Asia Pacific region, we have taken the last six years average and then estimated the index. 3.1 The “gap” methodology Like any economic analysis there are a number of assumptions in the methodology used. The selection of appropriate benchmark countries can be difficult. It can be easily seen that benchmark values can change the ordering of the priority indicators. There are also assumptions in interpreting the results for the purpose of identification of the required action (effort). It is assumed that benchmark countries are “role models” for using the macro (and sectoral) policies in achieving MDGs. Prioritization of the indicators assume same importance is accorded to of all the indicators for achieving MDGs. A 45 percent “gap” in health expenditure to GDP ratio and 30 percent gap in tax to GDP ratio means increasing health expenditure are more important than increasing tax buoyancy. However, with a careful selection of benchmarks, the “gap analysis” method can be used as one of the method to identify priority areas in which assistance (both financial and technical) should be given to off track countries in helping them to achieve MDGs. In general, while estimating any indices, based on the data, first weights need to be specified for each indicator that is included. These weights are estimated by using principle component analysis. In this exercise, since all the indicators are equally important to achieve the MDGs and the bench-mark figures for each indicator is not based on one country, equal weights have been assigned to all the indicators. The bench mark values are presented in Table-5, which would be discussed later. The selected indicators for respective countries are presented in Table-4. The values of the indicators averaged over 1999-2005 are shown in Table4. The ‘gaps’ or differences in the values of indicators between off track countries and “benchmark” indicator values (mostly corresponding to either of the on track countries as shown in Table 5) are then calculated. Table 6 documents these gaps only for the six off track countries; percentage gaps (or gaps as percentages of the relevant benchmark values) are also given in Table 6. The gap indexes for all the countries are presented in Figure-1 were the red colored area represents the gaps in the index, while the rest indicate the pro-MDG index. One general comment on figure-1 is that it is very clear that there is a large scope for improving the governments’ policies towards achieving the MDGs in the Asia Pacific region.

Table 4. Selected macroeconomic indicators for some Asia Pacific countries
Indicators Bangladesh China Nepal Pakistan Thailand India Sri Lanka Indonesia Kazakhstan
Korea Rep Malaysia Philippines
Russian Federation
GDP growth (%) 5.2 9.4 2.5 4.1 5.4 6.0 4.0 4.0 9.1 6.1 5.4 4.2 6.8
Tax/GDP 7.8 7.6 9.1 11.0 15.4 9.1 14.5 12.7 11.3 15.2 16.7 13.2 13.5
M3/GDP 36.5 165.7 41.8 44.0 114.9 60.1 48.4 50.2 19.0 87.4 127.8 64.0 25.7
Export/GDP 14.2 27.4 20.7 17.8 64.3 14.7 36.7 34.7 49.4 39.2 113.0 51.2 38.3 Exp. On Education/GDP 1.3 2.0 3.2 2.3 3.6 4.0 2.6 1.2 4.4 3.7 4.9 3.0 3.5 Exp. primary (% of GDPPC) 8.6 12.1 17.4 12.4 3.3 11.1 17.1 16.7 11.8
Exp. Health/GDP 3.2 5.6 4.9 3.3 3.8 5.0 3.6 2.9 3.8 5.2 3.5 3.3 5.7
Direct tax/Total tax 16.1 9.5 19.9 28.5 36.4 28.9 16.5 50.2 36.0 36.2 60.8 45.0 10.1
IT Exp/GDP 2.3 4.7 6.8 3.6 3.7 5.4 2.8 6.6 6.9 5.5 3.6
Credit/GDP 37.2 149.1 42.1 39.6 121.1 55.6 42.8 54.4 13.1 97.6 155.8 63.6 27.3
Immunisation (DPT 83.4 89.6 73.4 63.8 96.4 62.5 98.5 72.5 94.5 94.0 96.0 79.7 96.2 Customs clearances (in days) 11.5 7.9 17.1 4.6 6.7 4.1 5.8 5.3 3.7 9.1 6.9
Bank branches 4.5 1.3 1.7 4.7 7.2 6.3 6.9 8.4 2.5 13.4 9.8 7.8 2.2 Immunisation (measles) 76.6 84.0 72.2 60.8 94.8 56.0 98.4 71.6 97.6 96.8 91.8 80.2 97.4
Policy uncertainty 45.4 32.9 40.1 29.1 20.9 34.0 48.2 18.5 22.4 29.5 31.5 Employment rigidity 24.0 30.0 44.0 49.0 42.0 48.0 40.0 57.0 27.0 34.0 41.0 27.0 Business Start-up time 8.0 13.0 7.0 11.0 8.0 10.5 8.0 12.0 9.0 9.0 11.0 10.5
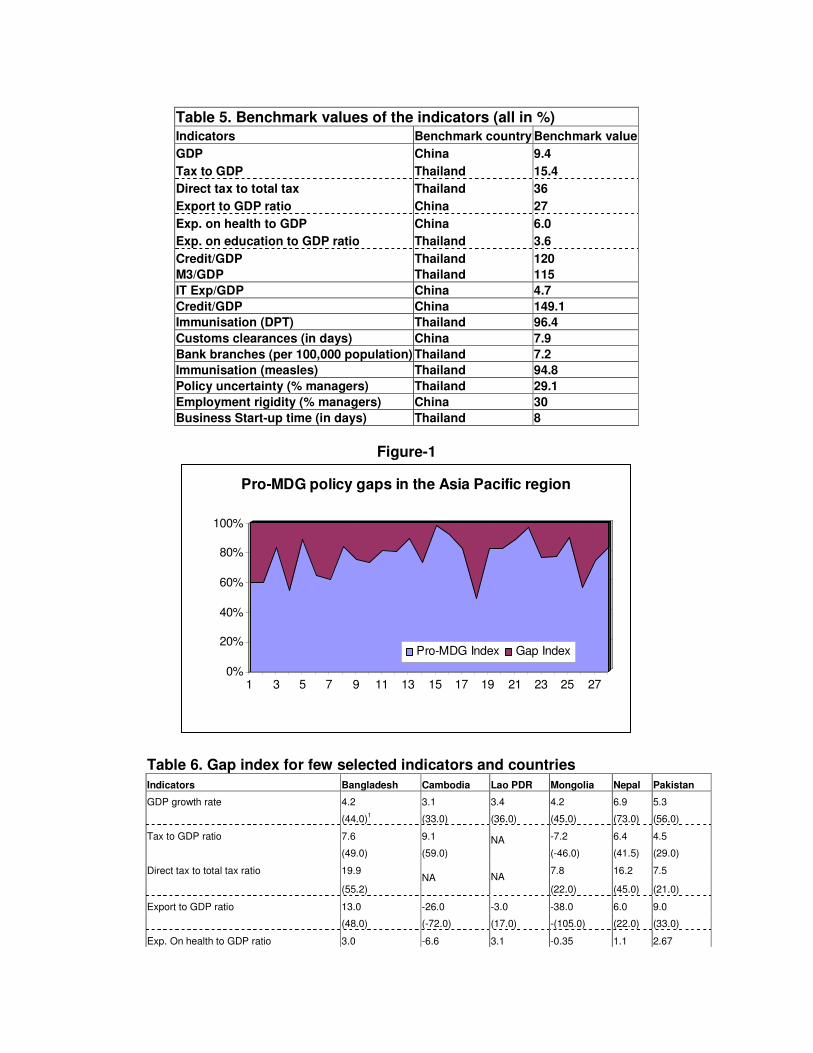
Table 5. Benchmark values of the indicators (all in %) Indicators Benchmark country Benchmark value
GDP China 9.4
Tax to GDP Thailand 15.4
Direct tax to total tax Thailand 36
Export to GDP ratio China 27
Exp. on health to GDP China 6.0
Exp. on education to GDP ratio Thailand 3.6
Credit/GDP Thailand 120
M3/GDP Thailand 115
IT Exp/GDP China 4.7
Credit/GDP China 149.1
Immunisation (DPT) Thailand 96.4
Customs clearances (in days) China 7.9
Bank branches (per 100,000 population) Thailand 7.2
Immunisation (measles) Thailand 94.8
Policy uncertainty (% managers) Thailand 29.1
Employment rigidity (% managers) China 30
Business Start-up time (in days) Thailand 8
Figure-1
0%
20%
40%
60%
80%
100%
1 3 5 7 9 11 13 15 17 19 21 23 25 27
Pro-MDG policy gaps in the Asia Pacific region
Pro-MDG Index Gap Index
Table 6. Gap index for few selected indicators and countries
Indicators Bangladesh Cambodia Lao PDR Mongolia Nepal Pakistan
GDP growth rate 4.2 3.1 3.4 4.2 6.9 5.3
(44.0)1 (33.0) (36.0) (45.0) (73.0) (56.0)
Tax to GDP ratio 7.6 9.1 -7.2 6.4 4.5
(49.0) (59.0)
NA (-46.0) (41.5) (29.0)
Direct tax to total tax ratio 19.9 7.8 16.2 7.5
(55.2)
NA
NA
(22.0) (45.0) (21.0)
Export to GDP ratio 13.0 -26.0 -3.0 -38.0 6.0 9.0
(48.0) (-72.0) (17.0) -(105.0) (22.0) (33.0)
Exp. On health to GDP ratio 3.0 -6.6 3.1 -0.35 1.1 2.67
(50.0) (83.0) (56.0) (-0.5) (18.0) (44.5)
Exp. On education to GDP ratio 2.3 1.8 1.8 -2.1 0.4 1.3
(69.0) (94.0) (90.0) (84.0) (65.0) (67.0)
Financial Inclusion Index 82.8 113.5 108.3 101.7 77.9 80.4
(69.0) (94.0) (90.0) (84.0) (65.0) (67.0)
M3/GDP 78.5 99.5 97.8 82.0 73.2 71.0
(69.0) (86.5) (85.0) (72.0) (63.6) (62.0)
1Figures in brackets represent percent gaps i.e. gaps as percentage of relevant benchmark values
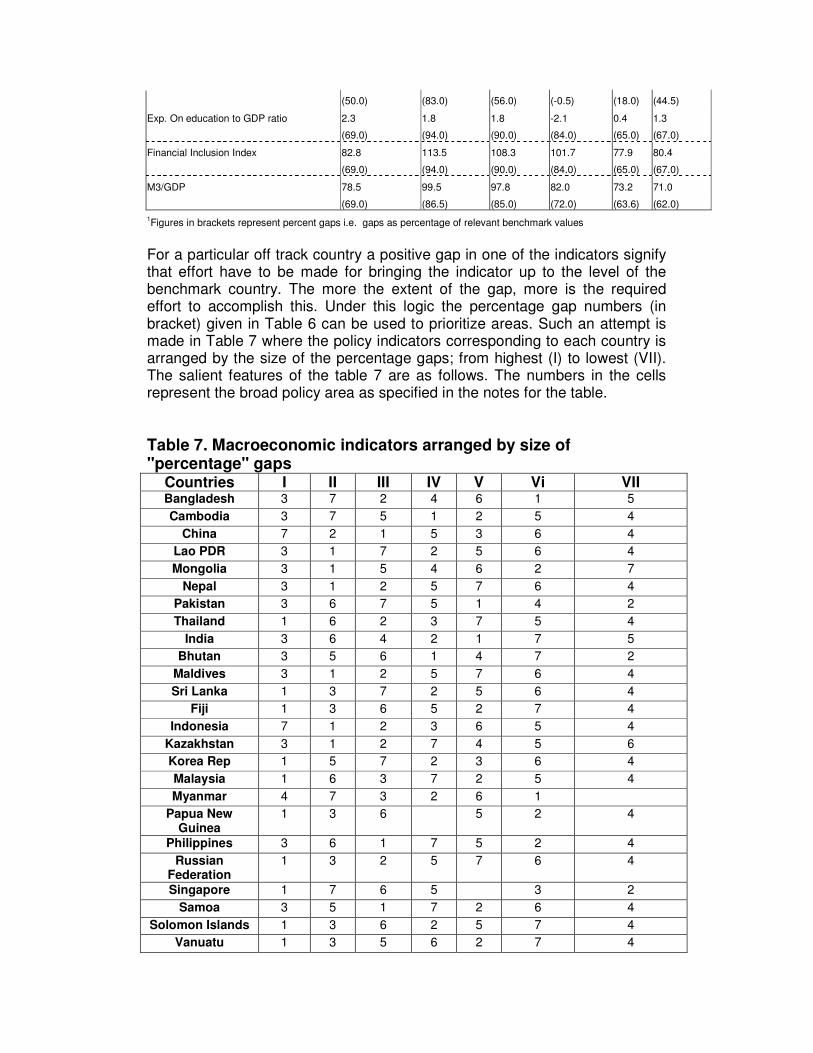
For a particular off track country a positive gap in one of the indicators signify that effort have to be made for bringing the indicator up to the level of the benchmark country. The more the extent of the gap, more is the required effort to accomplish this. Under this logic the percentage gap numbers (in bracket) given in Table 6 can be used to prioritize areas. Such an attempt is made in Table 7 where the policy indicators corresponding to each country is arranged by the size of the percentage gaps; from highest (I) to lowest (VII). The salient features of the table 7 are as follows. The numbers in the cells represent the broad policy area as specified in the notes for the table. Table 7. Macroeconomic indicators arranged by size of "percentage" gaps
Countries I II III IV V Vi VII Bangladesh 3 7 2 4 6 1 5
Cambodia 3 7 5 1 2 5 4
China 7 2 1 5 3 6 4
Lao PDR 3 1 7 2 5 6 4
Mongolia 3 1 5 4 6 2 7
Nepal 3 1 2 5 7 6 4
Pakistan 3 6 7 5 1 4 2
Thailand 1 6 2 3 7 5 4
India 3 6 4 2 1 7 5
Bhutan 3 5 6 1 4 7 2
Maldives 3 1 2 5 7 6 4
Sri Lanka 1 3 7 2 5 6 4
Fiji 1 3 6 5 2 7 4
Indonesia 7 1 2 3 6 5 4
Kazakhstan 3 1 2 7 4 5 6
Korea Rep 1 5 7 2 3 6 4
Malaysia 1 6 3 7 2 5 4
Myanmar 4 7 3 2 6 1
Papua New Guinea
1 3 6 5 2 4
Philippines 3 6 1 7 5 2 4
Russian Federation
1 3 2 5 7 6 4
Singapore 1 7 6 5 3 2
Samoa 3 5 1 7 2 6 4
Solomon Islands 1 3 6 2 5 7 4
Vanuatu 1 3 5 6 2 7 4
Togo 3 1 5 7 2 6 4
Viet Nam 3 7 5 2 1 6 4
Tonga 1 3 4 7 2 5 6
Note: a) 1=Macro policy, 2=Fiscal policy, 3=Financial inclusion, 4=Trade 5= Business ease, 6= Health, 7= Education
b) Column-1 represent indicators with highest percentage gap, column- 2 represent the next highest and so on
Source: Appendix-3 For easy readability of Table-7, we prepared a cross matrix that provides information regarding the policy that are specified having highest gap among the countries. This is presented in Table-8
Table-8 Cross matrix of polices and gaps (number of countries)
Categories I II III IV V Vi VII
1. Macro 11 7 3 2 3 2 0
2. Fiscal 0 1 7 7 7 3 3
3. Finance 14 7 2 2 2 1 0
4. Trade 1 0 2 2 2 1 19
5. Business 0 3 5 7 5 6 2
6. Health 0 5 5 1 4 10 2
7. Education 2 5 4 6 4 5 1
Source: Table-7 From Table-8, it is clear that the gaps in trade policies are very minimal. This is also reflected in declining tariff rates and rising exports (as percentage of GDP) in most of the selected countries. But the gaps in both growth and financial sector policies seem to be quite large. This calls for a revamp in the stabilisation policies and also for necessary reforms in the financial sector that helps in resource mobilisation (both from domestic and international sources). Two specific observations based on Tables-7 & 8 are as follows:
1. The priority areas (a particular indicator can be associated with one
area) are somewhat different between the countries. 2. Financial sector and macroeconomic policies needs to be addressed in
such a way that would lead to achieving MDGs.
The second observation holds some very interesting interpretations on priority policy areas on which immediate attention should be given for achieving MDGs at lest in 14 countries. Although, no immediate linkage can be established between financial inclusiveness and achieving MDGs, there is no doubt that a strong and inclusive financial sector is needed for exploiting the opportunities arising from strengthening of globalization and the sustaining the momentum of growth which is undoubtedly a necessary element for achieving MDGs. In the next section, we discuss the trends in economic policies in seven broad categories as specified in Table-7.
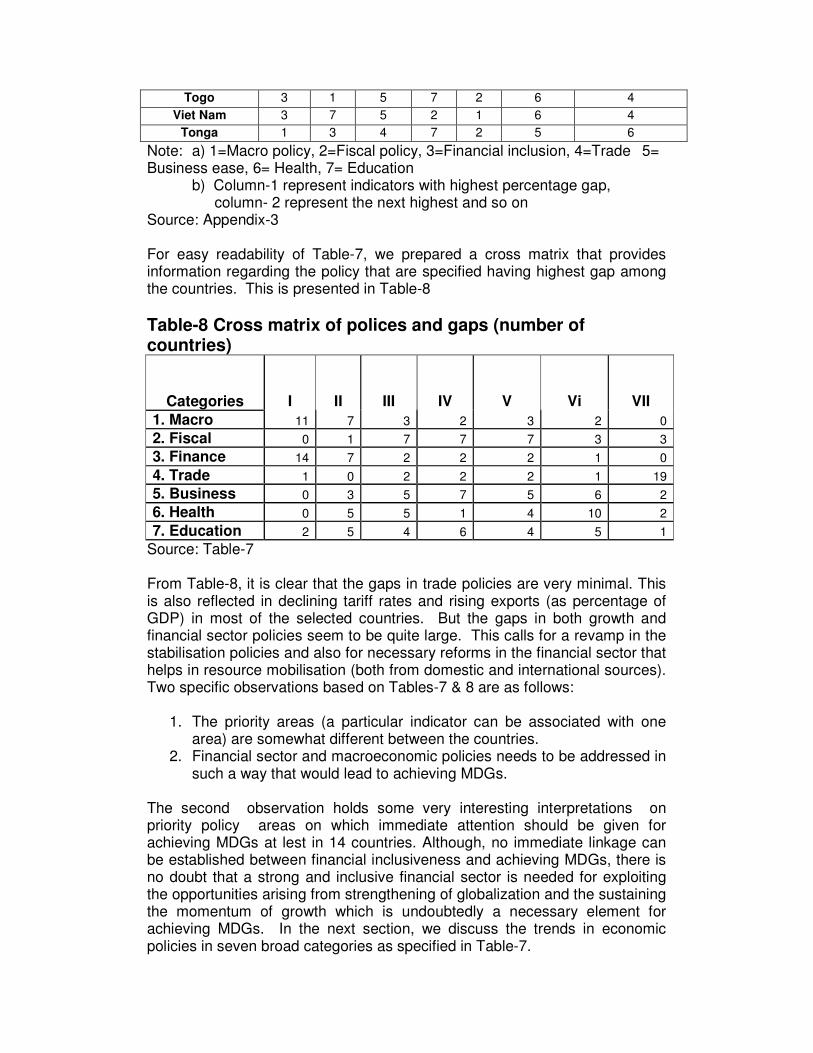
3.2 Growth (macroeconomic) policies Growth of output in any economy has become a very important indicator to achieve the MDGs in general and the Goal-1 in particular. A number of country specific and also cross country studies have shown that the increase in output growth does reduce the incidence of poverty and hunger in the economy. Achieving high growths of output also becomes precondition for diverting the resources to the developmental activities that helps in achieving the other goals of MDGs. In the Asia Pacific region, most of the countries are less developed and, hence, achieving high growth in output becomes imperative for increasing equitable consumption and distribution of resources. In terms of stabilization policies, it is found that the average annual inflation rate for the selected countries is 5.8%. It may be noted from the figure-2 that majority of countries are below the average inflation line (thick line in figures 2 and 3 represent the average levels), while atleast four countries are experiencing double-digit inflation. This shows that, although some countries are having above the average inflation, more or less majoirity of the countries were able to achieve macroeconomic stability with lower inflation and this is despite high world oil prices since the year 2002.
Figure-2
Inflation in some Asia Pacific countries
0.0
5.0
10.0
15.0
20.0
25.0
30.0
0 5 10 15 20 25 30 35
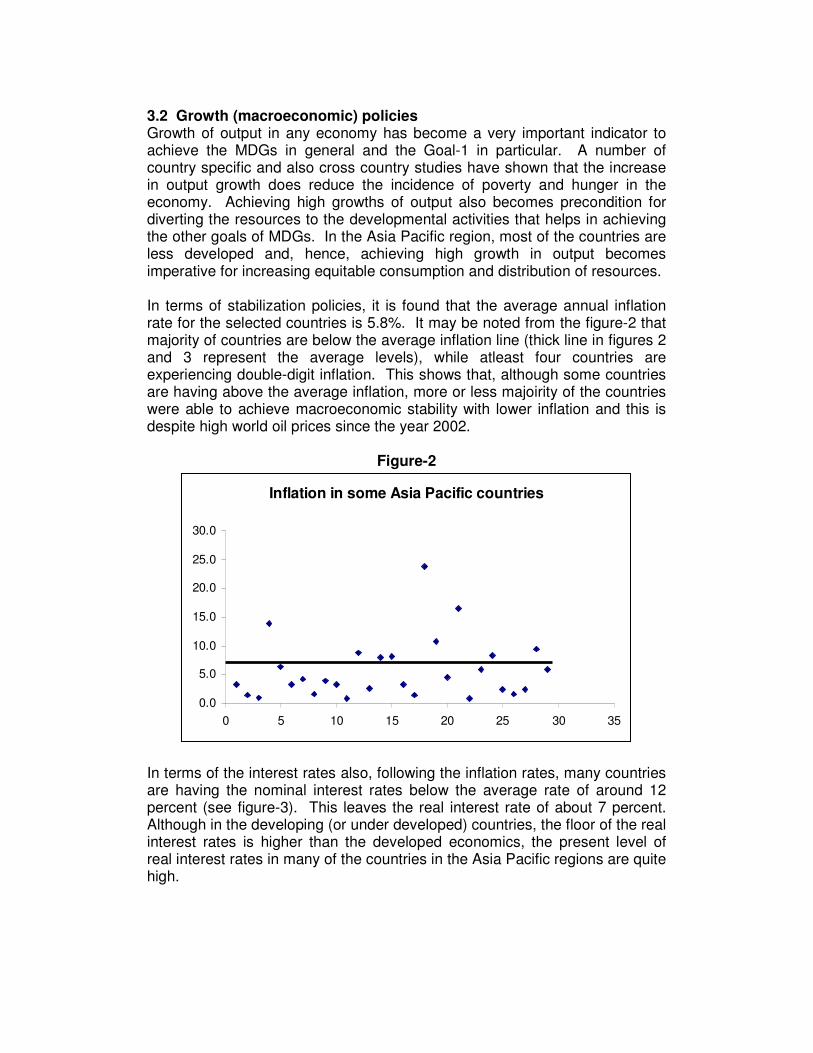
In terms of the interest rates also, following the inflation rates, many countries are having the nominal interest rates below the average rate of around 12 percent (see figure-3). This leaves the real interest rate of about 7 percent. Although in the developing (or under developed) countries, the floor of the real interest rates is higher than the developed economics, the present level of real interest rates in many of the countries in the Asia Pacific regions are quite high.
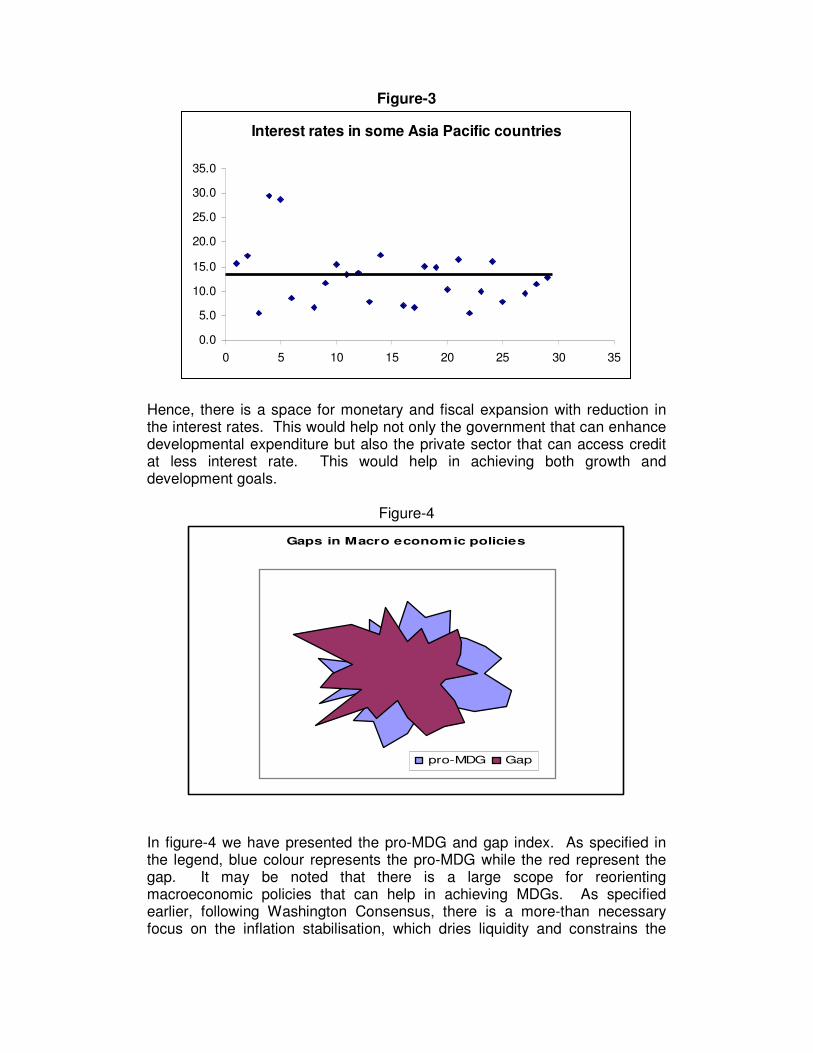
Figure-3
Interest rates in some Asia Pacific countries
0.0
5.0
10.0
15.0
20.0
25.0
30.0
35.0
0 5 10 15 20 25 30 35
Hence, there is a space for monetary and fiscal expansion with reduction in the interest rates. This would help not only the government that can enhance developmental expenditure but also the private sector that can access credit at less interest rate. This would help in achieving both growth and development goals.
Figure-4
Gaps in Macro economic policies
pro-MDG Gap
In figure-4 we have presented the pro-MDG and gap index. As specified in the legend, blue colour represents the pro-MDG while the red represent the gap. It may be noted that there is a large scope for reorienting macroeconomic policies that can help in achieving MDGs. As specified earlier, following Washington Consensus, there is a more-than necessary focus on the inflation stabilisation, which dries liquidity and constrains the
growth and development. As evident from the above figure, there is a need to address the macro policies in such a way that it helps in achieving MDGs.
3.3 Fiscal Deficit It is very well established in the literature that high fiscal deficit would have adverse impact on the output through its impact on the private investments and also through its inflationary impact. Here one needs to differentiate the fiscal deficit through the way how it is financed. There are two ways to finance: one through monetisation and another through open market borrowing. If the fiscal deficit is financed by market borrowings, then it would not be inflationary. But if the deficit is financed through monetisation, then it would be inflationary and would have adverse impact on the growth. In the underdeveloped (or developing) economies like most countries in Asia Pacific region, where the scarcity of capital is a major problem, the deficits are mostly financed through monetisation. Hence, this would have much more adverse impact on the growth and hence on the Goal 1.
Figure-5
Gaps in Fiscal Policies
pro-MDG Gap
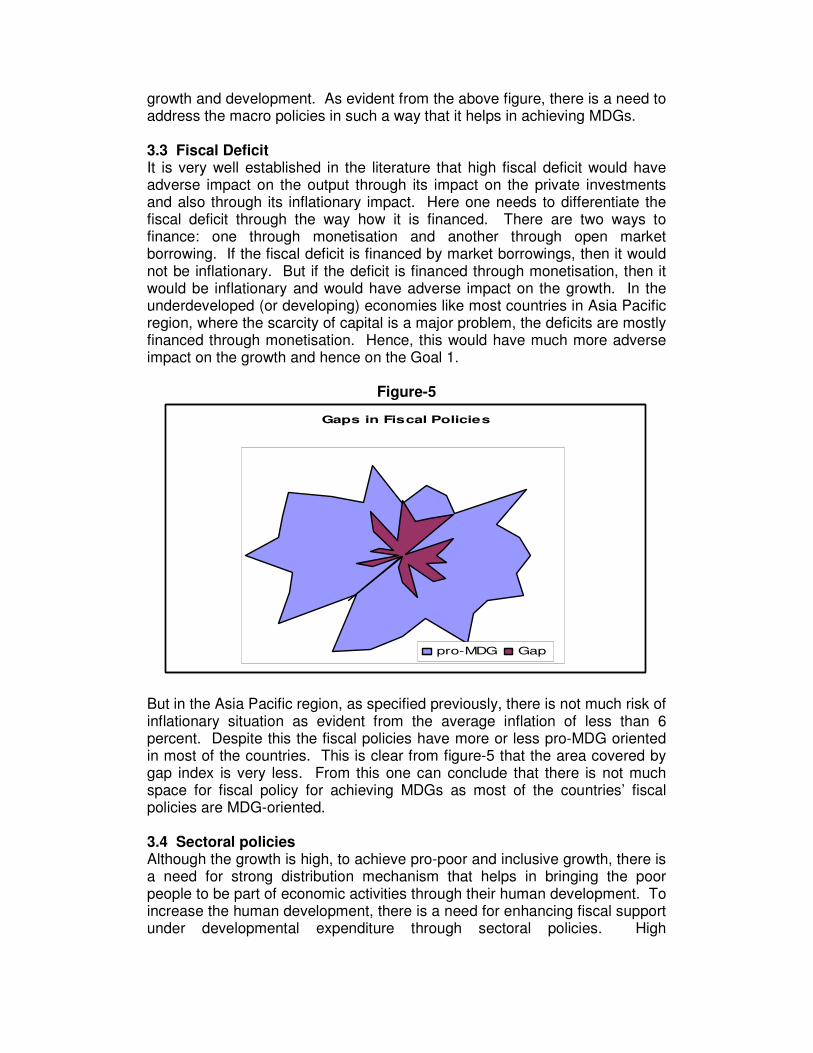
But in the Asia Pacific region, as specified previously, there is not much risk of inflationary situation as evident from the average inflation of less than 6 percent. Despite this the fiscal policies have more or less pro-MDG oriented in most of the countries. This is clear from figure-5 that the area covered by gap index is very less. From this one can conclude that there is not much space for fiscal policy for achieving MDGs as most of the countries’ fiscal policies are MDG-oriented. 3.4 Sectoral policies Although the growth is high, to achieve pro-poor and inclusive growth, there is a need for strong distribution mechanism that helps in bringing the poor people to be part of economic activities through their human development. To increase the human development, there is a need for enhancing fiscal support under developmental expenditure through sectoral policies. High
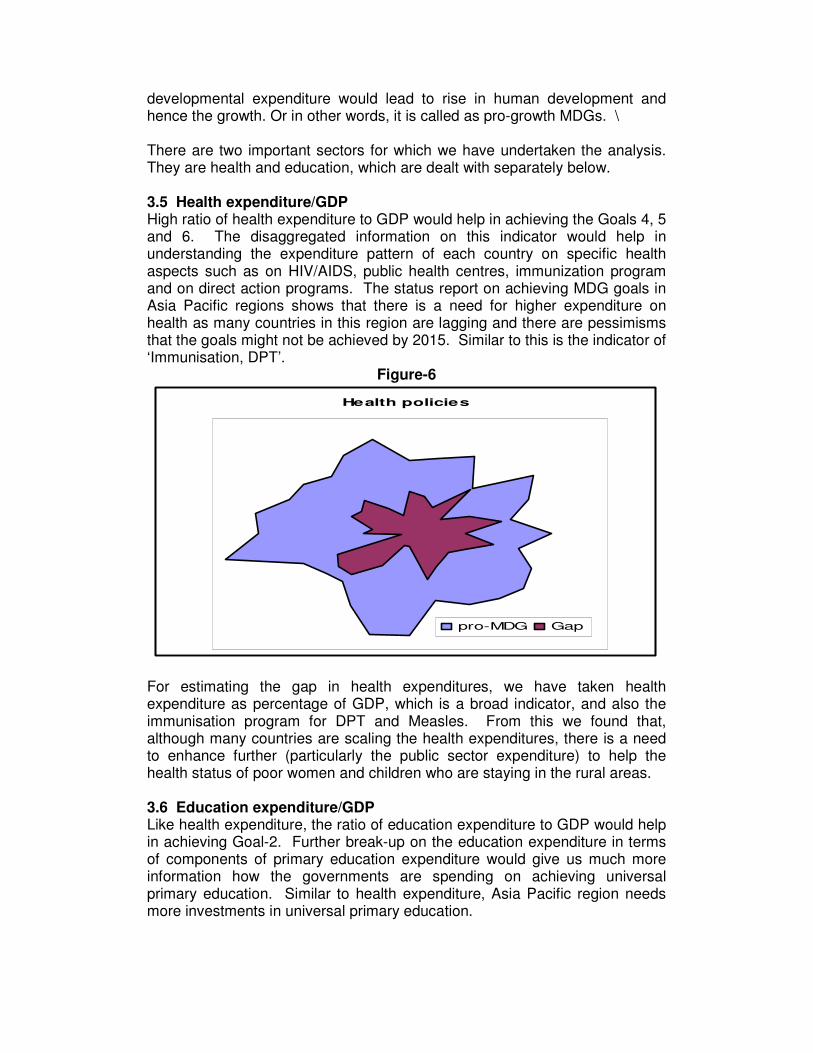
developmental expenditure would lead to rise in human development and hence the growth. Or in other words, it is called as pro-growth MDGs. \ There are two important sectors for which we have undertaken the analysis. They are health and education, which are dealt with separately below. 3.5 Health expenditure/GDP High ratio of health expenditure to GDP would help in achieving the Goals 4, 5 and 6. The disaggregated information on this indicator would help in understanding the expenditure pattern of each country on specific health aspects such as on HIV/AIDS, public health centres, immunization program and on direct action programs. The status report on achieving MDG goals in Asia Pacific regions shows that there is a need for higher expenditure on health as many countries in this region are lagging and there are pessimisms that the goals might not be achieved by 2015. Similar to this is the indicator of ‘Immunisation, DPT’.
Figure-6
Health policies
pro-MDG Gap
For estimating the gap in health expenditures, we have taken health expenditure as percentage of GDP, which is a broad indicator, and also the immunisation program for DPT and Measles. From this we found that, although many countries are scaling the health expenditures, there is a need to enhance further (particularly the public sector expenditure) to help the health status of poor women and children who are staying in the rural areas. 3.6 Education expenditure/GDP Like health expenditure, the ratio of education expenditure to GDP would help in achieving Goal-2. Further break-up on the education expenditure in terms of components of primary education expenditure would give us much more information how the governments are spending on achieving universal primary education. Similar to health expenditure, Asia Pacific region needs more investments in universal primary education.
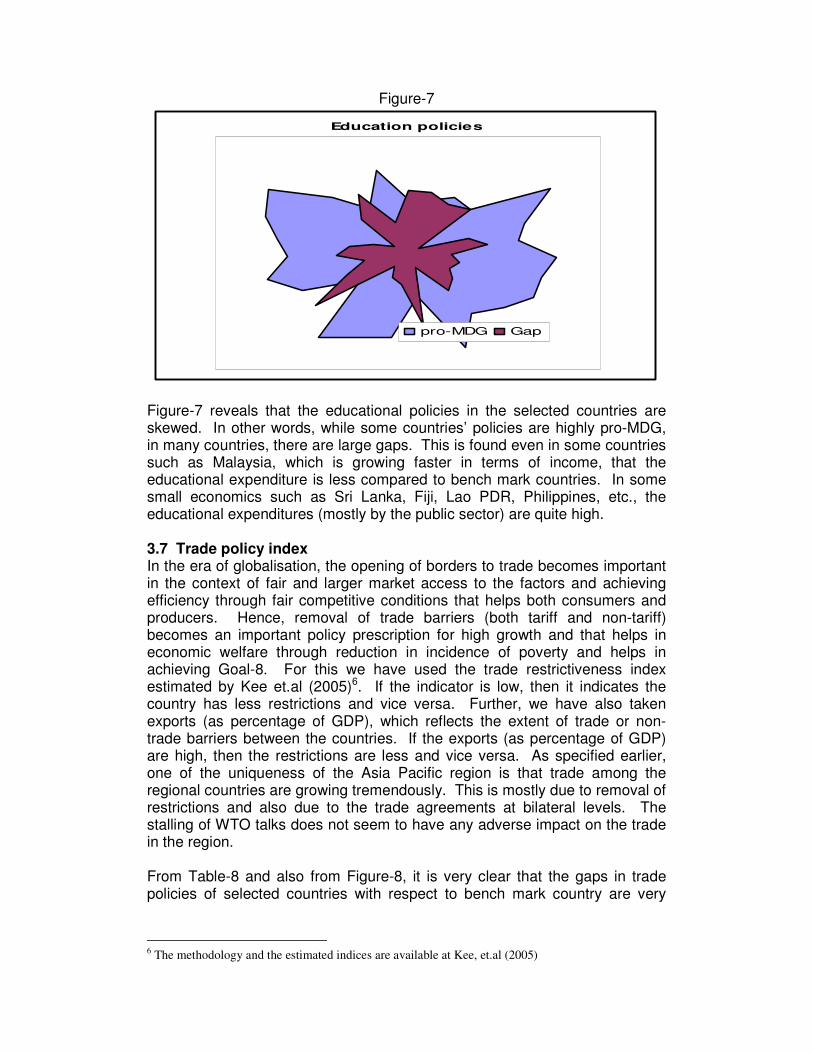
Figure-7
Education policies
pro-MDG Gap
Figure-7 reveals that the educational policies in the selected countries are skewed. In other words, while some countries’ policies are highly pro-MDG, in many countries, there are large gaps. This is found even in some countries such as Malaysia, which is growing faster in terms of income, that the educational expenditure is less compared to bench mark countries. In some small economics such as Sri Lanka, Fiji, Lao PDR, Philippines, etc., the educational expenditures (mostly by the public sector) are quite high. 3.7 Trade policy index In the era of globalisation, the opening of borders to trade becomes important in the context of fair and larger market access to the factors and achieving efficiency through fair competitive conditions that helps both consumers and producers. Hence, removal of trade barriers (both tariff and non-tariff) becomes an important policy prescription for high growth and that helps in economic welfare through reduction in incidence of poverty and helps in achieving Goal-8. For this we have used the trade restrictiveness index estimated by Kee et.al (2005)6. If the indicator is low, then it indicates the country has less restrictions and vice versa. Further, we have also taken exports (as percentage of GDP), which reflects the extent of trade or non-trade barriers between the countries. If the exports (as percentage of GDP) are high, then the restrictions are less and vice versa. As specified earlier, one of the uniqueness of the Asia Pacific region is that trade among the regional countries are growing tremendously. This is mostly due to removal of restrictions and also due to the trade agreements at bilateral levels. The stalling of WTO talks does not seem to have any adverse impact on the trade in the region. From Table-8 and also from Figure-8, it is very clear that the gaps in trade policies of selected countries with respect to bench mark country are very
6 The methodology and the estimated indices are available at Kee, et.al (2005)
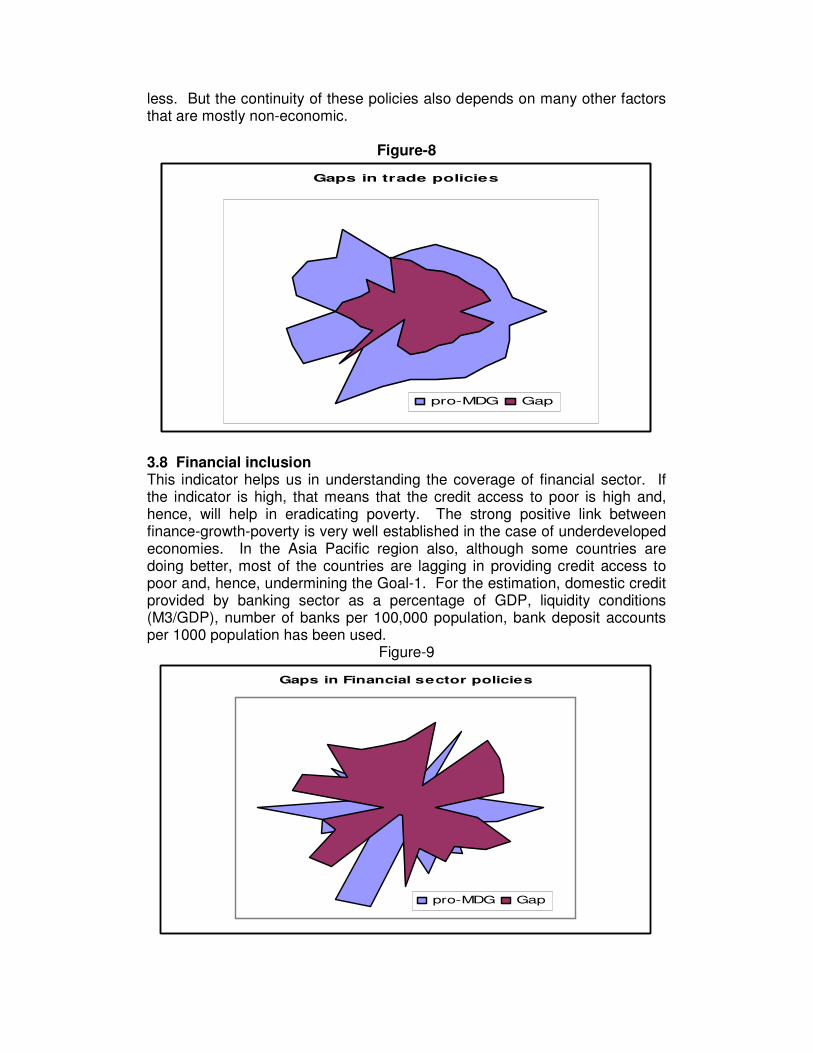
less. But the continuity of these policies also depends on many other factors that are mostly non-economic.
Figure-8
Gaps in trade policies
pro-MDG Gap
3.8 Financial inclusion This indicator helps us in understanding the coverage of financial sector. If the indicator is high, that means that the credit access to poor is high and, hence, will help in eradicating poverty. The strong positive link between finance-growth-poverty is very well established in the case of underdeveloped economies. In the Asia Pacific region also, although some countries are doing better, most of the countries are lagging in providing credit access to poor and, hence, undermining the Goal-1. For the estimation, domestic credit provided by banking sector as a percentage of GDP, liquidity conditions (M3/GDP), number of banks per 100,000 population, bank deposit accounts per 1000 population has been used.
Figure-9
Gaps in Financial sector policies
pro-MDG Gap
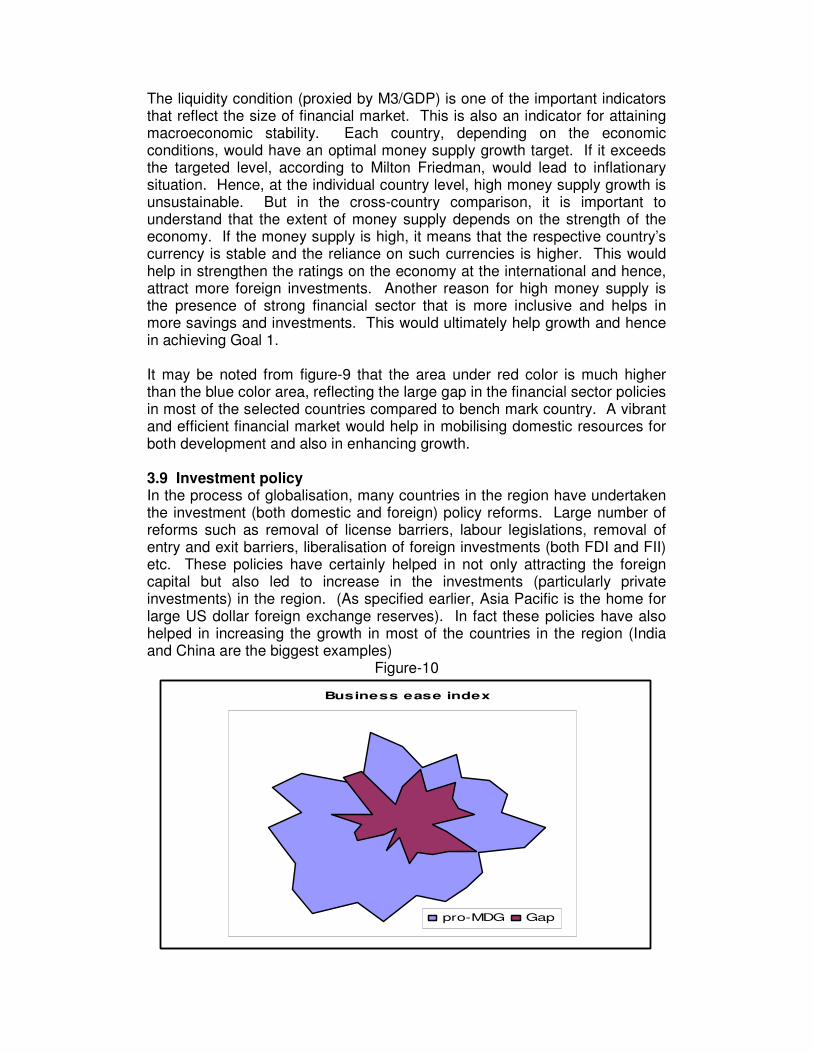
The liquidity condition (proxied by M3/GDP) is one of the important indicators that reflect the size of financial market. This is also an indicator for attaining macroeconomic stability. Each country, depending on the economic conditions, would have an optimal money supply growth target. If it exceeds the targeted level, according to Milton Friedman, would lead to inflationary situation. Hence, at the individual country level, high money supply growth is unsustainable. But in the cross-country comparison, it is important to understand that the extent of money supply depends on the strength of the economy. If the money supply is high, it means that the respective country’s currency is stable and the reliance on such currencies is higher. This would help in strengthen the ratings on the economy at the international and hence, attract more foreign investments. Another reason for high money supply is the presence of strong financial sector that is more inclusive and helps in more savings and investments. This would ultimately help growth and hence in achieving Goal 1. It may be noted from figure-9 that the area under red color is much higher than the blue color area, reflecting the large gap in the financial sector policies in most of the selected countries compared to bench mark country. A vibrant and efficient financial market would help in mobilising domestic resources for both development and also in enhancing growth. 3.9 Investment policy In the process of globalisation, many countries in the region have undertaken the investment (both domestic and foreign) policy reforms. Large number of reforms such as removal of license barriers, labour legislations, removal of entry and exit barriers, liberalisation of foreign investments (both FDI and FII) etc. These policies have certainly helped in not only attracting the foreign capital but also led to increase in the investments (particularly private investments) in the region. (As specified earlier, Asia Pacific is the home for large US dollar foreign exchange reserves). In fact these policies have also helped in increasing the growth in most of the countries in the region (India and China are the biggest examples)
Figure-10
Business ease index
pro-MDG Gap
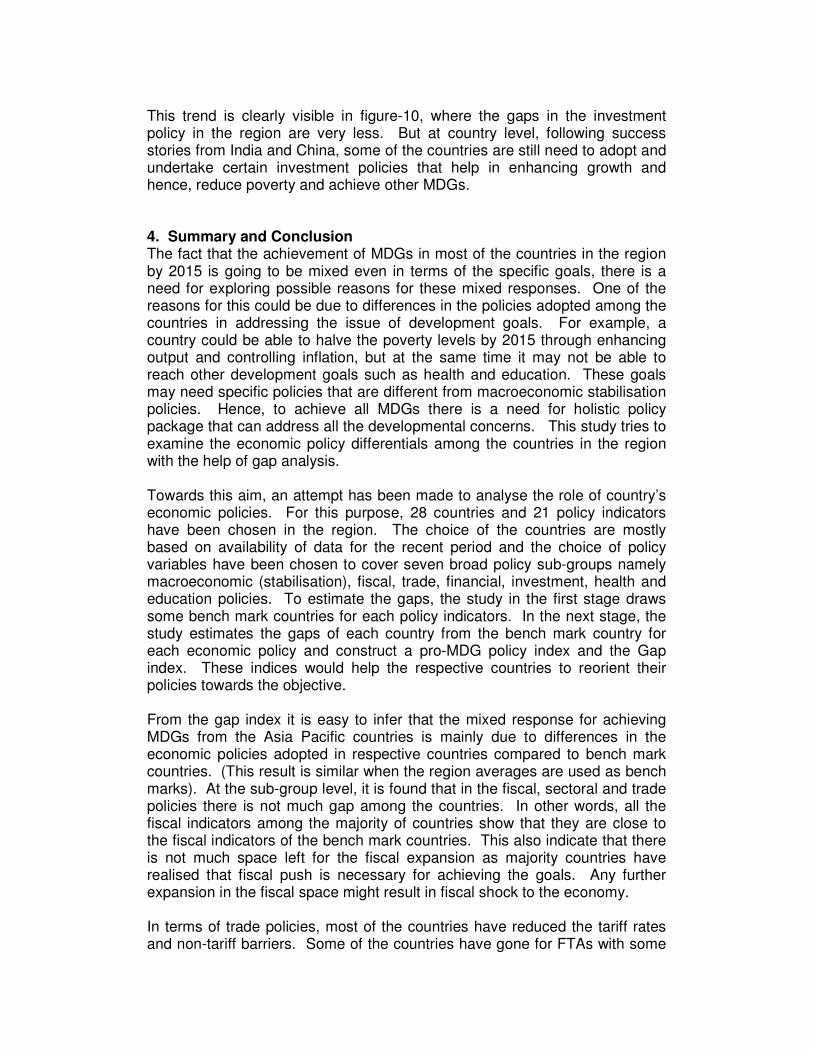
This trend is clearly visible in figure-10, where the gaps in the investment policy in the region are very less. But at country level, following success stories from India and China, some of the countries are still need to adopt and undertake certain investment policies that help in enhancing growth and hence, reduce poverty and achieve other MDGs. 4. Summary and Conclusion The fact that the achievement of MDGs in most of the countries in the region by 2015 is going to be mixed even in terms of the specific goals, there is a need for exploring possible reasons for these mixed responses. One of the reasons for this could be due to differences in the policies adopted among the countries in addressing the issue of development goals. For example, a country could be able to halve the poverty levels by 2015 through enhancing output and controlling inflation, but at the same time it may not be able to reach other development goals such as health and education. These goals may need specific policies that are different from macroeconomic stabilisation policies. Hence, to achieve all MDGs there is a need for holistic policy package that can address all the developmental concerns. This study tries to examine the economic policy differentials among the countries in the region with the help of gap analysis. Towards this aim, an attempt has been made to analyse the role of country’s economic policies. For this purpose, 28 countries and 21 policy indicators have been chosen in the region. The choice of the countries are mostly based on availability of data for the recent period and the choice of policy variables have been chosen to cover seven broad policy sub-groups namely macroeconomic (stabilisation), fiscal, trade, financial, investment, health and education policies. To estimate the gaps, the study in the first stage draws some bench mark countries for each policy indicators. In the next stage, the study estimates the gaps of each country from the bench mark country for each economic policy and construct a pro-MDG policy index and the Gap index. These indices would help the respective countries to reorient their policies towards the objective. From the gap index it is easy to infer that the mixed response for achieving MDGs from the Asia Pacific countries is mainly due to differences in the economic policies adopted in respective countries compared to bench mark countries. (This result is similar when the region averages are used as bench marks). At the sub-group level, it is found that in the fiscal, sectoral and trade policies there is not much gap among the countries. In other words, all the fiscal indicators among the majority of countries show that they are close to the fiscal indicators of the bench mark countries. This also indicate that there is not much space left for the fiscal expansion as majority countries have realised that fiscal push is necessary for achieving the goals. Any further expansion in the fiscal space might result in fiscal shock to the economy. In terms of trade policies, most of the countries have reduced the tariff rates and non-tariff barriers. Some of the countries have gone for FTAs with some
neighbouring countries to expand trade opportunities. In addition to this, the regional groups such as ASEAN, BIMSTEC etc., have also led to enlargement of trade by following similar policies. This has led to expansion of trade ties among the countries. Hence, although there is still scope for synchronising the trade policies in the region, the gaps between the countries are not wide. Similar to the trade policies, there is not much gaps in the investment policies. This is evident from the extent and spread of foreign investments the region in the recent period. In terms of macroeconomic and financial sector policies, there are many countries that are far behind (with wide gap) from the bench mark countries. It is well-known that the stable economic environment (growth with stable inflation situation) is necessary for any expansion in economic and fiscal activities. This analysis show that in the region, there are many countries that are still experiencing unstable growth and double-digit inflation rates for quite some time. Further, in the financial sector also there are large gaps that are hindering mobilisation of domestic resources for development. To sum up, the gap analysis undertaken in this study is helpful in prioritising the countries’ policies in a way that bridges the gap and reach closer to the bench mark countries in terms of pro-MDG policies. As it is evident from the analysis that Asia Pacific as a whole are close to the bench mark countries in terms of fiscal and trade policies, there is a lot that needs to be done in the financial and stabilisation policies. As said earlier, to achieve all goals, there is a need for holistic policy approach. To achieve this in the Asia Pacific region, there is a need to emphasis more on the financial and macroeconomic reforms that helps in domestic resource mobilisation and also in the growth process that are necessary for achieving development goals in time. References: Kee, Hiau Looi; Alessandro Nicita, and Marcelo Olarreaga (2005), “Estimating Trade
Restrictiveness Indices”, the World Bank.
UNESCAP-UNDP-ADB (2006): “The Millennium Development Goals: Progress in
Asia and the Pacific: 2006”.
Vandemoortele, Jan (2003) “The MDGs and pro-poor policies: Can external partners
make difference?”, UNDP, New York.
Pasha, Hafiz (2002); Pro-poor policies: http://unpan1.un.org/introdoc/groups/public/documents/un/unpan005788.pdf dated 15/01/07 HSPH Report (2006): China and India “What’s Behind Asia’s Gold Rush”,
http://www.hsph.harvard.edu/review/rvwsf06_bloom.html
World Bank (2006): World Development Indicators-2006.
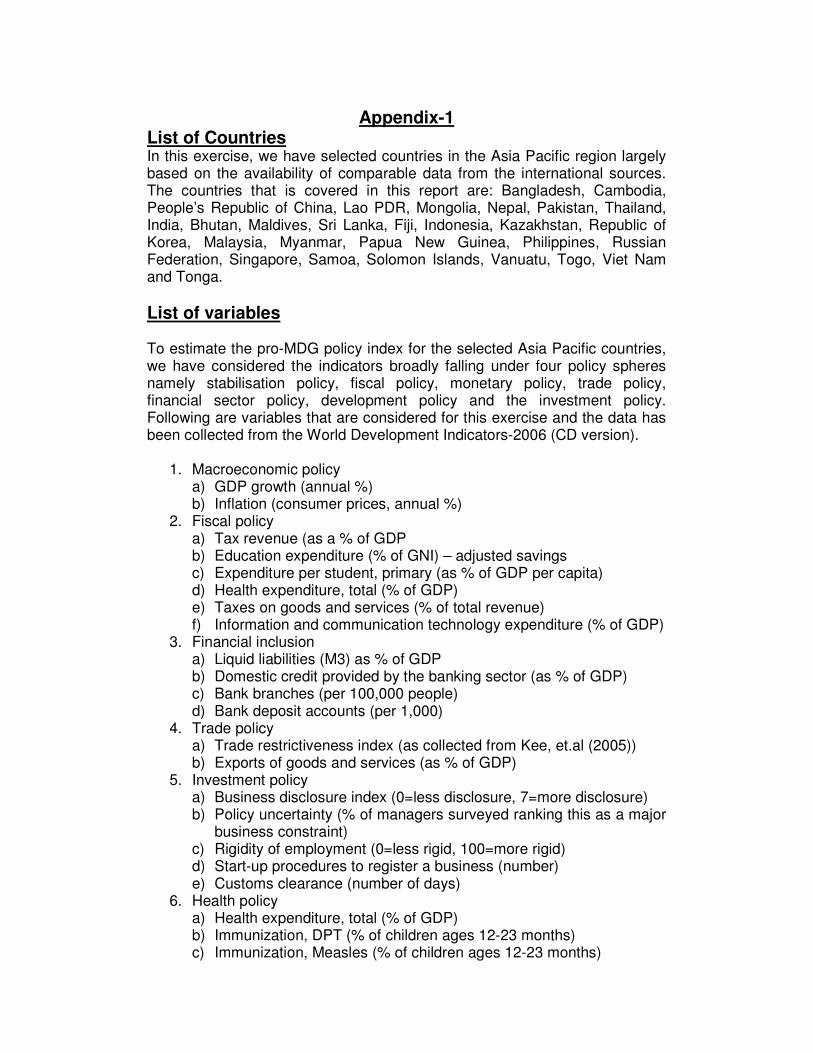
Appendix-1 List of Countries In this exercise, we have selected countries in the Asia Pacific region largely based on the availability of comparable data from the international sources. The countries that is covered in this report are: Bangladesh, Cambodia, People’s Republic of China, Lao PDR, Mongolia, Nepal, Pakistan, Thailand, India, Bhutan, Maldives, Sri Lanka, Fiji, Indonesia, Kazakhstan, Republic of Korea, Malaysia, Myanmar, Papua New Guinea, Philippines, Russian Federation, Singapore, Samoa, Solomon Islands, Vanuatu, Togo, Viet Nam and Tonga.
List of variables To estimate the pro-MDG policy index for the selected Asia Pacific countries, we have considered the indicators broadly falling under four policy spheres namely stabilisation policy, fiscal policy, monetary policy, trade policy, financial sector policy, development policy and the investment policy. Following are variables that are considered for this exercise and the data has been collected from the World Development Indicators-2006 (CD version).
1. Macroeconomic policy a) GDP growth (annual %) b) Inflation (consumer prices, annual %)
2. Fiscal policy a) Tax revenue (as a % of GDP b) Education expenditure (% of GNI) – adjusted savings c) Expenditure per student, primary (as % of GDP per capita) d) Health expenditure, total (% of GDP) e) Taxes on goods and services (% of total revenue) f) Information and communication technology expenditure (% of GDP)
3. Financial inclusion a) Liquid liabilities (M3) as % of GDP b) Domestic credit provided by the banking sector (as % of GDP) c) Bank branches (per 100,000 people) d) Bank deposit accounts (per 1,000)
4. Trade policy a) Trade restrictiveness index (as collected from Kee, et.al (2005)) b) Exports of goods and services (as % of GDP)
5. Investment policy a) Business disclosure index (0=less disclosure, 7=more disclosure) b) Policy uncertainty (% of managers surveyed ranking this as a major
business constraint) c) Rigidity of employment (0=less rigid, 100=more rigid) d) Start-up procedures to register a business (number) e) Customs clearance (number of days)
6. Health policy a) Health expenditure, total (% of GDP) b) Immunization, DPT (% of children ages 12-23 months) c) Immunization, Measles (% of children ages 12-23 months)
d) Hospital beds (per 1,000 people) 7. Education policy
a) Education expenditure (% of GNI) – adjusted savings b) Expenditure per student, primary (as % of GDP per capita)
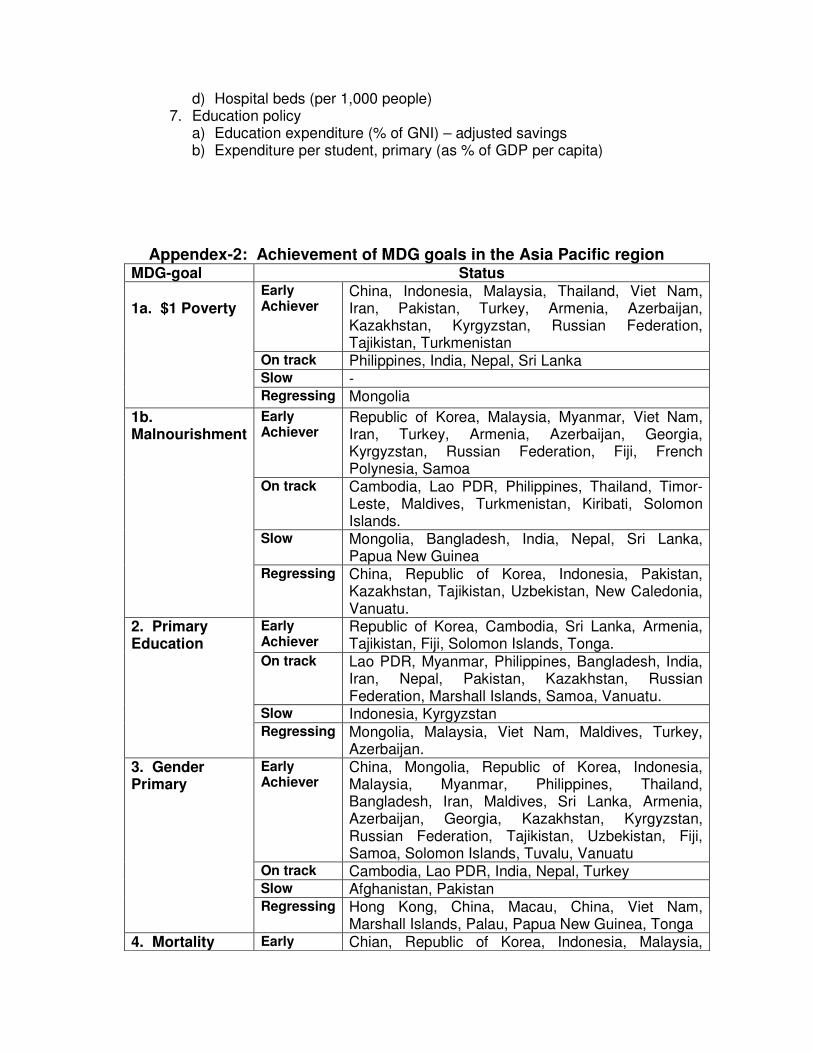
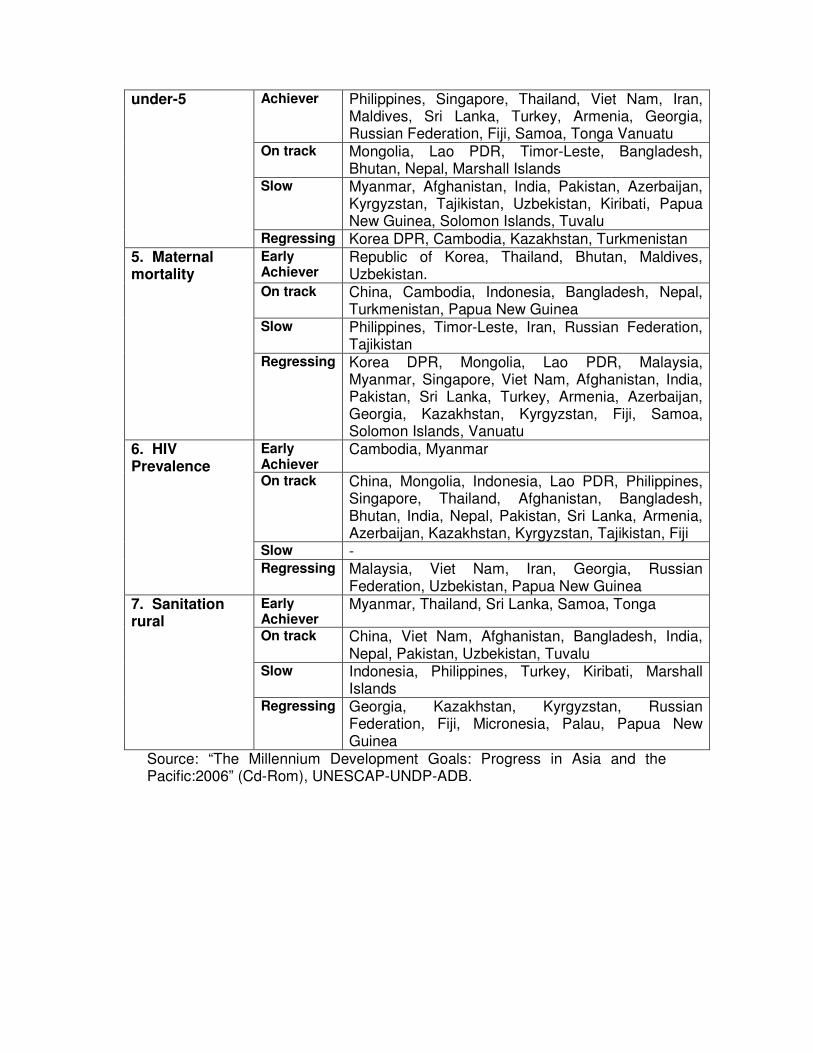
Appendex-2: Achievement of MDG goals in the Asia Pacific region
MDG-goal Status Early Achiever
China, Indonesia, Malaysia, Thailand, Viet Nam, Iran, Pakistan, Turkey, Armenia, Azerbaijan, Kazakhstan, Kyrgyzstan, Russian Federation, Tajikistan, Turkmenistan
On track Philippines, India, Nepal, Sri Lanka Slow -
1a. $1 Poverty
Regressing Mongolia
Early Achiever
Republic of Korea, Malaysia, Myanmar, Viet Nam, Iran, Turkey, Armenia, Azerbaijan, Georgia, Kyrgyzstan, Russian Federation, Fiji, French Polynesia, Samoa
On track Cambodia, Lao PDR, Philippines, Thailand, Timor-Leste, Maldives, Turkmenistan, Kiribati, Solomon Islands.
Slow Mongolia, Bangladesh, India, Nepal, Sri Lanka, Papua New Guinea
1b. Malnourishment
Regressing China, Republic of Korea, Indonesia, Pakistan, Kazakhstan, Tajikistan, Uzbekistan, New Caledonia, Vanuatu.
Early Achiever
Republic of Korea, Cambodia, Sri Lanka, Armenia, Tajikistan, Fiji, Solomon Islands, Tonga.
On track Lao PDR, Myanmar, Philippines, Bangladesh, India, Iran, Nepal, Pakistan, Kazakhstan, Russian Federation, Marshall Islands, Samoa, Vanuatu.
Slow Indonesia, Kyrgyzstan
2. Primary Education
Regressing Mongolia, Malaysia, Viet Nam, Maldives, Turkey, Azerbaijan.
Early Achiever
China, Mongolia, Republic of Korea, Indonesia, Malaysia, Myanmar, Philippines, Thailand, Bangladesh, Iran, Maldives, Sri Lanka, Armenia, Azerbaijan, Georgia, Kazakhstan, Kyrgyzstan, Russian Federation, Tajikistan, Uzbekistan, Fiji, Samoa, Solomon Islands, Tuvalu, Vanuatu
On track Cambodia, Lao PDR, India, Nepal, Turkey Slow Afghanistan, Pakistan
3. Gender Primary
Regressing Hong Kong, China, Macau, China, Viet Nam, Marshall Islands, Palau, Papua New Guinea, Tonga
4. Mortality Early Chian, Republic of Korea, Indonesia, Malaysia,
Achiever Philippines, Singapore, Thailand, Viet Nam, Iran, Maldives, Sri Lanka, Turkey, Armenia, Georgia, Russian Federation, Fiji, Samoa, Tonga Vanuatu
On track Mongolia, Lao PDR, Timor-Leste, Bangladesh, Bhutan, Nepal, Marshall Islands
Slow Myanmar, Afghanistan, India, Pakistan, Azerbaijan, Kyrgyzstan, Tajikistan, Uzbekistan, Kiribati, Papua New Guinea, Solomon Islands, Tuvalu
under-5
Regressing Korea DPR, Cambodia, Kazakhstan, Turkmenistan Early Achiever
Republic of Korea, Thailand, Bhutan, Maldives, Uzbekistan.
On track China, Cambodia, Indonesia, Bangladesh, Nepal, Turkmenistan, Papua New Guinea
Slow Philippines, Timor-Leste, Iran, Russian Federation, Tajikistan
5. Maternal mortality
Regressing Korea DPR, Mongolia, Lao PDR, Malaysia, Myanmar, Singapore, Viet Nam, Afghanistan, India, Pakistan, Sri Lanka, Turkey, Armenia, Azerbaijan, Georgia, Kazakhstan, Kyrgyzstan, Fiji, Samoa, Solomon Islands, Vanuatu
Early Achiever
Cambodia, Myanmar
On track China, Mongolia, Indonesia, Lao PDR, Philippines, Singapore, Thailand, Afghanistan, Bangladesh, Bhutan, India, Nepal, Pakistan, Sri Lanka, Armenia, Azerbaijan, Kazakhstan, Kyrgyzstan, Tajikistan, Fiji
Slow -
6. HIV Prevalence
Regressing Malaysia, Viet Nam, Iran, Georgia, Russian Federation, Uzbekistan, Papua New Guinea
Early Achiever
Myanmar, Thailand, Sri Lanka, Samoa, Tonga
On track China, Viet Nam, Afghanistan, Bangladesh, India, Nepal, Pakistan, Uzbekistan, Tuvalu
Slow Indonesia, Philippines, Turkey, Kiribati, Marshall Islands
7. Sanitation rural
Regressing Georgia, Kazakhstan, Kyrgyzstan, Russian Federation, Fiji, Micronesia, Palau, Papua New Guinea
Source: “The Millennium Development Goals: Progress in Asia and the Pacific:2006” (Cd-Rom), UNESCAP-UNDP-ADB.
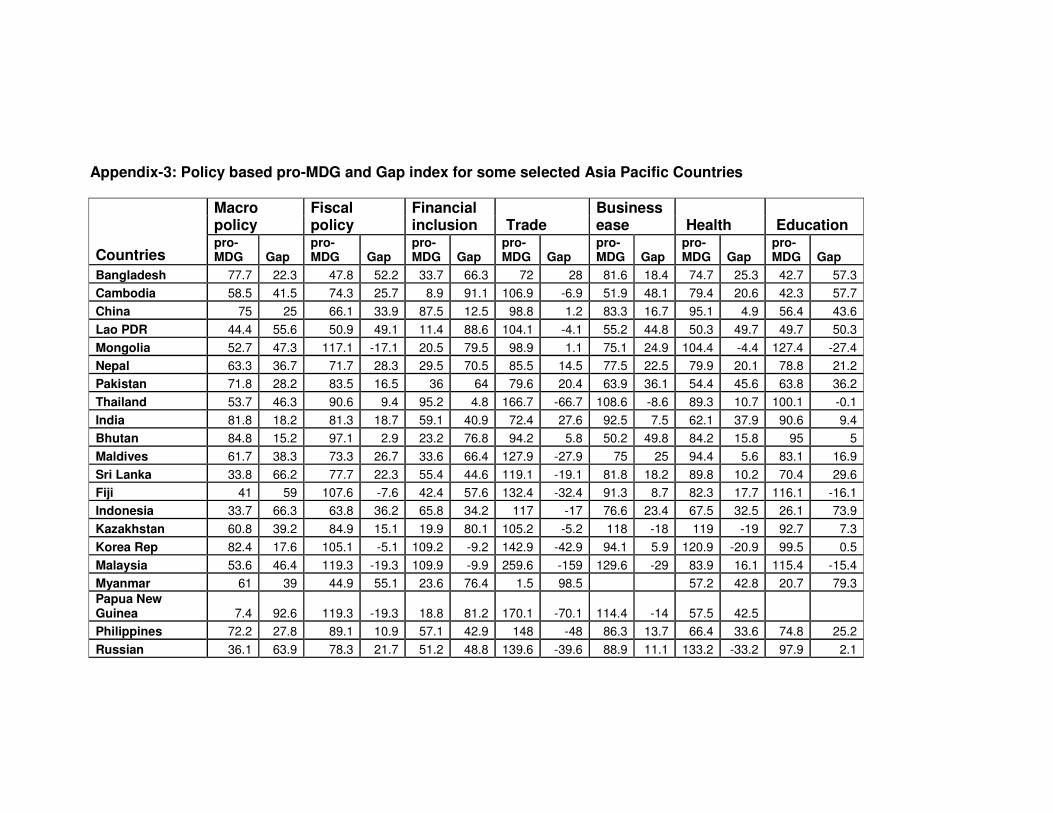
Appendix-3: Policy based pro-MDG and Gap index for some selected Asia Pacific Countries
Macro policy
Fiscal policy
Financial inclusion Trade
Business ease Health Education
Countries pro-MDG Gap
pro-MDG Gap
pro-MDG Gap
pro-MDG Gap
pro-MDG Gap
pro-MDG Gap
pro-MDG Gap
Bangladesh 77.7 22.3 47.8 52.2 33.7 66.3 72 28 81.6 18.4 74.7 25.3 42.7 57.3
Cambodia 58.5 41.5 74.3 25.7 8.9 91.1 106.9 -6.9 51.9 48.1 79.4 20.6 42.3 57.7
China 75 25 66.1 33.9 87.5 12.5 98.8 1.2 83.3 16.7 95.1 4.9 56.4 43.6
Lao PDR 44.4 55.6 50.9 49.1 11.4 88.6 104.1 -4.1 55.2 44.8 50.3 49.7 49.7 50.3
Mongolia 52.7 47.3 117.1 -17.1 20.5 79.5 98.9 1.1 75.1 24.9 104.4 -4.4 127.4 -27.4
Nepal 63.3 36.7 71.7 28.3 29.5 70.5 85.5 14.5 77.5 22.5 79.9 20.1 78.8 21.2
Pakistan 71.8 28.2 83.5 16.5 36 64 79.6 20.4 63.9 36.1 54.4 45.6 63.8 36.2
Thailand 53.7 46.3 90.6 9.4 95.2 4.8 166.7 -66.7 108.6 -8.6 89.3 10.7 100.1 -0.1
India 81.8 18.2 81.3 18.7 59.1 40.9 72.4 27.6 92.5 7.5 62.1 37.9 90.6 9.4
Bhutan 84.8 15.2 97.1 2.9 23.2 76.8 94.2 5.8 50.2 49.8 84.2 15.8 95 5
Maldives 61.7 38.3 73.3 26.7 33.6 66.4 127.9 -27.9 75 25 94.4 5.6 83.1 16.9
Sri Lanka 33.8 66.2 77.7 22.3 55.4 44.6 119.1 -19.1 81.8 18.2 89.8 10.2 70.4 29.6
Fiji 41 59 107.6 -7.6 42.4 57.6 132.4 -32.4 91.3 8.7 82.3 17.7 116.1 -16.1
Indonesia 33.7 66.3 63.8 36.2 65.8 34.2 117 -17 76.6 23.4 67.5 32.5 26.1 73.9
Kazakhstan 60.8 39.2 84.9 15.1 19.9 80.1 105.2 -5.2 118 -18 119 -19 92.7 7.3
Korea Rep 82.4 17.6 105.1 -5.1 109.2 -9.2 142.9 -42.9 94.1 5.9 120.9 -20.9 99.5 0.5
Malaysia 53.6 46.4 119.3 -19.3 109.9 -9.9 259.6 -159 129.6 -29 83.9 16.1 115.4 -15.4
Myanmar 61 39 44.9 55.1 23.6 76.4 1.5 98.5 57.2 42.8 20.7 79.3
Papua New Guinea 7.4 92.6 119.3 -19.3 18.8 81.2 170.1 -70.1 114.4 -14 57.5 42.5
Philippines 72.2 27.8 89.1 10.9 57.1 42.9 148 -48 86.3 13.7 66.4 33.6 74.8 25.2
Russian 36.1 63.9 78.3 21.7 51.2 48.8 139.6 -39.6 88.9 11.1 133.2 -33.2 97.9 2.1
Federation
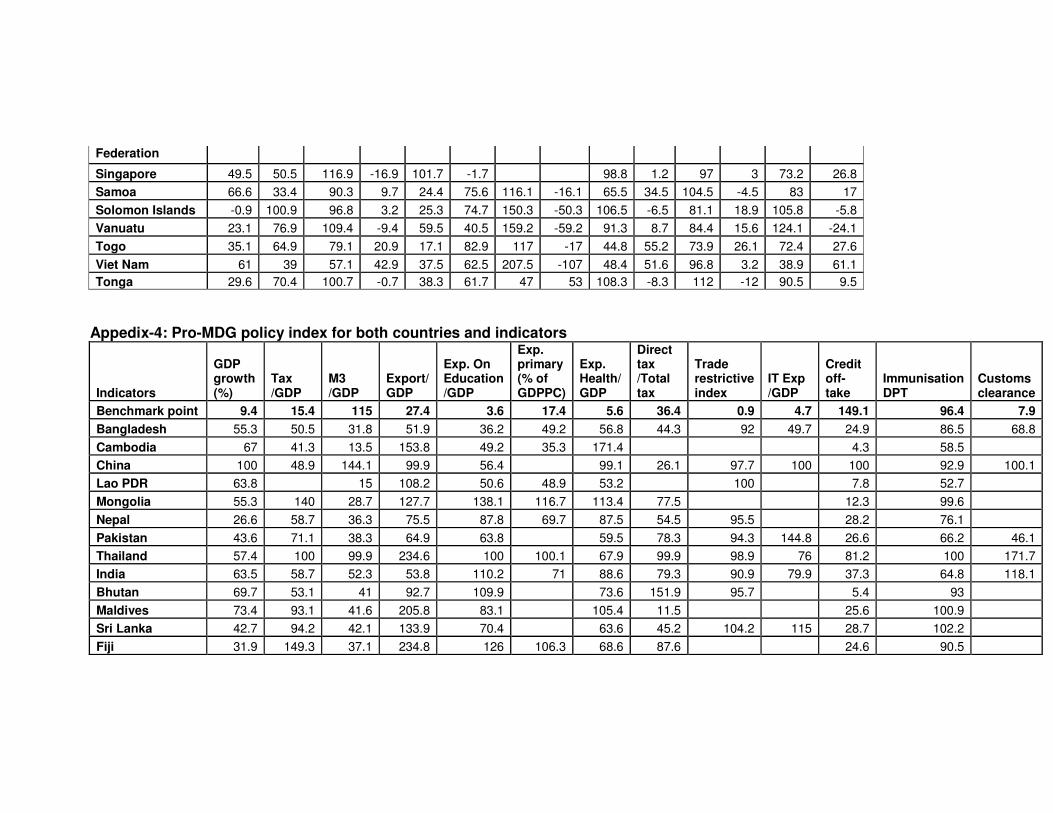
Singapore 49.5 50.5 116.9 -16.9 101.7 -1.7 98.8 1.2 97 3 73.2 26.8
Samoa 66.6 33.4 90.3 9.7 24.4 75.6 116.1 -16.1 65.5 34.5 104.5 -4.5 83 17
Solomon Islands -0.9 100.9 96.8 3.2 25.3 74.7 150.3 -50.3 106.5 -6.5 81.1 18.9 105.8 -5.8
Vanuatu 23.1 76.9 109.4 -9.4 59.5 40.5 159.2 -59.2 91.3 8.7 84.4 15.6 124.1 -24.1
Togo 35.1 64.9 79.1 20.9 17.1 82.9 117 -17 44.8 55.2 73.9 26.1 72.4 27.6
Viet Nam 61 39 57.1 42.9 37.5 62.5 207.5 -107 48.4 51.6 96.8 3.2 38.9 61.1
Tonga 29.6 70.4 100.7 -0.7 38.3 61.7 47 53 108.3 -8.3 112 -12 90.5 9.5
Appedix-4: Pro-MDG policy index for both countries and indicators
Indicators
GDP growth (%)
Tax /GDP
M3 /GDP
Export/ GDP
Exp. On Education /GDP
Exp. primary (% of GDPPC)
Exp. Health/ GDP
Direct tax /Total tax
Trade restrictive index
IT Exp /GDP
Credit off-take
Immunisation DPT
Customs clearance
Benchmark point 9.4 15.4 115 27.4 3.6 17.4 5.6 36.4 0.9 4.7 149.1 96.4 7.9
Bangladesh 55.3 50.5 31.8 51.9 36.2 49.2 56.8 44.3 92 49.7 24.9 86.5 68.8
Cambodia 67 41.3 13.5 153.8 49.2 35.3 171.4 4.3 58.5
China 100 48.9 144.1 99.9 56.4 99.1 26.1 97.7 100 100 92.9 100.1
Lao PDR 63.8 15 108.2 50.6 48.9 53.2 100 7.8 52.7
Mongolia 55.3 140 28.7 127.7 138.1 116.7 113.4 77.5 12.3 99.6
Nepal 26.6 58.7 36.3 75.5 87.8 69.7 87.5 54.5 95.5 28.2 76.1
Pakistan 43.6 71.1 38.3 64.9 63.8 59.5 78.3 94.3 144.8 26.6 66.2 46.1
Thailand 57.4 100 99.9 234.6 100 100.1 67.9 99.9 98.9 76 81.2 100 171.7
India 63.5 58.7 52.3 53.8 110.2 71 88.6 79.3 90.9 79.9 37.3 64.8 118.1
Bhutan 69.7 53.1 41 92.7 109.9 73.6 151.9 95.7 5.4 93
Maldives 73.4 93.1 41.6 205.8 83.1 105.4 11.5 25.6 100.9
Sri Lanka 42.7 94.2 42.1 133.9 70.4 63.6 45.2 104.2 115 28.7 102.2
Fiji 31.9 149.3 37.1 234.8 126 106.3 68.6 87.6 24.6 90.5
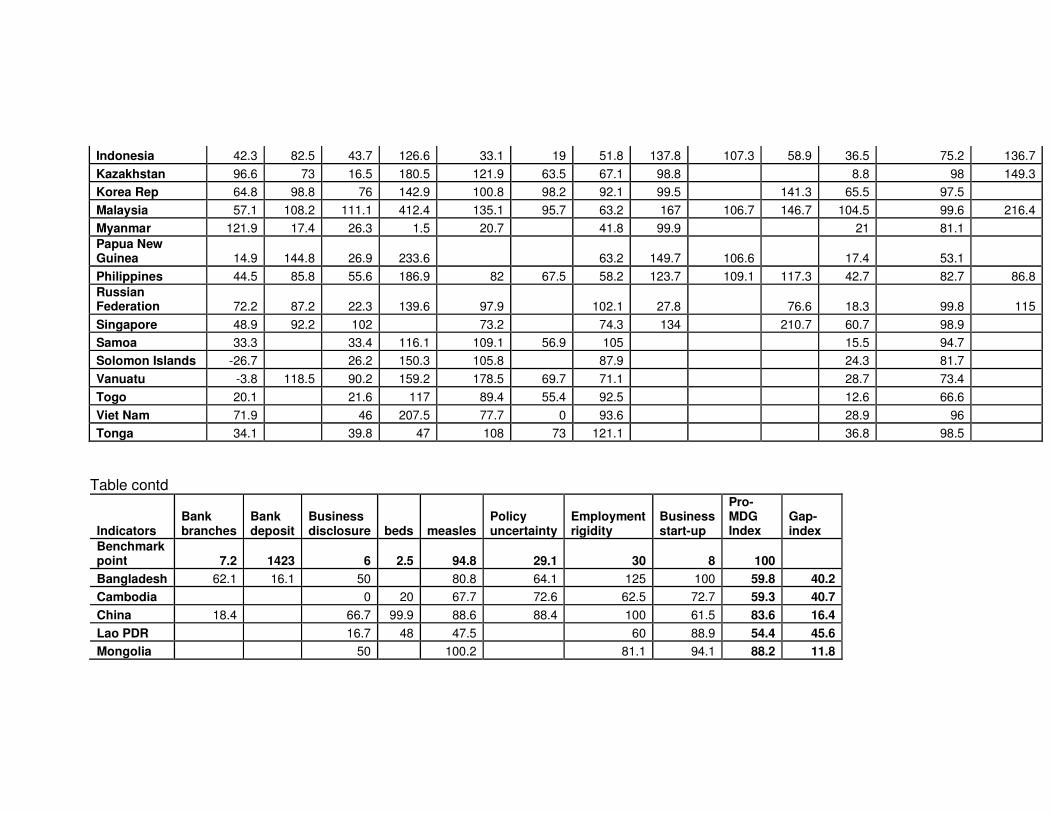
Indonesia 42.3 82.5 43.7 126.6 33.1 19 51.8 137.8 107.3 58.9 36.5 75.2 136.7
Kazakhstan 96.6 73 16.5 180.5 121.9 63.5 67.1 98.8 8.8 98 149.3
Korea Rep 64.8 98.8 76 142.9 100.8 98.2 92.1 99.5 141.3 65.5 97.5
Malaysia 57.1 108.2 111.1 412.4 135.1 95.7 63.2 167 106.7 146.7 104.5 99.6 216.4
Myanmar 121.9 17.4 26.3 1.5 20.7 41.8 99.9 21 81.1
Papua New Guinea 14.9 144.8 26.9 233.6 63.2 149.7 106.6 17.4 53.1
Philippines 44.5 85.8 55.6 186.9 82 67.5 58.2 123.7 109.1 117.3 42.7 82.7 86.8
Russian Federation 72.2 87.2 22.3 139.6 97.9 102.1 27.8 76.6 18.3 99.8 115
Singapore 48.9 92.2 102 73.2 74.3 134 210.7 60.7 98.9
Samoa 33.3 33.4 116.1 109.1 56.9 105 15.5 94.7
Solomon Islands -26.7 26.2 150.3 105.8 87.9 24.3 81.7
Vanuatu -3.8 118.5 90.2 159.2 178.5 69.7 71.1 28.7 73.4
Togo 20.1 21.6 117 89.4 55.4 92.5 12.6 66.6
Viet Nam 71.9 46 207.5 77.7 0 93.6 28.9 96
Tonga 34.1 39.8 47 108 73 121.1 36.8 98.5
Table contd
Indicators Bank branches
Bank deposit
Business disclosure beds measles
Policy uncertainty
Employment rigidity
Business start-up
Pro-MDG Index
Gap-index
Benchmark point 7.2 1423 6 2.5 94.8 29.1 30 8 100
Bangladesh 62.1 16.1 50 80.8 64.1 125 100 59.8 40.2
Cambodia 0 20 67.7 72.6 62.5 72.7 59.3 40.7
China 18.4 66.7 99.9 88.6 88.4 100 61.5 83.6 16.4
Lao PDR 16.7 48 47.5 60 88.9 54.4 45.6
Mongolia 50 100.2 81.1 94.1 88.2 11.8
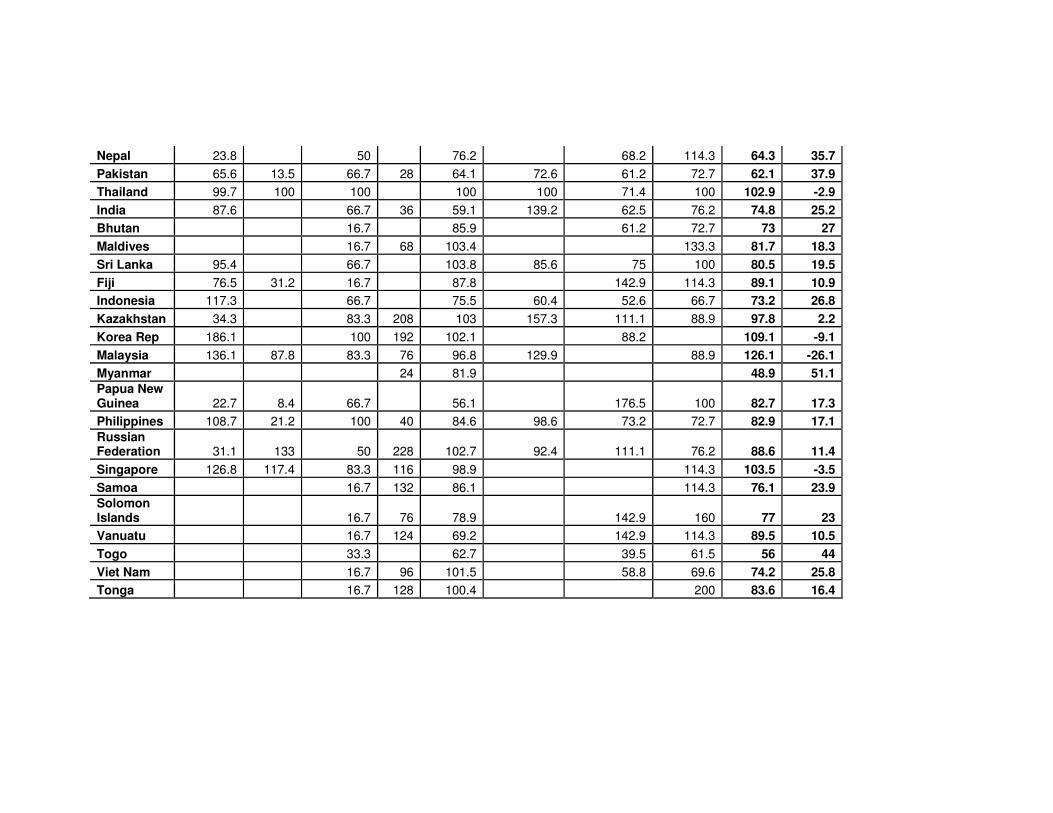
Nepal 23.8 50 76.2 68.2 114.3 64.3 35.7
Pakistan 65.6 13.5 66.7 28 64.1 72.6 61.2 72.7 62.1 37.9
Thailand 99.7 100 100 100 100 71.4 100 102.9 -2.9
India 87.6 66.7 36 59.1 139.2 62.5 76.2 74.8 25.2
Bhutan 16.7 85.9 61.2 72.7 73 27
Maldives 16.7 68 103.4 133.3 81.7 18.3
Sri Lanka 95.4 66.7 103.8 85.6 75 100 80.5 19.5
Fiji 76.5 31.2 16.7 87.8 142.9 114.3 89.1 10.9
Indonesia 117.3 66.7 75.5 60.4 52.6 66.7 73.2 26.8
Kazakhstan 34.3 83.3 208 103 157.3 111.1 88.9 97.8 2.2
Korea Rep 186.1 100 192 102.1 88.2 109.1 -9.1
Malaysia 136.1 87.8 83.3 76 96.8 129.9 88.9 126.1 -26.1
Myanmar 24 81.9 48.9 51.1
Papua New Guinea 22.7 8.4 66.7 56.1 176.5 100 82.7 17.3
Philippines 108.7 21.2 100 40 84.6 98.6 73.2 72.7 82.9 17.1
Russian Federation 31.1 133 50 228 102.7 92.4 111.1 76.2 88.6 11.4
Singapore 126.8 117.4 83.3 116 98.9 114.3 103.5 -3.5
Samoa 16.7 132 86.1 114.3 76.1 23.9
Solomon Islands 16.7 76 78.9 142.9 160 77 23
Vanuatu 16.7 124 69.2 142.9 114.3 89.5 10.5
Togo 33.3 62.7 39.5 61.5 56 44
Viet Nam 16.7 96 101.5 58.8 69.6 74.2 25.8
Tonga 16.7 128 100.4 200 83.6 16.4