rodolfo&taccani& robert radu&& - european fuel cell · efc&2013&–r.&...
TRANSCRIPT
Rodolfo Taccani Robert Radu
DEPARTMENT OF ENGINEERING AND ARCHITECTURE -‐ UNIVERSITY OF TRIESTE, ITALY
Mauro ScaglioE Carmen Valli
POWER GENERATION SYSTEM DEPARTMENT, RSE SPA, MILANO, ITALY

EFC 2013 – R. Taccani
Assess the possibility to use fuel cells in small scale biogas plants (<10 kWe) Contents
Aim of the work and contents
o IntroducVon o Experimental set up
• Biofilter • Fuel cell
o Experimental results o Conclusions

EFC 2013 – R. Taccani
RSE mobile laboratory at ETRA Biotreatment Centre
Mobile laboratory set up for field tests with real biogas (fuel cells, clean up systems, …).
Up to 40 Nm3day-1 of raw biogas from ETRA (Padua – Italy) for experiments.
Unmanned remotely controlled operation. Safety sensors. Interlocked biogas shut off valve.
Anaerobic digester, Linde “wet” type, thermophilic (55 °C ±1 °C).
≈3 MNm3 biogas/year
≈170 Nm3 biogas/tons processed wastes
Gas engines (2 x 1 MW) for onsite thermal and electric power co-generation
Digester
Gas tank
Mobile lab

EFC 2013 – R. Taccani
Experimental set-up
Digester Gas tank
Electronic load
Biotrickling filter Fuel processor
Fuel cell
BIOGAS BIOGAS No H2S
H2 RICH GAS
DC CURRENT
CONTROL SYSTEM

EFC 2013 – R. Taccani
Digester process & biogas output: key parameters
Typical Hydraulic Retention Time (HRT) and Organic Loading Rate (OLR) week patterns.
During the working days higher feeding flow rate and less time to metabolise.
Volatile Fat Acid (VFA) accumulation, acidification and partial inhibition of methanogenic flora.
During the weekend less matter and more time available. Weekly periodicity in CH4 concentration.
M. ScaglioE, C. Valli, S. Gallo, M. Giomo, A.M. Maragnin, G. Cicchiello and W. Schnitzhofer, Biotrickling filter for H2S treatment of a biogas fed fuel cell: field test results, Proceed. 21th European Biomass Conference and ExhibiVon, Copenhagen, 3-‐7 June 2013,
EFC 2013 – R. Taccani
CH4 and H2S concentration in raw biogas
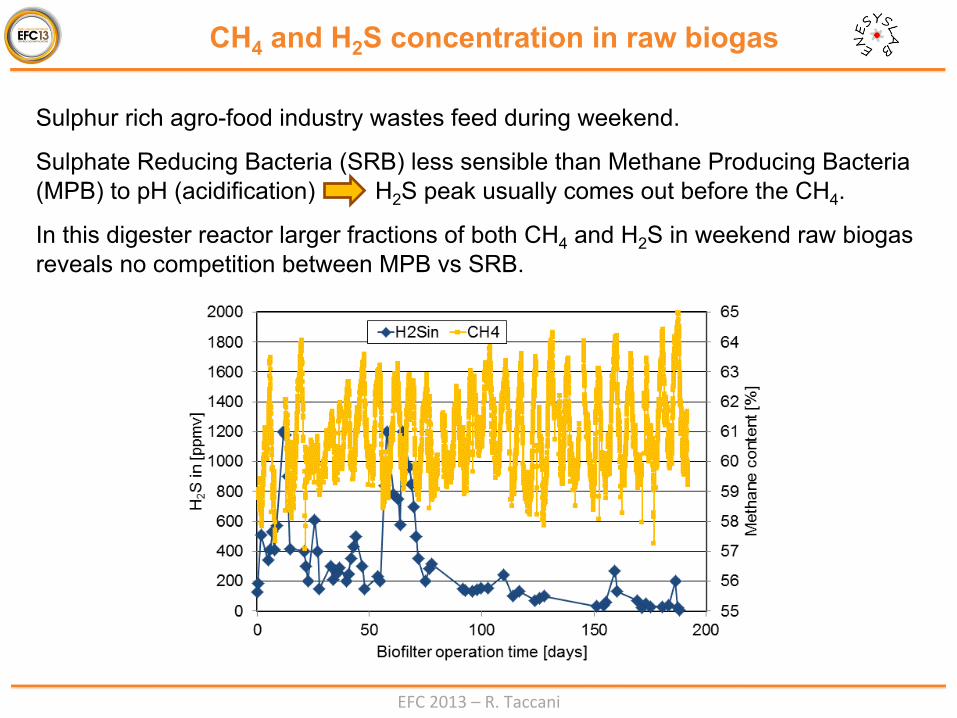
Sulphur rich agro-food industry wastes feed during weekend.
Sulphate Reducing Bacteria (SRB) less sensible than Methane Producing Bacteria (MPB) to pH (acidification) H2S peak usually comes out before the CH4.
In this digester reactor larger fractions of both CH4 and H2S in weekend raw biogas reveals no competition between MPB vs SRB.

EFC 2013 – R. Taccani
Biotrickling filter features
Inoculum: Thiobacillus sp.
Volume: 260 L (100 L bed)
Temperature: 30°C (20°C÷35°C)
pH: 1.4 (1÷2)
H2S in max: 500 ppmv
H2S out: ≤1 ppmv
Biogas Qmax: 2 Nm3h-1
Sulphur load (LS): 15 gSm-3h-1
Design based on digester historical data and strict requirements of reformer catalysts and fuel cell anode: H2S down to 1 ppm level!
Gas in
Gas out
Acid solution
Bed
Pump
EFC 2013 – R. Taccani
Biofilter operation – Results
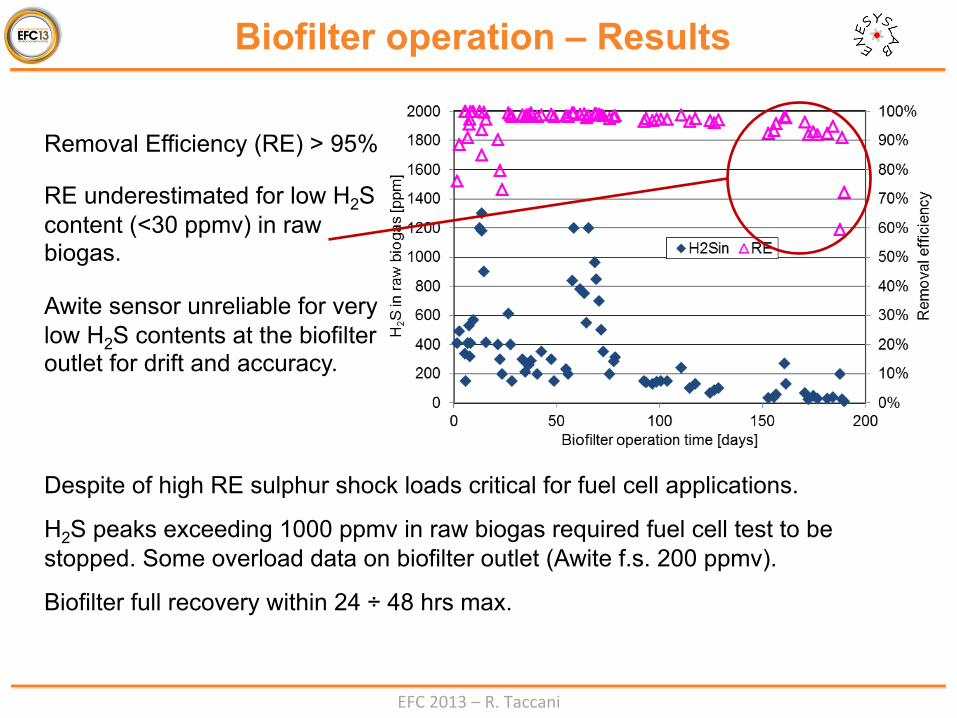
Removal Efficiency (RE) > 95%
RE underestimated for low H2S content (<30 ppmv) in raw biogas.
Awite sensor unreliable for very low H2S contents at the biofilter outlet for drift and accuracy.
Despite of high RE sulphur shock loads critical for fuel cell applications.
H2S peaks exceeding 1000 ppmv in raw biogas required fuel cell test to be stopped. Some overload data on biofilter outlet (Awite f.s. 200 ppmv).
Biofilter full recovery within 24 ÷ 48 hrs max.
EFC 2013 – R. Taccani
Why High Temperature PEM Fuel Cells ?
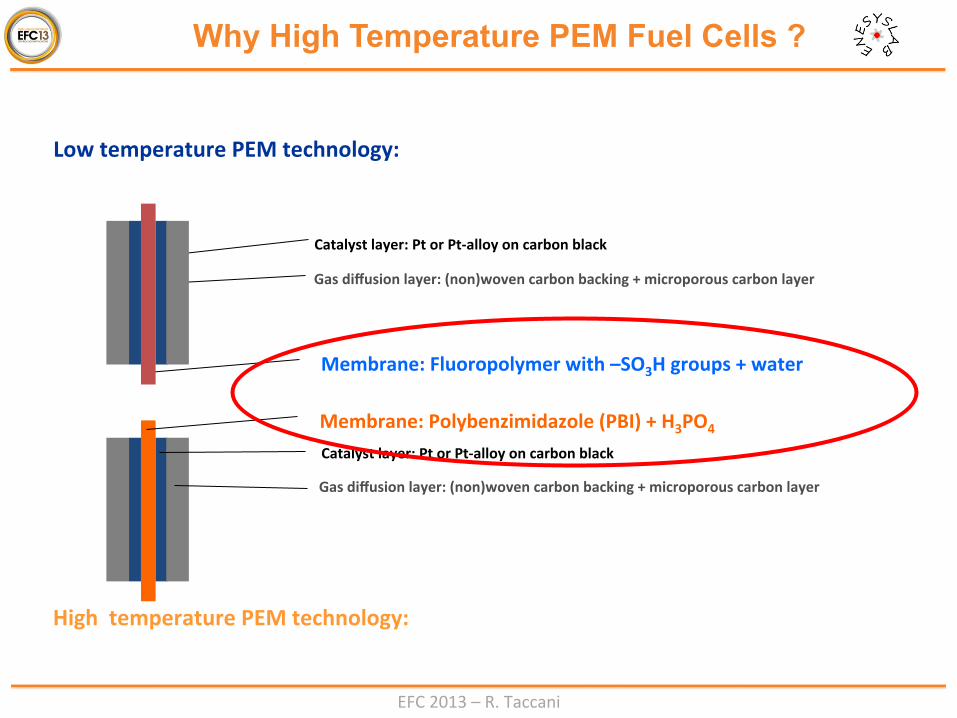
Low temperature PEM technology:
Catalyst layer: Pt or Pt-‐alloy on carbon black
Gas diffusion layer: (non)woven carbon backing + microporous carbon layer
Membrane: Fluoropolymer with –SO3H groups + water
Membrane: Polybenzimidazole (PBI) + H3PO4
Catalyst layer: Pt or Pt-‐alloy on carbon black
Gas diffusion layer: (non)woven carbon backing + microporous carbon layer
High temperature PEM technology:

EFC 2013 – R. Taccani
Why High Temperature PEM Fuel Cells ?
l Tolerance to fuel impuriVes
– CO up to 3% (~ 1%)
– H2S up to 10 ppm
l Simplified system at reformate
l Independent of humidificaVon
l High chemical stability of membrane (20.000 hr)
l EffecVve co-‐ and tri-‐generaVon, direct use of heat possible
l Tolerance to fuel impuriVes
– CO below 100ppm
– H2S below 0.1 ppm
l Hydrogen or complex reformer required
l HumidificaVon required!
l Membrane stability issue
l Complex co-‐ and tri-‐generaVon
HT PEMFC (120-180°C)
LT PEMFC (<90°C)

EFC 2013 – R. Taccani
FC and reformer
Fuel cells characteristcs
N. of cells 22
AcVve area 45 cm2
Type of MEA PBI HT PEM
Power @ 11.1V, H2 321 W
Cooling Air

EFC 2013 – R. Taccani
FC and reformer P&I

EFC 2013 – R. Taccani
Results
Time history of the burner (Tburn), reformer and shih stages (Tref, Tshi+) temperatures during start-‐up and normal operaVon. Fuel: biogas.
Water injecVon
EFC 2013 – R. Taccani
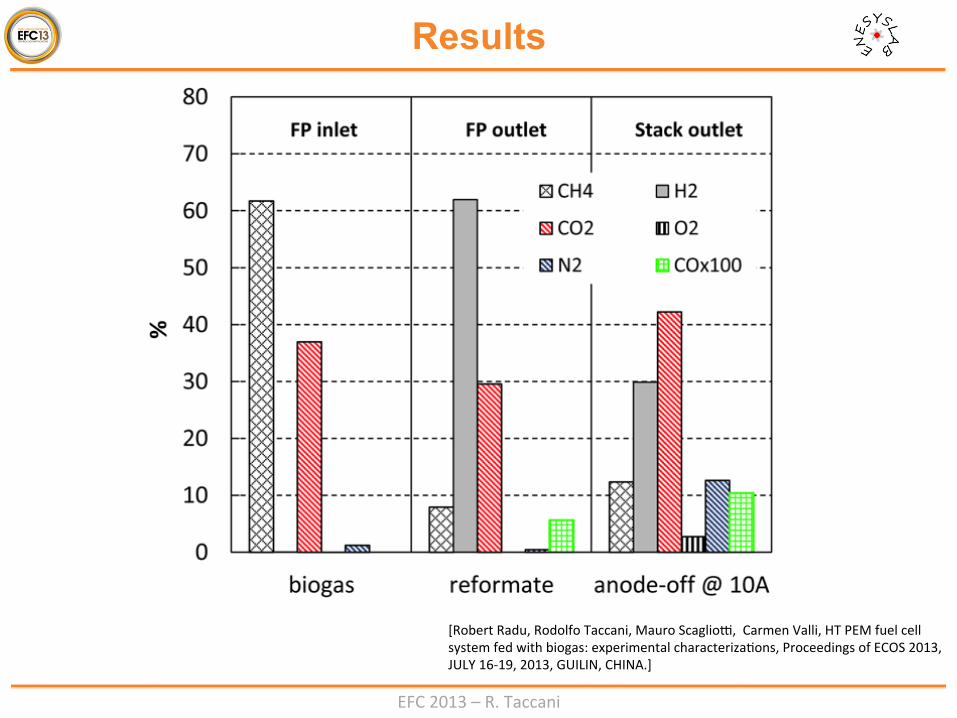
Results
[Robert Radu, Rodolfo Taccani, Mauro ScaglioE, Carmen Valli, HT PEM fuel cell system fed with biogas: experimental characterizaVons, Proceedings of ECOS 2013, JULY 16-‐19, 2013, GUILIN, CHINA.]
EFC 2013 – R. Taccani
Results
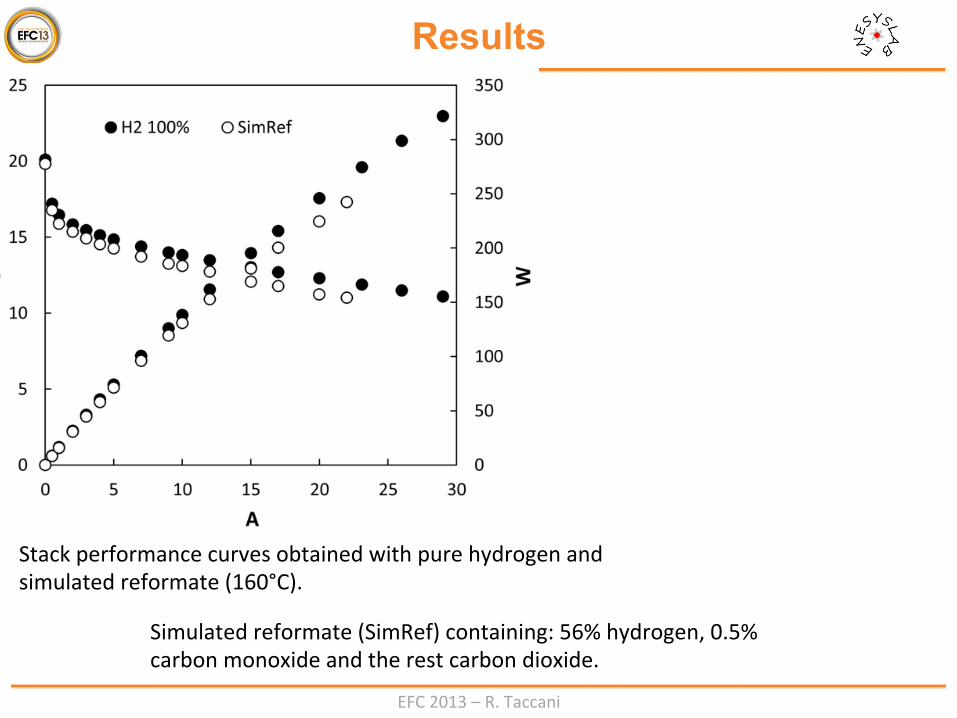
Stack performance curves obtained with pure hydrogen and simulated reformate (160°C).
Simulated reformate (SimRef) containing: 56% hydrogen, 0.5% carbon monoxide and the rest carbon dioxide.
EFC 2013 – R. Taccani
Results
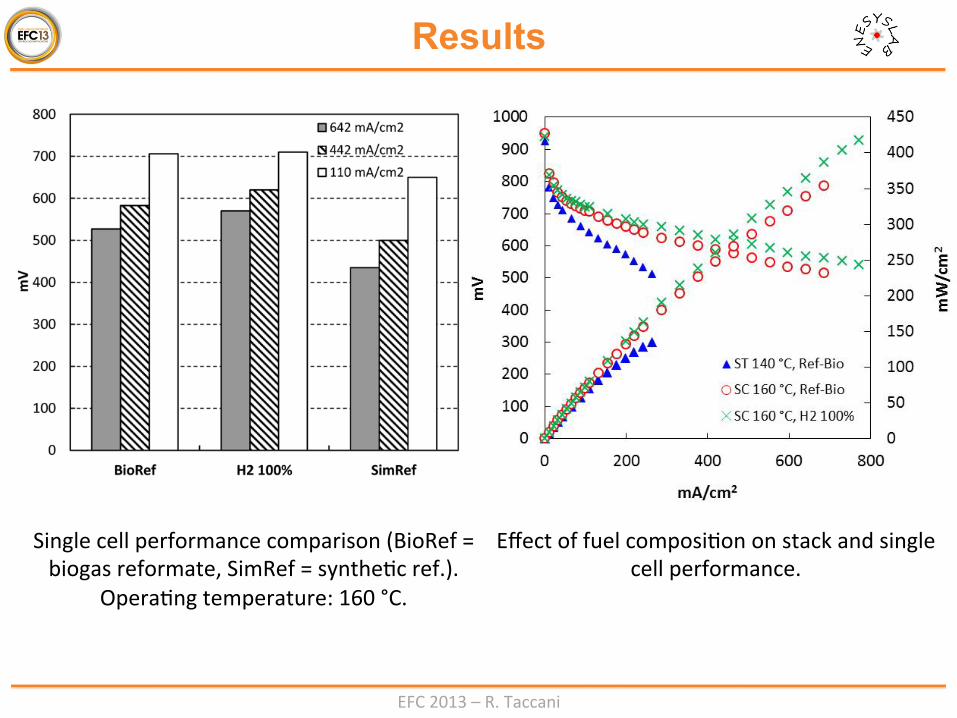
Single cell performance comparison (BioRef = biogas reformate, SimRef = syntheVc ref.).
OperaVng temperature: 160 °C.
Effect of fuel composiVon on stack and single cell performance.
EFC 2013 – R. Taccani
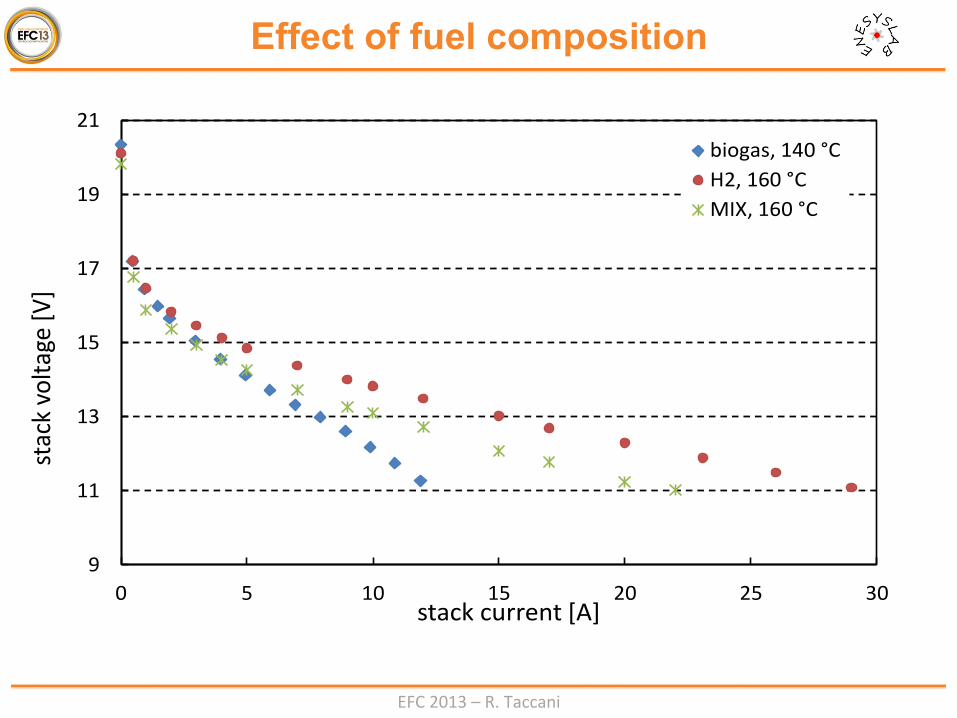
Effect of fuel composition
9
11
13
15
17
19
21
0 5 10 15 20 25 30
stack volta
ge [V
]
stack current [A]
biogas, 140 °CH2, 160 °CMIX, 160 °C

EFC 2013 – R. Taccani
Effect of load on cell voltage distribution
300
400
500
600
700
800
900
1000
1 2 3 4 5 6 7 8 9 10 11 12 13 14 15 16 17 18 19 20 21 22
mV
cell number
10 A
5 A
OCV
EFC 2013 – R. Taccani
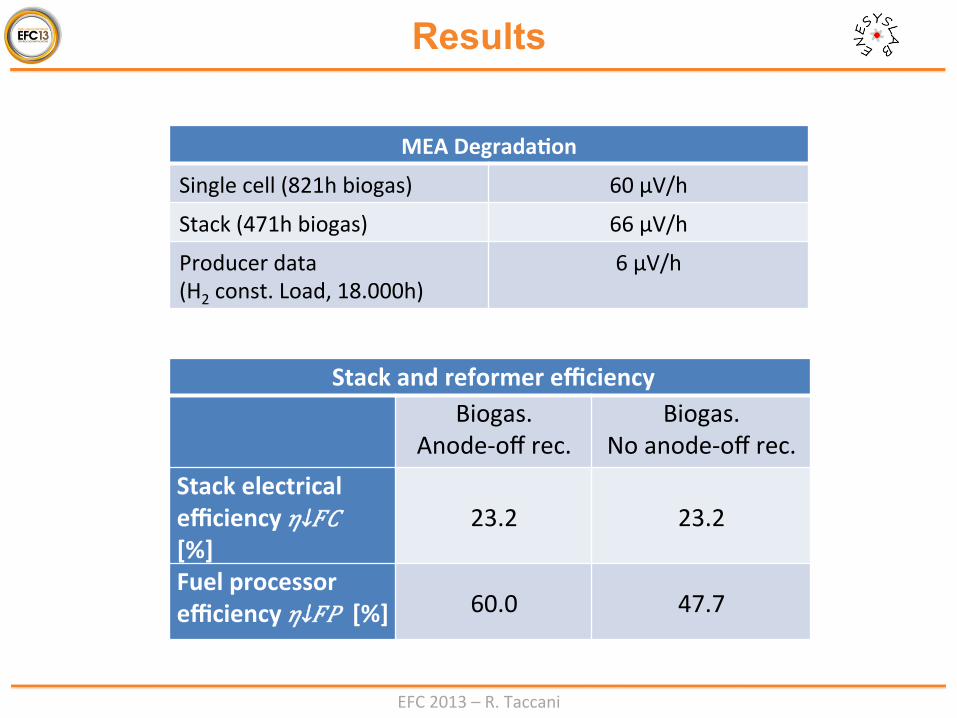
Stack and reformer efficiency Biogas.
Anode-‐off rec. Biogas.
No anode-‐off rec. Stack electrical efficiency 𝜂↓𝐹𝐶 [%]
23.2 23.2
Fuel processor efficiency 𝜂↓𝐹𝑃 [%] 60.0 47.7
Results
MEA DegradaTon
Single cell (821h biogas) 60 µV/h
Stack (471h biogas) 66 µV/h
Producer data (H2 const. Load, 18.000h)
6 µV/h

EFC 2013 – R. Taccani
• HTPEM FC have proven to be a viable opVon for biogas uVlizaVon even in small scale plants.
• The variaVon in the quality of the biogas is not affecVng the reformer and fuel cell operaVon
• H2S, using a biofilter, has not affected FC operaVon.
• The degradaVon, when using biogas, is higher than that measured with H2, but sVll low enough to allow thousands of hours of operaVon.
Conclusions

Thanks for your aVenTon!
ENESYSLAB Engineering and Architecture department University of Trieste, Via A. Valerio 10
34127 Trieste