rob pringle p.eng., senior project manager, mmm group ltd...
TRANSCRIPT
Getting simulation “over the hump” as an operational analysis tool
Rob Pringle P.Eng., Senior Project Manager, MMM Group Ltd.
Goran Nikolic P.Eng. Head, Traffic Planning, Ministry of Transportation, Ontario
Paper prepared for presentation at the Traffic Demand Modelling and Traffic Simulation Session
Of the 2015 Conference of the
Transportation Association of Canada
Charlottetown, PEI

Abstract
Traffic simulation has been around in various forms for several decades but penetration into the traffic planning and operational analysis mainstream is still relatively limited. Despite the analytical power that simulation provides, many traffic planning and engineering practitioners have not embraced this methodology. One reason for this lack of “penetration” is the perception of micro-simulation as a complex and resource-intensive tool relative to alternative methodologies. Another is a lack of clear guidance concerning the advantages provided by simulation and the situations where these advantages would usefully come into play. Yet another is the absence of a comprehensive manual or guidelines on how to go about planning, developing, and using a simulation model – software user manuals tell only part of the story. This paper is intended to explore and address, in an Ontario context, some of the above factors contributing to the perception of micro-simulation as a “niche” tool. Enhancements and guidance that would facilitate the use of traffic simulation, and current or planned initiatives to respond to these needs are discussed. The paper also provides some high-level and anecdotal guidance on several key aspects of the application of micro-simulation, providing some insights that are not typically addressed by software user manuals although it just scratches the surface on this topic. A key issue addressed in this paper concerns the communication of simulation results and the management of expectations regarding these results. It is hoped that this paper will assist practitioners (a) in identifying situations from their world where simulation would be advantageous as an analytical tool; (b) by providing some guidance in planning a simulation application; and (c) by preparing them for potential issues arising in the communication of simulation results. I would like to acknowledge the colleagues who have shared our journey into the world of traffic simulation and who have been the team that has persevered through the trials and errors of this journey: MMM Group Ltd.
Celine Jacob
Natalie Mendonca
Mark Bekkers
Cindy Costain Formerly with MMM Group Ltd.
Kevin Bragg (now with INRO)
Diego Mendoza (now known as DEMA simulations) Ministry of Transportation, Ontario
Jeanne-Marie Deletsu
Johnson Lau
Chris Pascos
Pramod Kumar (KC)
1) Introduction Traffic micro-simulation has been around in various forms for several decades but penetration into the traffic planning and operational analysis mainstream is still relatively limited. Despite the analytical power that micro-simulation provides, many traffic planning and engineering practitioners have not embraced this methodology. For the purposes of this paper, traffic micro-simulation is defined as those traffic analysis tools that simulate or model the movement of individual vehicles rather than aggregate traffic “flows” or platoons. This is a key feature that distinguishes simulation from the broad range of analytical and/or empirical traffic analysis tools that are currently in use. In fact, most so-called analytical tools incorporate empirically determined parameters and assumptions. In addition to traffic micro-simulation, there are macroscopic simulation tools which are oriented to strategic travel demand analysis and forecasting at an aggregate level. There is also a range of modelling tools with an intermediate level of detail, broadly classed as mesoscopic simulation tools. The latest innovation is a hybrid simulation tool, combining microscopic and mesoscopic simulation. This paper will focus on traffic micro-simulation although the comments may be applicable to mesoscopic and hybrid simulation as well. We are not advocating the use of micro-simulation for traffic analysis on a universal basis, although it is sufficiently adaptable to cover all or almost all of the bases. Instead, we will identify circumstances where the use of micro-simulation is particularly advantageous. The purpose of this paper is to analyze some of the perceived barriers to the application of traffic micro-simulation relative to some of the key benefits associated with its use. Along the way, we will provide some guidance on when the use of micro-simulation makes sense and on some of the challenges that may face the user, particularly with respect to the communication of micro-simulation results and the management of expectations concerning these results. What this paper will not do is evaluate, endorse, or comment on specific micro-simulation tools. We may be biased, having completed more than 70 projects using a variety of traffic simulation tools. At the same time, we have tackled some unique situations that would not have been amenable to successful analysis by any other tool - High-Occupancy/Toll and other managed lanes, incident management related to a major event, transit priority and traffic interactions associated with a median light-rail transit system, and pedestrian movements within a transit terminal. 2) Getting traffic micro-simulation over the hump – a case study involving the Ministry of
Transportation of Ontario An early winner… Up to the early 2000’s, traffic simulation was used on a limited basis by the Ministry. However, in 2003, the Ministry was planning a major rehabilitation of a section of the Highway 401 express lanes. It would have been possible to do this work during a long stretch of overnight partial closures but an alternative involving complete closure over several weekends promised significant cost savings. Before pursuing this alternative, Ministry staff needed to know what the traffic impacts would be. A micro-simulation analysis of the proposed closure and various traffic management measures developed to reduce the overall impact showed that it could be done with the resulting traffic conditions being generally similar to those during a typical weekday peak period. This analysis could not
have been undertaken effectively using other tools as a dynamic analysis was required which effectively represented both the temporal and geographic dynamics. The decision was made to go ahead with the closures and they were implemented successfully with the traffic impacts being manageable. Traffic data was collected along the way and was compared to the simulation results. It was found that with the exception of an anomaly likely resulting from driver confusion due to sign wording, the micro-simulation analysis had provided an estimate of traffic conditions that was remarkably similar to that actually experienced. Moving forward… During the following years, the Ministry made increasing use of traffic simulation. Complex situations were faced for which traffic simulation was the only reasonable tool. The Ministry is required to deal with a complex and congested highway system on a daily basis and “conventional” analytical and empirical tools could not provide comprehensive and realistic results. Decision-makers at the Ministry became used to the quality of the information that could be provided by micro-simulation. Today… Many significant Ministry assignments, involving the environmental assessment, preliminary design, and detailed design of major highway projects now require the use of traffic micro-simulation. Furthermore, the Ministry has been able to tackle complex situations, such as the evaluation of High-Occupancy Vehicle and High-Occupancy Vehicle/Toll lanes, and the development of incident management plans for major events. New information has come to light concerning the operational analysis of roundabouts and highway work-zones. The Ministry has also embarked on the development of an extensive traffic simulation model covering the Greater Toronto Area that could serve as a consistent evaluation framework to address the Ministry’s analytical requirements more effectively and efficiently than independent (and repetitive) analysis for individual assignments. 3) When does the use of traffic micro-simulation make sense? Before looking at why traffic simulation is not more universally “over the hump” and thinking about ways to push it in that direction, it is worthwhile examining the rationale for doing so. Traffic engineering is inherently a complex subject. We often quip that traffic engineering is really only 50 per cent engineering with the other 50 per cent being behavioural psychology. Drivers are humans and exhibit a range of perceptual capabilities and decision-making characteristics. In fact, it is this variability that underpins many traffic phenomena. For example, “stop-and-go” or “shock-wave” conditions on a highway, if not related to an “incident”, are often directly attributable to variability in the level of driver aggression vs. cooperation and the effect this has on their reaction time, tendency to change lanes, and other behaviours. Limiting the analysis of traffic conditions to average, static conditions may be convenient and comfortable, but only scratches the surface of this complex phenomenon. At the end of the day, it is really a case of relating the choice of a tool for traffic engineering analysis and the level of effort required by that tool to the criticality of the situation – the importance of obtaining a result that is as reliable as possible and the consequences and level of risk associated with a potentially unreliable result that has not fully captured the dynamics of the situation. The following situations demonstrate the particular strengths of traffic micro-simulation:
a) When the situation being analyzed does not fit into the capabilities of the alternative analytical and empirical tools. Micro-simulation can be tailored to accommodate many different situations that would be beyond the capabilities of the available analytical and
empirical tools. Some simple examples might best portray this capability. Analyzing a two-way, single-lane work-zone using the methods of Book 7 of the Ontario Traffic Manual is limited to a certain range of traffic volumes and work-zone lengths. Evaluation of highway weaving using the Highway Capacity Manual or other comparable methods is limited to specific weaving configurations and weaving zone lengths and does not account for the complications introduced by overlapping on and off-ramps. Interactions between modes, involving transit priority or pedestrian movement, can only be superficially evaluated without traffic simulation. In the extreme, consider a 5-legged roundabout with several signalized approaches, a variety of auxiliary lanes, high pedestrian and heavy vehicle demand and a nearby signalized intersection….
Most situations encountered by traffic planners and engineers can be analyzed using the stock capabilities of commercially available micro-simulation packages. The few remaining situations can typically be covered off using the Application Programming Interfaces (APIs) that accompany many packages, or, in extreme cases, through purpose-built modifications programmed by the software developers.
b) When the time dynamic is important, particularly with respect to congested systems. Once
the capacity of a facility or network is approached or exceeded, the time dynamic asserts itself. Queues accumulate and dissipate over time and may last from one time period to the next. There have been attempts to capture the time dynamic in the context of analytical or empirical models but these have typically been cumbersome and limited in their capabilities. Micro-simulation readily captures traffic dynamics over time. For example, consider an analysis of traffic associated with a major event. Static analysis would not capture the spill-over of queues from one location to another or from one time interval to the next. Static analysis would not capture the evolution of the congestion over time, the cumulative impact, and the period required for system recovery.
c) When it is important that interacting elements be accounted for, along with the synergy of
their effects. Micro-simulation can readily capture the “net” effect of multiple, interacting traffic features. In a highway context, this might include merging, diverging, and weaving movements that overlap, whereas in a surface street context, this might include the interaction between closely-spaced and congested intersections. Not only can micro-simulation capture the physical proximity and overlapping impacts of multiple features, it can also represent interactions in the context of traffic demand. For example, the net impacts of traffic making a left-turn movement at one intersection and a right–turn at another intersection closely downstream could be captured.
d) When the analyst wants or needs greater understanding of the factors underlying the results
they are obtaining from traffic analysis. One of the most significant benefits of micro-simulation is the ability to actually watch the simulation unfold. This allows the analyst to confirm that the model is behaving in a representative fashion – after all, most analysts spend a considerable amount of time driving and observing other drivers in real life. At the same time, watching the simulation allows the analyst to identify and observe factors contributing to the performance outputs obtained, factors that might not be obvious from the outputs of an analytical or empirical analysis.
Extending this theme, the ability to watch the simulation brings a certain element of transparency to the process. While the algorithms behind simulation, as well as the assumptions and relationships inherent in analytical or empirical methods, have to be considered “black boxes” in many cases, traffic simulation at least allows the analyst to visually verify that the model is behaving in a realistic fashion and to identify any aspects of the model requiring further attention. The ability to watch the simulation also opens up a new avenue for calibration – the analyst can conduct traffic surveys on screen to parallel the surveys used in the real world to collect calibration data. For example, a saturation flow survey can be (and has been) conducted on-screen using the same methodology and data collection forms used for the equivalent real-world survey, ensuring that apples are being compared to apples.
e) When visualization would be beneficial. It is not a stretch to maintain that high-level and non-
technical audiences can obtain a better “feel” for the results of a traffic engineering analysis if presented as an animated video rather than (or to supplement) text, tables and graphs. The animation can more readily be compared with their perceptions and experiences as a driver.
Although traffic micro-simulation is not being proposed here as a panacea, it has a number of notable strengths that commend it as a traffic engineering analysis tool. While it can be considered as a more-or-less “universal” traffic analysis tool, this does not mean it can be held up as an essential tool for all situations. 4) What makes up the “hump” – some perceived barriers to the use of micro-simulation Although not claimed to be definitive, the following discussion suggests some barriers that may be perceived with respect to the application of traffic simulation. These are all challenges that the authors have faced over more than a decade and more than seventy projects using traffic micro-simulation. We will attempt to shed some light on these “barriers” and question whether they are, in reality, barriers or challenges.
a) Complexity and resource-intensiveness. As with many things in life, the quality and reliability of the outcomes of a traffic analysis are proportional to the level of effort applied - also known colloquially as GIGO – Garbage In, Garbage Out or “there is no such thing as a free lunch”. This is true whether the analyst is using a micro-simulation tool or an analytical/empirical tool. It is true that we are usually coerced by micro-simulation to face the fact that there are many variables and assumptions inherent in traffic analysis – other methods may hide these under the rug to a lesser or greater extent. It is a fact that both micro-simulation and analytical/empirical tools incorporate a large number of “default” values for parameters, whether or not these are explicitly identified as such and whether or not the tool provides an opportunity to change their values. The fact that these are typically exposed in micro-simulation, resulting in a plethora of data input boxes, screens, or files, gives an appearance of complexity and being consumptive of time. On the other side of the coin, once a simulation model has been developed and validated, it can be applied to a large number of scenarios.
Typically speaking, a micro-simulation analysis will demand more in the way of data and attention to detail but that is often a consequence of the fact that the analyst, in choosing to use micro-simulation, has made a commitment to trying to make sure that the analysis
considers all the relevant factors and provides the required answers and a high level of understanding of the situation. Micro-simulation may be unforgiving in certain situations. For example, analysis of a network of signalized intersections using traffic count data that is inconsistent between intersections (and has not been rationalized) may be approached (and completed) in a rather blithe fashion using some methods but may come to a crashing halt if micro-simulation is used. Is this a barrier? – or a challenge?
b) Data inputs. The increasing availability of extensive and (generally) up-to-date aerial
photography, Geographic Information Systems databases, automated and crowd-sourced data collection and various sources of “big” data means that there is a reasonable chance that the information required for effective micro-simulation is available in a useful format, even in locations outside the major urban centres. The lack of data is becoming less valid as a barrier to the use of micro-simulation.
The choice to use real, locale-appropriate data vs. default assumptions and parameters is one that is always there, regardless of the tool being used. It just so happens, as mentioned above, that micro-simulation may not let you totally abdicate the responsibility of making that choice. It may be a challenge but is that a barrier?
c) Calibration and validation of micro-simulation models. The words calibration and validation, as
applied to micro-simulation, have assumed a mystical aura all of their own. Calibration is, in simple terms, the process of adjusting a model so that it realistically (to the extent required and possible) represents actual field conditions for the situation you are modelling. Validation is simply the measurement of how well the model does that. Some will go to great lengths to emphasize the separation of calibration and validation - in some quarters (not necessarily practical traffic engineering), the database of real observations used to validate the model should not be the same database as that used to calibrate the model. For practical traffic engineering, we can be forgiven for letting go of that distinction and staying simply with one being the process and the other being the measurement of the result. Calibration (and validation) may be conveniently considered as two primary streams of effort, calibration of the travel demand inputs, and calibration of driver behaviour, although these streams may intersect or run together.
The simple fact is that all tools, whether they are simulation models or analytical/empirical tools, should be calibrated to reflect real life for the situation being analyzed. The reality is that many tools were calibrated and validated in one time and place, giving the built-in default parameters and assumptions, and may be used in another time and place without reviewing and potentially changing these – the issue of transferability. Parameters may be hard-coded and hidden from view in some tools, not permitting adjustment. If we all take a long look in the mirror, we have to acknowledge that calibration of the parameters that can be changed in these models is not universal practice although calibration of some key parameters, such as saturation flow, lost time, and peak hour factor is not uncommon in the analysis of signalized intersections. In the case of traffic simulation tools, many more parameters can typically be calibrated and these are typically “in your face”, exerting some pressure on the analyst to review the default values. At the end of the day, with respect to any analysis tool, the extent and quality of calibration may depend largely on information availability, agency policy, resource constraints, the level of commitment of the analyst, and, as discussed further below, the availability of adequately documented calibration procedures.

Traffic micro-simulation tools do possess one powerful, although subjective, calibration facility. Simply watching the simulation animation with a critical eye can provide clues as to whether or not the model is operating realistically in the context of the analyst’s real-world experience and observations as a transportation system user.
Thinking of calibration and validation as a requirement (and possibly barrier) specific to the use of traffic micro-simulation is not really a valid position – transferability is a consideration regardless of the tool employed.
d) A lack of effective technical guidance on how to develop, calibrate, validate, and apply traffic
micro-simulation tools. We once joked with the representative of a major simulation software supplier that their user’s manual provided more information on how to include fog and snow in video animations than it provided guidance on model calibration and validation. While software documentation and training programs usually provide enough information to set up a traffic simulation model, they don’t, unfortunately, provide as much guidance on model calibration, validation, and application. In our opinion, this is perhaps one case where an actual barrier exists.
Part of the issue here is that there is currently no common ground on the parameters that would best measure the level of validation of a model. Various measures have been proposed but these have also been questioned along the way without a consensus being reached that can serve as a useful guide for practitioners. Some agencies have attempted to develop their own protocols to fill this void but there is no “simulation” equivalent to the Highway Capacity Manual or Highway Safety Manual. The other, and larger, part of the issue is that there is no “how to” manual on just how to go about calibrating both the travel demand inputs and the driver behaviour components of a simulation model. Calibration, consistent with real-life tripmaking decisions and actual driving behaviour, represents a combination of quite complex issues where the difficulty associated with the whole is definitely greater than that associated with the individual parts. Not only is it necessary to understand how individual parameters affect traffic flow and performance within the model, it is also necessary to how these interact in combination and how they might be affected by the sequence of their application. This is not to say that traffic simulation is worlds’ apart from analytical and empirical tools. All tools used for traffic analysis require background knowledge on how to calibrate them, how to apply them, under what conditions they are applicable, and how to interpret the results. However, it is typically easier for an analyst with limited background knowledge to apply an analytical or empirical tool and obtain outputs, although these results may or may not be reliable. It is more difficult to obtain meaningful, if not necessarily reliable, results from a traffic simulation tool applied to the same problem with the same lack of background knowledge. It was mentioned previously that the issue of transferability and the need for calibration to local conditions is applicable to all traffic analysis tools. Although not always recognized, traffic simulation has the advantage that many of the parameters that have to be reviewed are oriented to sub-problems that are relatively simple to comprehend on an individual basis. An example is the car-following model that is central to traffic micro-simulation. The key parameters in such models, reflecting reaction time, desired vehicle separation distance, etc. are not that difficult to grasp. It is when one tried to think at the broader level, incorporating
the interactions between the individual models of driver behaviour, that comprehension and understanding is more difficult. In the case of many analytical and empirical models, the underlying relationships algorithms may have been combined, and may be hidden to the user, so that it is only the high-level cause and effect that is represented and visible. One characteristic that sets simulation apart from empirical and deterministic (analytical) tools is stochasticity, the fact that applying a simulation model to the same situation five times may yield five different results due to the representation of many parameters by distributions rather than unique parameters. Human behaviour is also better represented by distributions than by fixed and unique parameter values. However, simulation is a tool used in many non-transportation situations and guidelines on how to deal with stochasticity, including how the number and combination of model replications are related to the reliability of the results, are available from many non-transportation-related sources. The guidance and training gap has been recognized. For example the European MULTITUDE project has identified the issues but they do not have the resources to fill the gap. Various research projects have been undertaken but these appear to be fairly limited in scope and the resulting reports and papers do not constitute a comprehensive set of guidelines for practitioners. The Ministry of Transportation of Ontario is also proceeding with the development of guiding documents related to its scope of operations. At the 2015 Annual Meeting of the Transportation Research Board, a session was held to discuss a proposed effort to develop a simulation “manual”. It is unclear how long it will be before comprehensive guidance and training is available to ensure that users of traffic simulation models can apply them knowledgeably and be reasonable assured of reliable results. We freely acknowledge that the guidance and training gap can be viewed in this context as a “barrier” and not just a challenge. It is possible to reliably apply traffic simulation problems but, in the absence of suitable guidance and training, this does require a certain amount of background knowledge in traffic flow and a certain amount of experience with the simulation tool of choice. Trial-and-error may be perceived as a substitute for guidance but guided and informed trial-and-error has to be a more effective and efficient route.
e) Interpreting and communicating micro-simulation results and managing expectations with
respect to these results. Generally speaking, traffic simulation models can generate a wide range of performance measures, some as stock outputs and others with the addition of appropriate traffic detection provisions and related post-processing. The available simulation packages vary in the amount of effort required to generate a full range of useful outputs. It is relatively easy to fall into the trap of overwhelming an audience or “blinding them with science” given the many possible outputs, if one is not selective concerning the outputs presented and their relationship to the underlying story line.
One consideration is that the stock outputs produced by traffic simulation models tend to vary in how closely these correspond to the performance measures commonly obtained from more traditional analytical/empirical tools, particularly measures reflecting level of service. Additional effort up-front and additional post-processing may be required to produce performance measures that most analysts and their audiences are familiar with. This is generally not a barrier but a challenge of varying degree, depending on the simulation software being used. At the same time, highly informative and interpretable outputs can be generated from micro-
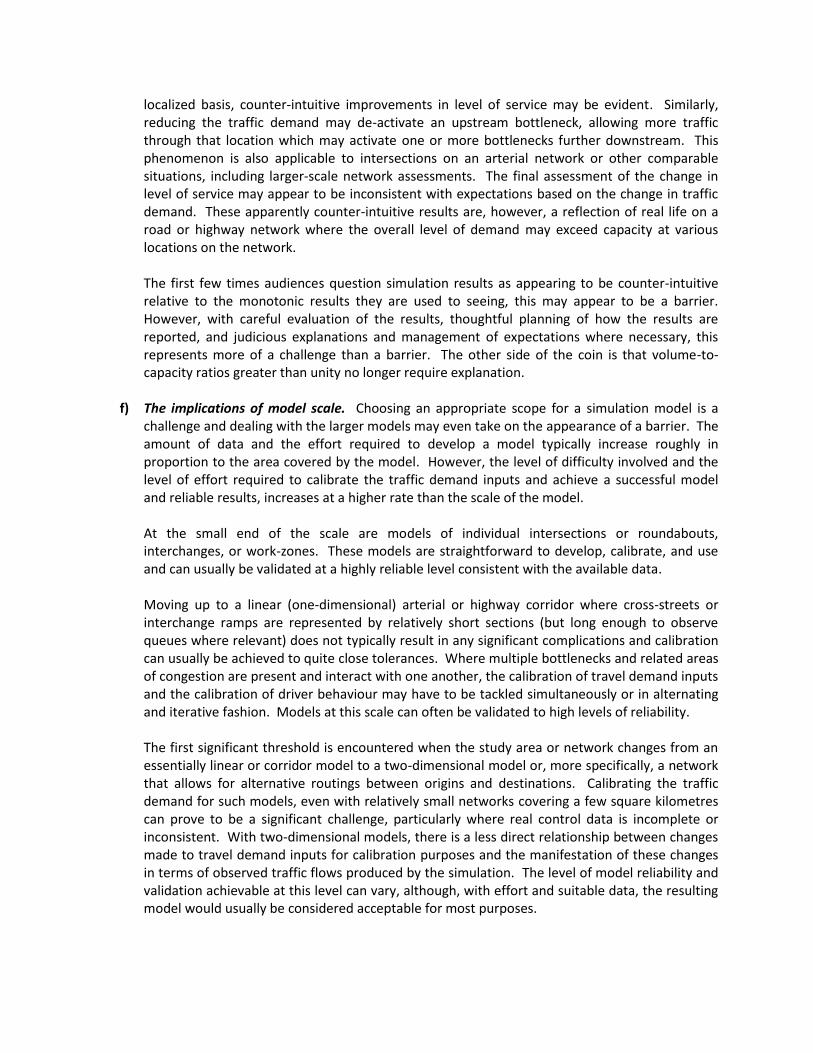
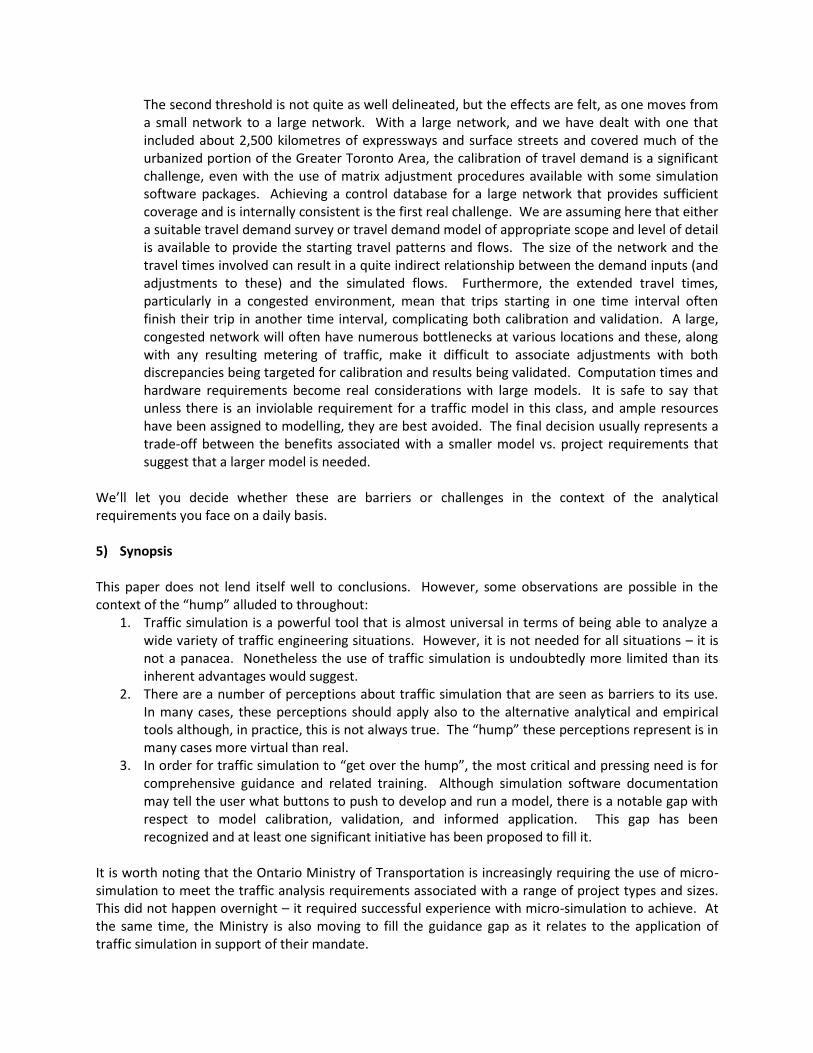
simulation. For example, Figure 1 shows a speed contour plot for a highway that demonstrates quite clearly how traffic speeds and queues vary by location and time. If a single time interval is selected, the speed contour plot can be expanded to show speeds lane-by-lane over that interval as shown by Figure 2. Figure 3 takes the lane-by-lane speed plot one step further to show speed differentials for safety evaluation. Figure 4 shows the results of a future safety evaluation combining traffic micro-simulation with the FHA’s Surrogate Safety Assessment Model (SSAM). Figure 5 shows how snapshots taken from a video animation can be used to illustrate key issues.
A more significant challenge arises from what these performance measures show and how they are interpreted and communicated. In the case of most, maybe all, non-simulation methods, the results are typically monotonic and, as a result, intuitive. For example, if you increase the traffic demand, the level of service, whether represented by delay, average speed, travel time, or density, typically becomes worse. When traffic demand is taken from a typical travel demand model, or a manual process of generating, distributing, and assigning traffic, and input to a non-simulation analysis or tool for the evaluation of level of service, it is generally unconstrained relative to capacity at all locations analyzed and the level of service obtained will improve or worsen in concert with decreases or increases in overall demand. However, in the case of traffic simulation, demand in excess of capacity will not be processed – the throughput will reflect the capacity constraint and the excess will form a queue, either real or virtual, the latter in the case of traffic attempting to enter the network at the boundary of the model. This nominally represents an advantage for traffic simulation in terms of interpreting the results. Obtaining a volume-to-capacity ratio greater than one is simply not possible using simulation provided the capacity is properly represented. How many results from non-simulation analyses have raised an eyebrow due to a volume-to-capacity ratio in excess of unity? Of course, most of us have become used to that apparent anomaly and don’t think twice about it unless it is a result from an analysis of existing conditions. At the same time, simulation results can be non-monotonic and may therefore seem counter-intuitive until one digs deeper into the reason for these results. For example, consider a highway corridor where the base traffic demand is such that it exceeds, for various periods of time, the capacity at various bottlenecks along the corridor such as those that may occur at on-ramps. There will be variations in traffic speed along such a corridor reflecting the presence of queuing, either stationary or dynamic (shock-waves). If we increase the demand, this might be enough to exceed the capacity of such a bottleneck near the upstream end of the corridor where the base traffic demand was previously within the capacity at this location. Obviously, and intuitively, a queue will form upstream of this bottleneck, leading to decreased traffic speeds, increased traffic density, and a worsened level of service. Once a queue forms and vehicles have to come to a stop, the capacity of the highway at that location will be reduced relative to the case where traffic keeps moving as evidenced by that fuzzy and still not fully understood area at the bottom of the typical speed-flow curve beyond the capacity point. This drop in capacity will meter the traffic able to pass through the section, leading to reduced traffic demand downstream. As a result, capacity constraints formerly acting as bottlenecks further downstream may be de-activated, leading to increased speeds, reduced densities, and improved level-of-service. If aggregate performance for the entire corridor is reported, the expected overall reduction in level of service resulting from the increase in traffic demand may be seen. However, if performance is considered for corridor sub-sections or on a
localized basis, counter-intuitive improvements in level of service may be evident. Similarly, reducing the traffic demand may de-activate an upstream bottleneck, allowing more traffic through that location which may activate one or more bottlenecks further downstream. This phenomenon is also applicable to intersections on an arterial network or other comparable situations, including larger-scale network assessments. The final assessment of the change in level of service may appear to be inconsistent with expectations based on the change in traffic demand. These apparently counter-intuitive results are, however, a reflection of real life on a road or highway network where the overall level of demand may exceed capacity at various locations on the network. The first few times audiences question simulation results as appearing to be counter-intuitive relative to the monotonic results they are used to seeing, this may appear to be a barrier. However, with careful evaluation of the results, thoughtful planning of how the results are reported, and judicious explanations and management of expectations where necessary, this represents more of a challenge than a barrier. The other side of the coin is that volume-to-capacity ratios greater than unity no longer require explanation.
f) The implications of model scale. Choosing an appropriate scope for a simulation model is a
challenge and dealing with the larger models may even take on the appearance of a barrier. The amount of data and the effort required to develop a model typically increase roughly in proportion to the area covered by the model. However, the level of difficulty involved and the level of effort required to calibrate the traffic demand inputs and achieve a successful model and reliable results, increases at a higher rate than the scale of the model.
At the small end of the scale are models of individual intersections or roundabouts, interchanges, or work-zones. These models are straightforward to develop, calibrate, and use and can usually be validated at a highly reliable level consistent with the available data. Moving up to a linear (one-dimensional) arterial or highway corridor where cross-streets or interchange ramps are represented by relatively short sections (but long enough to observe queues where relevant) does not typically result in any significant complications and calibration can usually be achieved to quite close tolerances. Where multiple bottlenecks and related areas of congestion are present and interact with one another, the calibration of travel demand inputs and the calibration of driver behaviour may have to be tackled simultaneously or in alternating and iterative fashion. Models at this scale can often be validated to high levels of reliability.
The first significant threshold is encountered when the study area or network changes from an essentially linear or corridor model to a two-dimensional model or, more specifically, a network that allows for alternative routings between origins and destinations. Calibrating the traffic demand for such models, even with relatively small networks covering a few square kilometres can prove to be a significant challenge, particularly where real control data is incomplete or inconsistent. With two-dimensional models, there is a less direct relationship between changes made to travel demand inputs for calibration purposes and the manifestation of these changes in terms of observed traffic flows produced by the simulation. The level of model reliability and validation achievable at this level can vary, although, with effort and suitable data, the resulting model would usually be considered acceptable for most purposes.
The second threshold is not quite as well delineated, but the effects are felt, as one moves from a small network to a large network. With a large network, and we have dealt with one that included about 2,500 kilometres of expressways and surface streets and covered much of the urbanized portion of the Greater Toronto Area, the calibration of travel demand is a significant challenge, even with the use of matrix adjustment procedures available with some simulation software packages. Achieving a control database for a large network that provides sufficient coverage and is internally consistent is the first real challenge. We are assuming here that either a suitable travel demand survey or travel demand model of appropriate scope and level of detail is available to provide the starting travel patterns and flows. The size of the network and the travel times involved can result in a quite indirect relationship between the demand inputs (and adjustments to these) and the simulated flows. Furthermore, the extended travel times, particularly in a congested environment, mean that trips starting in one time interval often finish their trip in another time interval, complicating both calibration and validation. A large, congested network will often have numerous bottlenecks at various locations and these, along with any resulting metering of traffic, make it difficult to associate adjustments with both discrepancies being targeted for calibration and results being validated. Computation times and hardware requirements become real considerations with large models. It is safe to say that unless there is an inviolable requirement for a traffic model in this class, and ample resources have been assigned to modelling, they are best avoided. The final decision usually represents a trade-off between the benefits associated with a smaller model vs. project requirements that suggest that a larger model is needed.
We’ll let you decide whether these are barriers or challenges in the context of the analytical requirements you face on a daily basis. 5) Synopsis This paper does not lend itself well to conclusions. However, some observations are possible in the context of the “hump” alluded to throughout:
1. Traffic simulation is a powerful tool that is almost universal in terms of being able to analyze a wide variety of traffic engineering situations. However, it is not needed for all situations – it is not a panacea. Nonetheless the use of traffic simulation is undoubtedly more limited than its inherent advantages would suggest.
2. There are a number of perceptions about traffic simulation that are seen as barriers to its use. In many cases, these perceptions should apply also to the alternative analytical and empirical tools although, in practice, this is not always true. The “hump” these perceptions represent is in many cases more virtual than real.
3. In order for traffic simulation to “get over the hump”, the most critical and pressing need is for comprehensive guidance and related training. Although simulation software documentation may tell the user what buttons to push to develop and run a model, there is a notable gap with respect to model calibration, validation, and informed application. This gap has been recognized and at least one significant initiative has been proposed to fill it.
It is worth noting that the Ontario Ministry of Transportation is increasingly requiring the use of micro-simulation to meet the traffic analysis requirements associated with a range of project types and sizes. This did not happen overnight – it required successful experience with micro-simulation to achieve. At the same time, the Ministry is also moving to fill the guidance gap as it relates to the application of traffic simulation in support of their mandate.

Figures
Figure 1: A speed contour plot (produced by micro-simulation) showing the geographic and temporal extent of congestion and queuing
Figure 2: A lane-by-lane speed plot (produced by micro-simulation) providing more detail with respect to the sources of congestion
Figure 3: A lane-by-lane speed plot (produced by micro-simulation) with speed differentials added for safety evaluation
Figure 4: A plot of safety-related conflicts (produced by micro-simulation in conjunction with SSAM, the Surrogate Safety Assessment Model) for evaluation of safety related to future conditions Figure 5: Use of a micro-simulation screen capture to illustrate traffic phenomena